Norris, DC
Retrospective analysis of a fatal dose-finding trial
Abstract
The commonplace description of phase 1 clinical trials in oncology as “primarily concerned with safety” is belied by their near universal adoption of dose-escalation practices which are inherently unsafe. In contrast with dose titration, cohort-wise dose escalation regards patients as exchangeable, an indefensible assumption in the face of widely appreciated inter-individual heterogeneity in pharmacokinetics and pharmacodynamics (PKPD). I have previously advanced this argument in terms of a precautionary coherence principle that brings the well-known coherence notion of Cheung (2005) into contact with modern imperatives of patient-centeredness and precision dosing. Here, however, I explore these matters in some mechanistic detail by analyzing a trial of the bispecific T cell engager AFM11, in which a fatal toxicity occurred. To this end, I develop a Bayesian dose-response model for a single ordinal toxicity. By constructing this model’s priors to align with the AFM11 trial as designed and conducted, I demonstrate the incompatibility of that design with any reasonable expectation of safety. Indeed, the model readily yields prospective estimates of toxic response probabilities that suggest the fatality in this trial could have been foreseen as likely.
keywords:
dose-finding studies | dose individualization | oncology | trial safety | precision medicineWORKING PAPER DRAFT compiled . \doifooterhttps://cran.r-project.org/package=DTAT \pinpfootercontentsAnalysis of a fatal dose-finding trial
-2pt
Introduction
In October 2018, German biopharmaceutical firm Affimed N.V. announced a clinical hold on two phase 1 trials of its bispecific T cell engager, AFM11, after 1 fatal and 2 life-threatening neurological toxicities occurred in the highest-dose cohorts of these trials (Affimed, 2018). Six months later, Affimed announced the termination of AFM11 development (Affimed, 2019).
The occurrence of such toxicities in a dose-escalation trial exemplifies the precautionary coherence (PC) principle (Norris, 2017b, 2019, 2020). The PC principle is itself a straightforward consequence of inter-individual heterogeneity in pharmacokinetics and pharmacodynamics (PKPD). Interestingly, Affimed seems to have undertaken the clinical development of AFM11 with at least some appreciation for the likelihood of such heterogeneity, and for the consequent relevance of dose titration. A December 2015 press release (Affimed, 2015) states AFM11 “is tunable by dosing adjustment when required.” And indeed an acknowledgement of PKPD heterogeneity seems to have informed both AFM11 trials. The first trial, NCT02106091, was formally titled, “A Pharmacodynamically-guided, Dose-escalation, Phase I Study.” The second trial, NCT02848911 employed step-up dosing within each dose cohort—an accomodation that virtually acknowledges the PC principle.
AFM11 toxic dose-response
The former trial, in CD-19 positive B-cell non-Hodgkin lymphoma (NHL), has to my knowledge not been reported at a scientific meeting or in the literature. But the latter trial, in adults with precursor B-cell acute lymphoblastic leukemia (B-ALL), was presented at the ASH 2018 Annual Meeting (Salogub et al., 2018) in sufficient detail to reveal its design, dose levels, and the toxic responses for the 17 patients enrolled.
| Patient | Non-toxic dose (ng/kg/week) | Highest dose (ng/kg/week) | CTCAE Grade at highest dose |
| Cohort 1 | |||
| 1 | 0.7 | 2 | 2 |
| 2 | 2 | 2 | 0 |
| Cohort 2 | |||
| 3 | 6 | 6 | 0 |
| Cohort 3 | |||
| 4 | 7 | 20 | 2 |
| 5 | 20 | 20 | 0 |
| 6 | 20 | 20 | 0 |
| Cohort 4 | |||
| 7 | 60 | 60 | 0 |
| 8 | 20 | 60 | 1 |
| 9 | 60 | 60 | 0 |
| Cohort 5 | |||
| 10 | 180 | 180 | 0 |
| 11 | 180 | 180 | 0 |
| 12 | 60 | 180 | 3 |
| 13 | 180 | 180 | 0 |
| 14 | 180 | 180 | 0 |
| Cohort 6 | |||
| 15 | 400 | 400 | 0 |
| 16 | 60 | 130 | 3 |
| 17 | 0 | 130 | 5 |
These doses and toxicities are abstracted in Table 1. The first 2 cohorts were abbreviated by an initial accelerated titration (Simon et al., 1997) that preceded the 3 + 3 stage of the study. The step-up dosing employed in this trial, under which each cohort’s first week of treatment was administered at 1/3 of the cohort’s target dose, resulted in observation of some patients (1, 4, 8 and 12) both at a low dose that caused no toxicity, and at a higher dose that produced a toxicity of CTCAE Grade 1 or higher. Patients 16 and 17 experienced toxicities during the first week of treatment, so these register at the Cohort 6 starting dose of 130 ng/kg weekly. Patient 16 recovered with a dosing interruption, and “restarted on Cohort 5 dose” (Salogub et al., 2018), which I have taken to mean the Cohort 5 starting dose of 60 ng/kg weekly, rather than the full target dose of 180 ng/kg.111This target dose would have exceeded by 38% the 130 ng/kg weekly that had caused this patient a Grade 3 toxicity after 3 days of treatment. It seems implausible that titration so far above a patient’s previously toxic dose would have been attempted without Salogub et al. (2018) remarking on it. Patient 17 died within the first week of treatment, and so never received a nonzero dose that was demonstrably non-toxic. The non-toxic dose for this patient is therefore coded as 0. The majority (11/17) of study participants experienced no toxicity; consequently, their tabulated non-toxic and highest doses coincide.
Modeling dose-response heterogeneity for an ordinal toxicity
To represent the inter-individual heterogeneity of toxic dose-response, we suppose that CTCAE toxicity grade in any given patient is a monotone, left-continuous step function of dose , with the steps occurring at doses :
| (1) |
Thus, for example, corresponds to the highest dose that patient could tolerate without experiencing a grade-3 toxicity. The transition from CTCAE grades 2 to 3 is customarily identified with ‘intolerability’, such that grade toxicities are (with certain exceptions that won’t concern us here) regarded as ‘dose-limiting’ (DLTs). Thus when we may drop the superscript 3 to write ‘’ in place of , and refer to this simply as ’s MTD.
We suppose that is log-normally distributed in the population:
| (2) |
where the traditional Bayesian parametrization in terms of precision has been employed.
To promote safer phase 1 trials, our models must support extrapolation from the more commonly observed toxicity grades to the severe and fatal toxicities () of greatest concern for participant safety. In the present context, we will enable this by assuming that our toxicity grading system is somehow aligned with the underlying pharmacology in a scale-free manner, so that is a geometric sequence with ratio :
| (3) | ||||
| (4) |
While I feel obliged to subscript a quantity such as to acknowledge formally its likely inter-individual heterogeneity, application of this model to the small sample sizes characteristic of phase 1 trials (and certainly to the 17-patient trial analyzed here) requires imposing an identifying restriction . (Had AFM11’s chief toxicity not been uniformly neurological in nature (Smith, 2018), the hope of extrapolating from low to high toxicity grades via Eqs. (3–4) would be much more dubious.)
Priors for this model are specified as follows, inferred where possible from Affimed’s design of the trial:
| (5) | ||||
| (6) | ||||
| (7) |
The vague uniform prior on spans an order of magnitude (2.3 natural logs) either side of a median at ng/kg weekly, the Cohort 5 target dose. The prior over is obtained indirectly from a prior placed on the more intuitively accessible coefficient of variation (CV) of . The corresponds to , which places in the 3 s.d. upper tail of the prior. Both the economics (Norris, 2017a, 2018) and safety (Norris, 2017b) of dose-escalation trials become obviously indefensible for . Thus, Affimed’s choice of a dose-escalation trial suggests it accorded a high prior probability. The vague uniform prior on extends to the lowest conceivable limit , and is centered on in accordance with this trial’s threefold separation of dose levels (2, 6, 20, 60, 180, 400) and with the threefold jump chosen for step-up dosing.
Model implementation
The model is implemented in JAGS (Plummer, 2003) version 4.3.0, as below.222By contrast with the overloaded I(,) construct familiar to users of BUGS, the dinterval distribution in JAGS is an ‘observable function’ that specifically implements interval censoring. See sections 7.2 and 9.2.4 of the JAGS Version 4.3.0 User Manual (28 June 2017).
var N; # number of patients
var okdose[N]; # a tox-free dose for each pt
var aedose[N]; # a toxic dose for each pt

var mtd[N];  # MTDi’s on absolute dose scale
var mu, tau; # MTDi ~ dlnorm(mu, tau)
var cv;   # tau <- 1/log(cv^2+1)
var Y[N]; # Toxicity grade for patient i=1,..,N
var Z[N]; # Dummy array of zeros for no-tox obs

data {
  for (i in 1:N) {
    Z[i] <- 0;
  }
}

model {
  mu ~ dunif(2.9, 7.5);
  cv ~ dnorm(0.5, 36); # sigma=1/6 => 1=mean+3sd
  tau <- 1/log(cv^2+1);
  r0 ~ dunif(1, 5);
  for (i in 1:N) {
    mtd[i] ~ dlnorm(mu, tau);
  }
  for (i in 1:N) {
    r[i] ~ dlnorm(log(r0), 50); # so CV(r[i]) ~ 14%
    Y[i] ~ dinterval(aedose[i]/mtd[i],
              c(r[i]^-2, 1/r[i], 1, r[i], r[i]^2));
    Z[i] ~ dinterval(okdose[i]/mtd[i], r[i]^-2);
  }
}
R package runjags (Denwood, 2016) version 2.0.4-6 was used to run JAGS with 4 chains, each sampled 2500 times with a thinning interval of 10, following adaptation over 1000 iterations and burn-in of 4000.
Model estimates
Table 2 summarizes the model fit, showing potential scale reduction factors near unity and large effective sample sizes for all parameters, indicative of adequate convergence and precision.
| Lower95 | Median | Upper95 | Mean | SSeff | psrf | |
| Hyperparameters | ||||||
| mu | 4.483 | 5.033 | 5.588 | 5.037 | 6227 | 1.001 |
| cv | 0.869 | 1.069 | 1.292 | 1.072 | 8515 | 1.001 |
| tau | 0.980 | 1.312 | 1.710 | 1.333 | 8280 | 1.001 |
| r0 | 1.168 | 1.328 | 1.539 | 1.336 | 3773 | 1.002 |
| Cohort 1 | ||||||
| mtd[1] | 2.000 | 2.641 | 3.490 | 2.698 | 5334 | 1.001 |
| mtd[2] | 6.818 | 155.074 | 741.512 | 244.976 | 4245 | 1.000 |
| Cohort 2 | ||||||
| mtd[3] | 10.616 | 150.651 | 697.634 | 232.181 | 5990 | 1.000 |
| Cohort 3 | ||||||
| mtd[4] | 20.000 | 24.622 | 32.626 | 25.318 | 7635 | 1.001 |
| mtd[5] | 24.685 | 164.743 | 718.587 | 257.397 | 3704 | 1.001 |
| mtd[6] | 26.416 | 162.084 | 712.577 | 246.507 | 4612 | 1.000 |
| Cohort 4 | ||||||
| mtd[7] | 68.506 | 229.548 | 817.905 | 320.609 | 4064 | 1.001 |
| mtd[8] | 64.879 | 102.858 | 161.341 | 108.212 | 4444 | 1.001 |
| mtd[9] | 61.216 | 228.808 | 786.405 | 311.936 | 5078 | 1.000 |
| Cohort 5 | ||||||
| mtd[10] | 183.516 | 463.337 | 1229.780 | 567.250 | 5316 | 1.001 |
| mtd[11] | 190.979 | 460.132 | 1237.230 | 566.082 | 5256 | 1.001 |
| mtd[12] | 134.969 | 159.790 | 179.996 | 158.797 | 10000 | 1.000 |
| mtd[13] | 196.548 | 462.334 | 1267.920 | 570.773 | 4241 | 1.001 |
| mtd[14] | 183.836 | 460.362 | 1237.710 | 567.768 | 4652 | 1.002 |
| Cohort 6 | ||||||
| mtd[15] | 419.005 | 855.336 | 1938.600 | 988.780 | 5211 | 1.001 |
| mtd[16] | 106.057 | 119.836 | 129.999 | 119.013 | 10165 | 1.001 |
| mtd[17] | 11.938 | 50.237 | 95.173 | 52.473 | 9315 | 1.000 |
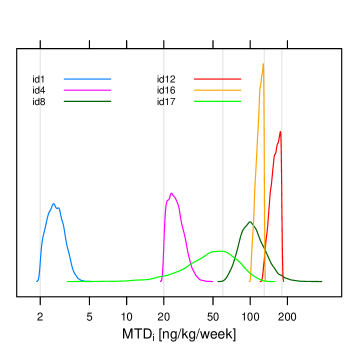
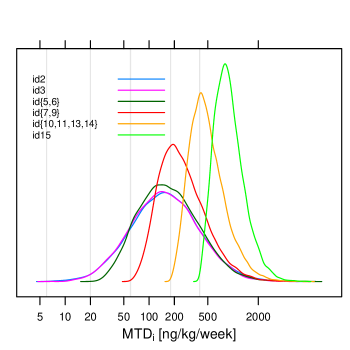
Figures 1 and 2 exhibit separately the posterior densities of MTDi for patients with and without observed toxicities. The comparison between these Figures illustrates that observed toxicities constitute the main source of information in dose-finding trials.
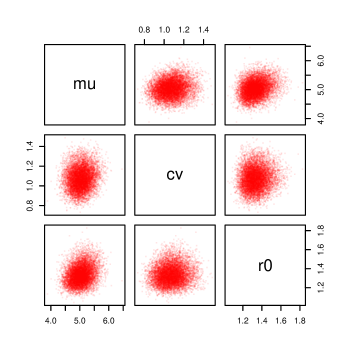
Figure 3 shows the pairwise joint posterior densities of model hyperparameters , and . Notably, the posterior for is centered around , which we had accorded a low prior probability. Thus, we are ‘surprised’ to discover the substantial heterogeneity of toxic dose-response revealed by the severe toxicities in this trial. Similarly, the posterior density centering , while unremarkable from the standpoint of pharmacologic intuition, suggests that in retrospect the threefold dose-level jumps in this trial would have been too large even under circumstances where .
Discussion
Given the sparse data in this small dose-escalation study, my analysis necessarily makes strong assumptions. Possibly the most consequential of these has been to ignore exposure time. It seems likely that , far from being constant for each individual, is in fact a stochastic process, . Treating it here as constant thus ignores time-to-event considerations (cf. Cheung and Chappell (2000)) which may have been important in this trial. Was the step-up dosing in this trial conceived as ‘conditioning’ patients as with ‘ramp-up’ dosing of venetoclax to avoid tumor lysis syndrome (Roberts et al., 2016)? If so, then abstracting away time overlooks what may be the crucial pharmacologic point in AFM11 dosing.
Comparison with Bekele & Thall [2004]
Formally, Eqs. (1–4) invite comparison with the ordinal probit model of Bekele and Thall (2004), in which a latent variable acts like our MTDi to determine toxicities through a relation analogous to (1):333Here, and throughout this comparison, I drop the extra subscript which Bekele and Thall (2004) introduced to index multiple toxicities.
| (8) |
Unlike our MTDi, however, the latent remains for Bekele and Thall (2004) a unitless abstraction, bereft of a realistic pharmacologic interpretation. Similarly, they motivate their log-scaling of dose as a technical maneuver “[t]o improve numerical stability,” whereas here I appeal to a prior implicit in the geometrical sequence of pre-specified AFM11 dose levels.
Comparison with Van Meter et al. [2012]
While the formal developments in Van Meter et al. (2012) do not present close analogues with Eqs. (1–4), the authors’ efforts to ground their modeling in pharmacologic realism warrant discussion. The ‘CR-CRM’ model developed by these authors employs a continuation ratio (CR) model, which they introduce in conjunction with an appeal to pharmacologically realistic intuitions about toxicity:
“[T]he CR model allows for comparisons between individuals in a specific toxicity category versus all individuals that experienced a more severe toxicity grade. The CR model also distinguishes between subjects who reached a certain toxicity grade but did not advance to a more severe toxicity and assumes that individuals must ‘pass through’ the ordinal toxicities to advance to the next highest category. In any clinical trial setting, this assumption is reasonable given that we assume a patient who experiences a grade 3 severe toxicity first presented with symptoms resembling less severe grade 1 or 2 toxicities.”
It is remarkable to find within the statistical dose-finding literature this type of inchoate realism, alluding to patients as non-exchangeable individuals.
The CR model stipulates that, for a toxicity grading system with ordinal grades , the population distribution of toxic responses is such that (Van Meter et al., 2012, p.304):
| (9) |
where it is understood that . Under the widely adopted CTCAE toxicity grading system, for example, we have and the CR model has 6 parameters: .
The term ‘continuation ratio’ applies here because the left-hand side of (9) admits interpretation as the log odds for an individual who has reached a grade- toxicity not continuing to a higher grade. The CR models arise in psychometrics, where they form one class of polytomous item response theory (IRT) models Hemker et al. (2001). The natural toxicologic analogy would be that physiology presents a sequence of biochemical barriers to toxicity not unlike the difficulties presented by a sequentially scored test item. The grade of toxicity produced by a toxin is then determined by how far it penetrates through these sequential barriers, much as the item score achieved by a test-taker depends on how far he advances through the stages of item difficulty. Whereas psychometrics readily posits latent variables with realistic interpretations, however, the statistical literature on dose finding has thus far proven impervious to such thinking (Norris, 2020). Further development of the CR-CRM model in terms of latent quantities such as MTDi may well serve to bridge that literature into the modern era of precision medicine, with its expectations of individualized dosing.
Anticipating and averting the fatal toxicity of patient 17
Citing “the ethical need to control the probability of overdosing” in dose-escalation trials, Babb et al. (1998) developed the escalation with overdose control (EWOC) criterion. Under this scheme, each enrolling patient’s dose is chosen so as to limit the probability of an ‘overdose’, defined as exceeding some population quantile of the MTDi distribution.444Working as they did entirely within the one-size-fits-all dose-finding framework, Babb et al. (1998) did not explicitly recognize this quantile as such, but referred to it simply as ”the MTD.” In the same spirit, we may ask what the probabilities of each grade of toxicity would have been in Cohort 6, conditional on all observations up through Cohort 5. Technically, this can be accomplished by dropping Cohort 6 patients 15–17 from the data set, and replacing them with 2 hypothetical patients: one (at index ) starting the 130 ng/kg weekly dose, and the second (at ) stepping up to the full 400 ng/kg weekly, after no toxicity at the starting dose. The unobserved nodes Y[15] and Y[16] may then be sampled to predict the distribution of toxicities in Cohort 6.555See section 3.2, page 15 of the JAGS Version 4.3.0 User Manual. Table 3 shows the hyperparameter estimates without the Cohort 6 data remain reasonably close to those in Table 2.
| Lower95 | Median | Upper95 | Mean | SSeff | psrf | |
| Hyperparameters | ||||||
| mu | 4.509 | 5.167 | 5.808 | 5.176 | 3272 | 1.0007 |
| cv | 0.847 | 1.056 | 1.269 | 1.058 | 7508 | 1.0000 |
| tau | 0.992 | 1.335 | 1.752 | 1.360 | 7854 | 1.0000 |
| r0 | 1.166 | 1.407 | 1.704 | 1.424 | 1972 | 1.0006 |
| Population MTDi | ||||||
| mtd[15*] | 10.278 | 173.204 | 817.957 | 272.691 | 4295 | 1.0002 |
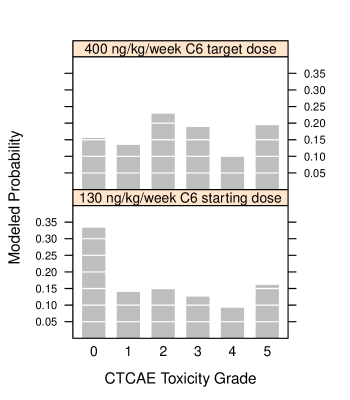
Figure 4 exhibits the toxicity distributions for these hypothetical patients. The model is seen to predict that each patient enrolling in Cohort 6 risks a fatal toxicity even at the starting dose, with probability exceeding 16%. More realistic prior elicitation and modeling of AFM11 toxic dose-response thus might have informed safer design and conduct of this trial.
Conclusion
I have developed here a Bayesian model of heterogeneous dose-response for an ordinal toxicity, and used it to examine retrospectively the safety of dose-finding trial that was halted for a fatal toxicity. The model supports an interim analysis suggesting the fatalilty in this trial could have been anticipated and averted. Without loss of generality, this mode of analysis may be applied at every dosing decision in a dose-finding trial. Thus, it forms the basis for designing and implementing safer dose-finding designs in the future. With access to sufficient pseudodata from prior elicitation, some of the strong identifying restrictions employed here may (and should) be relaxed. Being grounded in realistic pharmacologic intuitions, and explicitly recognizing patients as non-exchangeable individuals, this model may prove well suited to such prior elicitation with clinicians.
Data availability
Code for reproducing all of this paper’s Figures and analyses may be found at doi:10.17605/osf.io/9x6j7.
Competing interests
The author operates a scientific and statistical consultancy focused on precision-medicine methodologies such as those advanced in this article.
Grant information
No grants supported this work.
References
- Affimed (2015) Affimed. Affimed Presents Data Comparing T-cell- and NK-cell- engaging TandAbs AFM11 and AFM12 at ASH, December 2015. URL https://www.affimed.com/wp-content/uploads/afmd_afm11-12_ash_final.pdf.
- Affimed (2018) Affimed. Affimed Places AFM11 (CD19/CD3-Targeting T cell Engager) Phase 1 Program on Clinical Hold, October 2018. URL https://www.affimed.com/affimed-places-afm11-cd19-cd3-targeting-t-cell-engager-phase-1-program-on-clinical-hold/.
- Affimed (2019) Affimed. Affimed Announces R&D Strategy to Focus on Innate Immunity Portfolio; Reports First Quarter 2019 Financial Results and Operational Progress, May 2019. URL https://www.affimed.com/affimed-announces-r-reports-first-quarter-2019-financial-results-and-operational-progress/.
- Babb et al. (1998) J. Babb, A. Rogatko, and S. Zacks. Cancer phase I clinical trials: efficient dose escalation with overdose control. Statistics in Medicine, 17(10):1103–1120, May 1998.
- Bekele and Thall (2004) B. Nebiyou Bekele and Peter F Thall. Dose-Finding Based on Multiple Toxicities in a Soft Tissue Sarcoma Trial. Journal of the American Statistical Association, 99(465):26–35, March 2004. 10.1198/016214504000000043.
- Cheung and Chappell (2000) Y. K. Cheung and R. Chappell. Sequential designs for phase I clinical trials with late-onset toxicities. Biometrics, 56(4):1177–1182, December 2000. 10.1111/j.0006-341x.2000.01177.x.
- Denwood (2016) Matthew J. Denwood. runjags: An R package providing interface utilities, model templates, parallel computing methods and additional distributions for MCMC models in JAGS. Journal of Statistical Software, 71(9):1–25, 2016. 10.18637/jss.v071.i09.
- Hemker et al. (2001) Bas T. Hemker, L. Andries van der Ark, and Klaas Sijtsma. On measurement properties of continuation ratio models. Psychometrika, 66(4):487–506, December 2001. 10.1007/BF02296191.
- Norris (2017a) David C. Norris. Costing ‘the’ MTD. bioRxiv, August 2017a. 10.1101/150821.
- Norris (2017b) David C. Norris. Precautionary Coherence Unravels Dose Escalation Designs. bioRxiv, December 2017b. 10.1101/240846.
- Norris (2018) David C. Norris. One-size-fits-all dosing in oncology wastes money, innovation and lives. Drug Discovery Today, 23(1):4–6, January 2018. 10.1016/j.drudis.2017.11.008.
- Norris (2019) David C. Norris. Ethical Review and Methodologic Innovation in Phase 1 Cancer Trials. JAMA Pediatrics, 173(6):609, 2019. 10.1001/jamapediatrics.2019.0811.
- Norris (2020) David C. Norris. Comment on Wages et al, Coherence principles in interval-based dose finding. Pharmaceutical Statistics 2019, doi:10.1002/pst.1974. Pharmaceutical Statistics, March 2020. 10.1002/pst.2016.
- Plummer (2003) Martyn Plummer. JAGS: A program for analysis of Bayesian graphical models using Gibbs sampling. In Proceedings of the 3rd International Workshop on Distributed Statistical Computing (DSC 2003), Vienna, Austria, March 2003.
- Roberts et al. (2016) Andrew W. Roberts, Matthew S. Davids, John M. Pagel, Brad S. Kahl, Soham D. Puvvada, John F. Gerecitano, Thomas J. Kipps, Mary Ann Anderson, Jennifer R. Brown, Lori Gressick, Shekman Wong, Martin Dunbar, Ming Zhu, Monali B. Desai, Elisa Cerri, Sari Heitner Enschede, Rod A. Humerickhouse, William G. Wierda, and John F. Seymour. Targeting BCL2 with Venetoclax in Relapsed Chronic Lymphocytic Leukemia. The New England Journal of Medicine, 374(4):311–322, January 2016. 10.1056/NEJMoa1513257.
- Salogub et al. (2018) Galina Salogub, Jiri Mayer, Frantisek Folber, Sebastian Grosicki, Aleksander B Skotnicki, Anna Prochwicz, Alexander Myasnikov, Alexander Gural, Oliver Schoenborn-Kellenberger7, Charlie Brindley, Stefan Knackmuss, Sylvia E Schwarz, Sandra Schmich, Cassandra Choe-Juliak, Andras Strassz, Leila Alland, and Michael Doubek. A Phase 1 Study Investigating AFM11 in Patients with Relapsed/Refractory B-cell Precursor Acute Lymphoblastic Leukemia: Preliminary Results, December 2018. URL https://www.affimed.com/wp-content/uploads/ASH2018-AFM11-1.pdf.
- Simon et al. (1997) R. Simon, B. Freidlin, L. Rubinstein, S. G. Arbuck, J. Collins, and M. C. Christian. Accelerated titration designs for phase I clinical trials in oncology. Journal of the National Cancer Institute, 89(15):1138–1147, August 1997. 10.1093/jnci/89.15.1138.
- Smith (2018) Jonathan Smith. Cancer Immunotherapy Phase I on Hold After Patient Death, October 2018. URL https://www.labiotech.eu/medical/affimed-cancer-immunotherapy-death/.
- Van Meter et al. (2012) Emily M Van Meter, Elizabeth Garrett-Mayer, and Dipankar Bandyopadhyay. Dose-finding clinical trial design for ordinal toxicity grades using the continuation ratio model: an extension of the continual reassessment method. Clinical Trials: Journal of the Society for Clinical Trials, 9(3):303–313, June 2012. 10.1177/1740774512443593.