Personalized Recommendation of PoIs to People with Autism
Abstract.
The suggestion of Points of Interest to people with Autism Spectrum Disorder (ASD) challenges recommender systems research because these users’ perception of places is influenced by idiosyncratic sensory aversions which can mine their experience by causing stress and anxiety. Therefore, managing individual preferences is not enough to provide these people with suitable recommendations. In order to address this issue, we propose a Top-N recommendation model that combines the user’s idiosyncratic aversions with her/his preferences in a personalized way to suggest the most compatible and likable Points of Interest for her/him. We are interested in finding a user-specific balance of compatibility and interest within a recommendation model that integrates heterogeneous evaluation criteria to appropriately take these aspects into account. We tested our model on both ASD and “neurotypical” people. The evaluation results show that, on both groups, our model outperforms in accuracy and ranking capability the recommender systems based on item compatibility, on user preferences, or which integrate these two aspects by means of a uniform evaluation model.
1. Introduction
The personalized suggestion of Points of Interest (PoIs) challenges the research on recommender systems (Ricci et al., 2011) because, in order to provide truly inclusive services, different factors have to be taken into account, which go farther than modeling user interests. Specifically, when suggesting PoIs to people with Autism Spectrum Disorder (ASD), we must take into account at least two aspects:
-
(1)
The recommender system must work under data scarcity. There is a low number of users who can be analyzed to learn their interests: research indicates that Autism Spectrum Disorder affects around 1 in 100 people in EU (Elsabbagh et al., 2012). Moreover, ASD people are hard to be contacted because they have interaction problems and a tendency to avoid new experiences (Hobson, 1995). Finally, their attention problems cause difficulties in providing detailed feedback about items (Murray et al., 2005).
-
(2)
User preference management is not enough to generate useful suggestions. In fact, ASD people have idiosyncratic sensory aversions that influence the way they perceive items, especially places (Tavassoli et al., 2014b; Robertson and Baron-Cohen, 2017; Association et al., 2013). Therefore, traditional data about interests, used in recommenders for “neurotypical” individuals (i.e., not belonging to the autism spectrum), should be combined with these aversions because what bothers autistic people has great importance in their daily choices and can determine a high level of stress and anxiety (Gillott and Standen, 2007). In order to take spatial needs into account in PoI recommendation, idiosyncratic aversions to noise, brightness and other sensory features have to be analyzed to recommend places that the user can perceive as safe and thus serenely experience. For “safe PoIs” we mean places which present “safe” characteristics from the sensory point of view; e.g., being quiet, scarcely crowded, or with smooth lights. Notice that the inclusive recommendation of items generally goes beyond user preferences management: for example, in technology-enhanced learning, it is necessary to consider specific user features, such as learning capability, and corresponding specific item features, e.g., readability level (Pera and Ng, 2014).
Starting from Multi Criteria Decision Analysis (von Winterfeldt and Edwards, 1986), which provides techniques for the evaluation of multiple dimensions of items, and on match-making models based on user-to-item similarity (Bridge et al., 2005; Lops et al., 2011), most recommender systems, including collaborative multi-criteria ones (Adomavicius and Kwon, 2007; Jannach et al., 2014), assume that the attributes of an item contribute to its utility to the user in an additive way. However, we notice that, depending on a person’s idiosyncrasies and on their strength, problematic features might make items unsuitable for her/him even though they meet her/his preferences. Moreover, the impact of compatibility on users’ choices varies individually and it cannot be separately managed with respect to preferences; e.g., some autistic people are determined to visit noisy and crowded places if they like them very much. Therefore, the models of item evaluation must reflect individual evaluation criteria by balancing feature compatibility and preference satisfaction. In this work, we investigate the role of these two aspects in rating estimation, considering both ASD and neurotypical people. Specifically, we pose the following research questions:
-
•
RQ1: in PoI recommendation, does a customized model of item evaluation, which balances feature compatibility and preference satisfaction in a personalized way, outperform recommender systems that manage only one of these aspects?
-
•
RQ2: in PoI recommendation, does a customized model of item evaluation, which balances feature compatibility and preference satisfaction in a personalized way, outperform recommender systems which deal with both aspects but uniformly manage them?
In order to answer these questions, we propose a novel Top-N recommender system that applies heterogeneous evaluation criteria to take user preferences and compatibility requirements into account by exploiting feature-based user profiles for the specification of individual needs. Our recommender is focused on PoI suggestion to people with autism; however, it might be interesting to investigate its adaptation to other needs, e.g., related to motor disabilities, by extending the type of features which influence item compatibility. Our work has the following key aspects:
-
•
We acquire data about people’s aversion to sensory features in terms of disturbance caused by low or high feature values; e.g., darkness or strong light in physical places. For this purpose we use a questionnaire derived from (Tavassoli et al., 2014a) but composed of a lower number of questions than that work.
-
•
As our questionnaire provides data about users’ aversion to a subset of the values that each feature can take, we also define general functions to estimate aversion to the whole range of possible values of the feature. Then, we derive feature compatibility with the user as the complement of aversion.
-
•
For the estimation of item ratings, we distinguish user preferences for broad item categories from idiosyncratic sensory aversions. Moreover, as users might balance differently these aspects in item evaluation, we combine preferences and features compatibility by applying user-specific weights, which we acquire by analyzing users’ ratings in conjunction with their declared preferences and idiosyncrasies.
We tested our model on 20 adults with autism and 128 neurotypical ones111We had no mean to know whether the subjects of this second group belong to the spectrum or not. However, we can reasonably expect that the sample respects the proportion of the entire population; thus, it might include 1 or 2 ASD persons at most (over 128). Henceforth, for simplicity, we refer to this sample as neurotypical people.. On both groups of people, our model outperforms in accuracy and ranking capability a set of baseline recommender systems which singularly take item compatibility, or user preferences into account, and baselines that uniformly manage compatibility and preference information without differentiating their contribution. In summary, we provide the following novel contributions:
-
•
A Top-N PoI recommender system that fuses compatibility and preference data in rating estimation by balancing the impact of these aspects in a user-specific way.
-
•
A validation of the recommender on autistic and neurotypical people aimed at evaluating the performance of our model on both groups of users.
The approach presented in this paper is part of a wider ongoing project, PIUMA (Personalized Interactive Urban Maps for Autism)222PIUMA project involves a collaboration among the Computer Science and the Psychology Departments of the University of Torino and the Adult Autism Center of the city of Torino, Italy., which has the aim to develop novel digital solutions for helping people with ASD in their everyday movements (Rapp et al., 2017; Rapp et al., 2019). The final result of PIUMA will be a mobile app showing maps customized to ASD users. By means of the present work, we aim at adding a personalized selection of PoIs.
In the following, Section 2 discusses the spatial needs of people with autism. Section 3 presents the related work. Sections 4 outlines how we retrieve information about PoIs, users’ preferences and idiosyncrasies. Section 5 presents our model. Section 6 describes the validation methodology we applied and Section 7 discusses the evaluation results. Section 8 concludes the paper.
2. Spatial needs of people with autism
Symptoms of autism span from severe language and intellectual disabilities in individuals with low- or mid-functioning autism, to no disabilities and an Intelligence Quotient (IQ) above the average in persons with high-functioning autism and Asperger’s syndrome. Autism entails an atypical social functioning, which often results in avoiding everyday interactions (Hobson, 1995). Questionnaire-based studies suggest atypical sensory perception in over 90% of individuals with autism spectrum conditions (Robertson and Baron-Cohen, 2017; Golan et al., 2010; Robertson and Simmons, 2013), which means that individuals with autism appear to react differently to sensory stimulations: a majority of them may become overwhelmed by environmental features that are easily managed by neurotypical people. For ASD individuals, the brain seems unable to appropriately balance the senses (Robertson and Simmons, 2013). At least in part because of these characteristics, persons with ASD tend to have a reduced range of activities and interests, often preferring mechanical, deterministic situations, having the need to find reassurance by sticking to rigid, repetitious routines (Simm et al., 2016). It seems that they are less likely to explore new environments, and more likely to revisit well-known locations than neurotypical individuals (Smith, 2015). These peculiarities may entail idiosyncratic modes of perceiving space (Rapp et al., 2018).
Several studies (Golan et al., 2010; Robertson and Simmons, 2013; Rapp et al., 2020) reported that people with autism actively avoid places that may negatively impact on their senses. Sight, smell and hearing are relevant in reference to mobility in urban environments and high sensory stimulation negatively influences individuals in their movements. Further relevant environmental dimensions that could impact their sense of safeness are the temperature, openness, and crowding of a place. Such idiosyncratic sensory aversions may result in anxiety, fatigue, disgust, sense of oppression or distraction (Rapp et al., 2020).
This should result in technological supports able to satisfy autistic people’s idiosyncratic spatial needs, focusing on aversions derived from their high sensitivity to sensory stimulation. Moreover, there is a high need to personalize solutions because sensory sensitivity seems highly idiosyncratic; thus there are no features of places that may reassure the entire autistic population, and specific characteristics of each person should be considered (Putnam et al., 2019).
3. Related work
Technology is widely used to support people with autism in managing specific problems because they commonly exhibit an affinity with it (Putnam and Chong, 2008; Ramdoss et al., 2012). In general, the research on autism tends to pay more attention to children (Goldsmith and LeBlanc, 2004) and it overlooks adults’ needs. This might be a consequence of the “medical model”, which promotes intervention toward school-aged individuals. Moreover, specifically the HCI community prefers to address social interaction problems (Putnam et al., 2019; Kientz et al., 2013; Grynszpan et al., 2014), likely because these are seen as the core characteristics of autism from a clinical point of view: therefore, that research focuses, e.g., on face-to-face conversation (Boyd et al., 2016) and emotion management (Simm et al., 2016), ignoring spatial difficulties.
Most of the applications investigating the adoption of personalization strategies for ASD people regard the educational domain. For example, Judy et al. (Judy et al., 2012) present a personalized e-learning system that provides learning paths of different difficulty based on the user’s past results. They use ontologies to describe learning materials, annotation schemas and service ontologies, and they use a genetic algorithm as an optimization technique, representing a set of learning objects as chromosomes. No evaluation is provided.
García et al. (García et al., 2016) propose an adaptive web-based application that helps students with autism overcome the challenges they may face when going to university. The adaptation consists of how the information site presents itself to autistic and non-autistic students but the information is the same for everyone. The adaptive functionality is based on learning styles (visual vs. verbal, global vs. analytical, active vs. reflective) and user history. For example, if the user is more visual than verbal, the video version of the content will be shown at the top of the learning object. Otherwise it will be moved to the bottom. No evaluation with ASD users is presented.
Hong et al. (Hong et al., 2012) propose to provide autistic users with suggestions within a social network aimed at supporting the independence of young adults. However, they focus on the organization of the social network, by relying on peers’ suggestions, instead of automatically generating recommendations to users.
Differently, Costa et al. (Costa et al., 2017) develop a task recommendation system that uses a case-based reasoning machine learning technique to supplement the child’s regular therapy. The recommender suggests the daily activity to be performed (related to eating, keeping clean, getting dressed, etc.) based on age, gender and time of day. It does not consider the child’s preferences, while the level of difficulty of the activities is manually set by the therapist. No evaluation with ASD people is described. Moreover, in (Ng and Pera, 2018) Ng and Pera propose a hybrid game recommender for adult people with autism, based on collaborative and graph-based recommendation techniques, but they only carry out a preliminary test on neurotypical people. Finally, in (Premasundari and Yamini, 2019) Premasundari and Yamini propose a system that recommends food and therapy for autistic children based on their symptoms. The system uses K-means algorithm for grouping the symptoms based on their type and association rule mining for the recommendation of food and therapies. However, the final target are the parents and caregivers, not people with autism. The system has been evaluated only from a usability point-of-view.
Our work differs from the above ones for several reasons. Firstly, we focus on a different domain, i.e., spatial support. Secondly, we target adult people, who are the final users of the system and whose preferences and requirements have to be considered to succeed in item recommendation. Thirdly, we evaluated the approach with ASD people: this has rarely, if ever, been done in the related research. Fourthly, our approach employs personal preferences for item categories and aversions to sensory features to steer recommendation in a context where a limited amount of feedback about items can practically be collected from users. This is different from the situation of other recommender systems in the health domain, which are targeted to users who are more willing to provide their preferences as needed, e.g., food recommendation (Freyne and Berkovsky, 2010).
Our work also differs from general content-based recommender systems (Lops et al., 2011), feature-based (Han and Karypis, 2005), collaborative multi-criteria (Adomavicius and Kwon, 2007; Jannach et al., 2014; Zheng, 2017) and hybrid ones (Burke, 2002; Gemmell et al., 2012; Cantador et al., 2011) because we treat sensory features of items as sources of discomfort for users rather than liking or disliking factors. We separately model the influence of idiosyncratic sensory features, which determine the compatibility of items with the user, from her/his preferences for types of items. Notice that this separation makes our model different from recommender systems that deal with negative preferences as well, e.g., (Musto et al., 2011), because we support the management of heterogeneous criteria to deal with user preferences and sensory idiosyncrasies.
Previously, the INTRIGUE (Ardissono et al., 2003) tourist guide introduced the notion of compatibility requirements in PoI recommendation but it did not investigate their different meaning and impact in the evaluation of items with respect to preferences.
It is worth mentioning that, while constraint-based recommender systems (Zanker et al., 2010; Felfernig et al., 2011; Wibowo et al., 2018; Dragone et al., 2018) are too knowledge intensive for our purposes (we are not suggesting item bundles with constraint satisfaction requirements), the optimization of soft constraints for path-finding under suitability criteria is relevant to our future work, in order to extend PoI recommendation with instructions for reaching the target places. This type of technique has been explored in recommender systems for routing; e.g., see (Quercia et al., 2014) and (Verma et al., 2018).
4. Preliminary study setup
In this section we present how we gather data about users and POIS to run our experiments, as well as the sample’s features.
4.1. Data
In order to gather data about autistic users’ preferences and sensory aversions, we decided to bootstrap the user profiles by explicitly eliciting this type of information from people. Thus, we defined a questionnaire that will also be proposed to the users in the registration phase of the PIUMA app (not yet fully developed) in order to integrate an initial preference acquisition with the possibility to rate PoIs while the user is visiting them. The information about sensory aversions is hard to obtain (Tavassoli et al., 2014b): usually, very long and complex questionnaires have to be completed for this purpose (Robertson and Baron-Cohen, 2017). Moreover, asking people with ASD for such data is challenging because they have difficulties in social interactions and they tend to avoid new experiences (Schopler and Mesibov, 1986). Given our users’ attention problems (Bara et al., 2001; Murray et al., 2005) and considering the application context, which is not a clinical setting, we decided to avoid long and detailed surveys. Consequently, we carefully prepared with psychologists a smaller questionnaire able to capture such information in a shorter way. Users filled in the questionnaire, possibly in the presence of an operator (when needed), and they answered to the question using the [1, 5] Likert scale. The questionnaire is composed of two sections:
-
•
In the first one we elicit user preferences about categories of PoIs such as restaurants, parks, and so forth; see the left column of Table 1.
-
•
In the second one we gather information about users’ aversions to sensory features of PoIs (right column). We defined the questions about aversions by adapting the Sensory Perception Quotient (SPQ) test by Tavassoli et al. (Tavassoli et al., 2014a), a standard sensory questionnaire for adults with and without autism that assesses basic sensory hyper- and hyposensitivity.333The standard test is part of the battery of assessment tests that the people compile when they become patients of the Autistic Adult center. It is made of 92 items, that is too much to be proposed to users in the context of a recommender system. In our questionnaire, we extrapolated the questions from Tavassoli’s test. Specifically, we adapted the questions based on what users said in previous interviews carried out during a participatory design session for the design of the crowdsourcing system (Rapp et al., 2019). The adaptation of the test is out of the scope of this paper. For some features (brightness and space), we asked the user to evaluate two extreme conditions, i.e., low or high levels, assuming that the middle ones are less problematic than the other ones. In other cases (crowding, noise and smell) we only asked about her/his annoyance in relation to the highest level because usually the low levels of these features are neutral.
After the questionnaire, we asked the users to evaluate 50 specific PoIs located in Torino city center (e.g., How much do you like Castle Square?) in order to collect a dataset of ratings to test our model. We used the same [1, 5] Likert scale as above, but the “I don’t know the place” option was available as well.
Those PoIs have been taken from Maps4All (Social Computing, 2020) and they are representatives of all the categories of places it defines. Notice that we used an ad hoc crowdsourcing platform, designed to gather sensory features of places (Rapp et al., 2019), because open data made available by geo web sites like OpenStreetMap (OpenStreetMap Contributors, 2017) do not contain the specific sensory information we need. Maps4all allows the collection of such data: for each place, the user can rate in the [1, 5] scale its sensory features, and in particular its level of i) brightness, ii) crowding, iii) noise, iv) smell, v) openness, and vi) temperature. These sensory features have been defined on the basis of an authors’ user study findings (Rapp et al., 2020) and state-of-art research (Robertson and Simmons, 2013; Robertson and Baron-Cohen, 2017). The user can also provide a global evaluation of the place. For each datum, the system returns the mean evaluation it collected. Currently, the Maps4All platform has been populated by means of two experimental crowdsourcing sessions during two lessons at the Master degree in Social Innovation and ICT at University of Torino, in May and December 2019. About 120 students have been involved in the crowdsourcing tasks, and they have been asked to provide evaluations for at least three PoIs each in Torino city centre. In total, during the two crowdsourcing sessions we collected the evaluations of 282 PoIs. Specifically, the 50 PoIs we considered for our study have been evaluated by at least three people each.
| From 1 (not at all) to 5 (very much), how much do you like doing the following activities? • be in nature, go to parks, gardens, green areas, … • visit museums, exhibitions, cultural events • go to the cinema, theater, concerts • go to comic shops • go to clothing stores • go to malls and markets • go to the library • go to the bookshop • play sport • go to pubs, cafe • go to the restaurant • go to the ice cream shop • stay in squares • go to the railway stations | In a place, how much does it bother you: • too much light • very low light • a lot of people • a lot of noise • strong smells • cramped places (narrow, small) • large places |
4.2. Sample
For our study we involved two groups of users444All participants signed a privacy consensus according to GDPR. University research ethical committee approval was obtained for the study:
-
•
20 ASD adults (from 22 to 40 years-old, mean age: 26,3, median 28; 11 men, 9 women) patients of the Autistic Adult center, medium- and high-functioning.
-
•
128 neurotypical subjects (from 19 to 71 years-old, mean age: 28,1, median 23; 63 men, 65 women) from university students and authors’ contacts.
Given the 50 PoIs selected, the mean number of PoI evaluations we obtained is 31 fpr ASD participants and 39 for neurotypical ones.
5. Recommendation Model
As previously discussed, we assume that both user preferences and item compatibility should be taken into account to identify the most relevant items that an individual user can safely experience and like. However, evaluation criteria might be personal and users could weight these aspects differently in their decision-making processes. For instance, in contrast to the tendency of people with ASD to visit places in which they feel comfortable, during our participatory design interviews sessions, we had the chance to interact with a guy with autism who frequently visits bowling halls, regardless of the negative impact of noise and crowd on his senses, because he likes bowling so much that he does not want to give it up. We thus propose a recommendation model which, based on the observed item evaluations, can weight the contribution of compatibility and preferences in rating prediction on a user-specific basis. For clarity purposes we split the description of our model as follows:
-
(1)
input data for recommendation (Section 5.1);
-
(2)
estimation of the compatibility of the individual features of an item with the user (Section 5.2);
-
(3)
estimation of the overall compatibility of the item with the user (Section 5.3);
-
(4)
preference-based item evaluation (Section 5.4);
-
(5)
integration of compatibility and preference-based evaluation to predict the user’s rating of the item (Section 5.5).
Before describing our model we introduce the notation we use:
-
•
is the set of users and the set of items of the domain.
-
•
is the set of item categories; e.g., shops, cinemas, etc..
-
•
is a Likert scale in ; in this work, .
-
•
is the set of sensory features defined in our domain. We assume that each feature takes values in . Specifically:
-
–
is the set of features such that, the higher the value of , the stronger its negative impact on the user; e.g., noise.
-
–
denotes features whose extreme values make users uncomfortable, while the middle ones are less problematic; e.g., brightness.
In our domain there are no features such that people are expected to feel comfortable with high values and uncomfortable with low ones; therefore, we omit this class.
-
–
For each user and item , we estimate ’s evaluation of (denoted as ) as a decimal number in the [1, ] interval, by taking ’s previous ratings, preferences for item categories and idiosyncrasies into account.
5.1. Input Data
Our model takes two types of information as input:
-
•
The profile of , extracted from the questionnaire data, which specifies:
-
–
The ratings in (s)he provided for a set of items .
-
–
Her/his declared preferences for the categories , each one expressed in the scale.
-
–
Her/his declared sensory aversion to specific values of item features, expressed in . We denote ’s aversion to a value of a feature as . For example, means that is fairly disturbed by items having .
-
*
For each feature we assume by default that . Therefore, the user profile stores a single value, , which specifies ’s aversion to the maximum value of ; i.e., .
-
*
For each feature in , the user profile stores two values which express ’s aversion to the minimum and maximum values of respectively: e.g., {, }.
-
*
-
–
-
•
Item ’s profile, extracted from the crowdsourced data, which specifies:
-
–
The category of .
-
–
A vector storing, for each feature , the value of in item (denoted as ) retrieved by querying Maps4All; takes values in the [1, ] interval.
-
–
5.2. Compatibility of Individual Features with the User
We can define compatibility as the opposite of aversion in the range of values that features can take. However, user profiles only include one or two aversion values declared by users for each feature and the missing ones have to be interpolated. We thus define two patterns to approximate users’ idiosyncratic aversions to item features starting from the values stored in the user profile:
-
•
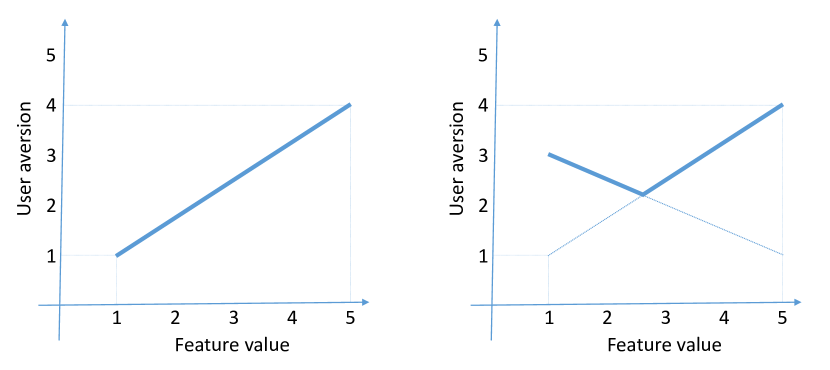
For each we approximate aversion as a linearly increasing function. If we represent feature values in the axis and user aversion in the axis of a plane, we can define this function as a line which connects point (1, 1) to point (, ), as in the left graph in Figure 1:
(1) We thus estimate ’s aversion to in () as follows:
(2) -
•
As far as is concerned, and given {} in ’s profile, we approximate aversion by means of a concave function on the range of . The aversion function has a ”V” shape which we approximate by drawing two lines, as the right graph of Figure 1:
-
–
The first line () connects points (1, 1) and (, ) to represent the increment of aversion towards the maximum value of .
-
–
The second line () connects points (1, ) and (, 1) to represent the decrease in aversion while takes higher values than its minimum:
(3)
Therefore, we estimate ’s aversion to in by selecting the maximum values of the two lines, i.e.:
(4) This corresponds to the broken thick line in Figure 1.
-
–
Notice that takes values in the [1, ] interval and higher values of this measure mean that the feature generates more discomfort to . Given , the compatibility of with in , denoted as (in [1, ]), can thus be defined as:
| (5) |
5.3. Overall Item Compatibility: Aggregation Measures
We propose alternative aggregation measures to compute the overall compatibility of an item with a user () by modeling different types of influence of individual features. In Section 7 we evaluate their performance, in combination with different recommendation algorithms.
-
•
Min: is the minimum compatibility of ’s features with :
(6) This measure is conjunctive: it evaluates an item as incompatible with if it has at least one totally incompatible feature.
-
•
Ave: is the mean compatibility of ’s features:
(7) where denotes set cardinality. This measure is additive (disjunctive) and equally balances the influence of all the features on compatibility.
The following aggregation measures estimate overall compatibility in function of the distance between the features of (stored in the vector) and those of an item which best matches ’s idiosyncrasies (). For each , is the most compatible value of on the basis of ’s estimated aversion presented in Section 5.2. This value is for , while it is the feature value associated to the minimum aversion for ; e.g., in the right graphic of Figure 1 ( axis). The overall compatibility of with is thus computed as follows:
-
•
Cos: is the Cosine similarity between and :
(8) where is the scalar vector product and is the Frobenius Norm. The smaller is the angle between and , the more compatible is with .
-
•
RMSD: is the complement of the Root Mean Square Deviation between and :
(9) The smaller is the distance between and , the more compatible is with .
5.4. Preference-based Item Evaluation
While compatibility indicates whether the user can safely experience an item, it does not mean that (s)he likes it. User preferences have to be taken into account for this purpose.
In our domain, the only preference that we consider is the user’s interest in the category of the item to be evaluated. Thus, the preference value of a user for an item of category corresponds to the value of ’s preference for stored in ’s profile. We denote this value as .
It is worth mentioning that, if more preferences had to be modeled, a classical Multi-Criteria Decision Analysis approach might be applied to compute an overall preference estimation as a weighted function of preferences for individual attributes (Adomavicius and Kwon, 2007; Adomavicius et al., 2011; Jannach et al., 2014). However, this is out of the scope of the present work.
5.5. Rating Prediction
In order to take personal balance between compatibility and preferences into account, we propose to identify user-dependent evaluation criteria by exploiting the user’s idiosyncrasies and preferences in combination with the ratings of items (s)he provides, which we consider as the ground-truth revealing her/his priorities. For this purpose, we define the overall evaluation of items, which produces the estimated rating for each user, as a weighted mean of items compatibility and user preferences:
| (10) |
where takes values in the [0, 1] interval and is the preference-based evaluation of , given ’s profile. This model, henceforth referred as Ind (i.e., Individual), identifies a specific value for each user to optimize item recommendation to her/him. We identify the value of for each as the one that minimizes the distance between estimated ratings and ground-truth ones.
6. Validation methodology
We aim at assessing the usefulness of modeling both compatibility and preference aspects for recommendation, with respect to taking only one of these aspects into account. Moreover, we aim at evaluating the usefulness of a personalized balance between these two types of information, specified by the parameter of Equation 10. For these purposes we compare our model to baseline recommenders which (i) uniformly manage compatibility and user preferences, i.e., they ignore the possibly different impact on decision-making) or (ii) focus on a single aspect, either compatibility or preferences. Specifically, we consider the following baselines:
-
•
Multi-Criteria (MC): this recommender system estimates item ratings by uniformly treating idiosyncratic features and preferences on the basis of the aggregation measures described in Section 5.3. It computes by fusing ’s preference for the category of () with the compatibility of individual features () by means of a single aggregation function; e.g., the mean of all these values as in Ave (Equation 7).
-
•
C-only: this is a setting of our recommendation model (Equation 10) in which to evaluate items exclusively on the basis of their compatibility with the user.
-
•
Pref-only: in this setting of our model, to evaluate items on the exclusive basis of the user’s preferences.
We did not select as baselines any collaborative or feature-based recommenders such as those proposed in (Han and Karypis, 2005) or (Adomavicius and Kwon, 2007) because there is not enough data to train the recommenders.
We compare our model to the above baselines on both the autistic users dataset (henceforth denoted as AUT) and on the neurotypical users one (NOR). For the comparison we configure all the algorithms on each aggregation measure of Section 5.3. For each algorithm, we denote the specific configuration we apply by appending its name to that of the algorithm; e.g., IndCos represents the application of the Cos aggregation measure to model Ind.
To evaluate recommendation performance we focus on ranking capability (MRR and MAP), accuracy (Precision, Recall and F1), error minimization (MAE and RMSE) and user coverage. We perform a 5-fold cross validation in which, for every fold, we use 80% as training set and 20% as test set. As the Ind models have to optimize the parameter, we train each of them to find the best user-specific setting by optimizing its results with respect to MAP. Moreover, to be sure that the baselines are consistently evaluated, we run the other algorithms (MC, C-only and Pref-only, which do not need any training) on the same test sets used for Ind.
7. Evaluation results and discussion
Tables 2 and 3 show the Top-N evaluation results with N=5; i.e., the list of suggested items has length=5. The tables omit the results concerning user coverage because it is 100% in all the cases.
We consider two categories of algorithms, i.e., the configurations of our model on the various aggregation measures and the corresponding ones of the baselines, and we use the following notation: the best value across all algorithms is printed in bold; the best value obtained by the other category of algorithms is underlined (when our model obtains the best value we underline the best value achieved by the baselines, and vice versa). Stars indicate significant differences according to a Student T-Test between the best performing algorithm from each category; **: p¡0.01; *: p¡0.05. It can be noticed that:
-
•
IndCos excels in accuracy and ranking capabilities: on both datasets it outperforms all the other algorithms (baselines and own category) in F1 and MAP, and it has the best Recall of its own category. Moreover, it obtains better MRR values than all algorithms on AUT and most baselines on NOR. As far as Precision is concerned, IndCos is the third best algorithm on AUT while it is the fourth best on NOR; in both cases it is outperformed by another member of its own category. The results concerning error minimization are mixed: on both datasets the MAE of IndCos is worse than that of most of the other algorithms, including those of its own category. However, on NOR, it has the best RMSE of its own category and it achieves better results than most of the baselines.
-
•
IndMin excels in error minimization: on both datasets it obtains the best MAE of all algorithms; moreover, concerning RMSE, it outperforms all algorithms in AUT and the other algorithms of its own category in NOR. IndMin also has fairly good ranking capability: it is the second best algorithm for MAP on both datasets and it has the best MRR on NOR, and second best MRR of its own category on AUT. It has good Precision: it achieves the best one of all algorithms on AUT and the third best on NOR. On both datasets it outperforms most baselines in Recall. Moreover, on AUT it has the third best F1 of all algorithms (lower than IndCos and C-onlyCos), while its accuracy on NOR is in middle position.
-
•
IndAve has the third best MAP results of its own category, the third and second best MRR on AUT and NOR respectively, and, concerning these metrics, it is positioned in the higher part of the general classification. As far as Precision, Recall and F1 are concerned, it achieves intermediate results on AUT but it is placed in the top positions of the classification on NOR. It has fairly good error minimization capability (MAE, RMSE), better than several baselines, and it is placed in second position within its own category on both datasets.
Table 2. Results on AUT dataset for N=5. The lines of the table are ordered by MAP. The best values of each measure across all algorithms is printed in bold. The best value obtained by the other category of algorithms is underlined. Stars denote statistical significance: **: p¡0.01; *: p¡0.05. Algorithm Prec. Recall F1 MAP MRR MAE RMSE IndCos 0.6290 0.6207 0.6046 **0.5384 0.8095 0.9927 1.4541 IndMin 0.6328 0.5832 0.5910 0.5125 0.7825 0.8691 *1.3020 Pref-only 0.6220 0.5912 0.5860 0.5114 0.7858 0.9346 1.4276 IndAve 0.6118 0.5710 0.5736 0.4960 0.7667 0.9168 1.3659 C-onlyCos 0.6263 0.6224 0.6001 0.4877 0.7583 1.3675 1.6948 IndRMSD 0.5978 0.5545 0.5577 0.4799 0.7537 0.9965 1.4533 MCAve 0.6255 0.5383 0.5575 0.4489 0.7792 1.1902 1.4861 MCRMSD 0.6080 0.5396 0.5463 0.4429 0.7775 1.2172 1.5426 MCMin 0.6305 0.5057 0.5344 0.4352 0.7950 1.4512 1.7943 MCCos 0.5917 0.5558 0.5459 0.4336 0.7217 1.3534 1.6236 C-onlyMin 0.6065 0.4999 0.5230 0.4166 0.7583 1.3675 1.6816 C-onlyAve 0.5912 0.5154 0.5270 0.4142 0.7192 1.3045 1.6060 C-onlyRMSD 0.5825 0.5009 0.5145 0.4036 0.7142 1.3702 1.7168 Table 3. Results on NOR dataset for N=5. We use the same notation of Table 2. Algorithm Prec. Recall F1 MAP MRR MAE RMSE IndCos 0.5790 0.5406 0.5349 0.4139 0.7475 1.1792 1.5232 IndMin 0.5791 0.5225 0.5250 0.4120 0.7688 1.0950 1.4024 IndAve 0.5740 0.5261 0.5262 0.4108 0.7555 1.1085 1.4343 IndRMSD 0.5816 0.5286 0.5297 0.4108 0.7521 1.1427 1.4758 Pref-only 0.5795 0.5408 0.5347 0.4076 0.7304 1.1416 1.5270 C-onlyCos 0.5503 0.5414 0.5255 0.4000 0.7189 1.4374 1.7456 MCAve 0.5752 0.5154 0.5213 0.3995 0.7564 1.1238 1.3564 MCMin 0.5664 0.4956 0.5053 0.3890 0.7583 1.1249 1.4052 MCRMSD 0.5568 0.4840 0.4963 0.3767 0.7433 1.3320 1.6255 C-onlyAve 0.5476 0.4936 0.4979 0.3701 0.7168 1.2122 1.4668 C-onlyMin 0.5507 0.4769 0.4899 0.3673 0.7359 1.1704 1.4213 C-onlyRMSD 0.5460 0.4870 0.4936 0.3651 0.7223 1.4157 1.7281 MCCos 0.5274 0.5053 0.4974 0.3535 0.6591 1.2775 1.5795 -
•
IndRMSD is the worst performing configuration of our model: on AUT it obtains the lowest performance results of its own category on all measures, but it still outperforms several baselines in MAP and in other metrics. Differently, in NOR it achieves fairly good F1, the best Precision of all algorithms (including baselines), fairly good MAP and MRR and fairly good error minimization.
-
•
Pref-only is the best baseline regarding MAP and it has fairly good MRR and F1 on both datasets. This algorithm achieves the best MAE and RMSE of the baselines on AUT, while on NOR it is outperformed by other baselines. Except for RMSE in AUT and MAE in NOR, it achieves lower results than IndCos on all performance metrics.
-
•
On both datasets C-onlyCos has lower ranking capability than the previous algorithms (MAP and MRR) but it has fairly good accuracy, being the best, or second best baseline on the various measures. Its error minimization capability is definitely lower than that of our model. Notice that the other configurations of C-only (i.e., using Min, Ave and RMSD) have worse performance than this one on both datasets, in all metrics except for error minimization.
-
•
Similarly, the configurations of MC, except for MCMin in Precision and MRR, have middle to low performance; they are outperformed by our model or by some other algorithms in both datasets.
The evaluation results suggest that IndCos is the best recommendation algorithm because it combines good ranking capability with good accuracy. IndMin achieves better error minimization than this algorithm but, as previously discussed, this is a secondary evaluation criterion for us.
Unfortunately, the low size of the AUT and NOR datasets does not support the statistical significance of results for several metrics. However, the results concerning MAP (and RMSE) on the AUT dataset are significant. This is important because our recommendation model is targeted to autistic people and we can thus rely on the ranking capability results we obtained on them. At the same time, the results are encouraging for neurotypical users. Thus, it is worth investigating performance within a larger experiment that will possibly provide more statistically relevant results on both groups of people.
The evaluation results help us answering our research questions:
-
•
RQ1: we can positively answer this question. As far as F1 and ranking capability are concerned, the configurations of Ind that take both preferences and compatibility into account (and, specifically, IndCos) outperform Pref-only, which only exploits user preferences to recommend items. Moreover, they achieve better results than all the algorithms that only use compatibility information (C-only). These algorithms are outpeformed by Pref-only, too. This means that, not surprisingly, compatibility information alone is not enough to generate relevant recommendations for the user.
-
•
RQ2: we can positively answer this question as well. In fact, the Ind configurations outperform the MC ones, regardless of the used aggregation measure, in most evaluation metrics and especially in ranking capability and F1.
To summarize, in Top-N PoI recommendation preference information is useful to suggest relevant items. However, better results can be achieved by combining this type of information with a compatibility evaluation aimed at assessing whether the user can serenely experience the recommended items. Interestingly, a uniform management of compatibility and preference information, which does not distinguish the possibly heterogeneous evaluation criteria concerning them, does not bring good results. Conversely, the acquisition of user-specific weights to balance the impact of compatibility and interests in item evaluation improves item suggestion.
8. Conclusions
Users with Autism Spectrum Disorder (ASD) are a particularly interesting and challenging target of PoI recommender systems because of their characteristics and needs in relation to places. In order to suggest suitable solutions, which the user can like and serenely experience, both her/his preferences for PoI categories, traditionally analyzed by researchers, and her/his aversions to sensory features, have to be considered: as a matter of fact, the latter can seriously affect ASD people’s experience of the places, causing negative feelings. Notice that it is particularly important to avoid wrong suggestions because there might be critical effects on the person, given her/his “frailty”, causing for example anxiety, irritation and anger, with unpredictable consequences.
In this paper we presented a Top-N recommender of PoIs for ASD people that takes their idiosyncratic aversions to sensory features into account in order to generate suggestions that are expected to be both pleasant and safe for them. We tested our model on autistic and neurotypical users. The evaluation results show that, on both user groups, our model outperforms in accuracy and ranking capability baseline recommenders which (i) evaluate items on the sole basis of how closely they meet the user’s preferences, or how compatible they are with her/his idiosyncratic aversions to sensory features, and (ii) uniformly manage compatibility and preference information without distinguishing the possibly different contributions of these aspects to item evaluation. We thus conclude that the integration of possibly heterogeneous evaluation criteria concerning user interests and idiosyncratic aversions is a promising approach to extend the adoption of recommender systems to new user groups with respect to those typically addressed in the state of the art.
Two main limitations of our approach concern the data about PoIs and users available for the experiment. We plan to address these limitations as follows:
-
•
We will extend information about PoIs in two ways: (i) by starting a VGI campaign with people with ASD and their caregivers, as well as with the general population, to acquire a larger amount of data, and (ii) by extracting sensory information from consumer reviews available in online platforms such as TripAdvisor (TripAdvisor, 2017); e.g., see (Bilici and Saygın, 2017).
-
•
When the PIUMA app will be available, we will be able to learn detailed information about user interests and aversions by coupling an initial bootstrapping of user profiles via form filling with a subsequent refinement based on an analysis of user behavior.
Another limitation is related to the questionnaire for gathering user’s sensory aversion: it has been derived from a state-of-art SPQ questionnaire, but a correlation between the two has to be computed. We plan to carry out this analysis as well.
Acknowledgements.
This work is supported by the COMPAGNIA di SAN PAOLO Foundation. We thank Stefano Cocomazzi, Stefania Brighenti and Claudio Mattutino for their contributions to the work.References
- (1)
- Adomavicius and Kwon (2007) Gediminas Adomavicius and YoungOk Kwon. 2007. New recommendation techniques for multicriteria rating systems. IEEE Intelligent Systems 22, 3 (May 2007), 48–55. https://doi.org/10.1109/MIS.2007.58
- Adomavicius et al. (2011) Gediminas Adomavicius, Nikos Manouselis, and YoungOk Kwon. 2011. Multi-Criteria Recommender Systems. Springer US, Boston, MA, 769–803. https://doi.org/10.1007/978-0-387-85820-3_24
- Ardissono et al. (2003) Liliana Ardissono, Anna Goy, Giovanna Petrone, Marino Segnan, and Pietro Torasso. 2003. INTRIGUE: personalized recommendation of tourist attractions for desktop and handset devices. Applied Artificial Intelligence, Special Issue on Artificial Intelligence for Cultural Heritage and Digital Libraries 17, 8-9 (2003), 687–714. https://doi.org/10.1080/713827254
- Association et al. (2013) American Psychiatric Association et al. 2013. Diagnostic and Statistical Manual of Mental Disorders (DSM-5®). American Psychiatric Pub.
- Bara et al. (2001) Bruno G. Bara, Monica Bucciarelli, and Livia Colle. 2001. Communicative abilities in autism: Evidence for attentional deficits. Brain and Language 77, 2 (2001), 216 – 240. https://doi.org/10.1006/brln.2000.2429
- Bilici and Saygın (2017) Eda Bilici and Yücel Saygın. 2017. Why do people (not) like me?: Mining opinion influencing factors from reviews. Expert Systems with Applications 68 (2017), 185 – 195. https://doi.org/10.1016/j.eswa.2016.10.001
- Boyd et al. (2016) LouAnne E. Boyd, Alejandro Rangel, Helen Tomimbang, Andrea Conejo-Toledo, Kanika Patel, Monica Tentori, and Gillian R. Hayes. 2016. SayWAT: Augmenting face-to-face conversations for adults with autism. In Proceedings of the 2016 CHI Conference on Human Factors in Computing Systems (CHI ’16). Association for Computing Machinery, New York, NY, USA, 4872–4883. https://doi.org/10.1145/2858036.2858215
- Bridge et al. (2005) Derek Bridge, Mehmet H. Göker, Lorraine McGinty, and Barry Smyth. 2005. Case-based recommender systems. Knowl. Eng. Rev. 20, 3 (Sept. 2005), 315–320. https://doi.org/10.1017/S0269888906000567
- Burke (2002) Robin Burke. 2002. Hybrid recommender systems: survey and experiments. User Modeling and User-Adapted Interaction 12, 4 (2002), 331–370. https://doi.org/10.1023/A:1021240730564
- Cantador et al. (2011) Iván Cantador, Pablo Castells, and Alejandro Bellogín. 2011. An enhanced semantic layer for hybrid recommender systems: Application to news recommendation. Int. Journal on Semantic Web and Information Systems 7, 1 (2011), 44–77. https://doi.org/10.4018/jswis.2011010103
- Costa et al. (2017) Margarida Costa, Angelo Costa, Vicente Julián, and Paulo Novais. 2017. A task recommendation system for children and youth with autism spectrum disorder. In Ambient Intelligence– Software and Applications – 8th International Symposium on Ambient Intelligence (ISAmI 2017), Juan F. De Paz, Vicente Julián, Gabriel Villarrubia, Goreti Marreiros, and Paulo Novais (Eds.). Springer International Publishing, Cham, 87–94. https://doi.org/10.1007/978-3-319-61118-1_12
- Dragone et al. (2018) Paolo Dragone, Giovanni Pellegrini, Michele Vescovi, Katya Tentori, and Andrea Passerini. 2018. No more ready-made deals: constructive recommendation for telco service bundling. In Proceedings of the 12th ACM Conference on Recommender Systems (RecSys ’18). ACM, New York, NY, USA, 163–171. https://doi.org/10.1145/3240323.3240348
- Elsabbagh et al. (2012) Mayada Elsabbagh, Gauri Divan, Yun-Joo Koh, Young Shin Kim, Shuaib Kauchali, Carlos Marcín, Cecilia Montiel-Nava, Vikram Patel, Cristiane S. Paula, Chongying Wang, et al. 2012. Global prevalence of autism and other pervasive developmental disorders. Autism research 5, 3 (2012), 160–179. https://doi.org/10.1002/aur.239
- Felfernig et al. (2011) Alexander Felfernig, Gerhard Friedrich, Dietmar Jannach, and Markus Zanker. 2011. Developing Constraint-based Recommenders. Springer US, Boston, MA, 187–215. https://doi.org/10.1007/978-0-387-85820-3_6
- Freyne and Berkovsky (2010) Jill Freyne and Shlomo Berkovsky. 2010. Intelligent food planning: Personalized recipe recommendation. In Proceedings of the 15th International Conference on Intelligent User Interfaces (IUI ’10). ACM, New York, NY, USA, 321–324. https://doi.org/10.1145/1719970.1720021
- García et al. (2016) Alejandro Montes García, Natalia Stash, Marc Fabri, Paul De Bra, George H. L. Fletcher, and Mykola Pechenizkiy. 2016. Adaptive web-based educational application for autistic students. In Late-breaking Results, Demos, Doctoral Consortium, Workshops Proceedings and Creative Track of the 27th ACM Conference on Hypertext and Social Media (HT 2016), Halifax, Canada, July 13-16, 2016 (CEUR Workshop Proceedings), Kevin Koidl and Ben Steichen (Eds.), Vol. 1628. CEUR-WS.org. http://ceur-ws.org/Vol-1628/Demo1.pdf
- Gemmell et al. (2012) Jonathan Gemmell, Thomas Schimoler, Bamshad Mobasher, and Robin Burke. 2012. Resource recommendation in social annotation systems: A linear-weighted hybrid approach. J. Comput. System Sci. 78, 4 (2012), 1160 – 1174. https://doi.org/10.1016/j.jcss.2011.10.006
- Gillott and Standen (2007) Alinda Gillott and PJ Standen. 2007. Levels of anxiety and sources of stress in adults with autism. Journal of Intellectual Disabilities 11, 4 (2007), 359–370. https://doi.org/10.1177/1744629507083585
- Golan et al. (2010) Ofer Golan, Emma Ashwin, Yael Granader, Suzy McClintock, Kate Day, Victoria Leggett, and Simon Baron-Cohen. 2010. Enhancing emotion recognition in children with autism spectrum conditions: An intervention using animated vehicles with real emotional faces. Journal of Autism and Developmental Disorders 40, 3 (2010), 269–279. https://doi.org/10.1007/s10803-009-0862-9
- Goldsmith and LeBlanc (2004) Tina R. Goldsmith and Linda A. LeBlanc. 2004. Use of technology in interventions for children with autism. Journal of Early and Intensive Behavior Intervention 1, 2 (2004), 166. https://doi.org/10.1037/h0100287
- Grynszpan et al. (2014) Ouriel Grynszpan, Patrice L Weiss, Fernando Perez-Diaz, and Eynat Gal. 2014. Innovative technology-based interventions for autism spectrum disorders: a meta-analysis. Autism 18, 4 (2014), 346–361. https://doi.org/10.1177/1362361313476767
- Han and Karypis (2005) Eui-Hong (Sam) Han and George Karypis. 2005. Feature-based recommendation system. In Proceedings of the 14th ACM International Conference on Information and Knowledge Management (CIKM ’05). ACM, New York, NY, USA, 446–452.
- Hobson (1995) R. Peter Hobson. 1995. Autism and the development of mind. Routledge.
- Hong et al. (2012) Hwajung Hong, Jennifer G. Kim, Gregory D. Abowd, and Rosa I. Arriaga. 2012. Designing a social network to support the independence of young adults with autism. In Proceedings of the ACM 2012 Conference on Computer Supported Cooperative Work (CSCW ’12). Association for Computing Machinery, New York, NY, USA, 627–636. https://doi.org/10.1145/2145204.2145300
- Jannach et al. (2014) Dietmar Jannach, Markus Zanker, and Matthias Fuchs. 2014. Leveraging multi-criteria customer feedback for satisfaction analysis and improved recommendations. Information Technology & Tourism 14, 2 (01 Jul 2014), 119–149. https://doi.org/10.1007/s40558-014-0010-z
- Judy et al. (2012) M.V. Judy, U. Krishnakumar, and A.G. Hari Narayanan. 2012. Constructing a personalized e-learning system for students with autism based on soft semantic web technologies. In 2012 IEEE International Conference on Technology Enhanced Education (ICTEE). IEEE, 1–5. https://doi.org/10.1109/ICTEE.2012.6208625
- Kientz et al. (2013) Julie A Kientz, Matthew S Goodwin, Gillian R Hayes, and Gregory D Abowd. 2013. Interactive technologies for autism. Synthesis Lectures on Assistive, Rehabilitative, and Health-Preserving Technologies 2, 2 (2013), 1–177. https://doi.org/10.2200/S00533ED1V01Y201309ARH004
- Lops et al. (2011) Pasquale Lops, Marco de Gemmis, and Giovanni Semeraro. 2011. Content-based Recommender Systems: State of the Art and Trends. Springer US, Boston, MA, 73–105. https://doi.org/10.1007/978-0-387-85820-3_3
- Murray et al. (2005) Dinah Murray, Mike Lesser, and Wendy Lawson. 2005. Attention, monotropism and the diagnostic criteria for autism. Autism 9, 2 (2005), 139–156. https://doi.org/10.1177/1362361305051398
- Musto et al. (2011) Cataldo Musto, Giovanni Semeraro, Pasquale Lops, and Marco de Gemmis. 2011. Random indexing and negative user preferences for enhancing content-based recommender systems. In E-Commerce and Web Technologies, Christian Huemer and Thomas Setzer (Eds.). Springer Berlin Heidelberg, Berlin, Heidelberg, 270–281. https://doi.org/10.1007/978-3-642-23014-1_23
- Ng and Pera (2018) Yiu-Kai Ng and Maria Soledad Pera. 2018. Recommending social-interactive games for adults with autism spectrum disorders (ASD). In Proceedings of the 12th ACM Conference on Recommender Systems (RecSys ’18). ACM, New York, NY, USA, 209–213. https://doi.org/10.1145/3240323.3240405
- OpenStreetMap Contributors (2017) OpenStreetMap Contributors. 2017. Openstreetmap. https://www.openstreetmap.org.
- Pera and Ng (2014) Maria Soledad Pera and Yiu-Kai Ng. 2014. Automating readers’ advisory to make book recommendations for k-12 readers. In Proceedings of the 8th ACM Conference on Recommender Systems (RecSys ’14). Association for Computing Machinery, New York, NY, USA, 9–16. https://doi.org/10.1145/2645710.2645721
- Premasundari and Yamini (2019) M. Premasundari and C. Yamini. 2019. Food and therapy recommendation system for autistic syndrome using machine learning techniques. In 2019 IEEE International Conference on Electrical, Computer and Communication Technologies (ICECCT). IEEE, 1–6. https://doi.org/10.1109/ICECCT.2019.8868979
- Putnam and Chong (2008) Cynthia Putnam and Lorna Chong. 2008. Software and technologies designed for people with autism: What do users want?. In Proceedings of the 10th International ACM SIGACCESS Conference on Computers and Accessibility (Assets ’08). Association for Computing Machinery, New York, NY, USA, 3–10. https://doi.org/10.1145/1414471.1414475
- Putnam et al. (2019) Cynthia Putnam, Christina Hanschke, Jennifer Todd, Jonathan Gemmell, and Mia Kollia. 2019. Interactive technologies designed for children with autism: Reports of use and desires from parents, teachers, and therapists. ACM Trans. Access. Comput. 12, 3, Article 12 (Sept. 2019), 37 pages. https://doi.org/10.1145/3342285
- Quercia et al. (2014) Daniele Quercia, Rossano Schifanella, and Luca Maria Aiello. 2014. The shortest path to happiness: recommending beautiful, quiet, and happy routes in the city. In Proceedings of the 25th ACM Conference on Hypertext and Social Media (HT ’14). ACM, New York, NY, USA, 116–125. https://doi.org/10.1145/2631775.2631799
- Ramdoss et al. (2012) Sathiyaprakash Ramdoss, Wendy Machalicek, Mandy Rispoli, Austin Mulloy, Russell Lang, and Mark O’Reilly. 2012. Computer-based interventions to improve social and emotional skills in individuals with autism spectrum disorders: a systematic review. Developmental Neurorehabilitation 15, 2 (2012), 119–135. https://doi.org/10.3109/17518423.2011.651655 arXiv:https://doi.org/10.3109/17518423.2011.651655 PMID: 22494084.
- Rapp et al. (2017) Amon Rapp, Federica Cena, Guido Boella, Alessio Antonini, Alessia Calafiore, Stefania Buccoliero, Maurizio Tirassa, Roberto Keller, Romina Castaldo, and Stefania Brighenti. 2017. Interactive urban maps for people with autism spectrum disorder. In Proceedings of the 2017 CHI Conference on Human Factors in Computing Systems, Denver, CO, USA, May 06-11, 2017, Extended Abstracts. 1987–1992. https://doi.org/10.1145/3027063.3053145
- Rapp et al. (2018) Amon Rapp, Federica Cena, Romina Castaldo, Roberto Keller, and Maurizio Tirassa. 2018. Designing technology for spatial needs: Routines, control and social competences of people with autism. International Journal of Human-Computer Studies 120 (2018), 49 – 65. https://doi.org/10.1016/j.ijhcs.2018.07.005
- Rapp et al. (2019) Amon Rapp, Federica Cena, Claudio Mattutino, Guido Boella, Claudio Schifanella, Roberto Keller, and Stefania Brighenti. 2019. Designing an urban support for autism. In Proceedings of the 21st International Conference on Human-Computer Interaction with Mobile Devices and Services, MobileHCI 2019, Taipei, Taiwan, October 1-4, 2019. 43:1–43:6. https://doi.org/10.1145/3338286.3344390
- Rapp et al. (2020) Amon Rapp, Federica Cena, Claudio Schifanella, and Guido Boella. 2020. Finding a secure place: A map-based crowdsourcing system for people with autism. IEEE Transactions on Human-Machine Systems (2020).
- Ricci et al. (2011) Francesco Ricci, Lior Rokach, and Bracha Shapira. 2011. Introduction to Recommender Systems Handbook. Springer US, Boston, MA, 1–35. https://doi.org/10.1007/978-0-387-85820-3_1
- Robertson and Simmons (2013) Ashley E Robertson and David R Simmons. 2013. The relationship between sensory sensitivity and autistic traits in the general population. Journal of Autism and Developmental disorders 43, 4 (2013), 775–784. https://doi.org/10.1007/s10803-012-1608-7
- Robertson and Baron-Cohen (2017) Caroline E. Robertson and Simon Baron-Cohen. 2017. Sensory perception in autism. Nature Reviews Neuroscience 18, 11 (2017), 671. https://doi.org/10.1038/nrn.2017.112
- Schopler and Mesibov (1986) Eric Schopler and Gary B. Mesibov. 1986. Social Behavior in Autism. Springer Science & Business Media.
- Simm et al. (2016) Will Simm, Maria Angela Ferrario, Adrian Gradinar, Marcia Tavares Smith, Stephen Forshaw, Ian Smith, and Jon Whittle. 2016. Anxiety and autism: Towards personalized digital health. In Proceedings of the 2016 CHI Conference on Human Factors in Computing Systems (CHI ’16). Association for Computing Machinery, New York, NY, USA, 1270–1281. https://doi.org/10.1145/2858036.2858259
- Smith (2015) Alastair D. Smith. 2015. Spatial navigation in autism spectrum disorders: a critical review. Frontiers in Psychology 6 (2015), 31. https://doi.org/10.3389/fpsyg.2015.00031
- Social Computing (2020) Social Computing. 2020. Firstlife - maps4all. https://maps4all.firstlife.org.
- Tavassoli et al. (2014a) Teresa Tavassoli, Rosa A. Hoekstra, and Simon Baron-Cohen. 2014a. The sensory perception quotient (spq): Development and validation of a new sensory questionnaire for adults with and without autism. Molecular Autism 5 (2014), 29. https://doi.org/10.1186/2040-2392-5-29
- Tavassoli et al. (2014b) Teresa Tavassoli, Lucy J. Miller, Sarah A. Schoen, Darci M. Nielsen, and Simon Baron-Cohen. 2014b. Sensory over-responsivity in adults with autism spectrum conditions. Autism 18, 4 (2014), 428–432. https://doi.org/10.1177/1362361313477246 PMID: 24085741.
- TripAdvisor (2017) TripAdvisor. 2017. Tripadvisor. https://www.tripadvisor.it/.
- Verma et al. (2018) Rohit Verma, Surjya Ghosh, Mahankali Saketh, Niloy Ganguly, Bivas Mitra, and Sandip Chakraborty. 2018. Comfride: a smartphone based system for comfortable public transport recommendation. In Proceedings of the 12th ACM Conference on Recommender Systems (RecSys ’18). ACM, New York, NY, USA, 181–189. https://doi.org/10.1145/3240323.3240359
- von Winterfeldt and Edwards (1986) Detlof von Winterfeldt and Ward Edwards. 1986. Decision Analysis and Behavioral Research. Cambridge University Press, Cambridge, UK.
- Wibowo et al. (2018) Agung Toto Wibowo, Advaith Siddharthan, Judith Masthoff, and Chenghua Lin. 2018. Incorporating constraints into matrix factorization for clothes package recommendation. In Proceedings of the 26th Conference on User Modeling, Adaptation and Personalization (UMAP ’18). ACM, New York, NY, USA, 111–119. https://doi.org/10.1145/3209219.3209228
- Zanker et al. (2010) Markus Zanker, Markus Aschinger, and Markus Jessenitschnig. 2010. Constraint-based personalised configuring of product and service bundles. Int. Journal of Mass Customisation 3, 4 (2010). https://doi.org/10.1504/IJMASSC.2010.037653
- Zheng (2017) Yong Zheng. 2017. Criteria chains: a novel multi-criteria recommendation approach. In Proceedings of the 22nd International Conference on Intelligent User Interfaces (IUI ’17). ACM, New York, NY, USA, 29–33. https://doi.org/10.1145/3025171.3025215