e-mail: cweinb@mpe.mpg.de 22institutetext: Center for Astrophysics and Space Sciences, University of California, San Diego, 9500 Gilman Dr, La Jolla, CA 92093, USA
ejecta in young supernova remnants
Abstract
Context. Tracing unstable isotopes produced in supernova nucleosynthesis provides a direct diagnostic of supernova explosion physics. Theoretical models predict an extensive variety of scenarios, which can be constrained through observations of the abundant isotopes and . Direct evidence of the latter was previously found only in two core-collapse supernova events, and appears to be absent in thermonuclear supernovae.
Aims. We aim to to constrain the supernova progenitor types of Cassiopeia A, SN 1987A, Vela Jr., G1.9+0.3, SN1572, and SN1604 through their ejecta masses and explosion kinematics.
Methods. We analyzed INTEGRAL/SPI observations of the candidate sources utilizing an empirically motivated high-precision background model. We analyzed the three dominant spectroscopically resolved de-excitation lines at 68, 78, and 1157 keV emitted in the decay chain of . The fluxes allow the determination of the production yields of . Remnant kinematics were obtained from the Doppler characteristics of the lines.
Results. We find a significant signal for Cassiopeia A in all three lines with a combined significance of 5.4. The fluxes are , and for the and decay, respectively. This corresponds to a mass of and , respectively. We obtain higher fluxes for with our analysis of Cassiopeia A than were obtained in previous analyses. We discuss potential differences. We interpret the line width from Doppler broadening as expansion velocity of . We do not find any significant signal for any other candidate sources.
Conclusions. We obtain a high ejecta mass for Cassiopeia A that is in disagreement with ejecta yields from symmetric 2D models. Upper limits for the other core-collapse supernovae are in agreement with model predictions and previous studies. The upper limits we find for the three thermonuclear supernovae (G1.9+0.3, SN1572 and SN1604) consistently exclude the double detonation and pure helium deflagration models as progenitors.
Key Words.:
ISM: supernova remnants - nuclear reactions, nucleosynthesis, abundances - Gamma rays: ISM1 Introduction
Supernova explosions play a crucial role in the chemical and kinematic evolution of the Universe. Self-consistent detailed models for the explosion mechanism and the ensuing kinematics of the ejected material are still lacking. Despite the frequent occurrence of supernova explosions ( per century in the Galaxy (Diehl et al. 2006)), observational constraints on the explosion mechanisms are still sparse, due to the large variety of progenitor systems and large parameter space of their models.
For modeling core-collapse supernova explosions, reviving the stalled shock and triggering an explosion presents a major challenge (Janka 2012; Burrows et al. 2018), as it has long been understood that the prompt explosion mechanism following core bounce cannot explode the star. Energy deposition by neutrinos in a gain region close to the stalled shock is considered as the driving force of the shock revival. Heating-induced creation of hydrodynamic effects, observed in 2D and 3D models, such as neutrino-driven convection and the standing accretion shock instability (SASI) (Blondin & Shaw 2007; Marek & Janka 2009; Bruenn et al. 2013; Hix et al. 2016; Bruenn et al. 2016) enhance the explodability, however, different implementation schemes favor the dominance of either neutrino-driven convection or the SASI (Pan et al. 2016; Summa et al. 2016; Skinner et al. 2016). Inclusion of additional, microphysical effects, for example, strangeness corrections (Melson et al. 2015) and rotation from the progenitor (Müller et al. 2017; Summa et al. 2018; Takiwaki et al. 2016; Iwakami et al. 2014) affect the explodability. Model calculations of supernova explosions performed by various groups lead to successful explosions in a mass range . Asymmetries evolved from hydrodynamic effects become frozen in the explosion and are reflected in the kinematics and mass distribution of the ejecta (Nomoto et al. 1995; Buras et al. 2006; Fryer & Kusenko 2006; Takiwaki et al. 2012; Wongwathanarat et al. 2015; Orlando et al. 2016; Wongwathanarat et al. 2017).
The variety of observed type Ia supernova luminosity and temporal behavior of light curves in the first few hundred days (Phillips et al. 1999) cannot be reproduced by a single progenitor type (Wang & Han 2012; Hillebrandt et al. 2013). Mergers of binary white dwarfs (van Kerkwijk et al. 2010; Pakmor et al. 2010; Ruiter et al. 2012; Pakmor et al. 2013; Kashyap et al. 2018) and mass accretion on single white dwarf stars (single degenerate scenario) are expected to lead to a central thermonuclear runaway, disrupting the white dwarf star in the process. On single degenerates, both stable mass accretion on white dwarfs towards the Chandresekhar mass limit (Nomoto et al. 1984; Parthasarathy et al. 2007; Maeda et al. 2010; Woosley & Kasen 2011; Hachisu et al. 2011; Seitenzahl et al. 2013; Chen et al. 2014; Fink et al. 2014) and surface helium detonation (Livne 1990; Fink et al. 2010; Shen & Bildsten 2014; Leung & Nomoto 2020) can increase the central density sufficiently to ignite nuclear fusion.
The high opacity of the ejected material does not allow direct observations of the first stages of the explosions. One of the most promising methods of deducing physical constraints for the explosion mechanisms is to directly observe the decay of radioactive isotopes produced during explosive nucleosynthesis. The best candidates for observing supernova interior physics through their nucleosynthesis imprints are the isotopes and due to their high abundances ( for core-collapse supernovae, 0.5 for SNe Ia in , in , see also below). Both isotopes have, for gamma-ray observations, ideal radioactive decay times: 6 d and 77 d for and its daughter nucleus , respectively, allow only a very short post-explosion observation window in which the majority of emitted gamma-rays are expected to be absorbed by the dense stellar material. With a half life of yr (Ahmad et al. 2006), a considerable amount of is still decaying even after centuries when the supernova remnant has long become optically thin to X- and gamma-ray emission. In contrast to the decay of synthesized and with half lives of 700 kyr and 2 Myr, producing a diffuse emission throughout the Milky Way (Plüschke et al. 2001; Bouchet et al. 2015; Siegert & Diehl 2017), the emission signature of decay is expected to be the one of individual point sources.
Spatially co-produced in core-collapse supernovae, and are mainly synthesized during alpha-rich freeze out (Woosley et al. 1973) deep in the central region of the supernova, where nucleosynthesis is strongly dependent on the thermodynamic conditions of the inner ejecta (Magkotsios et al. 2010). Due to the hydrodynamic instabilities required for an effective explosion, mixing and asymmetric expansion of the burning volume invalidates the 1D model characteristics of a mass cut, an idealized radius (Woosley & Weaver 1995), separating the gravitationally bound material from the ejecta. Since the nuclear burning occurs close to such a mass cut, the final amount of ejected is subject to uncertainty and ranges between M⊙ (Timmes et al. 1996; Limongi & Chieffi 2018).
Type Ia supernovae typically produce M⊙ in centrally ignited pure deflagration models, and up to a few times M⊙ in delayed detonation models (Maeda et al. 2010; Seitenzahl et al. 2013; Fink et al. 2014). Double detonation and surface He deflagration of sub-Chandrasekhar mass white dwarfs produce yields up to of (Fink et al. 2010; Woosley & Kasen 2011; Moll & Woosley 2013). The subclass of helium surface explosions synthesizes very little, potentially producing subluminous type Ia supernova events. Simulations (Waldman et al. 2011) and observations (Perets et al. 2010) suggest special configurations of binary white dwarfs, which, when exploding as peculiar type Ia supernovae, can produce of the order of of .
Observations of late optical spectra allow for the determination of mass ratios of synthesized elements, constraining the burning mechanisms (Eriksen et al. 2009; Pakmor et al. 2010; Jerkstrand et al. 2015; Maguire et al. 2018; Mori et al. 2018). However, the total ejected mass remains a free parameter. Nucleosynthesis yields can be estimated from the bolometric light curves of explosion, however, inferring the ejected mass of radioactive material is highly model dependent (Seitenzahl et al. 2014).
Comparing optical and infrared spectra to the late-time light curve, an ejected mass of is obtained for SN 1987A (Jerkstrand et al. 2015) in agreement with NuSTAR findings of (Boggs et al. 2015) based on the 68 and 78 keV line. This is, however, in disagreement with the results obtained from a multicomponent long-time light-curve model of (Seitenzahl et al. 2013) and direct detection of decay with INTEGRAL/IBIS at 68 and 78 keV of (Grebenev et al. 2012) .
Direct observational evidence for the production of can be obtained through the decay chain of where the prominent decay lines arise at energies of 68 keV and 78 keV for the decay of and at 1157 keV for the decay. These lines have a probability of 93.0 , 96.4 , and 99.9 per decay, respectively (Chen et al. 2011). In addition, a fluorescence photon is emitted from shell transitions in with a probability of 16.7 at 4.1 keV. With a significant difference of half life times of 60 yr in the first decay and 4 h (Audi et al. 2003) in the subsequent decay, the activity of all three decay channels can be safely assumed to be identical after correcting for the branching ratios.
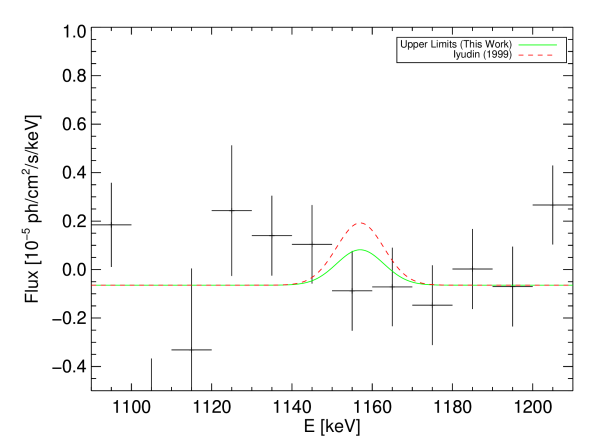
In this work, we utilized INTEGRAL/SPI data to search for emission of in all three decay lines simultaneously in the young close by supernova remnants Cassiopeia A, Tycho, Kepler, G1.9+0.3, Vela Junior, and the extragalactic (but very young) SN 1987A. We aim to constrain both ejecta yields and explosion kinematics for remnants with ages of less than a few centuries where a substantial amount of may still be present. We re-evaluated previous analyses of these remnants concerning the decay of (see Section 2) in the 68 and 78 keV lines and improved on them by including decay signature of the daughter nucleus at 1157 keV, which can only be seen in SPI. The 1157 keV line was studied for the remnant Cassiopeia A and Vela Jr.
This paper is structured as follows: Section 2 provides an overview of the six target remnants. Section 3 describes SPI data and spectral analysis, followed by Section 4, which includes results for the six remnants. Finally, in Section 5, we discuss our results and give a summary of astrophysical implications.
2 Young supernova remnants
| Cassiopeia A | SN 1987A | Vela Jr | Tycho | Kepler | G1.9+0.3 | |
| Distance | ||||||
| Year of Explosion | 1681 | 1987 | 1320 | 1572 | 1604 | |
| Age | 330 | 24 | 690 | 438 | 406 | 120 |
| Type | IIb | II-P | II | Ia | Ia | Ia |
| Exposure | 11.2 | 7.0 | 8.3 | 10.3 | 29.3 | 30.6 |
| Galactic Coordinates; l/b [deg] | ||||||
| References | 1, 2, 3 | 4, 5 | 6 | 7, 8 | 9, 10 | 11, 12 |
The astrophysical parameters of the six most promising candidates to coherently observe the decay chain are listed in Tab. 1. Evidence for the signature of the decay has been claimed in the majority of these historic supernova explosions. Within SPI’s narrow-line sensitivity verification of the signal and detection of the ensuing decay of is feasible within a limited age-distance volume including these remnants. We searched for signatures of the decay at 68 and 78 keV due to the de-excitation of *, and at 1157 keV due to the subsequent de-excitation of *. We utilized data from the INTEGRAL mission from 2003 to 2019, meaning INTEGRAL revolutions 43 to 2047. For our study, we applied an average date of 01.01.2011 AD as an observation date for all calculations and included age uncertainties in our mass derivation.
2.1 Cassiopeia A
Cassiopeia A is one of the best studied supernova remnants in the Milky Way (Vink 2004). With an approximate age of 340 years, it is the youngest known Galactic supernova remnant, attributed to a core-collapse explosion. From the detection of hydrogen and weak helium lines in a supernova light echo, attributed to Cassiopeia A, the explosion is characterized as a type IIb supernova (Krause et al. 2008a). Explosions of this type are typically produced by 15–25 stars (Young et al. 2006). The decay of has been consistently measured (Siegert et al. 2015; Grefenstette et al. 2014; Iyudin et al. 1994; Vink et al. 2001) from Cassiopeia A with an average inferred ejecta mass of .
2.2 SN 1987A
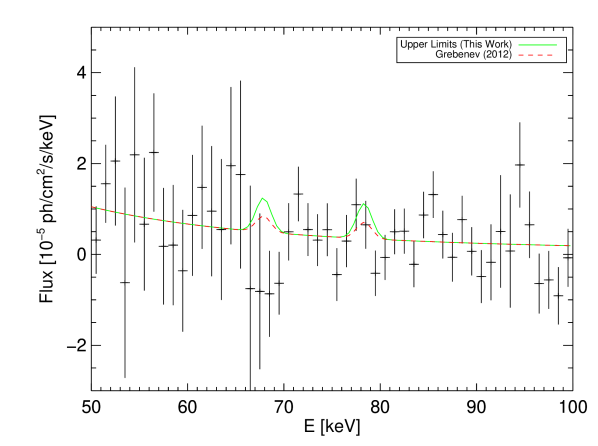
The explosion of SN 1987A occurred in the Large Magellanic Cloud (LMC) on February 24 1987, giving rise to a peculiar light curve containing a plateau phase (type II-P supernova). Detection of lines (Matz et al. 1988; Tueller et al. 1990) for the first time directly has confirmed that supernova light is indeed powered by this isotope, produced in the inner regions at the time of core-collapse. Recent refinements of astronomical precision yield a distance of kpc (Pietrzyński et al. 2019) to the LMC. Direct proof for the decay of has been reported from measurements with IBIS/INTEGRAL and NuSTAR in the hard X-ray lines of . However, the two measurements show a discrepancy in the ejecta mass, with and , respectively (Grebenev et al. 2012; Boggs et al. 2015). NuSTAR constrains the ejecta kinematics to an expansion velocity of less than 4100 , and a bulk Doppler shift suggests an asymmetric explosion.
2.3 Vela Jr.
COMPTEL discovered a significant gamma-ray emission in the energy range centered at the 1157 keV line. The signal was located in the direction of the Vela region with a flux of (Iyudin et al. 1998). This emission was attributed to the decay of in a previously unknown type II supernova remnant, which had been identified through detailed analysis of the X-ray emission of this region, and was called RX J0852.0-4622 or ”Vela Jr.” (Aschenbach 1998). An estimated age of 680 yr and a distance of 200 pc is derived (Aschenbach et al. 1999). The remnant has an apparent diameter of 2∘ (Aharonian et al. 2007). Follow-up observation with ASCA and XMM-Newton report a line at 4.4keV (Tsunemi et al. 2000; Iyudin et al. 2005, respectively) possibly from fluorescence. However, the more likely remnant age of 2.4-5.1 kyr derived from the expansion rate of the supernova (Allen et al. 2014) would exclude detectability of decay emission. This would then also be in agreement with the upper limits determined with IBIS/INTEGRAL (Tsygankov et al. 2016).
2.4 G1.9+0.3
G1.9+0.3 is presumably the youngest supernova remnant seen in the Galaxy so far. It has been identified by Reynolds et al. (2008) in the years 1985 and 2008 in the radio and X-ray regime. It is identified as a type Ia explosion. Radio observations suggest a distance of 8.5 kpc, placing the remnant in the Galactic center (Reynolds et al. 2008). From the apparent increase in size, an age of yr is deduced, which suggests a very high expansion velocity of 14000 km s-1 for the shock front. Using Chandra data, a detection of a soft X-ray component at 4.1 keV from the fluorescence line of has been reported (Borkowski et al. 2010) inferring a ejecta mass of . Extrapolating the detected flux in the fluorescence line to the hard X-ray lines provides a line flux estimate for the 68 keV line, which is below the upper limits determined from NuSTAR and IBIS/INTEGRAL instruments ( ph cm-2 s-1, ph cm-2 s-1; Zoglauer et al. 2015; Tsygankov et al. 2016, respectively).
2.5 Tycho
The Tycho supernova remnant is attributed to an explosion of type Ia, from measurements of the light echo and a comparison of model light curves with X-ray spectra (Badenes et al. 2006; Krause et al. 2008a). Tycho exploded in 1572 AD. Detection of synchrotron emission from a thin shell supports the idea of particle acceleration in young supernova remnants (e.g., Slane et al. 2014). X-ray line emission from intermediate to iron group elements in the interior of the supernova remnant has been found to be clumped (XMM Newton Miceli et al. 2015), and the hard X-ray lines of the decay chain were also detected (Swift/BAT Troja et al. 2014). These measurements suggest the presence of titanium both in the shocked shell and the interior region of the remnants. However, upper limits obtained from NuSTAR measurements exclude the presence of within a 2’ remnant radius at the Swift/BAT detection level over a large range of expansion velocities (Lopez et al. 2015). The distance to the remnant is somewhat uncertain, with estimates ranging from 1.7 to 5.1 kpc (Hayato et al. 2010; Slane et al. 2014; Albinson et al. 1986; Völk et al. 2008). We adopted a distance of kpc (Hayato et al. 2010).
2.6 Kepler
Johannes Kepler detected this supernova in 1604 AD. Also named G4.5+6.8, this is the youngest Galactic supernova for which an optical transient has been observed. This supernova occurred at a distance of kpc (Sankrit et al. 2016), and is located pc above the Galactic plane. Due to the detection of strong iron lines in the ejecta, it is attributed to a type Ia explosion (Reynolds et al. 2007), also supported by the absence of a central compact object. decay lines have not been found, with upper limits of ph cm-2 s-1 in the 1157 keV line (Dupraz et al. 1997) determined from COMPTEL data and ph cm-2 s-1 determined from INTEGRAL/IBIS for the 68 and 78 keV line (Tsygankov et al. 2016).
3 Data and analysis method
3.1 Instrument and analysis method
ESA’s gamma-ray space observatory INTEGRAL (Winkler et al. 2003) carries two main instruments on board, the imager IBIS and the spectrometer SPI. The SPI camera (Vedrenne et al. 2003) is a germanium detector array consisting of 19 hexagonally shaped detectors, optimized for high-resolution spectroscopy in the energy range between 18 keV and 8 MeV, with a spectral resolution of (full width at half maximum, FWHM) at 1 MeV. SPI electronics records 16384 energy channels in the range of , which is called SPI’s ”low-energy range”. We analyzed SPI data for the signatures of the decay lines, which have centroid energies in the laboratory at 68, 78 keV and 1157 keV. Our analysis is focused on the energy bands and in order to constrain potential underlying continuum emission at lower energies and account for potential large line broadening at higher energies.
SPI data after initial energy calibration and pre-processing comprises spectra in 0.5 keV bins for each of the 19 detectors, accumulated over exposures of typically 2000 s, called pointings. The orientation of the satellite is shifted by between each consecutive exposure in a rectangular-shaped dithering pattern consisting of 55 sets of coordinates around the observation target. We include data in our analysis in which the celestial objects of interest are within the partially coded field of view of SPI of . In general, celestial photons entering the aperture of SPI are partially blocked by a coded mask placed 171 cm above the detector plane, imprinting shadow grams on the camera. For an idealized source at long integration times, this creates relative detector intensity distributions (detector patterns), since the absolute number of measured photons per detector is governed by the visibility of the source through the mask (Fig. 1). Sources within a field of view of are fully coded by the tungsten mask, with decreasing coding fraction towards the coding limit at .
The main challenge of SPI data analysis consists of extracting the sparsely populated celestial detector pattern above a large, underlying, instrumental background. The latter is introduced by interaction and activation of satellite and instrument material by cosmic ray bombardment. In our spectroscopic analysis method, we compare the combination of the celestial detector patterns and the background detector patterns to the time series of measured patterns for the 19 detectors by fitting (time dependent) scaling parameters for both contributors. The celestial detector intensity distribution is calculated by applying the energy-dependent image response function (IRF) specific to SPI’s tungsten mask and the re-orientations during the dithering exposures. The model of the background consists of two separate components, one for continuum emission and one for nuclear de-excitation lines at specific energies. Both components are determined over a broad energy range and from multiple years of data. Degradation effects of detectors and time dependent variance of background level are taken into account by modeling the background per detector on an orbital timescale.
The mathematical description of our modeling method is given by
| (1) |
which means that the data and model per energy bin k are represented by the sum of the celestial components i of the total number of celestial sources convolved through the image response function R per detector j and the sum of all background components of detector j. No prior knowledge concerning the energy spectrum of the celestial sources is assumed in our analysis. In general, the model is fit to the data by minimizing the Cash Statistic (Cash 1979), adjusting the scaling parameters in Eq. (1), where different timescales for the scaling of the components are allowed. We use the spimodfit analysis tool (Strong et al. 2005; Halloin 2009), which applies a Levenberg-Marquardt algorithm to determine the maximum likelihood solution for all intensity parameters . The software is based on the ISDC software spiros (Dubath et al. 2005), however optimized for high spectroscopic resolution of low signal to noise sources. Unless otherwise stated, uncertainties are given as . We use the Pearson as an absolute goodness-of-fit criterion. We note that the chosen absolute goodness-of-fit criterion () itself carries an uncertainty (Andrae et al. 2010).The smallest possible timescale we utilized is a single pointing. To minimize the contamination of our data set by known periods of increased background, we excluded orbit phases below 0.10 and above 0.88, during which the satellite passes through the Van Allen radiation belts.
3.2 Background modeling
SPI instrumental background mainly originates from the bombardment of the satellite by cosmic ray particles. Interaction of these cosmic rays can induce nuclear reactions in the satellite materials. Subsequent decays from excited nuclear levels lead to the emission of nuclear de-excitation lines, which fall into the energy range of the SPI detectors. Among others, bremsstrahlung is a second dominant contribution to the background, forming an underlying continuum.
To determine the temporal and spectral behavior of the background, we used the knowledge gained from 17 yr of integrated mission data. Long-term temporal variation is introduced by the degradation of the lattice structure of the Germanium detectors and the absolute production rate of cosmic rays, which is anticorrelated with the solar cycle. Short-term variations are introduced by solar flares.
The detailed spectral shapes of the continuum emission and nuclear de-excitation lines are determined separately. Since a physically based model is difficult to construct and calibrate at the required precision, we used an empirical description of the background. This is based on previous attempts to model the highly variable instrumental background in SPI, as, for example, in Knödlseder et al. (2004) andJean et al. (2003), and supersedes the standard on-off methods as presented in Dubath et al. (2005). All background components are determined as a linear superposition of an underlying continuum normalized to a central pivot energy, superimposed by emission lines. The line shapes are represented by Gaussian functions convolved with a degradation function, which accounts for the degradation of the germanium charge collection efficiency (Kretschmer 2011). We determine the spectral shape on a 3 d (one orbit) period separately for each detector to trace the time-dependent degradation of the detectors. This timescale is chosen as the best compromise between accumulating sufficient statistics and appropriate determination of temporal variations of the spectral shape. Secondary contributions to the background are smeared out in our coded-mask analysis by accumulating data over multiple pointings (Siegert et al. 2019). The consistency of this high-resolution, time-dependent background modeling approach is demonstrated, for example, in Siegert et al. (2016); Siegert (2017), and Diehl et al. (2018).
3.3 Spectral analysis
With the modest spatial resolution of SPI of , supernova remnants cannot be resolved in separate clumps of ejecta. To enhance sensitivity for the relatively low-intensity total celestial signal in a line, a model for the line shape has to be adopted. We describe the emission produced by radioactive decay with Gaussian shaped lines, plus a power-law-shaped continuum.
| (2) |
where is the measured line flux, is the energy of the Doppler shifted-line centroid, and is line width. We interpret any broadening of the line, which would be additional to the detector resolution, as Doppler broadening caused by the expansion velocity of the ejecta. We determine the line parameters separately for each line when possible. No changes in the kinematics of the ejecta are expected, allowing for a combined three-line fit, assuming identical Doppler parameters for all three lines. We further allow for an underlying celestial continuum accounting for bremsstrahlung processes, with normalization parameter and power-law index . The mass of the ejected per line is determined by
| (3) |
where is the flux of the specific line keV, is the distance to the source, is the number of nuclei in , is the atomic mass number, yr is the decay constant of and is the age of the supernova remnant. All line fluxes are normalized with the branching ratio 111This is equal to the probability of photon emission per decay (93.0 %, 96.4 %, 99.9 %, respectively; s. Sect. 1) of the specific line . For comparison, all flux values are stated as the normalized flux . In a multiline fit, the branching ratios determine the relative line intensities, and the normalized flux is fit as the parameter of interest. Velocities corresponding to the Doppler broadening of the lines are calculated for the ejecta from the FWHM of the line, assuming a uniformly expanding sphere. While this model might not adequately describe asymmetries as seen in the supernova remnant Cassiopeia A (Grefenstette et al. 2017), it provides a reasonable first-order approach for determining fluxes from the remaining unresolved sources. Confidence intervals for our results of the spectral fits are estimated from the 68th percentile interval of a Metropolis-Hastings algorithm, minimizing the Pearson as test statistics. Upper limits are given at (i.e., , for one degree of freedom, dof). We derived our upper limits by varying only the integrated flux of the respective line, assuming values for Doppler broadening and shift, and utilizing the best fit values for the underlying continuum.
4 SPI results
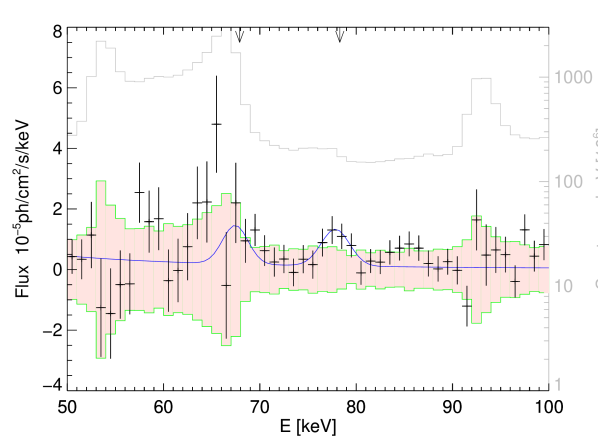
4.1 Cassiopeia A
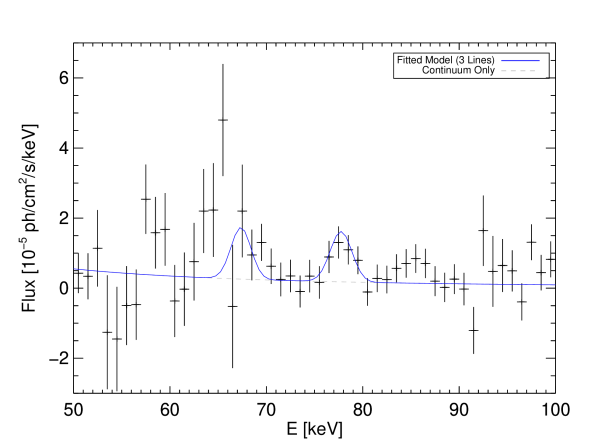
We used all available data for Cassiopeia A up to 2019 AD, containing a total exposure of 11.2 Ms for our analysis. Figure 2 shows the spectrum of Cassiopeia A in the energy ranges of interest. The average reduced per fit energy bin is 1.001 ( = 92,772/92,658). We adopted a uniform power law underlying the line emission across the entire energy range between 30 keV and 1200 keV with a fit power-law index of . The line signal with the highest significance for a single Gaussian shaped line is found for the 78 keV line, with a significance of 3.6. The strong background lines of germanium lead to relatively large flux variations in the energy range between such an extent that the 68 keV decay line is only marginally detectable.
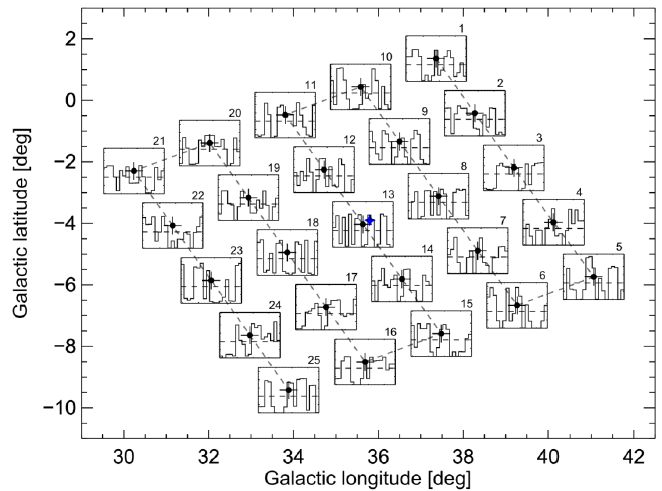
In order to validate our findings and to avoid spurious detection, we searched for an emission that could mimic decay from any celestial point source in a area centered at Cassiopeia A. Possible emission was determined at locations in a spherical square-shaped grid, where each point is separated by 2∘ from the adjacent point, yielding a total of 121 grid points. Figure 3 shows the map of source significances for a 78+1157 keV signal. Detection at is only found at the location consistent with Cassiopeia A, while other test points do not show significant signals. We additionally show (Fig. 3) the uncertainty band determined form these 121 source locations, which, if interpreted as statistical signal fluctuations of a zero signal, bracket the spectrum of Cassiopeia A. A significant excess above the uncertainty band is clearly visible at the 78 keV line, while the majority of the 68 keV line lies within the statistical background-uncertainty band.
| 78 keV | 1157 keV | Combined | Three Lines Combined | |
|---|---|---|---|---|
| Flux ph cm-2 s-1] | 3.30.9 | 9.53.0 | 4.21.0 | 4.60.8 |
| Mass [] | 2.10.6 | 5.91.9 | 2.60.6 | 2.90.5 |
| Centroid [keV] | 77.70.5 | 11517.9 | 77.90.2; 1150.53.2 | 67.5 ; 77.9; 1150.5 (fixed) |
| Shift [km s-1] | 1800 (fixed) | |||
| Line FWHM [keV] | 2.30.8 | 40.06.7 | 2.40.9; 31.26.6 | 2.3; 2.4; 31.2 (fixed) |
| Expansion Velocity [km s-1] | 55002700 | 89001500 | 64001900 | 6400 (fixed) |
| Significance [] | 3.6 | 3.3 | 4.9 | 5.4 |
The 78 keV line, if represented by a Gaussian-shaped line, represents an integrated flux of ph cm-2 s-1 and a 3.6 detection level. With Eq. (3), this flux corresponds to an ejected mass of M⊙, for a remnant age of 330 yr and a distance of 3300100 pc. The uncertainty is mainly due to the uncertainty in the determined flux, however, the uncertainty in the distance estimate is also incorporated in the result. The line is centered at , which is slightly red-shifted with respect to the laboratory-determined decay energy of 78.3 keV (Firestone et al. 2003). This Doppler shift translates into a bulk motion of away from the observer. The full width at half maximum (FWHM) of the line is . This is broadened with respect to the instrumental resolution of 1.6 keV FWHM at 78 keV. We interpret this broadening of the line as Doppler broadening due to the expansion of the supernova remnant; this translates the FWHM of the line into an expansion velocity of .
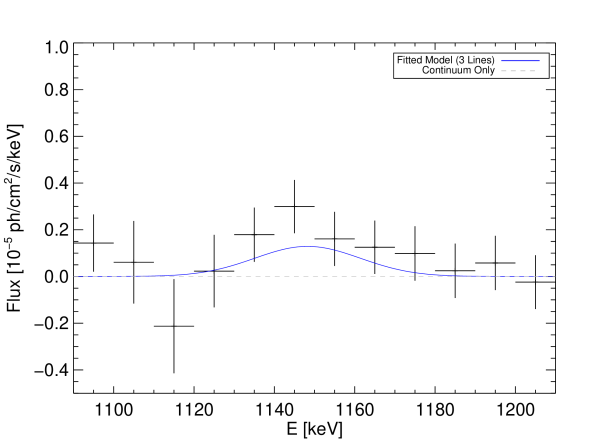
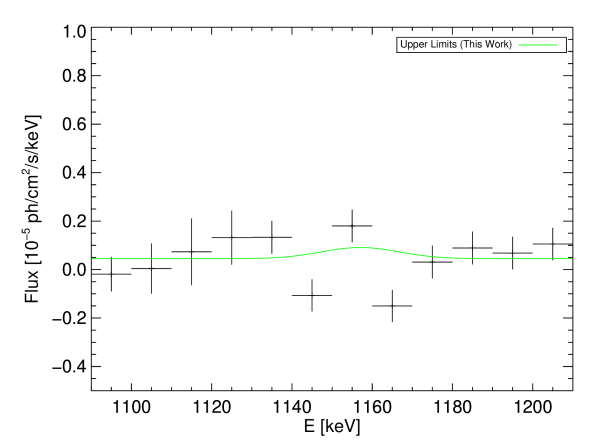
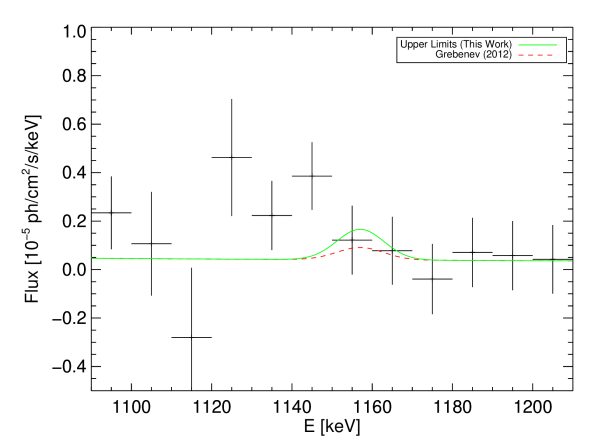
Representing the 1157 keV line with a simple Gaussian on top of the uniform power law, our best fit values suggest a significantly higher flux of . This flux can be overestimated due to the assumption of a single underlying continuum fit across the broad energy range. The continuum flux from our best fit power law (largely determined at energies below 100 keV) in the energy region between 1125 – 1175 keV is , consistent with zero. We estimated the potential offset in the fit continuum flux density by allowing a separate, constant offset in the energy range 1090 – 1210 keV, which accounts for a flux of in the energy region between 1125 – 1175 keV. Therefore, the line flux at 1157 keV can be reduced to . The Gaussian is centered at keV, which is red shifted but compatible with the laboratory-determined energy of 1157 keV. The line width is FWHM. This corresponds to km s-1 expansion velocity.
We find a combined signal with a significance of by simultaneously fitting two lines with identical Doppler shift, Doppler broadening, and integrated flux. The overall Doppler shift of the lines corresponds to a bulk ejecta velocity of . The Doppler broadening for both lines translates to expansion velocity, in agreement with values determined for the 78 keV line alone. Due to the higher relative spectral resolving power of SPI at higher energies, the expansion velocity can be better constrained including the 1157 keV line. The combined fit contains a flux of per line. This higher flux corresponds to a mass of M⊙. Table 2 contains measured line parameters and derived physical quantities.
Even though the uncertainties are high, we also include the 68 keV line in our analysis. However, we adopted the kinematic values determined from the combined 78 and 1157 keV line fit for this line, as the strong fluctuations induced by the strong background lines might lead to an artificial broadening of the line. The 68 keV line is then observed with a single-line significance of 2.2. When linked to a common origin, the total significance for the three fit lines is then increased to .
4.2 SN 1987A
SPI was pointed towards the LMC including SN 1987A for a total of 7 Ms. With SPI’s angular resolution of we cannot distinguish between SN 1987A and other potential or known sources of high energy emission. In particular, the pulsar PSR B0540-69 and the high-mass X-ray binary LMC-X1 are located less than 1∘ apart from SN 1987A. We obtain an average reduced of 1.000 ( 51,716/51,731) per energy bin. In Fig. 9, we show the spectrum obtained from our data for a source located at the position of SN 1987A. We find no significant flux excess in either energy region that could be attributed to the decay chain emission of . Tueller et al. (1990) determined an expansion velocity of from the line profiles of measured radioactive . Assuming co-moving ejecta, we adopted this value to determine upper limits on the flux. In our analysis, we searched for the combined signal of all three lines simultaneously, for which we determined a value of per line, corresponding to an upper mass limit of ejected of for a distance of 49.6 kpc, and a remnant age of 24 yr. No systematically increased flux is observed in the 1157 keV line with respect to the lines at 68 and 78 keV.
4.3 Vela Junior
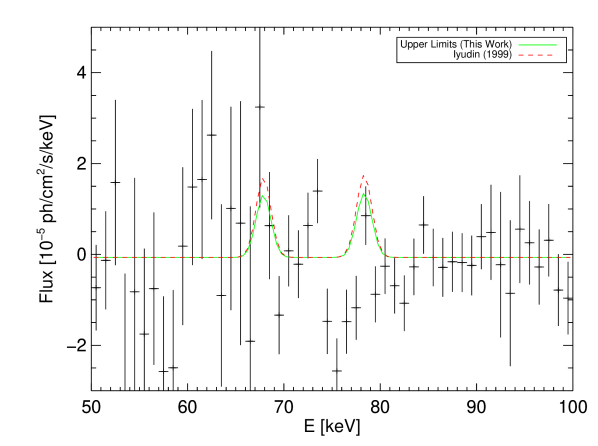
We modeled the supernova remnant as a source of extended emission with a 2D Gaussian emission profile and a diameter of 0.6∘ for the width of the remnant. This means that the 2∘ diameter contains of the expected signal. The obtained fit is satisfactory with a reduced of 0.998 ( 65,423/65,535) per energy bin. We find no signal for the decay of (Fig. 8). We determined a 2 upper limit of for the combined signal of all three lines, assuming no bulk motion and an expansion velocity of . This corresponds to an upper limit for the ejected mass of for the remnant age and distance of 690 yr and 200 pc, respectively. Considering the updated age and distance estimates of 2.4 – 5.1 kyr and pc (Allen et al. 2014), the ejecta mass limits determined from our results significantly increase to a value for the lower age limit of 2.4 kyr.
4.4 Tycho’s supernova remnant
SPI was pointed towards the region containing Tycho’s supernova remnant for a total of 10 Ms. Figures 6 and 7 show the spectra obtained for Tycho in both energy regions relevant for our search. The average reduced is 0.997 ( = 79,982/80,196) per energy bin. We find no significant excess for the emission in the three lines of the decay chain. To determine our upper limits, we adopted an expansion velocity of . This value is in agreement with the expansion velocities found in the central ejecta (Sato & Hughes (2017). We determined a 2 upper limit of for each line in the decay, corresponding to an ejecta-mass limit of for a distance of 4.1 kpc and a remnant age of 438 yr.
4.5 G1.9+0.3
Due to its location close to the Galactic center, several hard X-ray sources (Bird et al. 2016) are present within the 2.7∘ PSF of SPI around the position of G1.9+0.3. No signature for the decay of is expected for these other sources, so it appears a safe assumption that potential flux excess in the 68 and 78 keV regime can be attributed to the emission from G1.9+0.3. The average reduced is 1.011 ( 318,356/315,005). We interpret this as due to the possible presence of unresolved sources in SPI’s field of view in the Galactic central region. The resulting spectra (Figs. 6 and 7) show an underlying continuum from the spatially coincident sources, upon which we search for the imprints of the three decay lines.
We find no significant excess in both energy ranges, determining a corresponding upper limit of for an assumed expansion velocity of for containing ejecta. This translates into a yield of for a remnant age of 120 yr and a distance of 8.5 kpc. Even though this velocity is lower than the expansion of the remnant’s blast wave, we believe our assumption is plausible, as the distribution of the ejecta containing radioactive is uncertain anyway and may consist of clumps as seen for Cassiopeia A.
We determined velocity-dependent limits, which depend on the expected line width for expansion velocities between 0 and . We obtain limits in the range from to , assuming the same Doppler velocities for all three lines.
4.6 Kepler’s supernova remnant
5 Discussion
5.1 Cassiopeia A
For six analyzed supernova remnants, we find significant detection only for Cassiopeia A, with an integrated flux of corresponding to an ejecta mass of .
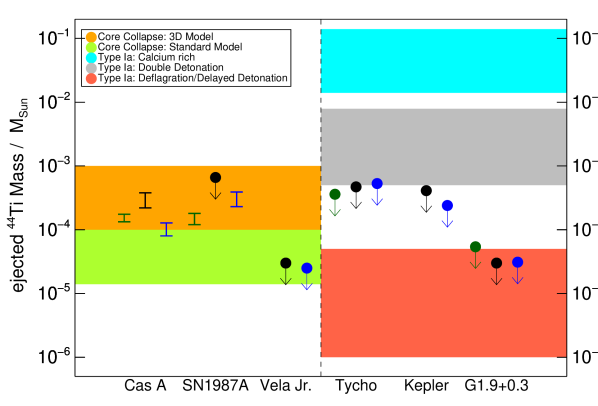
Conventional models of core-collapse supernova explosions (Timmes et al. 1996; Magkotsios et al. 2010), including models specific to the progenitor evolution of Cassiopeia A (Young et al. 2006), suggest ejecta of less than , significantly lower than the amount that we determine for Cassiopeia A. This underproduction of in models is also supported by measurements from other instruments, consistently showing higher ejecta mass for Cassiopeia A ( Siegert et al. 2015) and ( Grefenstette et al. 2017) than the values from models of M⊙ obtained for a star (Timmes et al. 1996; Limongi & Chieffi 2018). Figure 4 shows the expected yield of for various supernova scenarios. The green shaded area represents standard, mostly piston-driven222Models that artificially inject the energy necessary for explosion explosion models, in which nucleosynthesis is calculated by post-processing from the modeled thermodynamic evolution of the remnant. Harris et al. (2017) point out that including nucleosynthesis networks into the simulation, rather than post processing yields, can change the production of alpha nuclei, especially at intermediate mass range A = 36 – 52, by an order of magnitude. The high mass seen in Cassiopeia A shows that a more detailed treatment of explosive nucleosynthesis appears necessary. The 3D model of Wongwathanarat et al. (2017), representing the special case of Cassiopeia A, suggests higher masses, especially considering the clumpy and asymmetric distribution in the supernova remnant. The measured expansion velocity is compatible with models including Rayleigh-Taylor instabilities that lead to large-scale mixing of the inner ejecta with overlying stellar shells in type II-b supernova models (Nomoto et al. 1995). We determined a bulk motion of . This suggests that the bulk of the ejecta is receding from the observer. Both the kinematics and the ejected mass of support the interpretation that Cassiopeia A is an asymmetric supernova explosion. While we determined kinematic constraints from a spectral analysis, other evidence for an asymmetric explosion is provided from the spatially resolved analysis of the remnant with the NuSTAR telescope. Grefenstette et al. (2017) have found that the majority of the -containing ejecta is expelled in a large solid angle, where the bulk of the ejecta moves away from the observer. Our measurements and the resulting velocity spread, determined from the Doppler broadening, is consistent with NuSTAR findings, which suggest a clumped nature of -containing ejecta (Grefenstette et al. 2017). Despite concurring kinematic constraints, we determine a higher integrated flux in the decay lines. Due to the different angular resolutions of the NuSTAR telescope (18” FWHM Harrison et al. 2013) and the SPI spectrometer (2.7∘ FWHM Vedrenne et al. 2003), different spherical surface areas for the integration of the flux are considered in both analyses. Grefenstette et al. (2017) considered the flux of an integrated emission from a region of 120” radius centered on Cassiopeia A, containing all spatial points in which emission from decay is detected in their analysis, and they gave upper limits on regions outside the 120” radius. X-ray measurements both suggest a forward shock radius of 153” (Gotthelf et al. 2001) and the presence of iron at radii between 110” – 170” (Willingale et al. 2002). Co-moving can be present at large radii extending as far outwards as the observed iron distribution. Flux from these unresolved regions contributes to the total flux of the emission. Within the SPI’s angular resolution, the entire surface area of the remnant is included, constituting the increased integrated flux we measured in our analysis. The increased line-of-sight beam width in SPI of 2.7∘ FWHM also includes areas outside of the supernova remnant. This also means that unresolved or previously unknown sources can contribute to the total flux in SPI measurements.
For the first time, we also identified a very broad decay signature in the high-energy decay line at 1157 keV, which also reveals the kinematic evolution of the supernova remnant. We determine an expansion velocity of and a line that is not significantly redshifted with . This line contains an integrated flux of (9.53.0) ((6.43.4)). A systematic offset of the high-energy line has been also observed with COMPTEL (Iyudin 1999) and with earlier SPI data (Siegert et al. 2015), however with less exposure on Cassiopeia A. In contrast to our updated values, Siegert et al. (2015) provided a more constraining expansion velocity and an overall different kinematic behavior of decay in comparison to the 78 keV line for a line centered at . As shown by Grefenstette et al. (2017) 44Ti is ejected in clumps in Cassiopeia A. Each clump translates into a separate peak in the energy range between 1130 – 1180 keV, which blends into a broadened line. We described the entire emission by one Gaussian, which captures the overall expansion of the entire remnant. The line measured by Siegert et al. (2015) in the narrow energy window around 1157 keV only captures parts, or one separate ejecta clump, of the total emission in the 1157 keV regime. We find an increased flux in the 1157 keV line, that cannot be explained by systematic effects alone. We speculate that the flux included in this line could be enhanced for different reasons: 1) Excitation of the nuclear transition in , in addition to the decay of . Interaction with ambient material can lead to excitation of the nucleus. An excitation of the stable nucleus by cosmic rays in the shock region of the supernova envelope might thus contribute to the flux in the 1157 keV line. This mechanism would only influence the flux of the line, as the half life of is too short for efficient cosmic-ray-induced excitation. More analysis, in particular of other candidate nuclear de-excitation lines, is required to support this hypothesis. The most promising approach would be the detection of the de-excitation lines at 4.4 MeV and 6.1 MeV, which are the most prominent de-excitation lines caused by cosmic ray interaction in the shock front (Summa et al. 2011). A first search for these lines shows that flux values as high as those suggested by Summa et al. (2011) can be excluded. 2) McKinnon et al. (2016) pointed out that two thirds of dust in the Milky Way-like galaxies can be produced by type II supernova events. The presence of dust grains composed of ejecta material in the vicinity of the supernova remnant or in the line of sight towards the supernova remnant can alter the observed flux ratios beyond the branching ratios. Attenuation coefficients for 68 and 78 keV photons are higher than for the 1157 keV line (Iyudin et al. 2019) for common dust grain compositions. Including correction for branching ratios, we derived the following flux ratio:
| (4) |
This suggests that 16 – 80 of the emission in the 78 keV line could be absorbed by dust, located between INTEGRAL and Cassiopeia A. 3) The assumption of a Gaussian-shaped line for the total emission does not correctly represent the ejecta kinematics as found in Cassiopeia A. This can artificially lead to an increased flux in the 1157 keV line.
5.2 SN 1987A
We determine an upper limit of per decay line, assuming all lines share identical Doppler characteristics. We attribute this flux to the decay of , corresponding to an upper ejecta mass limit of for a remnant age of 24 yr and a distance of 49.6 kpc. We find no evidence for a systematically increased flux in the high energy line at 1157 keV. Assuming that the ejecta are contained in the central region of the supernova, the expansion velocity of the ejecta should be lower than (McCray 2017). In addition to an upper limit determined from the combined three lines, we give upper limits only for the 1157 keV line for expansion velocities corresponding to the interior of the supernova core (). For this velocity range, we determine flux limits that range between . The flux limit we derived for the decay chain combined fit is compatible with direct detection of , as found by IBIS/INTEGRAL and NuSTAR (Grebenev et al. 2012; Boggs et al. 2015). Both analyses suggest narrow line broadening, which is compatible with slowly expanding ejecta. Given the NuSTAR and IBIS/INTEGRAL fluxes, a significant offset in flux of the 1157 keV line, either from less efficient absorption at higher energies or from an additional excitation, as seen in Cassiopeia A, should be detectable, albeit with small significance, within the SPI’s sensitivity.
5.3 Vela Junior
Vela Jr. still poses a mystery 20 yr after the serendipitous detection of gamma-ray emission in the 1157 keV line by COMPTEL (Iyudin et al. 1998). Our upper limit of ph cm-2 s-1 assumes an extended source for the combined signal in all three decay lines, excluding a signal at the level reported by Iyudin et al. (1998) from COMPTEL data. Emission at the COMPTEL level was also excluded from the nondetection of the scandium fluorescence line Slane et al. (2001). More recent studies with IBIS/INTEGRAL (Tsygankov et al. 2016) found no excess in the energy bands of the 68 and 78 keV lines, with an upper limit for the flux of ph cm-2 s-1, which excludes the COMPTEL detection. Tsygankov et al. (2016) point out that they considered the remnant as a point-like source neglecting the apparent 2∘ diameter of the remnant. Measurements of the radial displacement in the northern rim of Vela Jr. suggest that the remnant age is (Allen et al. 2014) at a distance of , which is in contrast with the 0.7 kyr age and 200 pc distance estimates discussed by Iyudin et al. (1998). Our results substantiate the higher age and larger distance.
5.4 Tycho’s supernova remnant
Our upper limit of for the Tycho supernova remnant is in agreement with the upper limits determined with NuSTAR and INTEGRAL/IBIS (Wang & Li 2014; Lopez et al. 2015) of for moderate expansion velocities, with spatially distributed over the entire remnant. However, detection has been claimed from observations with Swift/BAT (Troja et al. 2014) at a flux of and for the 68 and 78 keV lines, respectively. For an assumed distance of 4.1 kpc, the upper limits correspond to an ejecta mass of the order of of . Lopez et al. (2015) provided an ejecta-mass upper limit of of for a distance of 2.3 kpc. In all cases, we can exclude the double detonation and Ca-rich models as explosion scenario for this type Ia explosion remnant. The results are, however, in agreement with delayed detonation models. This model may be favored as it best reproduces the measured X-ray spectra from Tycho (Badenes et al. 2006).
5.5 G1.9+0.3
We find no significant excess of line emission at the position of the supernova remnant G1.9+0.3. We determine an upper flux limit of . This translates into a mass limit of at a distance of 8.5 kpc and a remnant age of 120 yr, which excludes both double detonation and Ca-rich models for this candidate type Ia explosion. Predictions for classical delayed detonation models (Maeda et al. 2010) suggest less than M⊙ of , which would be in agreement with our results. We compare our results with the signal detected by Borkowski et al. (2010). Using Chandra data, they reported a line at 4.1 keV, which they attribute to a fluorescence transition in following the electron capture decay on . Their inferred mass of of ejected translates into a flux of in the decay lines at 68, 78, and 1157 keV. Our upper limits ( to ) are in conflict with the extrapolated fluxes () expected from the fluorescence line for expansion velocity below 15000 km s-1. The discrepancy between the 4.1 keV fluorescence line and the decay emission at hard X-ray energies suggests that the fluorescence line is not necessarily produced from the decay of alone. Since the line is produced by the emission of a K photon, which is independent of the scandium isotope, other stable isotopes (e.g., ) co-produced in the supernova explosion can contribute to the fluorescence emission at 4.1 keV.
Zoglauer et al. (2015) determined a 2 upper limit for the flux in the 68 keV line of ph cm-2 s-1 for a non-shifted line with a 4 keV width (1), using measurements of the NuSTAR telescope. Results from the IBIS telescope (Tsygankov et al. 2016) yield a 3 upper limit of ph cm-2 s-1.
5.6 Kepler’s supernova remnant
We determined a flux limit for Kepler of ph cm-2 s-1. The derived mass limit disagrees with the double detonation and Ca-rich scenario; however, due to the uncertain distance to the remnant, ranging between 4.4 kpc and 5.9 kpc, the double detonation scenario cannot be explicitly excluded. Our result is in agreement with the nondetection of emission with the COMPTEL and IBIS instrument (Iyudin 1999; Dupraz et al. 1997; Tsygankov et al. 2016).
5.7 Implications for supernova models
The detection of in only one Galactic supernova remnant provides a striking and significant conclusion regarding supernovae in the Galaxy. With an average core-collapse supernova rate of (Diehl et al. 2006; van den Bergh & Tammann 1991), and current understanding of nucleosynthesis in supernovae, five supernova remnants with a -decay line flux of more than are expected to be visible in the Galaxy. Detection of a single remnant at the position of Cassiopeia A is unlikely, with a probability of less than 2.7% (The et al. 2006; Dufour & Kaspi 2013). With the high mass measured in Cassiopeia A (and also SN 1987A), it is possible that the 44Ca content in the Galaxy is produced by a few, rare, producing supernovae. It is possible that both Cassiopeia A and SN 1987A are the prototypes for asymmetric explosions producing a high ejecta mass, whereas the majority of core-collapse supernovae explode in a more symmetric scenario, producing less ejecta.
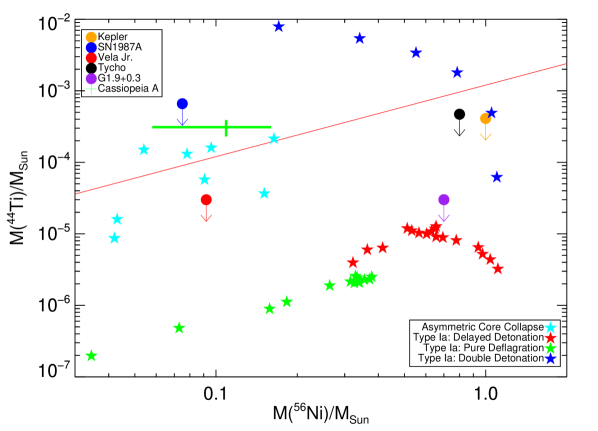
We use the solar abundance value (Anders & Grevesse 1989) of the 44Ca to 56Fe ratio, which are the end products of the 44Ti and 56Ni decay chain respectively, as another criterion to judge supernova model types, assuming that each of those supernova types would be the sole source of 44Ca and 56Fe as found in the Sun. Figure. 5 shows the 44Ti to 56Ni ratio of the candidate sources in our analysis (dot symbols), together with modeled values for several supernova types (star symbols), and the solar 44Ca to 56Fe ratio (red line).
For Vela Jr., we adopted a 56Ni ejecta-mass estimate from the explosion model of a 25 M⊙ (Maeda & Nomoto 2003). We note that the values for Vela Jr. may deviate from the solar ratio due to the assumed distance and age (200 pc; 690 yr), which underestimates the updated values determined by Allen et al. (2014). The ejected 56Ni mass for Cassiopeia A is inferred from near-infrared spectral analysis (Eriksen et al. 2009). For SN 1987A, we used the ejecta-mass estimate based on the early bolometric light curve by Woosley et al. (1987). For type Ia supernova remnant candidates, 56Ni masses are obtained from Badenes et al. (2006, Tycho), Patnaude et al. (2012, Kepler), and Borkowski et al. (2013, G1.9+0.3), who inferred ejecta masses by comparing measured X-ray spectra with long-term simulated remnant models.
We infer from Fig. 5 that the measured 44Ti-to-56Ni ratios of Cassiopeia A and SN 1987A are plausibly consistent with asymmetric core-collapse supernova models being responsible for the solar abundance ratio.
In contrast, the majority of type Ia supernova scenarios do not plausibly reproduce the measured solar 44Ca to 56Fe ratio. Type Ia supernovae appear to consistently produce a ejecta mass between M⊙ (Dhawan et al. 2016; Wang et al. 2008; Stritzinger et al. 2006). In model calculations, nucleosynthesis yields of intermediate mass elements (such as ) are highly dependent on physical conditions during nuclear burning. In centrally ignited, pure-deflagration, and delayed-detonation scenarios, nucleosynthesis occurs mainly in a high-density regime, producing only a small amount of , while the majority of nuclear fuel is completely burned to iron group elements (Seitenzahl et al. 2013; Fink et al. 2014). On the other hand, nucleosynthesis in double-detonation supernova scenarios also occurs during the initial burning of the surface helium layer at lower densities, allowing for the production of large amounts of on the surface (Fink et al. 2010; Sim et al. 2012). Pure-deflagration and delayed-detonation type Ia supernovae (green and red star symbols, Fig.5) therefore could not be major contributors to solar 44Ca, while double detonation supernovae (blue star symbols in Fig.5) could. Our constraints for all three candidate remnants of type Ia supernovae show that they cannot be sole sources of the solar abundance of 44Ca and 56Fe together.
Under the assumption that core-collapse supernovae are, in general, responsible for the solar [ ratio, we can use our limits and the average simulated and yields to constrain type Ia sub-type rates: We obtain a ratio of delayed detonation/deflagration to double detonation events, necessary to maintain and not violate the solar ratio.
| Cassiopeia A | SN 1987A | Vela Jr | Tycho | Kepler | G1.9+0.3 | |
|---|---|---|---|---|---|---|
| Flux ph cm-2 s-1] | 9.53.0 | ¡4.1 | ¡4.7 | ¡6.2 | ¡2.6 | ¡3.7 |
| Flux ph cm-2 s-1] | 3.30.9 | ¡1.9 | ¡2.8 | ¡1.5 | ¡1.3 | ¡1.1 |
| Flux Comb ph cm-2 s-1] | 4.21.0 | ¡1.8 | ¡2.1 | ¡1.4 | ¡1.1 | ¡1.0 |
| Mass Comb [ M⊙] | 2.60.6 | ¡6.9 | ¡0.3 | ¡4.8 | ¡4.0 | ¡0.3 |
| \hdashlineNuSTAR ph cm-2 s-1] | 1.80.3 (1) | 0.350.07 (3) | – | ¡1.0 (5) | – | ¡1.5 (7) |
| Integral/IBIS ph cm-2 s-1] | 1.30.3 (2) | 1.70.4 (4) | ¡1.8 (2) | ¡1.5 (6) | ¡0.63 (2) | ¡0.9 (2) |
5.8 Summary
In this work, we searched for the signature of gamma rays produced in the decay chain of in the six young nearby supernova remnants Cassiopeia A, SN 1987A, Vela Jr., Tycho’s supernova, Kepler’s supernova, and G1.9+0.3. In Tab. 3, we list the mass estimates we derived from SPI/INTEGRAL data acquired over the entire mission duration of 17 yr.
We only detect emission in the supernova remnant Cassiopeia A. Inferred masses of more than M⊙ ejected exceed theoretical predictions. Upper limits determined for Vela Jr. exclude the detection of the decay line found with COMPTEL by Iyudin (1999). The detection of hard X-ray lines in SN 1987A (Grebenev et al. 2012; Boggs et al. 2015) cannot be confirmed.
We exclude models predicting high yields of such as the double-detonation models and Ca-rich explosion (Waldman et al. 2011; Perets et al. 2010) model for the three Galactic thermonuclear supernova remnants G1.9+0.3, Tycho, and Kepler.
Acknowledgements.
The INTEGRAL/SPI project has been completed under the responsibility and leadership of CNESS; we are grateful to ASI,CEA, CNES, DLR (Nos. 50OG 1101 and 1601), ESA, INTA, NASA and OSTC for support of this ESA space science mission. Thomas Siegert is supported by the German Research Society (DFG-Forschungsstipendium SI 2502/1-1)References
- Aharonian et al. (2007) Aharonian, F., Akhperjanian, A. G., Bazer-Bachi, A. R., et al. 2007, ApJ, 661, 236
- Ahmad et al. (2006) Ahmad, I., Greene, J. P., Moore, E. F., et al. 2006, Physical Review C, 74
- Alarie et al. (2014) Alarie, A., Bilodeau, A., & Drissen, L. 2014, MNRAS, 441, 2996
- Albinson et al. (1986) Albinson, J. S., Tuffs, R. J., Swinbank, E., & Gull, S. F. 1986, Monthly Notices of the Royal Astronomical Society, 219, 427
- Allen et al. (2014) Allen, G. E., Chow, K., DeLaney, T., et al. 2014, The Astrophysical Journal, 798, 82
- Anders & Grevesse (1989) Anders, E. & Grevesse, N. 1989, Geochimica et Cosmochimica Acta, 53, 197
- Andrae et al. (2010) Andrae, R., Schulze-Hartung, T., & Melchior, P. 2010, arXiv e-prints, arXiv:1012.3754
- Aschenbach (1998) Aschenbach, B. 1998, Nature, 396, 141
- Aschenbach et al. (1999) Aschenbach, B., Iyudin, A. F., & Schönfelder, V. 1999, A&A, 350, 997
- Audi et al. (2003) Audi, G., Bersillon, O., Blachot, J., & Wapstra, A. H. 2003, Nuclear Physics A, 729, 3
- Badenes et al. (2006) Badenes, C., Borkowski, K. J., Hughes, J. P., Hwang, U., & Bravo, E. 2006, The Astrophysical Journal, 645, 1373
- Beckmann et al. (2004) Beckmann, V., Gehrels, N., Favre, P., et al. 2004, ApJ, 614, 641
- Bird et al. (2016) Bird, A. J., Bazzano, A., Malizia, A., et al. 2016, VizieR Online Data Catalog, J/ApJS/223/15
- Blondin & Shaw (2007) Blondin, J. M. & Shaw, S. 2007, The Astrophysical Journal, 656, 366
- Boggs et al. (2015) Boggs, S. E., Harrison, F. A., Miyasaka, H., et al. 2015, Science, 348, 670
- Borkowski et al. (2010) Borkowski, K. J., Reynolds, S. P., Green, D. A., et al. 2010, ApJ, 724, L161
- Borkowski et al. (2013) Borkowski, K. J., Reynolds, S. P., Hwang, U., et al. 2013, ApJ, 771, L9
- Bouchet et al. (2015) Bouchet, L., Jourdain, E., & Roques, J.-P. 2015, ApJ, 801, 142
- Bruenn et al. (2016) Bruenn, S. W., Lentz, E. J., Hix, W. R., et al. 2016, The Astrophysical Journal, 818, 123
- Bruenn et al. (2013) Bruenn, S. W., Mezzacappa, A., Hix, W. R., et al. 2013, The Astrophysical Journal, 767, L6
- Buras et al. (2006) Buras, R., Rampp, M., Janka, H. T., & Kifonidis, K. 2006, A&A, 447, 1049
- Burrows et al. (2018) Burrows, A., Vartanyan, D., Dolence, J. C., Skinner, M. A., & Radice, D. 2018, Space Science Reviews, 214
- Cash (1979) Cash, W. 1979, ApJ, 228, 939
- Chen et al. (2011) Chen, J., Singh, B., & Cameron, J. A. 2011, Nuclear Data Sheets, 112, 2357
- Chen et al. (2014) Chen, M. C., Herwig, F., Denissenkov, P. A., & Paxton, B. 2014, Monthly Notices of the Royal Astronomical Society, 440, 1274
- Dhawan et al. (2016) Dhawan, S., Leibundgut, B., Spyromilio, J., & Blondin, S. 2016, Astronomy & Astrophysics, 588, A84
- Diehl et al. (2006) Diehl, R., Halloin, H., Kretschmer, K., et al. 2006, Nature, 439, 45
- Diehl et al. (2018) Diehl, R., Siegert, T., Greiner, J., et al. 2018, A&A, 611, A12
- Dubath et al. (2005) Dubath, P., Knödlseder, J., Skinner, G. K., et al. 2005, Monthly Notices of the Royal Astronomical Society, 357, 420
- Dufour & Kaspi (2013) Dufour, F. & Kaspi, V. M. 2013, The Astrophysical Journal, 775, 52
- Dupraz et al. (1997) Dupraz, C., Bloemen, H., Bennett, K., et al. 1997, A&A, 324, 683
- Eriksen et al. (2009) Eriksen, K. A., Arnett, D., McCarthy, D. W., & Young, P. 2009, ApJ, 697, 29
- Fink et al. (2014) Fink, M., Kromer, M., Seitenzahl, I. R., et al. 2014, MNRAS, 438, 1762
- Fink et al. (2010) Fink, M., Röpke, F. K., Hillebrandt, W., et al. 2010, A&A, 514, A53
- Firestone et al. (2003) Firestone, R. B., REVAY, Z., & MOLNAR, G. L. 2003, in Capture Gamma-Ray Spectroscopy and Related Topics (WORLD SCIENTIFIC)
- Fryer & Kusenko (2006) Fryer, C. L. & Kusenko, A. 2006, The Astrophysical Journal Supplement Series, 163, 335
- Gall et al. (2015) Gall, E. E. E., Polshaw, J., Kotak, R., et al. 2015, A&A, 582, A3
- Gotthelf et al. (2001) Gotthelf, E. V., Koralesky, B., Rudnick, L., et al. 2001, The Astrophysical Journal, 552, L39
- Grebenev et al. (2012) Grebenev, S. A., Lutovinov, A. A., Tsygankov, S. S., & Winkler, C. 2012, Nature, 490, 373
- Grefenstette et al. (2017) Grefenstette, B. W., Fryer, C. L., Harrison, F. A., et al. 2017, ApJ, 834, 19
- Grefenstette et al. (2014) Grefenstette, B. W., Harrison, F. A., Boggs, S. E., et al. 2014, Nature, 506, 339
- Hachisu et al. (2011) Hachisu, I., Kato, M., Saio, H., & Nomoto, K. 2011, The Astrophysical Journal, 744, 69
- Halloin (2009) Halloin, H. 2009, —spimodfit— Explanatory Guide and Users Manual, version 2.9 edn., Max Planck Institut für extraterrestrische Physik, Giessenbachstraße 1, 85748 Garching, Germany
- Harris et al. (2017) Harris, J. A., Hix, W. R., Chertkow, M. A., et al. 2017, The Astrophysical Journal, 843, 2
- Harrison et al. (2013) Harrison, F. A., Craig, W. W., Christensen, F. E., et al. 2013, The Astrophysical Journal, 770, 103
- Hayato et al. (2010) Hayato, A., Yamaguchi, H., Tamagawa, T., et al. 2010, The Astrophysical Journal, 725, 894
- Hillebrandt et al. (2013) Hillebrandt, W., Kromer, M., Röpke, F. K., & Ruiter, A. J. 2013, Frontiers of Physics, 8, 116
- Hix et al. (2016) Hix, W., Lentz, E., Bruenn, S., et al. 2016, Acta Physica Polonica B, 47, 645
- Iwakami et al. (2014) Iwakami, W., Nagakura, H., & Yamada, S. 2014, The Astrophysical Journal, 793, 5
- Iyudin (1999) Iyudin, A. 1999, Nuclear Physics A, 654, 900c
- Iyudin et al. (2005) Iyudin, A. F., Aschenbach, B., Becker, W., Dennerl, K., & Haberl, F. 2005, A&A, 429, 225
- Iyudin et al. (1994) Iyudin, A. F., Diehl, R., Bloemen, H., et al. 1994, A&A, 284, L1
- Iyudin et al. (2019) Iyudin, A. F., Müller, E., & Obergaulinger, M. 2019, Monthly Notices of the Royal Astronomical Society, 485, 3288
- Iyudin et al. (1998) Iyudin, A. F., Schönfelder, V., Bennett, K., et al. 1998, Nature, 396, 142
- Janka (2012) Janka, H.-T. 2012, Annual Review of Nuclear and Particle Science, 62, 407
- Jean et al. (2003) Jean, P., Vedrenne, G., Roques, J. P., et al. 2003, Astronomy & Astrophysics, 411, L107
- Jerkstrand et al. (2015) Jerkstrand, A., Timmes, F. X., Magkotsios, G., et al. 2015, The Astrophysical Journal, 807, 110
- Kashyap et al. (2018) Kashyap, R., Haque, T., Lorén-Aguilar, P., García-Berro, E., & Fisher, R. 2018, The Astrophysical Journal, 869, 140
- Knödlseder et al. (2004) Knödlseder, J., Valsesia, M., Allain, M., et al. 2004 [astro-ph/0405501v1]
- Krause et al. (2008a) Krause, O., Birkmann, S. M., Usuda, T., et al. 2008a, Science, 320, 1195
- Krause et al. (2008b) Krause, O., Tanaka, M., Usuda, T., et al. 2008b, Nature, 456, 617
- Kretschmer (2011) Kretschmer, K. 2011, PhD thesis, Technische Universität München, Garching bei München, Online available at: https://https://mediatum.ub.tum.de/1074263
- Leung & Nomoto (2020) Leung, S.-C. & Nomoto, K. 2020, The Astrophysical Journal, 888, 80
- Limongi & Chieffi (2018) Limongi, M. & Chieffi, A. 2018, ApJS, 237, 13
- Livne (1990) Livne, E. 1990, The Astrophysical Journal, 354, L53
- Lopez et al. (2015) Lopez, L. A., Grefenstette, B. W., Reynolds, S. P., et al. 2015, ApJ, 814, 132
- Maeda & Nomoto (2003) Maeda, K. & Nomoto, K. 2003, The Astrophysical Journal, 598, 1163
- Maeda et al. (2010) Maeda, K., Röpke, F. K., Fink, M., et al. 2010, ApJ, 712, 624
- Magkotsios et al. (2010) Magkotsios, G., Timmes, F. X., Hungerford, A. L., et al. 2010, ApJS, 191, 66
- Maguire et al. (2018) Maguire, K., Sim, S. A., Shingles, L., et al. 2018, Monthly Notices of the Royal Astronomical Society, 477, 3567
- Marek & Janka (2009) Marek, A. & Janka, H.-T. 2009, The Astrophysical Journal, 694, 664
- Matz et al. (1988) Matz, S., Share, G., Leising, M., et al. 1988, Nature, 331, 416
- McCray (2017) McCray, R. 2017, in Handbook of Supernovae (Springer International Publishing), 1–30
- McKinnon et al. (2016) McKinnon, R., Torrey, P., & Vogelsberger, M. 2016, Monthly Notices of the Royal Astronomical Society, 457, 3775
- Melson et al. (2015) Melson, T., Janka, H.-T., Bollig, R., et al. 2015, The Astrophysical Journal, 808, L42
- Miceli et al. (2015) Miceli, M., Sciortino, S., Troja, E., & Orlando, S. 2015, ApJ, 805, 120
- Müller et al. (2017) Müller, B., Melson, T., Heger, A., & Janka, H.-T. 2017, Monthly Notices of the Royal Astronomical Society, 472, 491
- Moll & Woosley (2013) Moll, R. & Woosley, S. E. 2013, ApJ, 774, 137
- Mori et al. (2018) Mori, K., Famiano, M. A., Kajino, T., et al. 2018, The Astrophysical Journal, 863, 176
- Nomoto et al. (1984) Nomoto, K., Thielemann, F.-K., & Yokoi, K. 1984, The Astrophysical Journal, 286, 644
- Nomoto et al. (1995) Nomoto, K. I., Iwamoto, K., & Suzuki, T. 1995, Phys. Rep, 256, 173
- Orlando et al. (2016) Orlando, S., Miceli, M., Pumo, M. L., & Bocchino, F. 2016, The Astrophysical Journal, 822, 22
- Pakmor et al. (2010) Pakmor, R., Kromer, M., Röpke, F. K., et al. 2010, Nature, 463, 61
- Pakmor et al. (2013) Pakmor, R., Kromer, M., Taubenberger, S., & Springel, V. 2013, The Astrophysical Journal, 770, L8
- Pan et al. (2016) Pan, K.-C., Liebendörfer, M., Hempel, M., & Thielemann, F.-K. 2016, The Astrophysical Journal, 817, 72
- Parthasarathy et al. (2007) Parthasarathy, M., Branch, D., Jeffery, D. J., & Baron, E. 2007, New Astronomy Reviews, 51, 524
- Patnaude et al. (2012) Patnaude, D. J., Badenes, C., Park, S., & Laming, J. M. 2012, The Astrophysical Journal, 756, 6
- Perets et al. (2010) Perets, H. B., Gal-Yam, A., Mazzali, P. A., et al. 2010, Nature, 465, 322
- Phillips et al. (1999) Phillips, M. M., Lira, P., Suntzeff, N. B., et al. 1999, The Astronomical Journal, 118, 1766
- Pietrzyński et al. (2019) Pietrzyński, G., Graczyk, D., Gallenne, A., et al. 2019, Nature, 567, 200
- Plüschke et al. (2001) Plüschke, S., Diehl, R., Schönfelder, V., et al. 2001, in ESA Special Publication, Vol. 459, Exploring the Gamma-Ray Universe, ed. A. Gimenez, V. Reglero, & C. Winkler, 55–58
- Reed et al. (1995) Reed, J. E., Hester, J. J., Fabian, A. C., & Winkler, P. F. 1995, ApJ, 440, 706
- Reynolds et al. (2008) Reynolds, S. P., Borkowski, K. J., Green, D. A., et al. 2008, ApJ, 680, L41
- Reynolds et al. (2007) Reynolds, S. P., Borkowski, K. J., Hwang, U., et al. 2007, ApJ, 668, L135
- Ruiter et al. (2012) Ruiter, A. J., Sim, S. A., Pakmor, R., et al. 2012, Monthly Notices of the Royal Astronomical Society, 429, 1425
- Sankrit et al. (2016) Sankrit, R., Raymond, J. C., Blair, W. P., et al. 2016, ApJ, 817, 36
- Sato & Hughes (2017) Sato, T. & Hughes, J. P. 2017, ApJ, 840, 112
- Seitenzahl et al. (2013) Seitenzahl, I. R., Ciaraldi-Schoolmann, F., Röpke, F. K., et al. 2013, MNRAS, 429, 1156
- Seitenzahl et al. (2014) Seitenzahl, I. R., Timmes, F. X., & Magkotsios, G. 2014, ApJ, 792, 10
- Shen & Bildsten (2014) Shen, K. J. & Bildsten, L. 2014, The Astrophysical Journal, 785, 61
- Siegert (2017) Siegert, T. 2017, PhD thesis, Technische Universität München, Garching bei München, Online available at: https://mediatum.ub.tum.de/1340342
- Siegert & Diehl (2017) Siegert, T. & Diehl, R. 2017, in 14th International Symposium on Nuclei in the Cosmos (NIC2016), ed. S. Kubono, T. Kajino, S. Nishimura, T. Isobe, S. Nagataki, T. Shima, & Y. Takeda, 020305
- Siegert et al. (2016) Siegert, T., Diehl, R., Khachatryan, G., et al. 2016, Astronomy & Astrophysics, 586, A84
- Siegert et al. (2015) Siegert, T., Diehl, R., Krause, M. G. H., & Greiner, J. 2015, A&A, 579, A124
- Siegert et al. (2019) Siegert, T., Diehl, R., Weinberger, C., et al. 2019, Astronomy & Astrophysics, 626, A73
- Sim et al. (2012) Sim, S. A., Fink, M., Kromer, M., et al. 2012, Monthly Notices of the Royal Astronomical Society, 420, 3003
- Skinner et al. (2016) Skinner, M. A., Burrows, A., & Dolence, J. C. 2016, The Astrophysical Journal, 831, 81
- Slane et al. (2001) Slane, P., Hughes, J. P., Edgar, R. J., et al. 2001, ApJ, 548, 814
- Slane et al. (2014) Slane, P., Lee, S.-H., Ellison, D. C., et al. 2014, ApJ, 783, 33
- Stritzinger et al. (2006) Stritzinger, M., Mazzali, P. A., Sollerman, J., & Benetti, S. 2006, Astronomy & Astrophysics, 460, 793
- Strong et al. (2005) Strong, A. W., Diehl, R., Halloin, H., et al. 2005, Astronomy & Astrophysics, 444, 495
- Summa et al. (2011) Summa, A., Elsässer, D., & Mannheim, K. 2011, A&A, 533, A13
- Summa et al. (2016) Summa, A., Hanke, F., Janka, H.-T., et al. 2016, The Astrophysical Journal, 825, 6
- Summa et al. (2018) Summa, A., Janka, H.-T., Melson, T., & Marek, A. 2018, ApJ, 852, 28
- Takiwaki et al. (2012) Takiwaki, T., Kotake, K., & Suwa, Y. 2012, ApJ, 749, 98
- Takiwaki et al. (2016) Takiwaki, T., Kotake, K., & Suwa, Y. 2016, Monthly Notices of the Royal Astronomical Society: Letters, 461, L112
- The et al. (2006) The, L.-S., Clayton, D. D., Diehl, R., et al. 2006, Astronomy & Astrophysics, 450, 1037
- Timmes et al. (1996) Timmes, F. X., Woosley, S. E., Hartmann, D. H., & Hoffman, R. D. 1996, ApJ, 464, 332
- Troja et al. (2014) Troja, E., Segreto, A., La Parola, V., et al. 2014, ApJ, 797, L6
- Tsunemi et al. (2000) Tsunemi, H., Miyata, E., Aschenbach, B., Hiraga, J., & Akutsu, D. 2000, Publications of the Astronomical Society of Japan, 52, 887
- Tsygankov et al. (2016) Tsygankov, S. S., Krivonos, R. A., Lutovinov, A. A., et al. 2016, MNRAS, 458, 3411
- Tueller et al. (1990) Tueller, J., Barthelmy, S., Gehrels, N., et al. 1990, ApJ, 351, L41
- van den Bergh & Tammann (1991) van den Bergh, S. & Tammann, G. A. 1991, Annual Review of Astronomy and Astrophysics, 29, 363
- van Kerkwijk et al. (2010) van Kerkwijk, M. H., Chang, P., & Justham, S. 2010, The Astrophysical Journal, 722, L157
- Vedrenne et al. (2003) Vedrenne, G., Roques, J.-P., Schönfelder, V., et al. 2003, A&A, 411, L63
- Vink (2004) Vink, J. 2004, New Astronomy Reviews, 48, 61
- Vink et al. (2001) Vink, J., Laming, J. M., Kaastra, J. S., et al. 2001, ApJ, 560, L79
- Völk et al. (2008) Völk, H. J., Berezhko, E. G., & Ksenofontov, L. T. 2008, Astronomy & Astrophysics, 483, 529
- Waldman et al. (2011) Waldman, R., Sauer, D., Livne, E., et al. 2011, The Astrophysical Journal, 738, 21
- Wang & Han (2012) Wang, B. & Han, Z. 2012, New Astronomy Reviews, 56, 122
- Wang et al. (2008) Wang, B., Meng, X.-C., Wang, X.-F., & Han, Z.-W. 2008, Chinese Journal of Astronomy and Astrophysics, 8, 71
- Wang & Li (2014) Wang, W. & Li, Z. 2014, The Astrophysical Journal, 789, 123
- Willingale et al. (2002) Willingale, R., Bleeker, J. A. M., van der Heyden, K. J., Kaastra, J. S., & Vink, J. 2002, Astronomy & Astrophysics, 381, 1039
- Winkler et al. (2003) Winkler, C., Courvoisier, T. J.-L., Di Cocco, G., et al. 2003, A&A, 411, L1
- Wongwathanarat et al. (2017) Wongwathanarat, A., Janka, H.-T., Müller, E., Pllumbi, E., & Wanajo, S. 2017, ApJ, 842, 13
- Wongwathanarat et al. (2015) Wongwathanarat, A., Müller, E., & Janka, H.-T. 2015, Astronomy & Astrophysics, 577, A48
- Woosley et al. (1973) Woosley, S. E., Arnett, W. D., & Clayton, D. D. 1973, ApJS, 26, 231
- Woosley & Kasen (2011) Woosley, S. E. & Kasen, D. 2011, ApJ, 734, 38
- Woosley et al. (1987) Woosley, S. E., Pinto, P. A., Martin, P. G., & Weaver, T. A. 1987, The Astrophysical Journal, 318, 664
- Woosley & Weaver (1995) Woosley, S. E. & Weaver, T. A. 1995, The Astrophysical Journal Supplement Series, 101, 181
- Young et al. (2006) Young, P. A., Fryer, C. L., Hungerford, A., et al. 2006, ApJ, 640, 891
- Zoglauer et al. (2015) Zoglauer, A., Reynolds, S. P., An, H., et al. 2015, ApJ, 798, 98
Appendix A Additional supernovae spectra
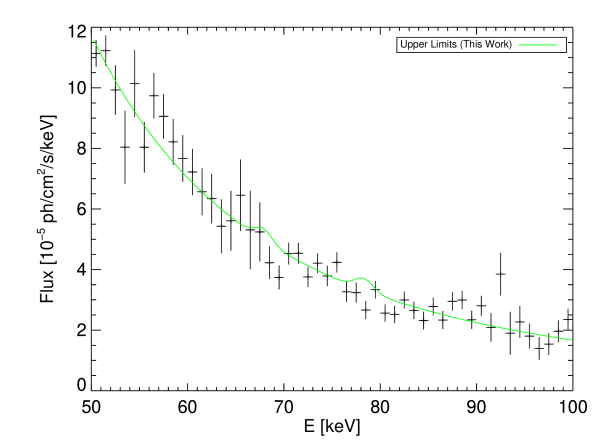
Figures 6, 7, 8, and 9 contain the spectra of the supernova remnants G1.9+0.3, Tycho, Kepler, Vela Jr., and SN 1987A not shown in the main text.
Appendix B Investigating systematics of analysis approach
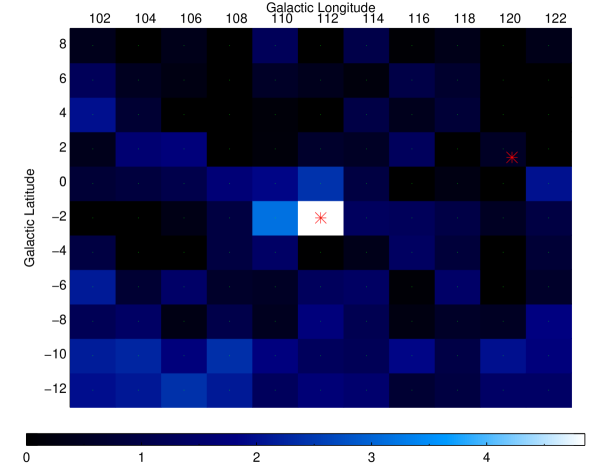
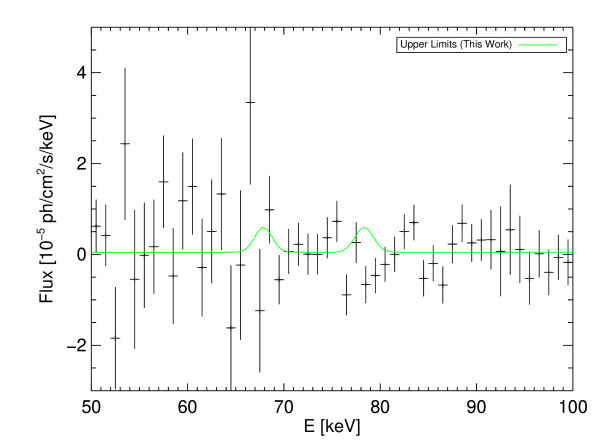
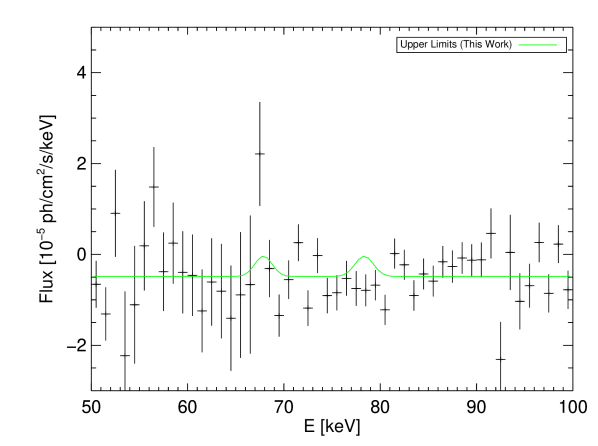
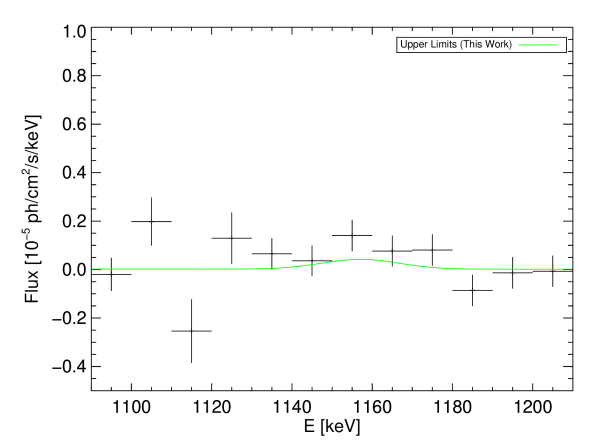
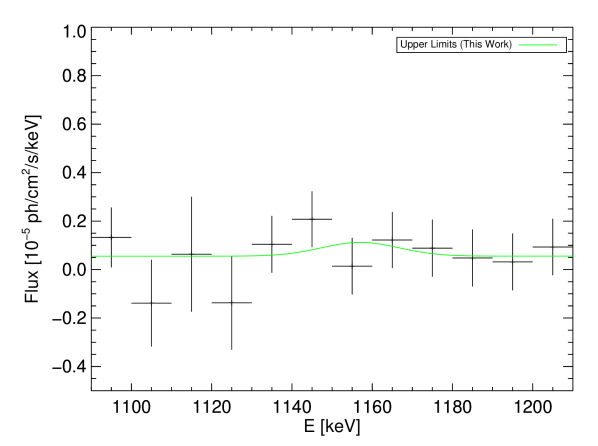
We tested our analysis method for consistency in two scenarios. We used data taken in the high latitude region close to the Galactic north pole and analyzed the two point sources NGC4388, for which we expected no emission in the decay chain and an ”empty” region with no known celestial source. Both ”sources” are close to the Galactic north pole with latitude 60∘ ¡b ¡ 80∘ and longitude ¡ l ¡ -270∘ containing a total of 11.5 Ms exposure for the entire INTEGRAL mission time. This region contains only a few sources, making it ideal for testing the analysis approach in an ”empty” celestial region. The sources can be outside the fully coded field of view for various observation times, reducing the exposure on specific locations. The image response function was not calculated for angles between the pointing direction and source location of more than 25 degree offset, and we assumed no source contribution in these cases.
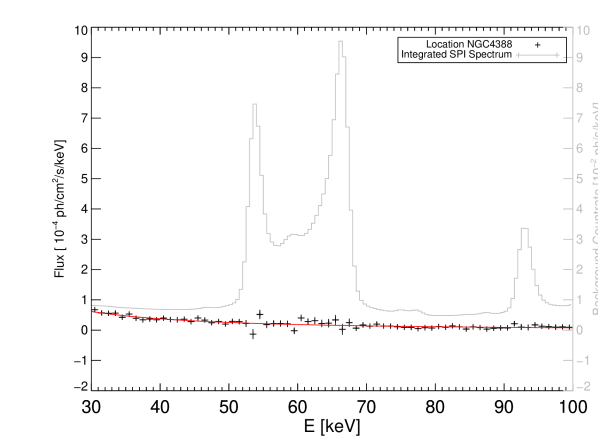
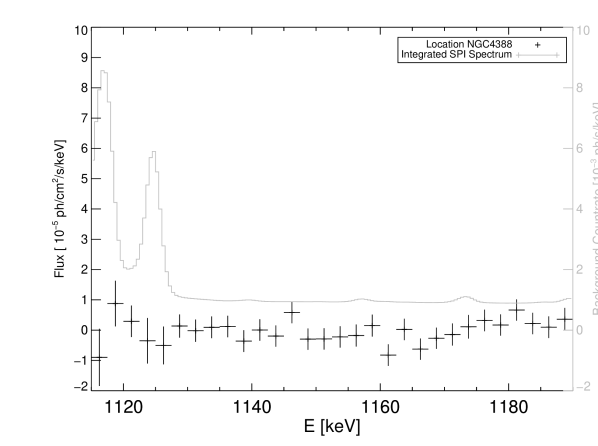
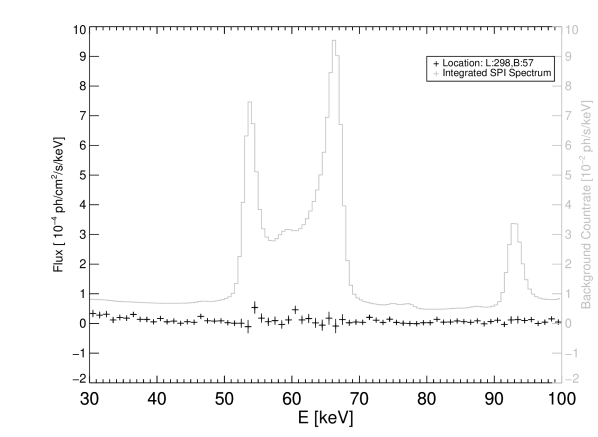
Figures 10 and 11 show the spectra for the galaxy cluster NGC4388 and ”empty” space. With our background modeling approach, the strong background lines in the region between 50 and 68 keV, 90 keV, as well as 1115-1125 keV are adequately suppressed. The photon index of the continuum emission () of NGC4388 (l = 279.1∘; b = 74.3∘) is consistent in the spectral index with the measurements of (Beckmann et al. 2004). We found no spurious signatures in either location. In both regions, fluctuations around the expected continuum and baseline are present, however, these fluctuations are on scales smaller than the instrumental energy resolution at the respective energies and compatible with statistical fluctuations.