Temperature dependence of the anomalous Nernst effect in Ni2MnGa shape memory alloy
Abstract
We report a detailed investigation of the Ni2MnGa shape memory alloy through magnetic, electronic, and thermal measurements. Our measurements of the anomalous Nernst effect (ANE) reveal that this technique is very sensitive to the onset of the pre-martensitic transition in sharp contrast to other transport measurements. With the ANE being sensitive to changes at the Fermi surface, we infer on the link between the structural modulations and the modulation of the Fermi surface via its nesting features, with the magnetic field induced strain being the mediating mechanism.
pacs:
PacsNi2MnGa shape memory alloy and its near stoichiometric compositions have been extensively investigated in the recent past due to their magnetic shape memory Chmielus et al. (2009); Ullakko et al. (1996), magneto-caloric Marcos et al. (2003); Qian et al. (2018) and magneto-resistive properties Biswas et al. (2005). These systems, which are characterized by a complex interplay of structural, magnetic, and electronic degrees of freedom is also known to exhibit a large magnetic field induced strain (MFIS), in excess of Sozinov et al. (2002); Murray et al. (2000), which enhances its importance as a potential candidate for the development of efficient and fast magneto-mechanical actuators. The stoichiometric Ni2MnGa has been widely used as a model system, and is understood to exhibit a well defined sequence of transitions below its Curie temperature 376 K Webster et al. (1984); Brown et al. (2002). At room temperature, Ni2MnGa has a cubic crystal structure ( and space group ), which is referred to as the austenite phase Brown et al. (2002). Upon cooling, it transforms to a martensitic phase at K via an intermediate pre-martensitic transition (PMT) which occurs at K Webster et al. (1984); Brown et al. (2002). In general, the pre-martensitic phase is considered to be a precursor state of the low temperature martensite phase with preserved cubic phase symmetry having a long period modulated structureBrown et al. (2002); Singh et al. (2013). The modulations originates from a periodic shuffling of the planes along the direction with a periodicity of six atomic layers, also called the 3-fold or 3M modulation Zheludev et al. (1996); Singh et al. (2015a); Zheludev et al. (1995). On the other hand, the martensitic phase is characterized by a body-centered tetragonal Webster et al. (1984); Kaufmann et al. (2010) or orthorhombic Singh et al. (2014); Brown et al. (2002); Singh et al. (2015a) crystal structure with much longer periodic modulation (5M Kaufmann et al. (2010); Righi et al. (2007) or 7M Singh et al. (2014); Brown et al. (2002); Fukuda et al. (2009)). The large magnetic field induced strain of Ni2MnGa is closely linked with the modulation of the martensite phaseSozinov et al. (2002); Murray et al. (2000) and the martensite phase appears through the modulated premartensite phasePlanes et al. (1997a); Singh et al. (2013, 2015a), suggesting that the pre- martensitic phase is a perfect arena for the investigation of the possible cause and/or effects of these modulations Lantz et al. (2017). However, this task is hampered by the fact that most of the conventional experimental tools are relatively insensitive across the PMT, thus limiting the ability to adequately characterize the structure-property relationships associated with these modulations. In this work, we report a detailed investigation of Ni2MnGa system using a battery of magnetic, electronic, and thermal measurements. In contrast to other electronic and magnetic measurements, the anomalous Nernst effect (ANE) is seen to be sensitive to the PMT, bringing to the fore the potential utility of this technique in the investigation of such systems.
A polycrystalline ingot of Ni2MnGa was prepared by the conventional arc-melting method using appropriate quantities of each constituent. The sample was melted several times to get uniform composition. The as-melted ingot was annealed in an evacuated quartz ampoule at a temperature of 1100 K for 3 days to achieve further homogeneity and then quenched in an ice-water mixture. For compositional analysis, a small piece from the annealed ingot was evaluated using energy dispersive x-ray analysis. This data was collected at different regions of sample and the average composition was found to be Ni1.96Mn1.04Ga (hereafter termed as Ni2MnGa). A part of the annealed bulk sample was ground into fine powder using a mortar pestle, sealed in evacuated quartz ampoule under Argon atmosphere, and annealed at 773 K overnight to get rid of residual stresses introduced during the grinding Singh et al. (2010, 2015b); Belesi et al. (2015). This annealed powder was then used for x-ray diffraction (XRD) measurements. The small piece from annealed ingot was used for magnetization measurements, and the temperature dependent DC-magnetization data was collected using a vibrating sample magnetometer (Quantum Design, PPMS) in the field cooled cooling (FCC) and field cooled warming (FCW) protocols.
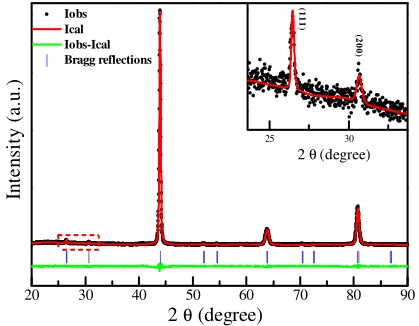
The Rietveld analysis of x-ray diffraction (XRD) data was carried using the FULLPROF software package and revealed that the system stabilized in a cubic structure (space group ) . The Wyckoff positions for Ni, Mn and Ga atoms used for refinements were 8a (0.25, 0.25, 0.25), 4a (0, 0, 0) and 4b (0.5, 0.5, 0.5), respectively. The experimental and calculated XRD plots are shown in Fig.1, which clearly reveal that the sample is in single phase, with all the Bragg peaks being well indexed. The inset shows the presence of (111) and (200) Bragg’s reflections which is the evidence of ordering. The refined lattice parameter is , which is in good agreement with the reported value Singh et al. (2013) for Ni2MnGa.
.
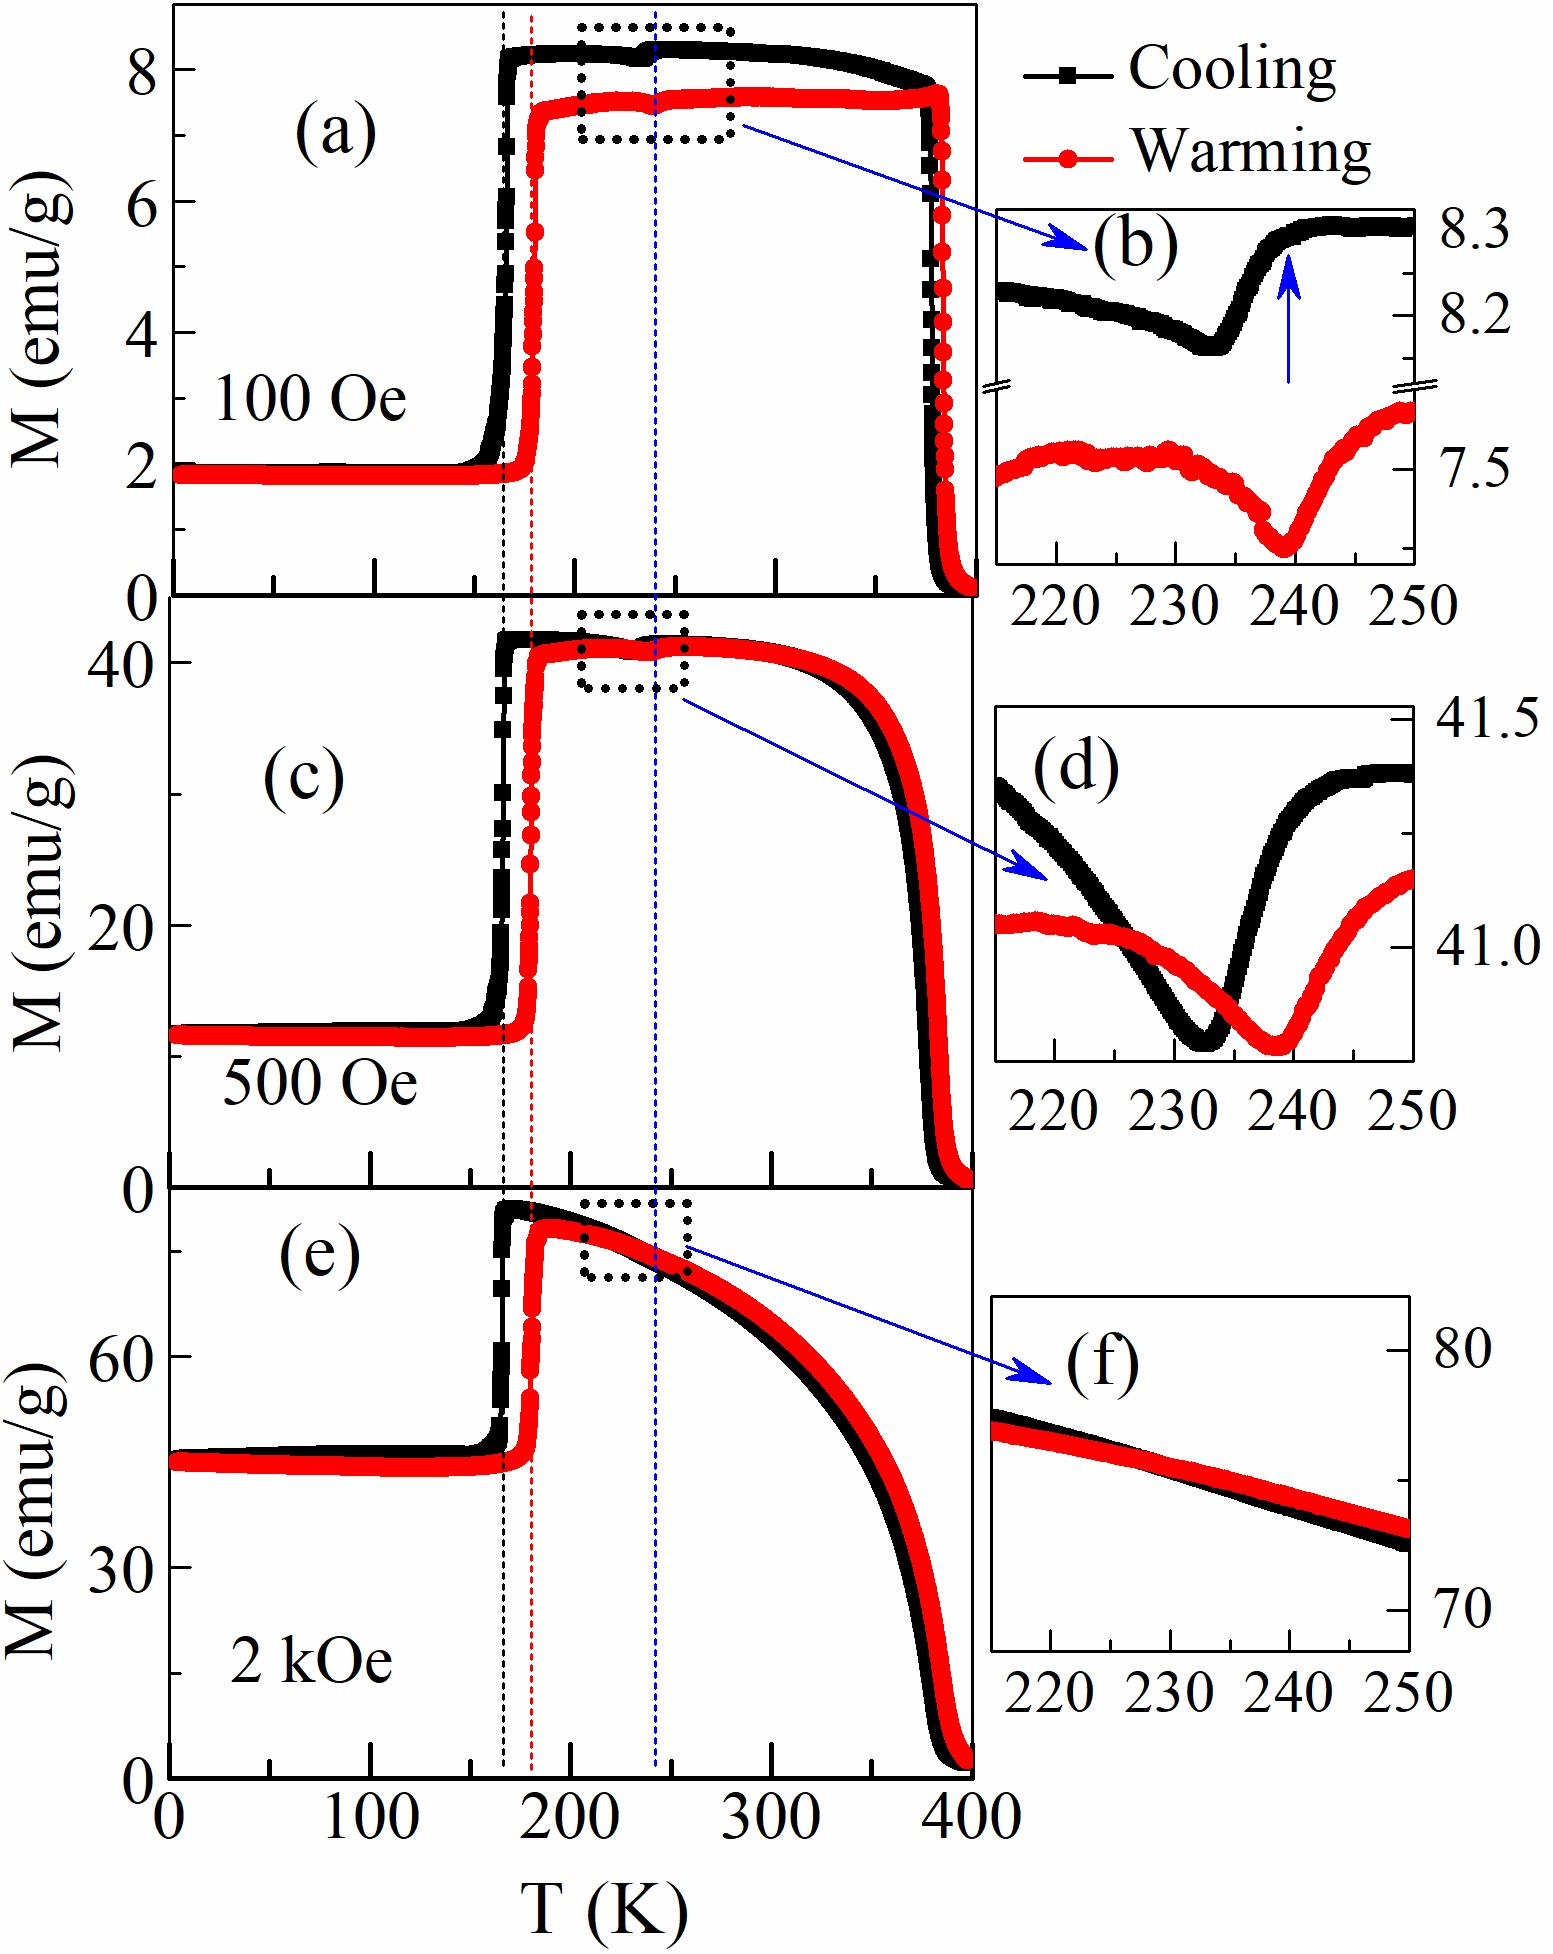
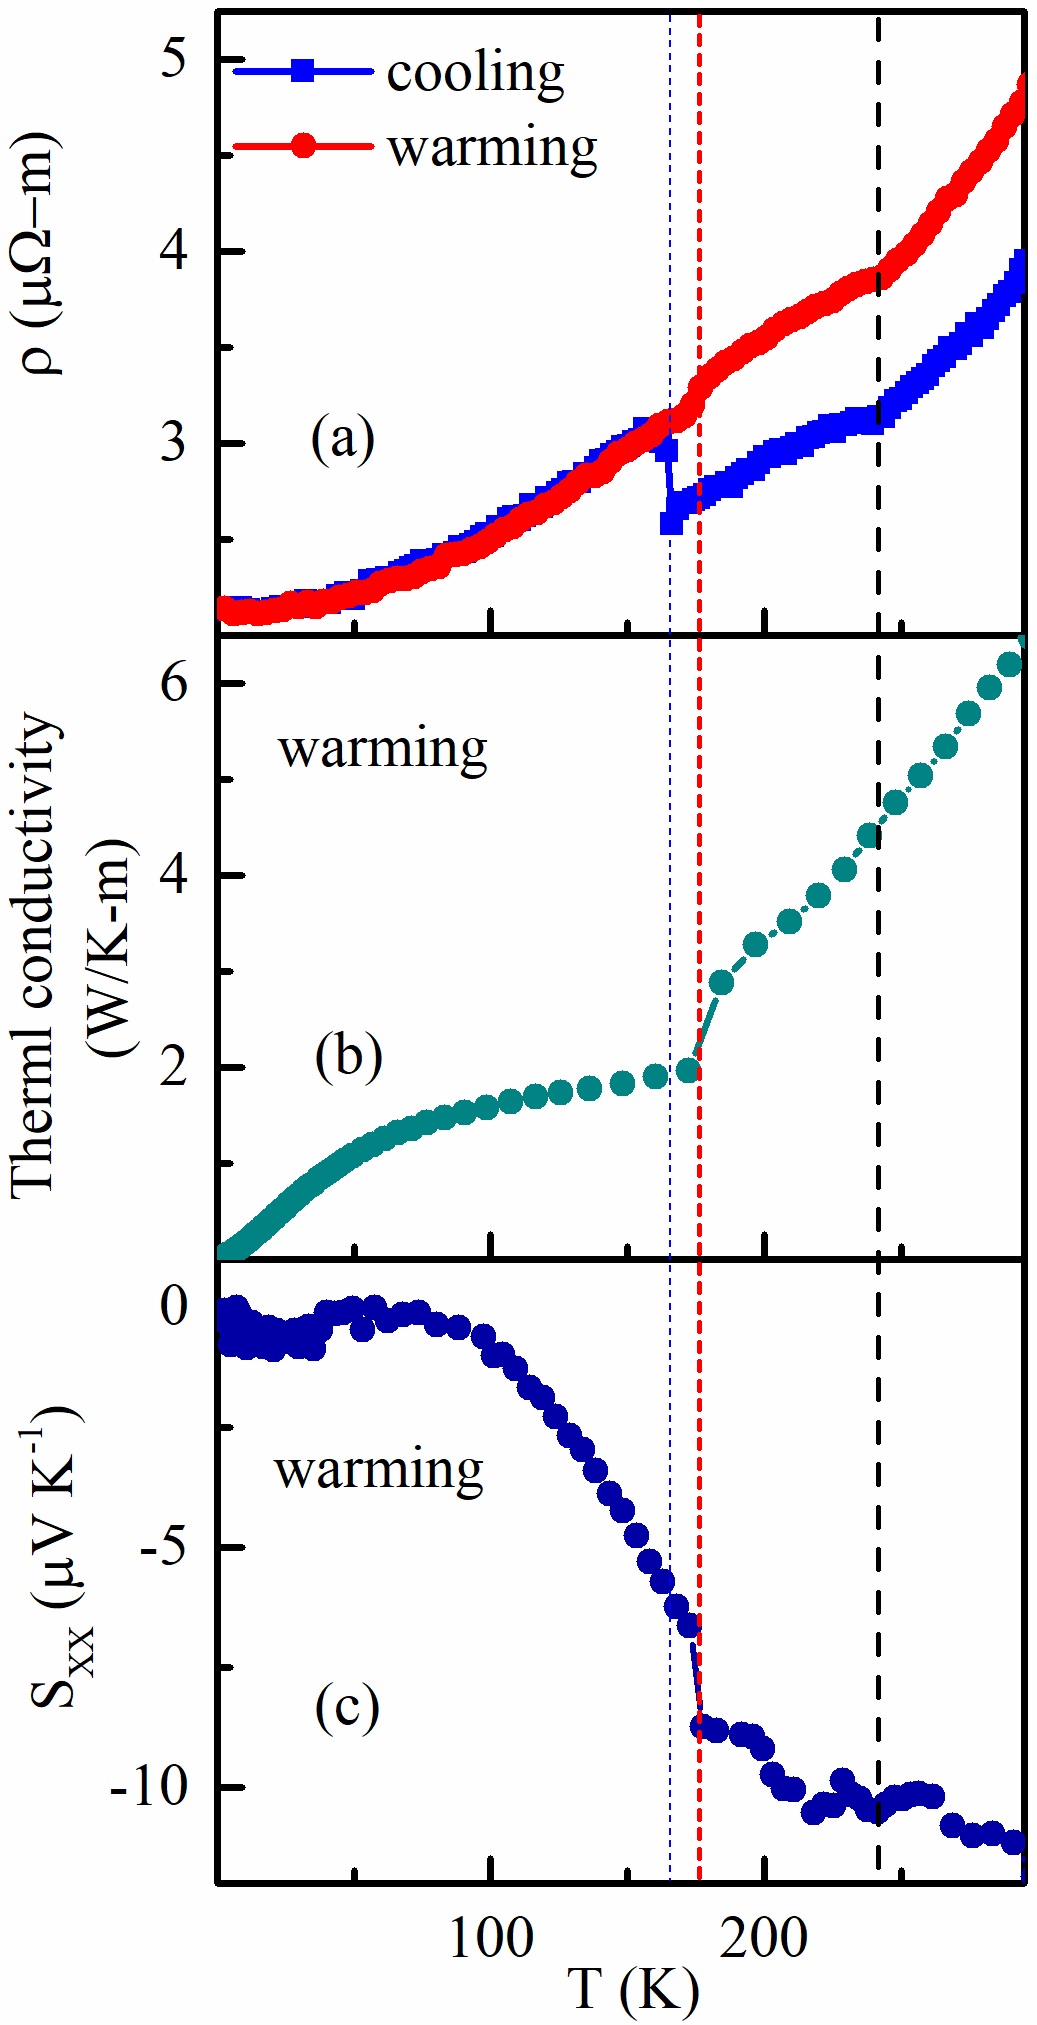
Fig.2(a) illustrates the temperature dependent DC-magnetization of Ni2MnGa as measured at low applied magnetic fields (100 Oe), which confirms the sequential phase transitions in this alloy system as reported in literature Singh et al. (2015a). Upon cooling, the para-to-ferromagnetic, the austenite to pre-martensite and the pre-martensite to martensite transitions (MT) are observed at K (), K (), and K () respectively. During warming, all these transitions again appear in the reverse sequential order with a characteristic hysteresis at the martensite and pre-martensite phase transitions Ludwig et al. (2009); JM et al. (2009); YT et al. (2004); WH et al. (2001); Singh et al. (2015a). In comparison with the previous reports on stoichiometric Ni2MnGa Webster et al. (1984); Brown et al. (2002); Zuo et al. (1998), the and the of the present composition is seen to be shifted to slightly lower temperatures, presumably due to a small variation in Ni and Mn content. These results are also in agreement with prior literature Banik et al. (2006); Khovaylo et al. (2005). Fig.2(c)& 2(e) depict the temperature dependence of magnetization , measured at higher magnetic fields of 500 Oe and 2 kOe,respectively. Fig.2(c) shows that at a measuring field of 500 Oe, the pre-martensite feature is slightly shifted to lower temperatures ( by around 1K) in comparison to the low field (100 Oe) data. On the other hand, the pre-martensite feature is completely suppressed (Fig.2(e)) at a magnetic field value of 2 kOe. The suppression of this feature and the reduction of with increasing magnetic field is attributed to magnetoelastic coupling across the pre-martensite phase and is consistent with literature Planes et al. (1997b); Zuo et al. (1998); YT et al. (2004); WH et al. (2001). Fig.2(b), 2(d), and 2(f) depicts an expanded view of the magnetization-plots around the PMT (guided by blue arrows). The blue tick in Fig.2(a) shows the premartensitic start temperature ( around 238K) in cooling. Apart from magnetic measurements, both the MT and the PMT are also observed in various other transport measurements, and the temperature dependence of resistivity (), thermal conductivity (), and the longitudinal Seebeck coefficient (), measured in the absence of magnetic field, as depicted in Fig.3(a), 3(b), and 3(c) respectively. It is evident that these conventional transport measurements are relatively insensitive to the PMT. Nonetheless, the curve confirms the metallic behavior of the sample. Similarly, the dominating contribution of the electron-type carriers to the longitudinal thermopower is also confirmed by the negative sign of the in the whole temperature range.
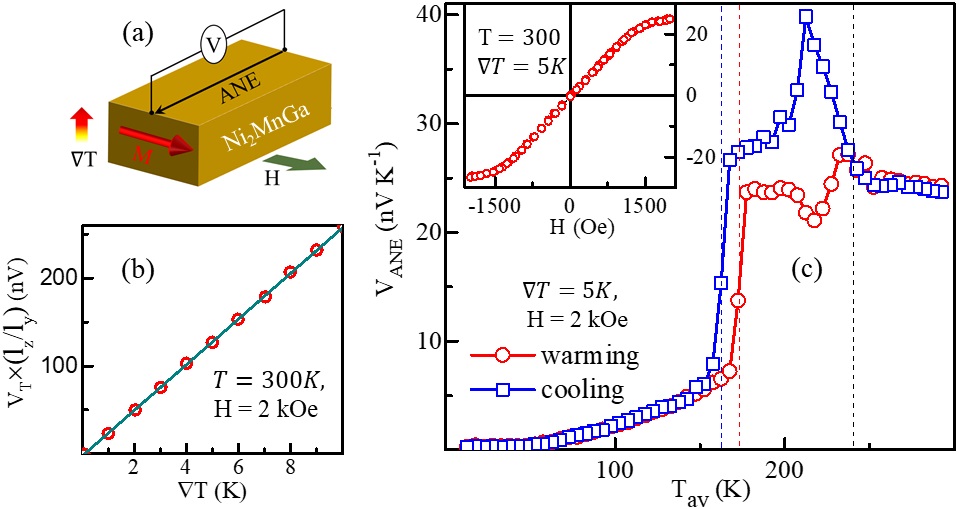
The anomalous Nernst effect (ANE) pertains to the generation of a transverse electric voltage () orthogonal to both the and the applied thermal gradient () across a magnetic metal where, the acts as a driving force, in analogy to an electric bias which causes the anomalous Hall effect Pu et al. (2008); Chuang et al. (2017). It can be described by an empirical formula : , where is defined as the transverse Seebeck coefficient Guo et al. (2014); Chuang et al. (2017); Ghosh et al. (2018). Fig.4(a) illustrates the geometry of our device, where the polycrystalline sample is cut and polished to form a rectangular shape of dimensions . The is applied across the width ( mm), the magnetic field is applied along the breadth (), and the ANE voltage () is measured along the y-direction by using two gold wires at a distance of mm () between them. To cancel the background contributions, the magnetic field is reversed, and the ANE contribution is extracted as . The average sample temperature is determined by ; with , where and are the temperatures at opposite surfaces of the sample, measured by two calibrated Cernox sensors.
Fig.4(b) illustrates the linear dependence of on the applied , where the sample temperature and the magnetic field are kept at 300 K and 2 kOe, respectively. The linearity of the vs. -plot along with a zero intercept confirms the absence of any thermal loss in our measurement. Fig.4(c) presents the temperature dependence of the normalized ANE signal so that , where the applied magnetic field () and the applied thermal gradient () are kept fixed at 2 kOe and 5 K, respectively. In the inset of Fig.4(c), the magnetic field dependence of the is depicted, where =300 K and =5 K are kept fixed. Interestingly, a reasonably large ANE signal is observed to appear at room temperature itself. In agreement with the previous reports on Heusler alloys Ghosh et al. (2018), the present Ni-Mn-Ga system also shows a significant drop in the -signal across the MT. Moreover, the turns out to be very sensitive across the PMT, although such anomaly in the dc magnetization is substantially suppressed across the PMT at a field of 2 kOe.
The origin of ANE is well understood in the picture of an effective spin-orbit interaction which is further decomposed into three possible ingredients: namely the Berry curvature, the side jump, and the skew scattering mechanisms Chuang et al. (2017); Pu et al. (2008). For our analysis, we consider Mott’s relation that connects the transverse thermoelectric coefficient, , to the transverse electrical conductivity, through the relation: , where , , , and are the Boltzmann constant, electric charge, energy, and the Fermi energy, respectively Chuang et al. (2017); Guo et al. (2014); Pu et al. (2008); Ghosh et al. (2018). This implies that depends on both the temperature and the slope of the tensor with the Fermi-surface, or . Therefore, the , being linked to through the relation: Ghosh et al. (2018); Chuang et al. (2017); Guo et al. (2014), also becomes sensitive to the changes in the Fermi surface. Interestingly, a previous report has also attested to the sensitivity of the Nernst signal on the Fermi-surface distortions Hackl and Vojta (2009).
The large MFIS of the Ni2MnGa is intimately linked with the existence of a long period modulated structure. However, the origin of those modulations is still under debate and two different scenarios have been suggested. In the Adaptive model, the modulation is portrayed as an effective twinning emerging from the minimization of elastic energy Kaufmann et al. (2010); Khachaturyan et al. (1991). An alternative mechanism is the soft-phonon mode-based displacive modulation model, which is further linked to the Fermi surface nesting features. The latter has received more theoretical and experimental support Zheludev et al. (1996, 1995); Mañosa et al. (2001); Shapiro et al. (2007); D’Souza et al. (2012); Singh et al. (2015a); Belesi et al. (2015); Opeil et al. (2008); Bungaro et al. (2003); Lee et al. (2002).
Inelastic neutron scattering experiments have confirmed the signature of phonon softening Zheludev et al. (1996, 1995); Mañosa et al. (2001) and the phasons Shapiro et al. (2007); Bungaro et al. (2003) associated with the CDW resulting from the Fermi surface nesting at both the pre-martensite and the martensite phases. Recently, photoemission spectroscopy has also inferred on the occurrence of CDW at the onset of the PMT D’Souza et al. (2012). This partial nesting of the Fermi surface at the pre-martensite phase has also been confirmed by electron-positron annihilation experiments Haynes et al. (2012). High resolution X-ray diffraction studies have also revealed non uniform atomic displacements in the modulated phase, phason broadening in the satellite peaks, and a temperature variation of the modulation wave vector without any commensurate lock in phase Singh et al. (2014, 2015a). Thus, it can be concluded that modulation in pre-martensite and martensite phase for Ni2MnGa is in all probability linked with the soft phonon based model associated with a Fermi surface nesting. Our results which depict a remarkable sensitivity of the ANE signal to the PMT is presumably due to a change in the Fermi surface via its nesting features, which occurs at the onset of the PMT. It is also important to note that the possibility that a contributory factor could be a variation of due to its crucial connection to . The could also be expressed in terms of transverse resistivity () via the relation Pu et al. (2008), where is the longitudinal resistivity (). Thus, with the scaling relation , where n is a number that typically varies within to Pu et al. (2008); Chuang et al. (2017); Nair et al. (2012); Miyasato et al. (2007) it could be shown that the role of in the large anomaly in across the PMT would be negligible since the variation of both & are faint across the PMT. Thus, the signatures in the measured ANE are more likely to reflect a change in the Fermi surface that occurs at the onset of PMT. It is to be noted that this nesting feature does also exist in the martensite phase Haynes et al. (2012); Bungaro et al. (2003); Lee et al. (2002). However, its contribution to the ANE-signal cannot be estimated due to the overwhelming change in the ANE arising as a consequence of the structural transformation ( and associated change in the magnetization) at the MT.
Apart from and , the also hints to the presence of another characteristic temperature well below the onset of the PMT across which a significant change in the ANE voltage is observed. We note that in the cooling data (Fig.4(c)), V starts to rise at around 238K - the starting point of pre-martensite phase transition () as is also observed in our low field magnetization data (Fig.2(a)). The ANE-voltage continues to rise until it is fully in the pre-martensite phase at . Below this temperature, starts to decrease - presumably due to local traces of the martensite phase being present together with the pre-martensite phase just below of . Previous NMR experiments have also inferred on such a temperature regime between the and , where both the pre-martensitic and the martensitic phases coexist Belesi et al. (2015). On, further cooling, the main martensitic transition occurs, which is also observed in all the measurements, characterized by , with a reasonable thermal hysteresis in the being observed across both the MT and the PMT.
Though the Mott relation can explain the ANE signal, it also suggests that Pu et al. (2008); Ghosh et al. (2018); Chuang et al. (2017). This implies that should be equally sensitive to the onset of the PMT, whereas this is clearly not the case, as is evident from Fig.3(c). We speculate that this discrepancy could be a consequence of the externally applied magnetic field in the ANE measurements. Measurements of , are performed in the absence of an external magnetic field, where a sizable electronic background of the unchanged Fermi surface dominates over that arising from the weak nesting at this pre-martensitic phase. On the other hand, as a consequence of the measurement protocol, the ANE is more sensitive to changes due to the magnetic field. Interestingly, at the same measuring field of 2 kOe, the dc magnetization data did not exhibit a significant feature across the PMT. Here, we note that the ANE has been reported to exhibit features that are beyond the magnetization scaling in some single crystalline specimens, with these features being linked with the role of the effective Berry curvature Guin et al. (2019); Sakai et al. (2018). As our sample is a polycrystalline slab, the contribution from the Berry curvature mechanism in the measured ANE signal is not likely to be significant. We speculate that the observed features in the vicinity of the PMT arises due to the coupling between the magnetism and the Fermi surface, with the magnetism being tuned by magnetic field driven changes in the Fermi surface. Recently, G. Lantz and co-workers also have inferred about such a coupling in their pump-probe experiments on stoichiometric Ni2MnGa specimens Lantz et al. (2017). Their observations suggested that photo-induced demagnetization modified the Fermi surface, as a consequence of which the nesting vector and the modulation periodicity were also tailored.
In conclusion, we present a detailed investigation of Ni2MnGa using a battery of magnetic, electronic and thermal measurements. Across the PMT, a predominant suppression of the anomaly in the curve is observed at higher magnetic fields suggesting the existence of magnetoelastic effect across the PMT. The ANE is presented for the first time in this Ni-Mn-Ga class of materials, and it clearly shows a significant sensitivity across the PMT. This is in sharp contrast to other conventional transport measurements, like , , and , where the PMT is barely discernible. With the ANE being sensitive to changes in the Fermi surface, we infer that such sensitivity of the is due to the changes in the Fermi surface which further support the soft phonon based model. Finally, the measured in conjunction with both the and the data also supports the possibility of coupling between magnetism and the Fermi surface, which could have significant implications in understanding these functional materials. Our results also suggest that the ANE could be utilized as a powerful tool for more detailed investigations in the Ni-Mn-Ga and related systems with different compositions and/or forms, like, single crystals or thin films.
AD is thankful to Shruti Chakravarty for her support. AD acknowledges UGC, Govt. of India for providing financial support through Senior Research Fellowship (SRF). The authors acknowledge funding support by the Department of Science and Technology (DST, Govt. of India) under the DST Nanomission Thematic Unit Program (SR/NM/TP-13/2016). S.S. thanks Science and Engineering Research Board of India for financial support through an Early Career Research Award (Grant No. ECR/2017/003186) and the award of a Ramanujan Fellowship (Grant No. SB/S2/RJN-015/2017).
References
- Chmielus et al. (2009) M. Chmielus, X. Zhang, C. Witherspoon, D. C. Dunand, and P. Müllner, Nat. Mater 8, 863 (2009).
- Ullakko et al. (1996) K. Ullakko, J. Huang, C. Kantner, R. O’handley, and V. Kokorin, Applied Physics Letters 69, 1966 (1996).
- Marcos et al. (2003) J. Marcos, L. Mañosa, A. Planes, F. Casanova, X. Batlle, and A. Labarta, Phys. Rev. B 68, 094401 (2003).
- Qian et al. (2018) M. Qian, X. Zhang, L. Wei, P. Martin, J. Sun, L. Geng, T. B. Scott, and H.-X. Peng, Scientific reports 8, 16574 (2018).
- Biswas et al. (2005) C. Biswas, R. Rawat, and S. R. Barman, Appl. Phys. Lett. 86, 202508 (2005).
- Sozinov et al. (2002) A. Sozinov, A. A. Likhachev, N. Lanska, and K. Ullakko, Appl. Phys. Lett. 80, 1746 (2002).
- Murray et al. (2000) S. J. Murray, M. Marioni, S. M. Allen, R. C. O’Handley, and T. A. Lograsso, Applied Physics Letters 77, 886 (2000), https://doi.org/10.1063/1.1306635 .
- Webster et al. (1984) P. Webster, K. Ziebeck, S. Town, and M. Peak, Philosophical Magazine B 49, 295 (1984).
- Brown et al. (2002) P. J. Brown, J. Crangle, T. Kanomata, M. Matsumoto, K.-U. Neumann, B. Ouladdiaf, and K. R. A. Ziebeck, J. Phys. Condens. Matter 14, 10159 (2002).
- Singh et al. (2013) S. Singh, J. Nayak, A. Rai, P. Rajput, A. H. Hill, S. R. Barman, and D. Pandey, J. Phys. Condens. Matter 25, 212203 (2013).
- Zheludev et al. (1996) A. Zheludev, S. M. Shapiro, P. Wochner, and L. E. Tanner, Phys. Rev. B 54, 15045 (1996).
- Singh et al. (2015a) S. Singh, J. Bednarcik, S. R. Barman, C. Felser, and D. Pandey, Phys. Rev. B 92, 054112 (2015a).
- Zheludev et al. (1995) A. Zheludev, S. M. Shapiro, P. Wochner, A. Schwartz, M. Wall, and L. E. Tanner, Phys. Rev. B 51, 11310 (1995).
- Kaufmann et al. (2010) S. Kaufmann, U. K. Rößler, O. Heczko, M. Wuttig, J. Buschbeck, L. Schultz, and S. Fähler, Phys. Rev. Lett. 104, 145702 (2010).
- Singh et al. (2014) S. Singh, V. Petricek, P. Rajput, A. H. Hill, E. Suard, S. R. Barman, and D. Pandey, Phys. Rev. B 90, 014109 (2014).
- Righi et al. (2007) L. Righi, F. Albertini, L. Pareti, A. Paoluzi, and G. Calestani, Acta Mater. 55, 5237 (2007).
- Fukuda et al. (2009) T. Fukuda, H. Kushida, M. Todai, T. Kakeshita, and H. Mori, Scr. Mater 61, 473 (2009).
- Planes et al. (1997a) A. Planes, E. Obradó, A. Gonzàlez-Comas, and L. Mañosa, Phys. Rev. Lett. 79, 3926 (1997a).
- Lantz et al. (2017) G. Lantz, M. J. Neugebauer, M. Kubli, M. Savoini, E. Abreu, K. Tasca, C. Dornes, V. Esposito, J. Rittmann, Y. W. Windsor, P. Beaud, G. Ingold, and S. L. Johnson, Phys. Rev. Lett. 119, 227207 (2017).
- Singh et al. (2010) S. Singh, M. Maniraj, S. D’Souza, R. Ranjan, and S. Barman, Applied Physics Letters 96, 081904 (2010).
- Singh et al. (2015b) S. Singh, P. Kushwaha, F. Scheibel, H.-P. Liermann, S. R. Barman, M. Acet, C. Felser, and D. Pandey, Phys. Rev. B 92, 020105 (2015b).
- Belesi et al. (2015) M. Belesi, L. Giebeler, C. G. F. Blum, U. K. Rößler, B. Büchner, and S. Wurmehl, Phys. Rev. B 91, 134415 (2015).
- Ludwig et al. (2009) B. Ludwig, C. Strothkaemper, U. Klemradt, X. Moya, L. Mañosa, E. Vives, and A. Planes, Phys. Rev. B 80, 144102 (2009).
- JM et al. (2009) B. JM, C. VA, L. P, G. J, O. I, F. J, and B. S, Applied Physics Letters 94, 051909 (2009).
- YT et al. (2004) C. YT, C. JL, G. Liu, G. Wu, and W. Wang, Journal of Physics: Condensed Matter 16, 3061 (2004).
- WH et al. (2001) W. WH, J. Chen, S. Gao, G. Wu, Z. Wang, Y. Zheng, L. Zhao, and W. Zhan, Journal of Physics: Condensed Matter 13, 2607 (2001).
- Zuo et al. (1998) F. Zuo, X. Su, and K. H. Wu, Phys. Rev. B 58, 11127 (1998).
- Banik et al. (2006) S. Banik, A. Chakrabarti, U. Kumar, P. K. Mukhopadhyay, A. M. Awasthi, R. Ranjan, J. Schneider, B. L. Ahuja, and S. R. Barman, Phys. Rev. B 74, 085110 (2006).
- Khovaylo et al. (2005) V. V. Khovaylo, V. D. Buchelnikov, R. Kainuma, V. V. Koledov, M. Ohtsuka, V. G. Shavrov, T. Takagi, S. V. Taskaev, and A. N. Vasiliev, Phys. Rev. B 72, 224408 (2005).
- Planes et al. (1997b) A. Planes, E. Obradó, A. Gonzàlez-Comas, and L. Mañosa, Phys. Rev. Lett. 79, 3926 (1997b).
- Pu et al. (2008) Y. Pu, D. Chiba, F. Matsukura, H. Ohno, and J. Shi, Phys. Rev. Lett. 101, 117208 (2008).
- Chuang et al. (2017) T. C. Chuang, P. L. Su, P. H. Wu, and S. Y. Huang, Phys. Rev. B 96, 174406 (2017).
- Guo et al. (2014) G. Y. Guo, Q. Niu, and N. Nagaosa, Phys. Rev. B 89, 214406 (2014).
- Ghosh et al. (2018) A. Ghosh, A. De, and S. Nair, Appl. Phys. Lett. 113, 262405 (2018).
- Hackl and Vojta (2009) A. Hackl and M. Vojta, Phys. Rev. B 80, 220514 (2009).
- Khachaturyan et al. (1991) A. G. Khachaturyan, S. M. Shapiro, and S. Semenovskaya, Phys. Rev. B 43, 10832 (1991).
- Mañosa et al. (2001) L. Mañosa, A. Planes, J. Zarestky, T. Lograsso, D. L. Schlagel, and C. Stassis, Phys. Rev. B 64, 024305 (2001).
- Shapiro et al. (2007) S. M. Shapiro, P. Vorderwisch, K. Habicht, K. Hradil, and H. Schneider, Europhysics Letters (EPL) 77, 56004 (2007).
- D’Souza et al. (2012) S. W. D’Souza, A. Rai, J. Nayak, M. Maniraj, R. S. Dhaka, S. R. Barman, D. L. Schlagel, T. A. Lograsso, and A. Chakrabarti, Phys. Rev. B 85, 085123 (2012).
- Opeil et al. (2008) C. P. Opeil, B. Mihaila, R. K. Schulze, L. Mañosa, A. Planes, W. L. Hults, R. A. Fisher, P. S. Riseborough, P. B. Littlewood, J. L. Smith, and J. C. Lashley, Phys. Rev. Lett. 100, 165703 (2008).
- Bungaro et al. (2003) C. Bungaro, K. M. Rabe, and A. D. Corso, Phys. Rev. B 68, 134104 (2003).
- Lee et al. (2002) Y. Lee, J. Y. Rhee, and B. N. Harmon, Phys. Rev. B 66, 054424 (2002).
- Haynes et al. (2012) T. D. Haynes, R. J. Watts, J. Laverock, Z. Major, M. A. Alam, J. W. Taylor, J. A. Duffy, and S. B. Dugdale, New Journal of Physics 14, 035020 (2012).
- Nair et al. (2012) S. Nair, S. Wirth, S. Friedemann, F. Steglich, Q. Si, and A. Schofield, Advances in Physics 61, 583 (2012).
- Miyasato et al. (2007) T. Miyasato, N. Abe, T. Fujii, A. Asamitsu, S. Onoda, Y. Onose, N. Nagaosa, and Y. Tokura, Phys. Rev. Lett. 99, 086602 (2007).
- Guin et al. (2019) S. N. Guin, K. Manna, J. Noky, S. J. Watzman, C. Fu, N. Kumar, W. Schnelle, C. Shekhar, Y. Sun, J. Gooth, et al., NPG Asia Mater. 11, 16 (2019).
- Sakai et al. (2018) A. Sakai, Y. P. Mizuta, A. A. Nugroho, R. Sihombing, T. Koretsune, M.-T. Suzuki, N. Takemori, R. Ishii, D. Nishio-Hamane, R. Arita, et al., Nat. Phys 14, 1119 (2018).