Hysteresis curves reveal the microscopic origin of cooperative CO2 adsorption in diamine-appended metal–organic frameworks
Abstract
Diamine-appended metal–organic frameworks (MOFs) of the form Mg2(dobpdc)(diamine)2 adsorb CO2 in a cooperative fashion, exhibiting an abrupt change in CO2 occupancy with pressure or temperature. This change is accompanied by hysteresis. While hysteresis is suggestive of a first-order phase transition, we show that hysteretic temperature-occupancy curves associated with this material are qualitatively unlike the curves seen in the presence of a phase transition; they are instead consistent with CO2 chain polymerization, within one-dimensional channels in the MOF, in the absence of a phase transition. Our simulations of a microscopic model reproduce this dynamics, providing physical understanding of cooperative adsorption in this industrially important class of materials.
I Introduction
Metal–organic frameworks (MOFs) are porous, crystalline materials with large internal surface areas, and have been studied extensively as adsorbents for gas storage and separations yaghi2009 ; long_chemrev ; yaghi2013 . The recently-developed MOFs Mg2(dobpdc)(diamine)2 are particularly promising in this regard because they exhibit cooperative adsorption, in which a conveniently small change in pressure or temperature results in an abrupt change in the quantity of CO2 adsorbed by the framework mcdonald2012 ; david2015 ; long_mixture . In a majority of cases, cooperative adsorption results from a guest-induced phase transition or dynamic rearrangement of the MOF structure, or a phase transition of the adsorbed gas bon2014 ; emile2017 ; coudert2008 ; coudert2011 ; coudert2013 ; smit2013 ; simon2017statistical . However, gas adsorption in the diamine-appended MOFs proceeds through a one-dimensional chemical reaction. As described in Ref. david2015 , proton transfer and nucleophilic attack of N on a molecule forms an ammonium carbamate species, and induces a chain reaction that leads to the cooperative insertion of into the metal-amine bonds. The result is a chain of ammonium carbamate formed along the pore axis. The one-dimensional nature of this process, and the physics of one-dimensional phenomena, suggests that cooperative gas uptake in diamine-appended Mg2(dobpdc) materials occurs in the absence of a phase transition binney1992theory . Clarifying this issue is important in order to establish a microscopic understanding of cooperative gas uptake.
In previous work Kundu2018 we used a statistical mechanical model of adsorption within the MOFs Mg2(dobpdc)(diamine)2 to show that the process of ammonium carbamate chain formation is associated with cooperative thermodynamics consistent with experimental data. That work provided evidence for the claim that a phase transition does not need to occur in this class of materials in order to observe cooperative binding. In this paper we study the dynamics of cooperative adsorption in the representative diamine-appended MOF e-2–Mg2(dobpdc) (e-2 -ethylethylenediamine). We show that dynamics, in the form of the hysteresis seen in temperature-occupancy curves, also indicates that cooperative adsorption occurs in the absence of a phase transition.
Hysteresis, a memory of the prior state of the system, is indeed normally associated with a first-order phase transition, which involves a discontinuous change of an order parameter (e.g. gas occupancy) with a control parameter (e.g. temperature). In that scenario, hysteresis arises from the slow dynamics of nucleation, i.e. the potentially long time required for thermal fluctuations to produce a nucleus of the stable phase (during which time the system remains “stuck” in its initial state) Evans1990 ; Monson2012 . However, hysteresis results more generally whenever a system’s order parameter changes less rapidly than its control parameter, and so can also arise in the absence of a phase transition. For instance, force-extension curves for DNA stretching display hysteresis associated with the slow detachment of the two strands of the helix smith1996overstretching ; cocco2004overstretching ; whitelam2008there ; fu2010two . Here we present experimental and simulation data showing that the nature of hysteresis in temperature-occupancy data for CO2 in e-2–Mg2(dobpdc) is consistent with CO2 polymerization in the absence of an underlying phase transition. Our work provides a link between microscopic models of gas adsorption and experimental data, and provides fundamental understanding of a phenomenon of experimental and industrial importance.
II Results
II.1 Qualitative overview of hysteresis in gas-uptake data
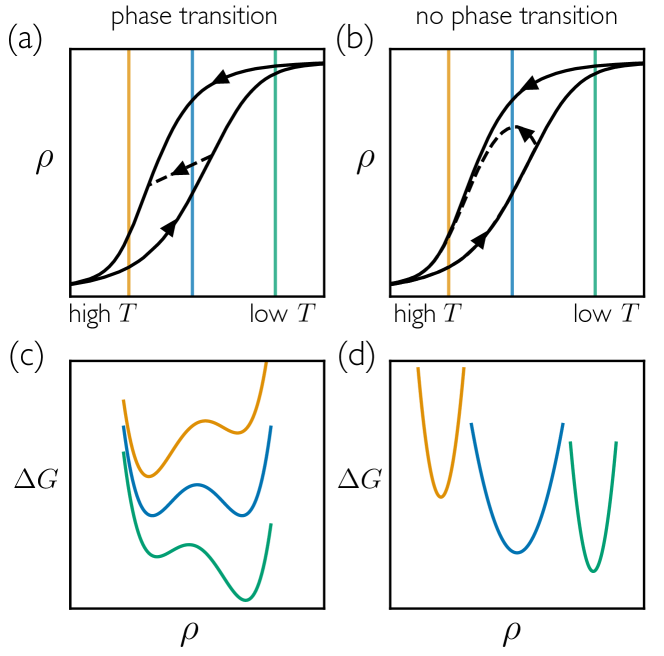
To provide a basis for our claim we summarize in Fig. 1(a,c) the canonical case of hysteresis accompanying a first-order phase transition. In panel (a) we show typical adsorption-desorption curves 111Such curves are often referred to as “isobars”, even though the system is not in equilibrium. The true equilibrium isobar has a unique value as a function of temperature. for an ordered porous material with a narrow pore-size distribution, as a function of temperature , for the case in which the adsorbate or framework undergoes a first-order phase transition (or a “rounded” transition if the system is of finite size wilms2010rounding ). In panel (c) we show the accompanying free-energy landscape for a single pore Evans1990 ; Monson2012 .
The origin of hysteresis in this scenario is the slow dynamics of nucleation: we must wait for a thermal fluctuation to generate a nucleus of the stable phase. Near phase coexistence the nucleation time is large, and can therefore exceed the experimental observation time. However, the system retains the ability to relax to the local or metastable equilibrium as is varied Debenedetti1996 . This separation of timescales can be identified by “early stop” desorption scans, initiated partway up the adsorption curve. One such example is shown as a black dashed line in panel (a). As increases (moving left on the figure) the adsorbate loading (dashed line) decreases monotonically: pores that are empty when the desorption scan begins remain so as the scan proceeds Everett1952 ; Everett1954 ; Kruk2000 ; McNall2001 ; Tompsett2005 (see e.g. Fig. 17 of Ref. Monson2012 ). Materials that display adsorption hysteresis due to an underlying structural transition show similar behavior ghysels2013 .
By contrast, we expect early-stop desorption experiments in the absence of a phase transition to behave as shown in Fig. 1(b). The associated free-energy surface, shown in panel (d), has a single minimum under all conditions, and the system should be able to evolve in the direction of this minimum on the timescale of the experiment. The result is a non-monotonic early-stop desorption curve.
II.2 Experimental data are consistent with the absence of a phase transition
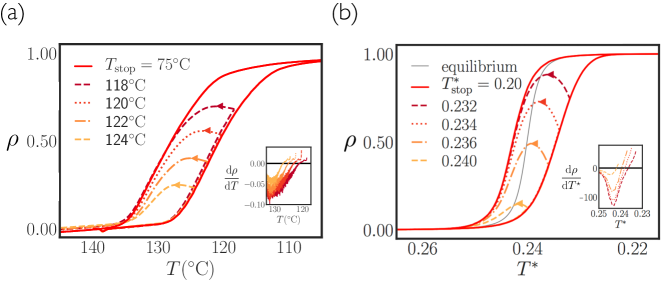
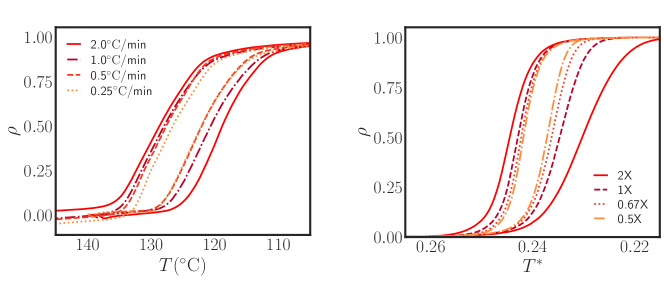
In Fig. 2(a) we show experimental adsorption and desorption curves for CO2 in the representative diamine-appended MOF e-2–Mg2(dobpdc); experimental details are given in Appendix A. In the figure we also show early-stop desorption curves (dotted lines) obtained by reversing the temperature scan partway up the adsorption curve. These curves behave according to the scenario shown in panel (b) of Fig. 1: the dynamics of cooperative adsorption in this MOF are qualitatively consistent with loading that proceeds in the absence of a phase transition. Similar non-monotonic behavior of the desorption curve is predicted to occur when diffusion of gas molecules within the framework is much slower than experimental timescales Ravikovitch2005 ; however, measured diffusion rates within our system Forse2018 rule out this alternative scenario.
II.3 Simulations provide a microscopic understanding of experimental observations
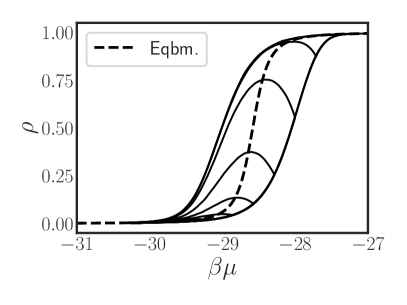
In Fig. 2(b) we show analogous data obtained from dynamic simulations of the statistical mechanical model of Ref. Kundu2018 . This model reproduces the cooperative adsorption of CO2 within the diamine-appended MOFs by considering the polymerization of ammonium carbamate chains along the pore direction. Our prior analysis of the model indicates that an abrupt (but finite) increase of the mean length of polymerized CO2 chains with temperature gives rise to a step-like isotherm in the absence of a phase transition. The associated adsorption curves agree qualitatively and semi-quantitatively with experimental data Kundu2018 . Here we present the model’s dynamical behavior, and show that it too is consistent with experimental data: the simulations of Fig. 2(b) are qualitatively consistent with the experiments of Fig. 2(a), and with the mechanism summarized by Fig. 1(b). Simulation results are averaged over 120 independent trajectories; error bars are smaller than the thickness of the lines. For computational efficiency we performed simulations at a higher temperature range ( K) than experiments ( K). The solid line marked “equilibrium” in Fig. 2(b) is obtained by transfer-matrix calculation, while the colored lines are obtained by dynamical simulation.
We show in Fig. A1 that varying the rates of temperature scan in experiment and simulation do not qualitatively change the scenario presented: in both cases, scanning temperature more slowly causes hysteresis loops to narrow, approaching (but not reaching) the equilibrium isobar. These changes are seen for any variation in scan rate, further supporting the picture we are presenting: modifying the hysteresis resulting from an underlying phase transition requires large changes in scan rate. (We also verified that simulations of the model reveal similar hysteretic behavior in uptake vs chemical potential curves at constant temperature; see Fig. A2.).
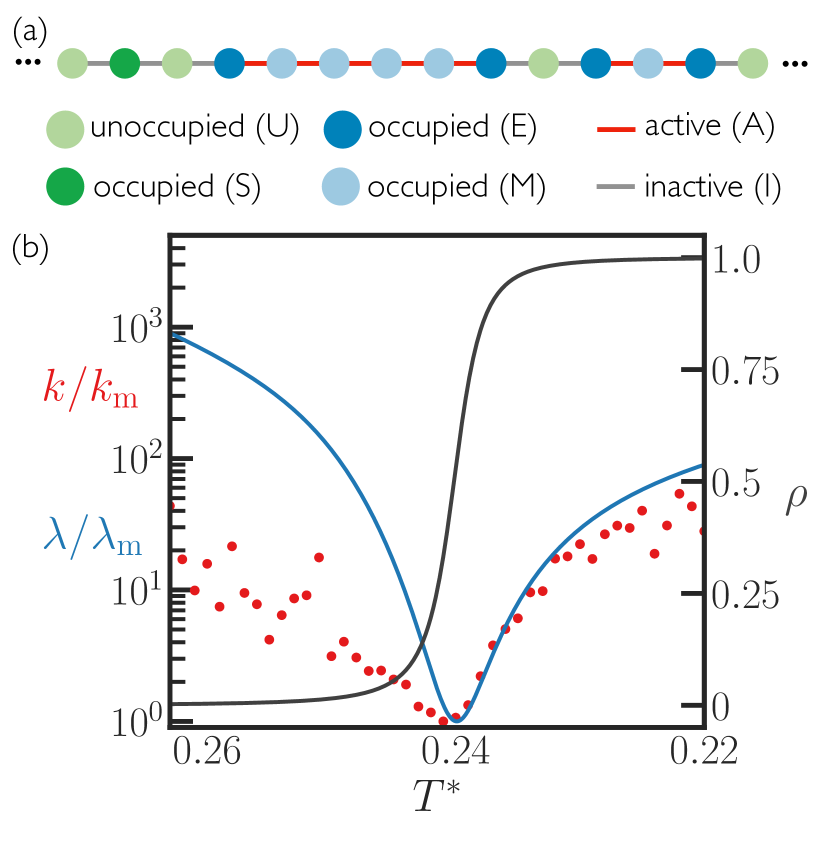
Microscopic understanding of this phenomenon can be obtained by considering in more detail the model, sketched in Fig. 3(a). The model is a representation of a one-dimensional channel of a diamine-appended MOF. The degrees of freedom of the model relate to the CO2 binding states of the appended diamines, and we distinguish between CO2 molecules bound singly or as part of a polymerized chain. The energetic parameters of the model are chosen to represent Mg metal sites, and the dynamics of the model is propagated using a standard continuous-time Monte Carlo scheme Gibson2000 ; details are given in Appendix B.
The model reveals that hysteresis results from the “flatness” of the free-energy landscape near the inflection point of the isotherm. In Fig. 3(b) we show the equilibrium isobar of the model (gray), together with a measure of the basic collective timescale of the system (red) and a measure of the curvature of the free-energy surface (blue). The timescale is determined by changing pressure abruptly and measuring the rate of the system’s relaxation to equilibrium (Appendix B). The measure of free-energy curvature, , is the smallest eigenvalue of the Hessian matrix of the free energy expressed as a function of occupancies of CO2 in various binding states (see Appendix C). Near the inflection point of the isobar the system possesses a free-energy landscape that is almost flat, with no strong thermodynamic driving force for CO2 chains to grow or shrink. As a result, the relaxation time of the system is long, giving rise to hysteresis in the representation of Fig. 2.
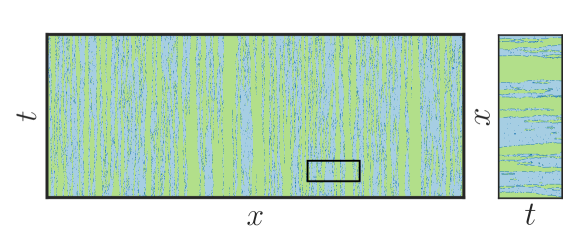
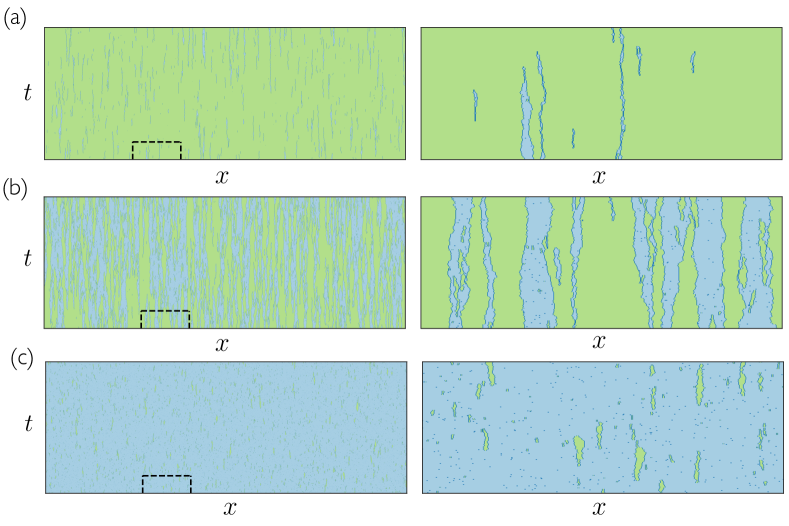
The flatness of the free-energy landscape near the inflection point of the isotherm results in a slow diffusive dynamics of ammonium carbamate chain growth and shrinkage. In Fig. 4 we show a space-time plot of the model’s dynamics, in which slow diffusive fluctuations of the lengths of polymerized CO2 chains are apparent. By contrast, hysteresis in the presence of a first-order phase transition results from slow nucleation of the stable phase in a background of the metastable one.
III Conclusions
Cooperative adsorption of gases is of considerable scientific and technological importance. Despite recent advances in developing materials in which cooperative adsorption occurs mcdonald2012 ; david2015 ; long_mixture , we lack a complete understanding of how the phenomenon results from the interplay of gas molecules with their host framework. Building on Ref. Kundu2018 , this paper puts foward a molecular description of cooperative CO2 adsorption in the metal–organic frameworks Mg2(dobpdc), using the hysteresis seen in experiment as a means of distinguishing between two possible scenarios. Fundamental understanding of cooperative adsorbers will enable the rational design of these materials; for instance, analysis of the model allows us to identify the gas-metal binding energies for which cooperative adsorption occurs, and indicates how to move the inflection point of the isotherm to desired values of temperature and pressure. Fundamental understanding of gas uptake will also allow the design of experimental loading protocols that minimize dissipation seifert2005entropy , a first step toward the design of energy-efficient industrial protocols.
Acknowledgements.
The computational portion of this research was carried out as part of a User project at the Molecular Foundry at Lawrence Berkeley National Laboratory (LBNL), supported by the Office of Science, Office of Basic Energy Sciences, of the U.S. Department of Energy under Contract No. DE-AC02-05CH11231. The experimental portions of the research and the contributions of J.E., R.L.S., Z.P., J.K., and J.R.L. were supported by the Center for Gas Separations, an Energy Frontier Research Center supported by the U.S. Department of Energy, Office of Science, Office of Basic Energy Sciences, under Award DE-SC0001015. J.R.L. serves as a director of and has a financial interest in Mosaic Materials, Inc., a start-up company working to commercialize metal-organic frameworks of the type investigated here. Some of these materials are the subject of patent applications submitted by the University of California, Berkeley. Data availability: All data needed to evaluate the conclusions in the paper are present in the paper and/or the Supplementary Materials. Additional data related to this paper may be requested from the authors. Author contributions: J.E., J.K., Z.P. and S.W. planned and carried out the simulations, and R.L.S. and J.R.L. did the same for the experiments. All authors contributed to the data analysis and interpretation.Appendix A Experimental Methods
A.1 General Materials and Methods
All synthetic manipulations were carried out under air. All solvents and the diamine e-2 (-ethylethylenediamine) were purchased from commercial suppliers and used without further purification. The ligand 4,4’-dihydroxy-(1,1’-biphenyl)-3,3’-dicarboxylic acid (H4dobpdc) was obtained from Hangzhou Trylead Chemical Technology Co. Ultra-high purity gases (99.998%) were used for all adsorption experiments.
A.2 Synthesis of e-2–Mg2(dobpdc)
The metal–organic framework Mg2(dobpdc) was synthesized, washed, and characterized following a previously reported procedure Siegelman2017 . Post-synthetic functionalization to prepare the diamine-appended framework e-2–Mg2(dobpdc) was performed as reported previously Siegelman2017 . The diamine loading was determined following literature procedure Siegelman2017 by collecting 1H NMR spectra of material digested with DCl (35 wt % in D2O) in DMSO-d6. Spectra were collected on a Bruker AMX 300 MHz NMR spectrometer and referenced to residual DMSO ( 2.50 ppm). The diamine loading of as-synthesized e-2–Mg2(dobpdc) was found to be 125%, as determined from the ratio of the diamine to ligand peak integrals. A representative diamine loading of 98% was determined following isobar collection. All adsorption data were collected on individual aliquots of a single sample within one week of preparation.
A.3 Thermogravimetric Analysis
Adsorption and desorption isobars were collected using a TGA Q5000 thermogravimetric analyzer. A flow rate of 10 mL/min was used for all gases, and masses were uncorrected for buoyancy effects. Samples were activated at 120∘C for 20 min under pure N2 before isobar collection. Isobars were measured under pure CO2 at atmospheric pressure using a temperature ramp rate of 1∘C/min.
| Event | Rate |
|---|---|
Appendix B Simulations of the statistical mechanical model
We used the one-dimension version of the model of Ref. Kundu2018 , sketched in Fig. 3(a), choosing energetic parameters appropriate for the metal Mg. We simulated the model using the Next Reaction Method of Gibson and Bruck Gibson2000 ; Li2015 , whose computational cost per event scales as for a lattice model of sites. We allowed the range of processes described in Table 1, including the binding and unbinding of CO2 molecules, and the formation of bonds between them. The stationary distribution of the Markov chain defined by these rates is the grand-canonical probability density of the system.
The constants and set the time- and energy scales of the system. The energy scale kJ/mol is the binding energy of a single CO2 molecule within the framework. Following Ref. Kundu2018 , the binding constants of the gas molecules in the occupied S, M, E states (see Fig. 3(a)) are , and . We set the activity of the system to be . We set the barrier height for the site transition to and the barrier height for all bond transitions to , and verified via numerical simulations that small variations in these choices do not affect any of the conclusions of our work. For reasons of computational feasibility we performed the simulations at a higher temperature range than the experiments.
We measured the relaxation rate in our simulations, displayed in Fig. 3, as follows. The system is initially equilibrated at a certain value of temperature and activity or pressure , and has a CO2 occupancy . We then make an abrupt change in temperature of the of the system. Following this change we measured the CO2 occupancy , averaged over 120 trajectories, until equilibrium is achieved. We compared the final density measured in simulations with exact analytical transfer-matrix calculations to ensure that the system has equilibrated. We fit to an exponential form , thus obtaining . Values obtained in this way are shown in Fig. 3. We determined the basic time scale of the system, s-1, by equating the relaxation rate measured in experiments (upon an abrupt pressure change) to the relaxation rate of our model for a step change in pressure at constant temperature.
Appendix C Analytic treatment of the statistical mechanical model
As shown in Fig. 3, the curvature of the free-energy landscape of our statistical mechanical model is correlated with the dynamical relaxation time of the model. Near the inflection point of the isobar the free-energy landscape is almost flat, implying that the thermodynamic driving force for polymerized CO2 chains to grow or shrink is small. In this section we detail our calculation of the curvature of the model’s free energy.
The grand partition function of the model is given by
| (1) |
where
| (2) |
is the number of ways of arranging single molecules, internal chain molecules, and chain end-points on a one-dimensional lattice of sites. The quantity , with , is the statistical weight of a CO2 molecule in conformation . The free energy in the thermodynamic limit is
| (3) | |||||
where , with , is the fraction of CO2 molecules in conformation .
The Hessian is a matrix built from the three variables , , and , with matrix elements
| (4) |
evaluated at the free-energy minimum.
For a given pressure (the statistical weight is proportional to the pressure), we evaluated at the equilibrium values of , , and , and calculated the three eigenvalues. We find that the smallest eigenvalue, called in Fig. 3(b), is small at the inflection point of the isobar, indicating that there is no strong thermodynamic driving force for the growth or decay of ammonium carbamate chains. As a result, the dynamics of the model becomes slow, and we show in Fig. 3(b) that the minimum relaxation rate occurs near the minimum of .
Appendix D Additional figures
- •
-
•
In Fig. A2 we show uptake vs chemical potential at constant temperature. At each value of chemical potential the system evolves for an observation time of before the chemical potential is changed. The dashed line gives the exact equilibrium density and is computed using transfer matrices. The behavior of the scanning curves is qualitatively similar to the case of uptake versus temperature at fixed pressure.
- •
References
- (1) D. Britt, H. Furukawa, B. Wang, T. G. Glover, and O. M. Yaghi, “Highly efficient separation of carbon dioxide by a metal-organic framework replete with open metal sites,” Proc. Natl. Acad. Sci., vol. 106, p. 20637, 2009.
- (2) K. Sumida, D. L. Rogow, J. A. Mason, T. M. McDonald, E. D. Bloch, Z. R. Herm, T.-H. Bae, and J. R. Long Chem. Rev., vol. 112, p. 724, 2012.
- (3) H. Furukawa, K. E. Cordova, M. O’Keeffe, and O. M. Yaghi, “The chemistry and applications of metal-organic frameworks,” Science, vol. 341, p. 1230444, 2013.
- (4) T. M. McDonald, W. R. Lee, J. A. Mason, B. M. Wiers, C. S. Hong, and J. R. Long, “Capture of carbon dioxide from air and flue gas in the alkylamine-appended metal–organic framework mmen-mg2 (dobpdc),” J. Am. Chem. Soc., vol. 134, p. 7056, 2012.
- (5) T. M. McDonald, J. A. Mason, X. Kong, E. D. Bloch, D. Gygi, A. Dani, V. Crocellà, F. Giordanino, S. O. Odoh, W. S. Drisdell, B. Vlaisavljevich, A. L. Dzubak, R. Poloni, S. K. Schnell, N. Planas, K. Lee, T. Pascal, L. F. Wan, D. Prendergast, J. B. Neaton, B. Smit, J. B. Kortright, L. Gagliardi, S. Bordiga, J. A. Reimer, and J. R. Long Nature, vol. 519, p. 303, 2015.
- (6) J. A. Mason, T. M. McDonald, T.-H. Bae, J. E. Bachman, K. Sumida, J. J. Dutton, S. S. Kaye, and J. R. Long J. Am. Chem. Soc., vol. 137, p. 4787, 2015.
- (7) A. Schneemann, V. Bon, I. Schwedler, I. Senkovska, S. Kaskel, and R. A. Fischer Chem. Soc. Rev., vol. 43, p. 6062, 2014.
- (8) E. R. Engel, A. Jouaiti, C. X. Bezuidenhout, M. W. Hosseini, and L. J. Barbour J. Angew. Chem., Int. Ed., vol. 56, p. 8874, 2017.
- (9) F.-X. Coudert, M. Jeffroy, A. H. Fuchs, A. Boutin, and C. Mellot-Draznieks J. Am. Chem. Soc., vol. 130, p. 14294, 2008.
- (10) C. Triguero, F.-X. Coudert, A. Boutin, A. H. Fuchs, and A. V. Neimark J. Phys. Chem. Lett., vol. 2, p. 2033, 2011.
- (11) D. Bousquet, F.-X. Coudert, A. G. J. Fossati, A. V. Neimark, A. H. Fuchs, and A. Boutin J. Chem. Phys., vol. 138, p. 174706, 2013.
- (12) A. Ghysels, L. Vanduyfhuys, M. Vandichel, M. Waroquier, V. V. Speybroeck, and B. Smit, “On the thermodynamics of framework breathing: A free energy model for gas adsorption in mil-53,” J. Phys. Chem. C, vol. 117, p. 11540, 2013.
- (13) C. M. Simon, E. Braun, C. Carraro, and B. Smit, “Statistical mechanical model of gas adsorption in porous crystals with dynamic moieties,” Proceedings of the National Academy of Sciences, vol. 114, no. 3, pp. E287–E296, 2017.
- (14) J. J. Binney, N. J. Dowrick, A. J. Fisher, and M. E. Newman, The theory of critical phenomena: an introduction to the renormalization group. Oxford University Press, 1992.
- (15) J. Kundu, J. F. Stilck, J.-H. Lee, J. B. Neaton, D. Prendergast, and S. Whitelam, “Cooperative gas adsorption without a phase transition in metal-organic frameworks,” Physical Review Letters, vol. 121, p. 015701, 2018.
- (16) R. Evans, “Fluids adsorbed in narrow pores: phase equilibria and structure,” Journal of Physics: Condensed Matter, vol. 2, no. 46, p. 8989, 1990.
- (17) P. A. Monson, “Understanding adsorption/desorption hysteresis for fluids in mesoporous materials using simple molecular models and classical density functional theory,” Microporous and Mesoporous Materials, vol. 160, pp. 47–66, 2012.
- (18) S. B. Smith, Y. Cui, and C. Bustamante, “Overstretching b-dna: the elastic response of individual double-stranded and single-stranded dna molecules,” Science, vol. 271, no. 5250, pp. 795–799, 1996.
- (19) S. Cocco, J. Yan, J.-F. Léger, D. Chatenay, and J. F. Marko, “Overstretching and force-driven strand separation of double-helix dna,” Physical Review E, vol. 70, no. 1, p. 011910, 2004.
- (20) S. Whitelam, S. Pronk, and P. L. Geissler, “There and (slowly) back again: entropy-driven hysteresis in a model of dna overstretching,” BioPhysical journal, vol. 94, no. 7, pp. 2452–2469, 2008.
- (21) H. Fu, H. Chen, J. F. Marko, and J. Yan, “Two distinct overstretched dna states,” Nucleic acids research, vol. 38, no. 16, pp. 5594–5600, 2010.
- (22) Such curves are often referred to as “isobars”, even though the system is not in equilibrium. The true equilibrium isobar has a unique value as a function of temperature.
- (23) D. Wilms, A. Winkler, P. Virnau, and K. Binder, “Rounding of phase transitions in cylindrical pores,” Physical review letters, vol. 105, no. 4, p. 045701, 2010.
- (24) P. G. Debenedetti, Metastable liquids: concepts and principles. Princeton University Press, 1996.
- (25) D. H. Everett and W. I. Whitton, “A general approach to hysteresis,” Transactions of the Faraday Society, vol. 48, pp. 749–757, 1952.
- (26) D. Everett, “A general approach to hysteresis. part 3.—a formal treatment of the independent domain model of hysteresis,” Transactions of the Faraday Society, vol. 50, pp. 1077–1096, 1954.
- (27) M. Kruk, M. Jaroniec, and A. Sayari, “Nitrogen adsorption study of mcm-41 molecular sieves synthesized using hydrothermal restructuring,” Adsorption, vol. 6, no. 1, pp. 47–51, 2000.
- (28) M. McNall, R. Laurence, and W. C. Conner, “An experimental approach to test sorption mechanisms in mcm-41,” Microporous and mesoporous materials, vol. 44, pp. 709–716, 2001.
- (29) G. Tompsett, L. Krogh, D. Griffin, and W. Conner, “Hysteresis and scanning behavior of mesoporous molecular sieves,” Langmuir, vol. 21, no. 18, pp. 8214–8225, 2005.
- (30) A. Ghysels, L. Vanduyfhuys, M. Vandichel, M. Waroquier, V. Van Speybroeck, and B. Smit, “On the thermodynamics of framework breathing: A free energy model for gas adsorption in mil-53,” The Journal of Physical Chemistry C, vol. 117, no. 22, pp. 11540–11554, 2013.
- (31) P. I. Ravikovitch and A. V. Neimark, “Diffusion-controlled hysteresis,” Adsorption, vol. 11, pp. 265–270, Jul 2005.
- (32) A. C. Forse, M. I. Gonzalez, R. L. Siegelman, V. J. Witherspoon, S. Jawahery, R. Mercado, P. J. Milner, J. D. Martell, B. Smit, B. Blümich, et al., “Unexpected diffusion anisotropy of carbon dioxide in the metal–organic framework zn2 (dobpdc),” Journal of the American Chemical Society, vol. 140, no. 5, pp. 1663–1673, 2018.
- (33) M. A. Gibson and J. Bruck, “Efficient exact stochastic simulation of chemical systems with many species and many channels,” The journal of Physical Chemistry A, vol. 104, no. 9, pp. 1876–1889, 2000.
- (34) U. Seifert, “Entropy production along a stochastic trajectory and an integral fluctuation theorem,” Physical Review Letters, vol. 95, no. 4, p. 040602, 2005.
- (35) R. L. Siegelman, T. M. McDonald, M. I. Gonzalez, J. D. Martell, P. J. Milner, J. A. Mason, A. H. Berger, A. S. Bhown, and J. R. Long, “Controlling cooperative co2 adsorption in diamine-appended mg2 (dobpdc) metal–organic frameworks,” Journal of the American Chemical Society, vol. 139, no. 30, pp. 10526–10538, 2017.
- (36) Y. Li and L. Hu, “A fast exact simulation method for a class of markov jump processes,” The Journal of Chemical Physics, vol. 143, no. 18, p. 184105, 2015.