Observing the Earliest Stages of Star Formation in Galaxies: m Cores in Three Edge-on Disks
Abstract
To study the vertical distribution of the earliest stages of star formation in galaxies, three edge-on spirals, NGC 891, NGC 3628, and IC 5052 observed by the Spitzer Space Telescope InfraRed Array Camera (IRAC) were examined for compact m cores using an unsharp mask technique; 173, 267, and 60 cores were distinguished, respectively. Color-color distributions suggest a mixture of PAHs and highly-extincted photospheric emission from young stars. The average V-band extinction is mag, equally divided between foreground and core. IRAC magnitudes for the clumps are converted to stellar masses assuming an age of 1 Myr, which is about equal to the ratio of the total core mass to the star formation rate in each galaxy. The extinction and stellar mass suggest an intrinsic core diameter of pc for 5% star formation efficiency. The half-thickness of the disk of m cores is 105 pc for NGC 891 and 74 pc for IC 5052, varying with radius by a factor of . For NGC 3628, which is interacting, the half-thickness is 438 pc, but even with this interaction, the m disk is remarkably flat, suggesting vertical stability. Small scale structures like shingles or spirals are seen in the core positions. Very few of the m cores have optical counterparts.
1 Introduction
Spitzer Space Telescope InfraRed Array Camera (IRAC) images of M100 (Elmegreen et al., 2018, Paper 1) and 15 other spiral galaxies at low inclination (Elmegreen & Elmegreen, 2019, Paper 2) show regularly spaced m peaks in kpc-long filaments that run along the spiral arms and interarm spurs. The summed IRAC luminosities of these peaks were found to reproduce the galactic star formation rates if this phase of young stellar evolution lasts between 0.2 and 2 Myr, which is reasonable for embedded sources close to their time and place of formation. Other measures of the star formation rate, such as H and FUV, get about the same rates but highlight later phases of evolution when the ionized gas and young stars break out from their cloud cores (Kennicutt & Evans, 2012; Hannon et al., 2019). These later phases, along with the irregularity of H emission and the obscuration of optical and FUV light by dust, hide important clues to the star formation process.
The morphology of m peaks presents a much clearer picture. This morphology suggests that most star formation begins by gravitational collapse in dense gas that is compressed by large scale dynamical processes, such as spiral arm shocks, spurs, and giant shells driven by young stellar feedback (e.g., Elmegreen, 1979; Cowie, 1981; Tomisaka, 1987; Kim & Ostriker, 2001; Kim et al., 2002a; Kim & Ostriker, 2002b, 2006, 2007; Dobbs, 2008; Renaud et al., 2013, 2014; Elmegreen et al., 2014, Papers 1,2).
Here we investigate three edge-on galaxies that have IRAC data similar to that in Papers 1 and 2. We find compact m sources using an unsharp mask technique and study their colors, luminosities and spatial distributions. Edge-on galaxies complement our previous study by showing the vertical distributions of the m cores and the thicknesses of the star-forming layers. Also at m, the extinction is so low that we can observe most of the star-forming regions throughout a galaxy even though the line of sight spans many kiloparsecs.
2 Observations
To find edge-on galaxies for this survey, we searched the Spitzer archives for IRAC channel 4 (m) observations using galaxy samples designed for studies of thick disks (Comerón et al., 2011, 2012). Three good cases were found, NGC 891, NGC 3628, and IC 5052, as listed in Table 1. They are all at a distance of Mpc or less, which gives good spatial resolution, and they have m sources all over their disks. Eleven other galaxies in this sample have m images but are either too distant or have too few detectible sources: NGC 1032 and NGC 4441 are too distant111https://ned.ipac.caltech.edu/ at 37.1 Mpc and 38.9 Mpc, respectively. IC610 (15 Mpc), NGC 4081 (21.3 Mpc), and NGC 4111 (11.4 Mpc) primarily show their nuclear regions at m, NGC 4565 (16.8 Mpc) has mostly a nuclear ring at m, and NGC 1495 (15.5 Mpc) and NGC 3592 (16.8 Mpc) do not have much emission at all at 8 micron. NGC 5981 (26.4 Mpc) has only 3 obvious sources and NGC 3501 (14.5 Mpc) has about 5 sources. NGC 4330 at 20.6 Mpc may be the most interesting of these additional cases, because it has some dozen detectable m sources in an unsharp mask image, but it is still inferior to the chosen sample where the number of sources ranges between and and the spatial resolution is 2 or more times better.
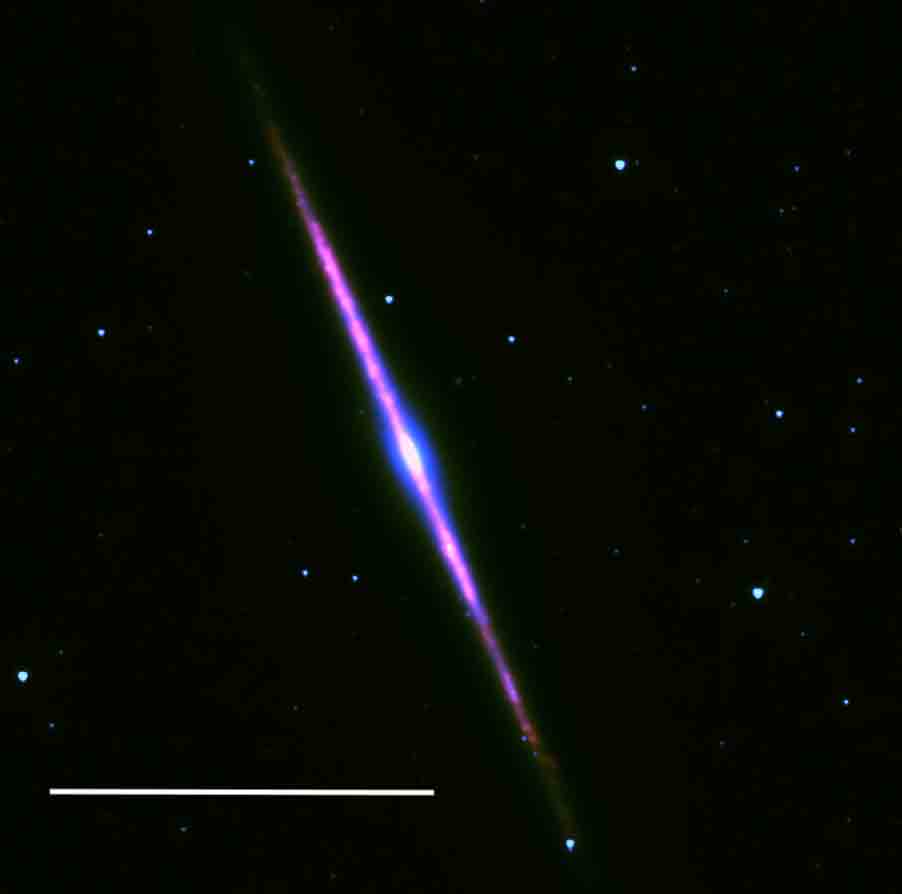
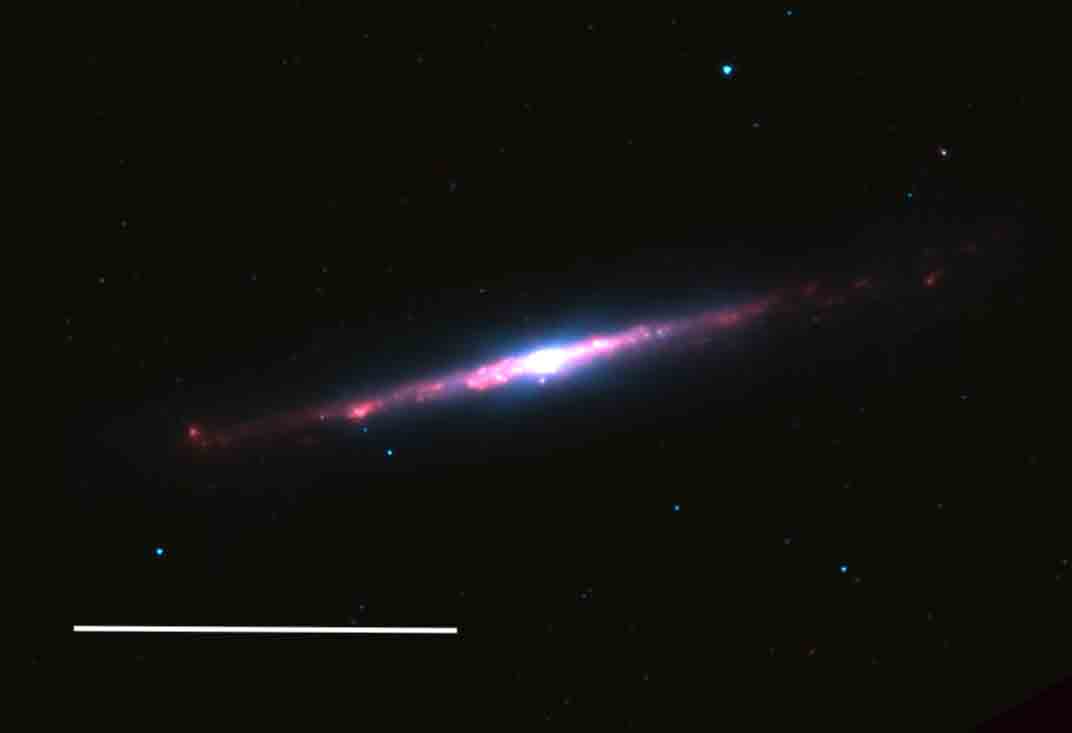
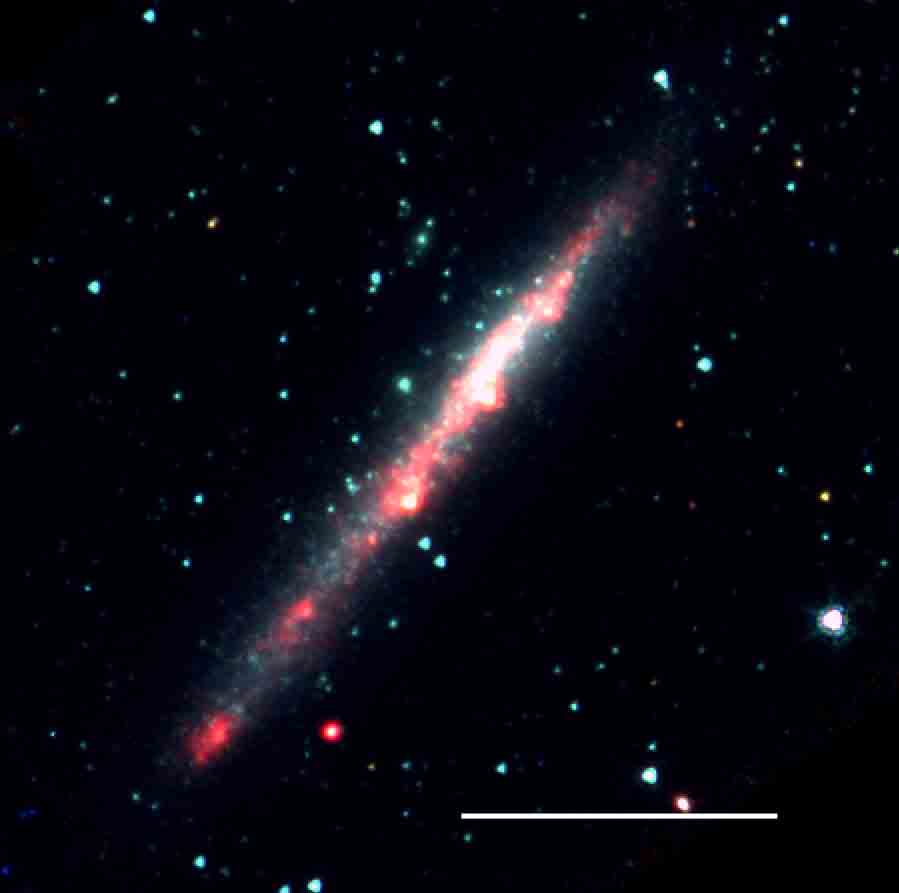
For the three chosen galaxies, the post-Basic Calibrated Data (BCD) processed images in all four IRAC bands were retrieved as FITS files and aligned through the Image Reduction Analysis Facility (IRAF) task wregister. Figure 1 shows them with color IRAC images made using the software package DS9 (north is up, west is to the right). Each is a composite of the archived m (in blue), m (in green), and m (in red) images. The pixel size in the IRAC mosaics used here is , and the angular resolution at m is FWHM (Chambers et al., 2009). Other angular resolutions and processing data are in Table 2.
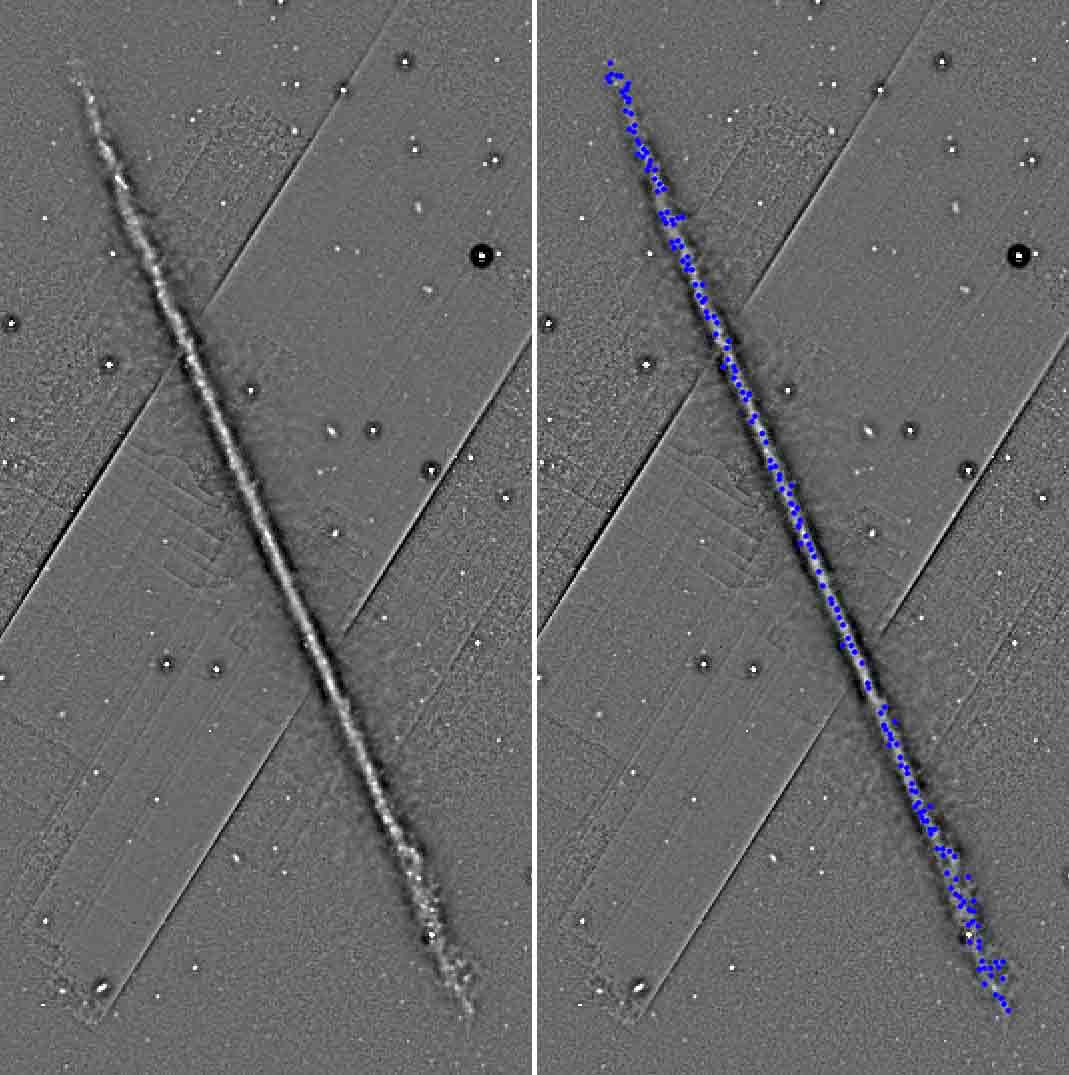
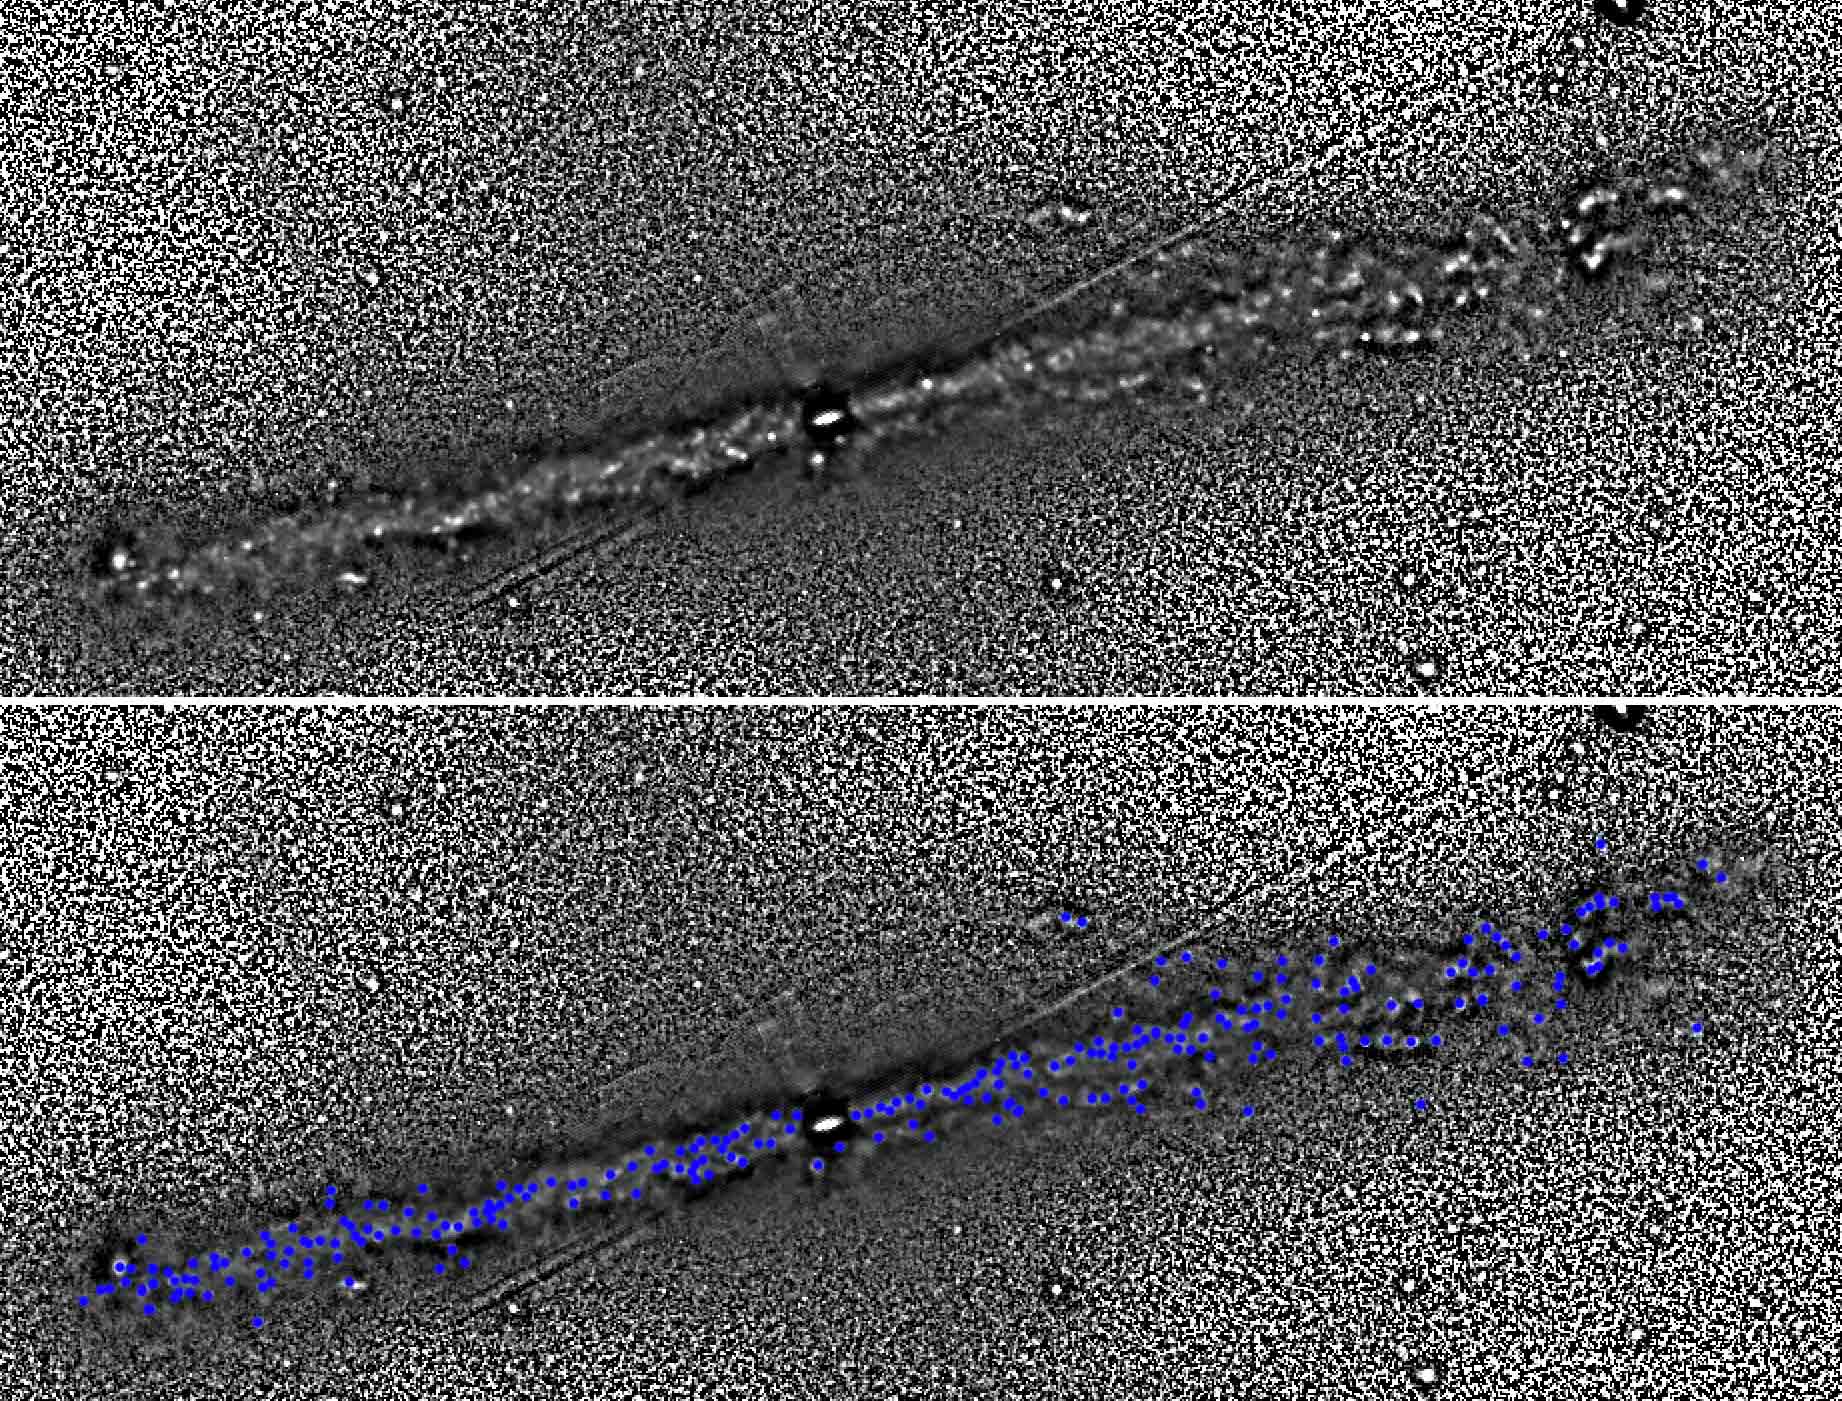
Unsharp mask images were made by dividing the m image by a blurred version of the same m image using the IRAF task with a 3 pixel sigma. Figures 2-4 show the results. On the left are the unsharp mask images in grayscale and on the right are the same images with the identified cores superimposed as blue dots. Most of the m cores in the unsharp mask images can also be seen as diffuse peaks in the IRAC color images. Division by the blurred m image highlights the densest emission regions and normalizes all the local backgrounds to show them in a single image. The selection effect for 6 pixels diameter in the unsharp mask procedure (i.e., twice the Gaussian sigma of the mask) implies that the luminosities and other derived quantities are limited to the core regions of what could be larger objects. Six pixels is still large compared to giant molecular clouds, however. The spatial scale of 6 pixels is 199 pc, 225 pc, and 120 pc for NGC 891, NGC 3628 and IC 5052, respectively, whereas giant molecular clouds are typically 20 to 50 pc in size (Sanders et al., 1985). Thus, the masks presumably capture most of the luminosity associated with localized star formation.
3 Properties of m Cores
Magnitudes of the m peaks on the original FITS images were determined in the four IRAC bands using the IRAF task phot with a measurement aperture of 2 pixels radius ( diameter), and background subtraction from an annulus between 3 and 4 pixels radius. The zeropoints and aperture corrections for conversion of counts to Vega-system magnitudes in each filter were taken from the IRAC Instrument handbook222http://irsa.ipac.caltech.edu/data/SPITZER/docs/irac/irac instrumenthandbook/ and are given in Table 2.
The right ascension, declination, magnitude and statistical error in magnitude for each filter are listed in Tables 5 to 7, along with the core colors that equal the magnitude differences. Blank entries represent core measurements that have statistical errors larger than 3 magnitudes or which could not be detected. We also removed m sources with , which are probably stars (Allen, 2004). Note that cores with a m detection and no m detection have large error limits in the m band, making the m band, which is generally fainter because of extinction (see below), undetected. The m band detects the most sources because it has the least extinction and has excess emission from PAHs; this is why we searched for sources on an unsharp mask image at m. All of the Table 1 entries have a blue dot in Figures 2-4.
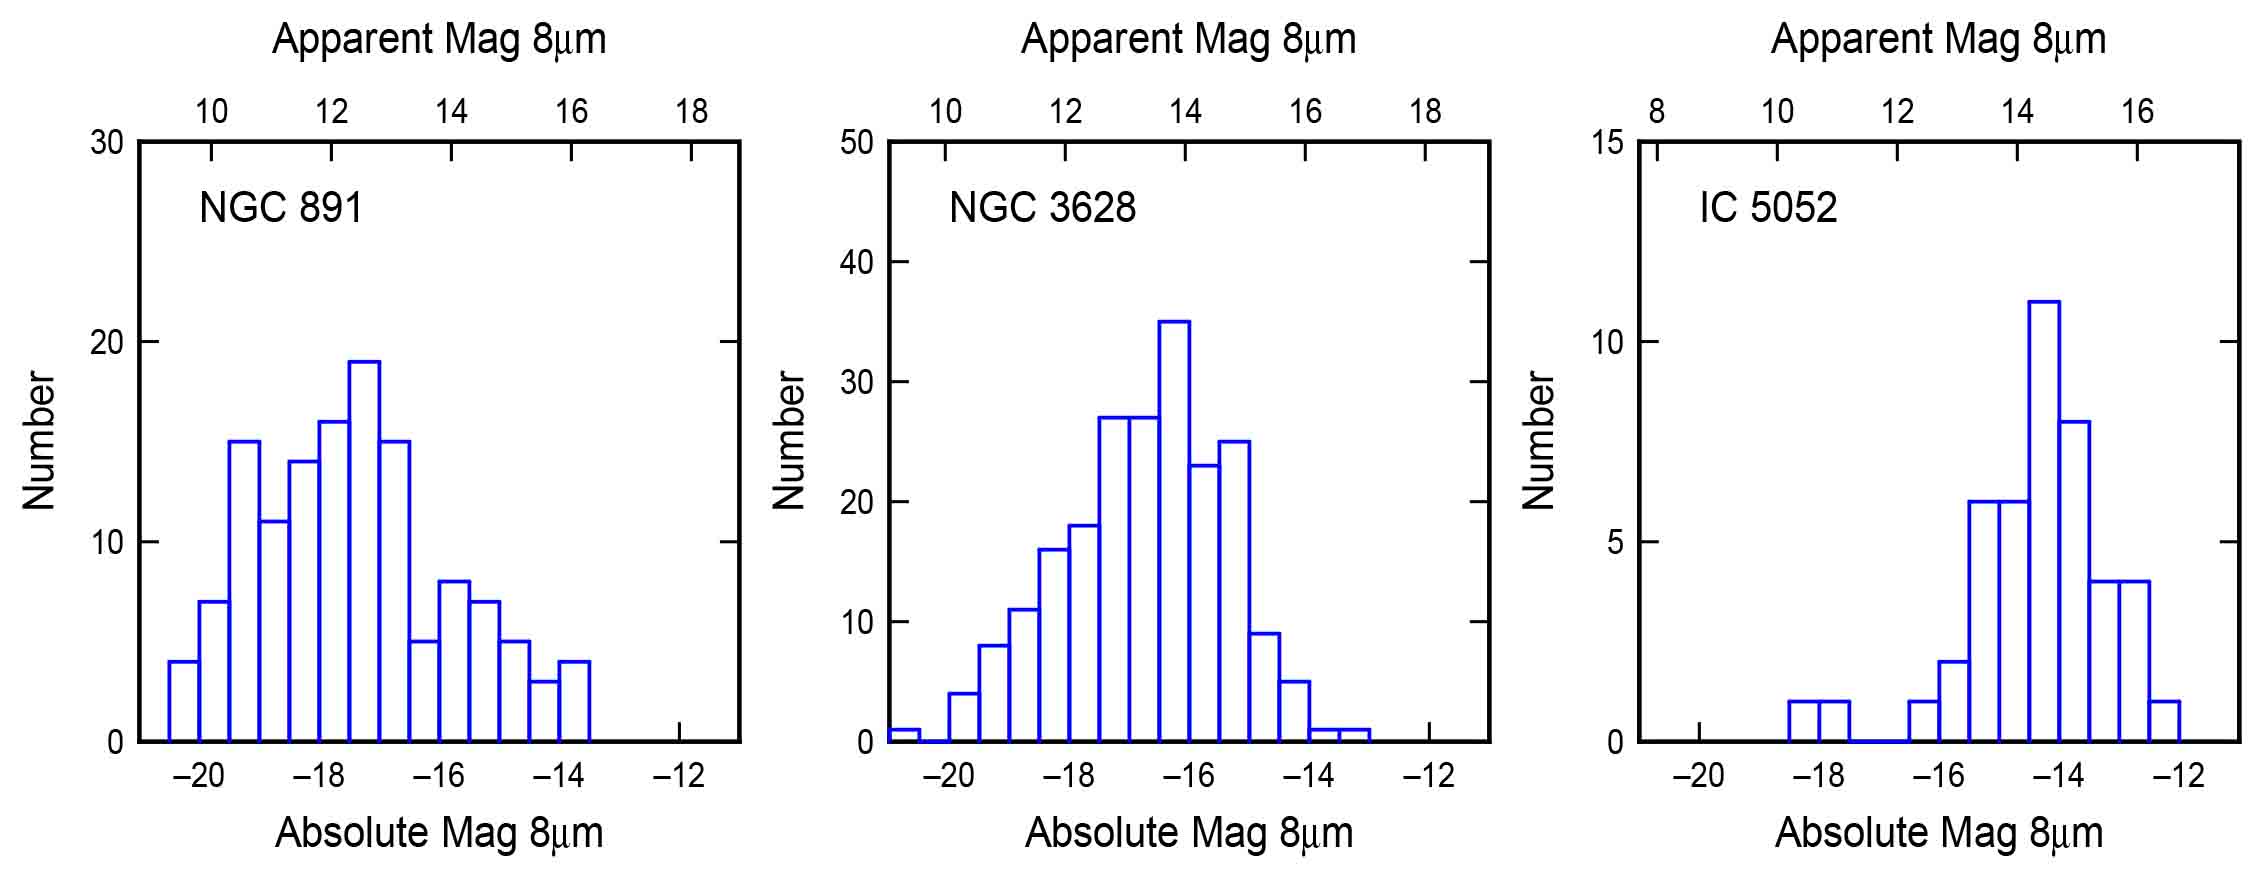
The distributions of m absolute and apparent magnitudes for sources that are detected in all four IRAC bands are shown in Figure 5. The cores typically become undetected below approximately mag, mag and mag for NGC 891, NGC 3628 and IC 5052. Larger-scale apertures for the photometry would include slightly more flux (e.g., Paper 2).
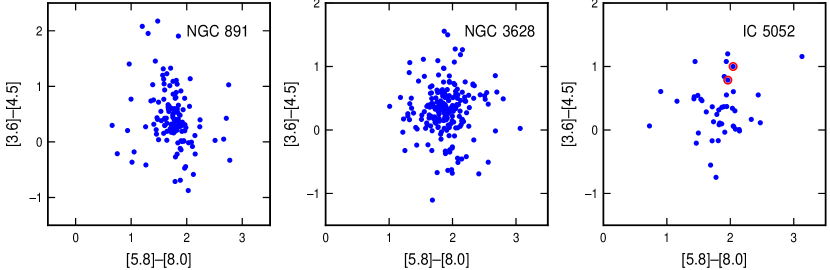
Region colors, shown in Figure 6, are not affected much by the aperture size (the points with red circles for IC 5052 will be discussed in Section 5.3). The average values for the Vega-system colors and their dispersions are in Table 3. Individual color uncertainties from measurement errors average 1.5 mag, but these are random so their contribution to the uncertainties in the average colors is approximately their ratio to the square root of the number of cores, or .
The average for is . In Paper 2, we found an average of mag for 8300 cores in 15 face-on galaxies. This lower value for face-on galaxies is presumably for the star forming cores alone, and the extra mag color excess for the present sample is from the long columns of dust on the lines of sight to the cores.
The colors suggest that emission from extincted photospheres makes positive but low, and emission from PAHs makes high (Papers 1,2; Elmegreen et al., 2006). Bare photospheric emission has in the Vega system (Allen, 2004), so our average value of implies contributions from extinction, PAH emission, and hot dust emission. According to Megeath et al. (2004), a visual extinction of 30 mag produces a color excess between 0.4 and 0.45 depending on the extinction law. Then . Chapman et al. (2009) measured and for local molecular clouds at , which is appropriate for our sources, and Bessell & Brett (1988) found . Together these give . Flaherty et al. (2007) got about the same for local clouds. We use here, and then corresponds to a visual extinction of mag if there is no emission from PAHs and hot dust.
Hot dust can cause to increase above the value from extinction alone. Mentuch et al. (2010) measured the ratio of intensities at m and m for individual pixels in 56 local galaxies and plotted this ratio versus the dust-corrected intensity of H as a measure of local UV radiation field. The m to m ratio increased with H approximately as for in MJy sr-1. Mentuch et al. (2010) suggested that this increase is from a combination of dust heating, which increases the intensity at longer wavelengths, and PAH emission in the m band. We have no H measurements of our m cores, but can estimate the intensity from the embedded cluster masses derived below, which are on the order of . For a population of stars younger than 1 Myr with a fully sampled Salpeter IMF, as assumed for the mass derivation, the Lyman continuum emission rate would be s-1 per solar mass of stars (Bruzual & Charlot, 2003), and, using the conversion in Kennicutt (1998), the H luminosity would be erg s-1 per solar mass. We convert this to intensity by dividing by the product of a presumed H linewidth of 30 km s-1 converted to a frequency interval, the solid angle of the source and times the square of the distance. The result is an estimated H intensity, in MJy sr-1 of for stellar mass in and source radius in pc. Then the Mentuch et al. (2010) observation implies from hot dust and PAH emission if all the radiation from that stellar mass goes to heat the dust. A correction to this estimate is needed for young stellar clusters with masses less than because they are not likely to have a completely sampled IMF. Using tables in Vacca et al. (1996) for a Salpeter IMF, we estimate that the H luminosity per solar mass starts to drop quickly below .
For and pc from the physical resolution of our survey, the above result implies should increase by because of hot dust. This is the full color excess we observe and suggests there is no extinction, which is unreasonable. More likely, only a fraction of the stellar luminosity that makes the m emission is heating the dust to a high temperature, and the rest is distributed to lower-density surrounding regions. If we assume % of the luminosity is responsible for the most heating, then the excess would be . Obviously this correction for hot dust is highly uncertain. We also assume the average color excess for cores in the three edge-on galaxies, , comprises a component from the core itself equal to , as determined for face-on galaxies in Paper 2, plus a foreground color excess from extinction equal to the residual, . Then, with a component of mag from local heating, the sources are left with mag from extinction alone. That corresponds to mag using the above calibration.
The gas mass surface density corresponding to this extinction comes from the conversion of into HI column density. The local conversion factor between color excess and HI column density is (Bohlin et al., 1978), and the ratio of total-to-selective extinction for diffuse gas is , giving . Wolk et al. (2008) got the about same, , from X-ray and IR observations of a massive star-forming region. Winston et al. (2010) however got cm-2 from X-ray and IR observations. Similarly, Chapman et al. (2009) found at mag, which would lower the Bohlin et al. (1978) conversion to . Here we take for the highly extincted regions observed as m emission cores. This HI column density converts to a mass surface density of pc-2 assuming a mean atomic weight of 1.36. Thus, mag from the corrected color excess corresponds to a mass surface density close to the source of pc-2. This is comparable to the surface densities of giant molecular clouds (Heyer & Dame, 2015).
Considering now the foreground extinction, the difference, mentioned above, between the average found here for m cores in three edge-on galaxies and the average for 15 face-on galaxies in our previous study is . This is presumably from diffuse dust on the line of sight, so we convert it to extinction without the correction for hot dust, using from above. The result is mag, which corresponds to a foreground column density cm-2 for the calibration (the value for normal regions). Dividing this foreground column density by a typical pathlength of kpc through the edge-on disk, the average space density is H cm-3, which is a reasonable value for the midplane of a spiral galaxy (Bohlin et al., 1978). Alternatively, the mass surface density of foreground gas is pc-2 from the conversion pc-2 discussed above, again with a factor of 2 multiplier for normal regions. Dividing this by 5 kpc gives pc-3, which is about the same as the average gas density in the solar neighborhood, pc-3 (McKee et al., 2015).
Some m cores have much higher colors than average, greater than 1 in NGC 891 and NGC 3628 (Fig. 6). The corresponding extinction could be several times higher than the average for individual cores. In comparison, there were hardly any cores with in the face-on galaxies. The extremely red regions in the edge-on cases are probably blends from several star-forming regions on the line of sight.
Blends are expected in edge-on galaxies for lines of sight that are close to the center or parallel to spiral arms. Paper 2 found 8300 m cores brighter than a completeness limit in 15 face-on galaxies, for an average of detected m cores per galaxy. Here we find 500 distinct cores in 3 edge-on galaxies, for an average of 170 per galaxy. That difference suggests we are missing two-thirds of the cores because of excessive faintness or blending. The resolution of our survey from the unsharp mask is pc, so each object projects an area in a disk of area for half-thickness and projected disk radius . Taking kpc and pc, the ratio of core area to disk area is 0.8%. Considering Poisson probabilities with 500 potential cores, the fraction of the projected area of the galaxy without a core is only %. Thus most cores overlap with some other core, especially in the denser regions.
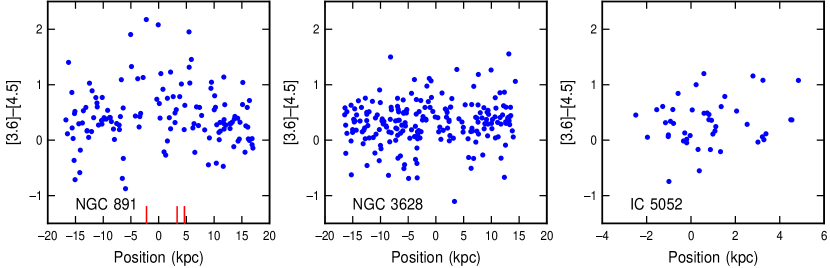
Figure 7 shows the colors versus position along the galaxy in kpc, with position zero being the galactic center in the m IRAC image and negative position to the west. The colors are slightly redder near the center for NGC 891, but not for the other galaxies. Red lines at the bottom of the panel for NGC 891 show the positions of strong features in CO(3-2) that could be inner spiral arms (Dumke et al., 2001). There is no obvious additional reddening of the cores in these spiral regions.
The average optical extinction derived from IRAC colors, mag, is about the same as for giant molecular clouds in the Milky Way (Heyer & Dame, 2015), suggesting we are seeing the bright regions associated with giant molecular clouds where clusters and OB associations form. Such cores would be much smaller than the pixel size of . We show below that the average young stellar mass is within a factor of a few either way times . If the total gas mass is the stellar mass for a local star formation efficiency of 5%, and the gas mass surface density in front of the stars is pc-2, as suggested above from the source extinction, and if there is an equal gas surface density associated with the cluster behind it, then the average diameter of a core is pc. This is similar to that of molecular and infrared-dark clouds in the Milky Way (Simon et al., 2006) and a factor of larger than young clusters in other galaxies (Ryon et al., 2017).
The color is not significantly affected by extinction (Allen, 2004), so the mean value of for our sources requires an excess emission at m. We discussed in Paper 2 how this excess, which resembles that in integrated galaxy disks (Stern et al., 2005; Winston et al., 2007; Gutermuth et al., 2009; Stutz et al., 2013), is likely to be from PAH emission on carbonaceous grains, which produce emissions in both bands with an excess at m to m (Li & Draine, 2001).
4 Positional Distribution of the m cores
4.1 Disk Thickness
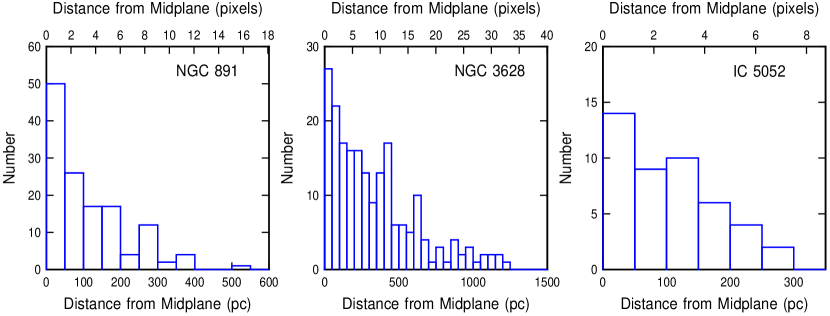
The distribution function of core distances from the midplane is shown for each galaxy in Figure 9. The midplane was determined by fitting the m core positions to a line. The rms dispersion of the midplane distance, considered to be the half-thickness of the disk distribution of m cores, is 105 pc for NGC 891, 438 pc for NGC 3628, and 74 pc for IC 5052. For NGC 891 and IC 5052, these are good representations of the disk half-thickness, but NGC 3628 is warped as a result of a recent interaction (it is part of the Leo triplet, Arp 317, Arp, 1966), and it is much thicker on the western side.
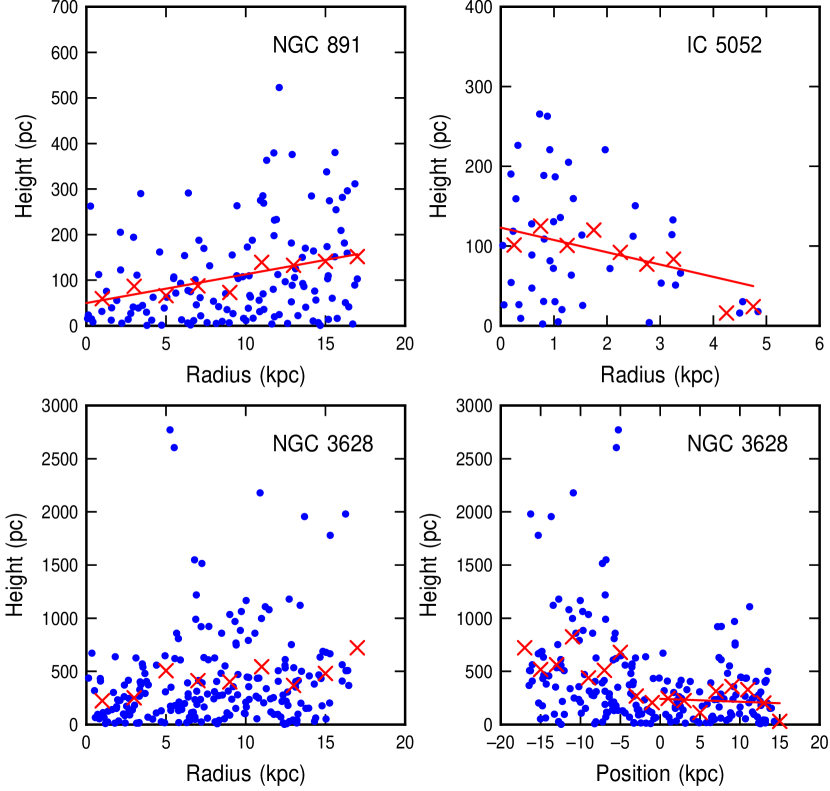
Figure 9 shows the distance to the midplane for each core as a function of projected galactocentric radius. In the bottom right panel, which is for NGC 3628, the distance to the midplane is plotted versus position along the midplane, with position 0 being the center of the galaxy as determined by the peak in the m emission. Negative position for NGC 3628 is to the northwest, where there is a large warp and thickening on deep HI (Wilding et al., 1993) and optical images. The red crosses in the figure are average distances for positions in the intervals centered around them. NGC 891 has a steadily increasing distance to the midplane that varies as
| (1) |
which is from pc inside 6 kpc (the first three crosses) to 142 pc outside 12 kpc. IC 5052 has a nearly constant, or possibly decreasing, midplane distance, varying as
| (2) |
with an average inside 3.5 kpc of 100 pc. The southeast part of NGC 3628, which is relatively free of the warp, has a midplane distance that is constant to within the errors,
| (3) |
These trends are shown in Figure 9. A slight increase with radius is expected in a typical galaxy (Narayan & Jog, 2002) and is observed in Milky Way atomic (Malhotra, 1995) and molecular (Heyer & Dame, 2015) gas beyond about half the galactocentric radius of the Sun.
The trend of disk half-thickness with radius can be a check on galaxy inclination. A galaxy that is not exactly edge-on will have a larger projected thickness near the center than near the edge because of the higher extension of the near and far parts. In Figure 9, NGC 891 has a low projected thickness near the center and a high inclination, . However, IC 5052 has a high projected thickness near the center and also a high inclination, . Thus the decrease in thickness with radius for IC 5052 is not an inclination effect.
The half-thickness of the m core distribution is comparable to the thickness of the interstellar medium in typical disk galaxies. For NGC 891, Scoville et al. (1993) measured a half-thickness of CO emission that ranged from 77 pc in the center to 132 pc at 8.8 kpc (adjusted to our distance). This is 30%-50% larger than the half-thickness of the m core distribution given above, which ranges from 50 pc to 105 pc in the same radial range (from the linear fit). Alton et al. (2000) modelled m observations of this galaxy and found that the dust follows the molecular gas in the main part of the disk.
In addition to a thin interstellar disk where stars form, some galaxies have a thick interstellar disk that may be visible as dust filaments or H emission (Howk & Savage, 1999). Jo et al. (2018) observed extended H and FUV emission from 38 nearby edge-on galaxies and found a thick disk component in around half of them, including NGC 891 and NGC 3628, and only a thin component in IC 5052. In NGC 891 and NGC 3628, the H scale height is pc and the FUV and NUV scale heights are about twice that. In IC 5052, the H scale height is pc and the FUV and NUV heights are about the same. They suggested that the great heights for H indicate an extended component of gas and dust that is ionized and also scatters midplane radiation. They found that the relative thickness of the extraplanar gas, normalized to the size of the disk, scales with the star formation rate per unit area to a power between 0.3 and 0.5, depending on whether extended PAH emission is included. NGC 891 also has a thick component of HI with a scale height of 2.2 kpc (), and radio continuum emission with a height of 1.1 kpc; these are in addition to a thin HI disk with a height less than 300 pc (Oosteroo et al., 2007) that is presumably connected with our m core disk. At 100, 160 and 250 m in NGC 891, the scale heights are , and kpc (Hughes et al., 2014). The extended dust layer could be formed by accretion (Hodges-Kluck & Bregman, 2018) or galactic fountains powered by star formation (Bregman et al., 2013).
Shinn & Seon (2015) modelled radiative transfer of FUV emission in NGC 891 and NGC 3628 with a two-component disk for dust scattering, and Baes & Viaene (2016) modeled NGC 3628 with the same two components. For NGC 891, the thin dust disk was modeled to have a scale height of 325 pc and the thick dust scale height was 2100 pc. For NGC 3628, the thin and thick scale heights were modeled to be 225 pc and 2100 pc. Bianchi et al. (2008) modeled radiative transfer in NGC 891 using an extended dust disk and a clumpy dust disk with a scale height of 200 pc. Popescu et al. (2011) fit radiative transfer models to the SED in NGC 891 with three dust components, one that follows the old stars, another that has the same half-thickness as young stars, assumed to be 90 pc, and a third that is clumpy with the same distribution as the second. This clumpy dust model is consistent with the distribution of m cores.
4.2 Shingles and Spiral Arms
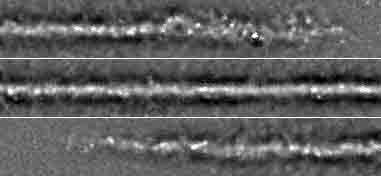
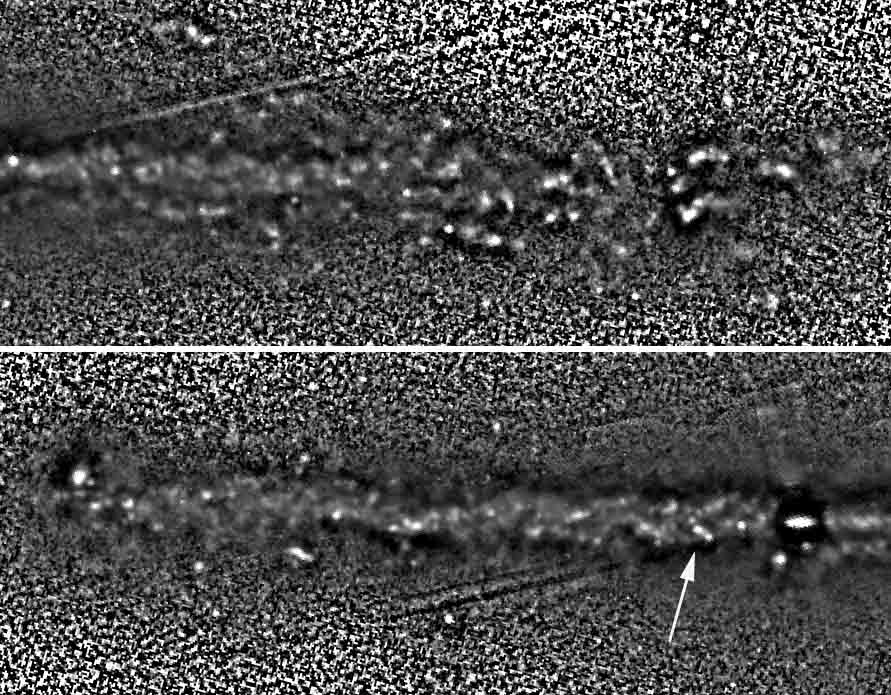
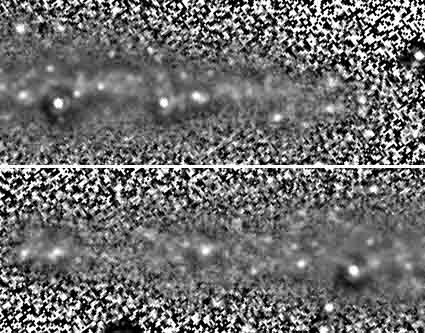
A close examination of the distribution of m cores shows corrugations and shingle-like structures, as observed in the Milky Way (see review in Alfaro & Efremov, 1996) and other galaxies (Florido et al., 1991). Figures 10 to 12 show enlargements of the unsharp mask images so that individual cores can be seen. Aside from seemingly random positions above and below the midplane for most of the cores, especially near the ends of the disks where the scale height is large, there are also streaks of clumpy emission, such as one in the center of the lower panel in Figure 10 for NGC 891. NGC 3628 in Figure 11 has a chevron-type structure on the right-hand side of the lower panel (just to the left of the nuclear disk as indicated by the arrow) with three symmetric streaks of multiple cores above and below the plane. In the streaks closest to the center, which are the best defined, the lower one has three cores with a bright one in the middle, and the upper one has three cores with equal brightness. From the coordinates of the cores, we determine the projected lengths of these two streaks to be pixels ( pc) and pixels ( pc); the projected angles relative to the midplane are and , respectively. Similarly inclined streaks of multiple m clumps are in IC 5052 (Fig. 12); the top panel shows at least two of them, sloping upward and to the right.
Some of these clump alignments could be spiral arms that lie in the plane of the galaxy. Papers 1 and 2 showed that most spiral arms have m cores lined up on narrow dust filaments that can extend for several kpc. For M100, the average core separation along the filaments is 410 pc. NGC 3628 is the least inclined galaxy ( in Table 1) and thus the one most likely to show spiral arms. The chevron-like structures could then be spirals viewed tangentially. For a single triplet of projected length pc, which is the second one mentioned above, at an angle to the midplane of , the filament length in the plane is pc. The separation between the cores in the triplet is half of this, pc, like the separations in M100. Note that the chevrons or spirals can also be seen in Figure 1b to the left of the bright central region. The distance between the apex of the inner chevron and the galaxy center is 1.9 kpc, which would be the galactocentric distance of the spiral arm.
Generally the galaxy disks in Figures 10 to 12 show small irregularities around the midplane. Corrugations like this in the Milky Way have a variety of scales, including vertical oscillations of atomic and molecular gas that span several kpc in the radial direction and pc in height (Malhotra, 1995). Smaller scale vertical motions connected with spiral arms are observed with H velocities in other galaxies on a scale of several hundred pc; they suggest density wave forcing with possible magnetic field effects (Martos & Cox, 1998; Sánchez-Gil et al., 2015). Usually the corrugations are only in the gas or young stellar populations (Matthews & Uson, 2008), as we see here for the m cores. Milky Way “shingles” are linearly rising corrugations with an abrupt jump down to the next one in a sequence (Schmidt-Kaler & Schlosser, 1973). Shingles have lengths of kpc, thicknesses less than 70 pc and inclinations to the plane of (Quiroga & Schlosser, 1977; Kolesnik & Vedenicheva, 1979). The chevrons in NGC 3826, with symmetric pairs positioned on each side of the midplane, do not resemble the vertical structures in the Milky Way or other galaxies, which supports their identification with spiral arms. These spirals are not visible in the optical image (Sect. 5.2).
There are also loops with several m cores suggestive of pressurized bubbles with gravitational condensations and star formation. Figure 10 shows one in the middle of the top panel for NGC 891. Figure 11 shows several seemingly coherent structures above and below the disk of NGC 3628 in the top panel, which is the western part where the disk thickens most.
5 Comparison of optical and m images
5.1 NGC 891
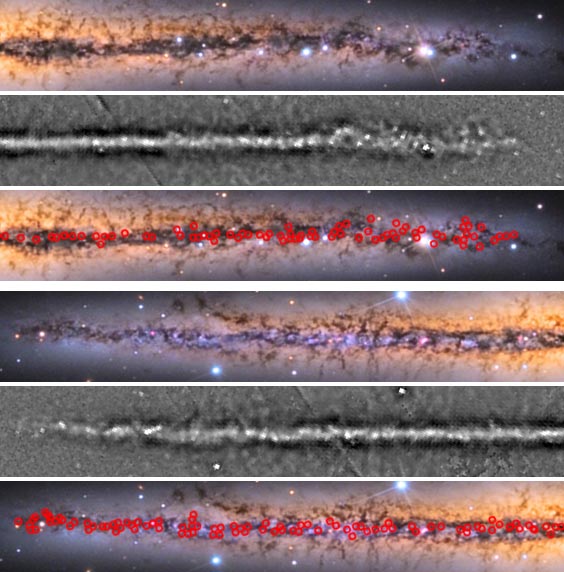
The optical structure of NGC 891, divided into two sections, is compared to the m unsharp mask image and to the positions of the catalogued m cores in Figure 13. The north-east end of the galaxy is to the left in the bottom panel. The alignment was made using stars visible outside the disk in both images, not shown in the figure. The m cores are indicated by circles through which the optical image can be seen. Most of the circles contain no optical emission, presumably because the dust extinction on the line of sight to the cores is too high. This is consistent with our findings for M100 (Paper 1), a more face-on galaxy, suggesting that even the local extinction at the source is enough to obscure young stars. Some point sources are evident in both images of NGC 891, however, such as the central one of the shingle-like structure in the northeast, which is on the left in the lower panel of Figure 13; this object looks very red in the optical image. Also, a few faint spots in a high latitude loop above the southwestern end can be seen in the optical image, inside the circles in the top right panel.
5.2 The remarkably flat disk of NGC 3628
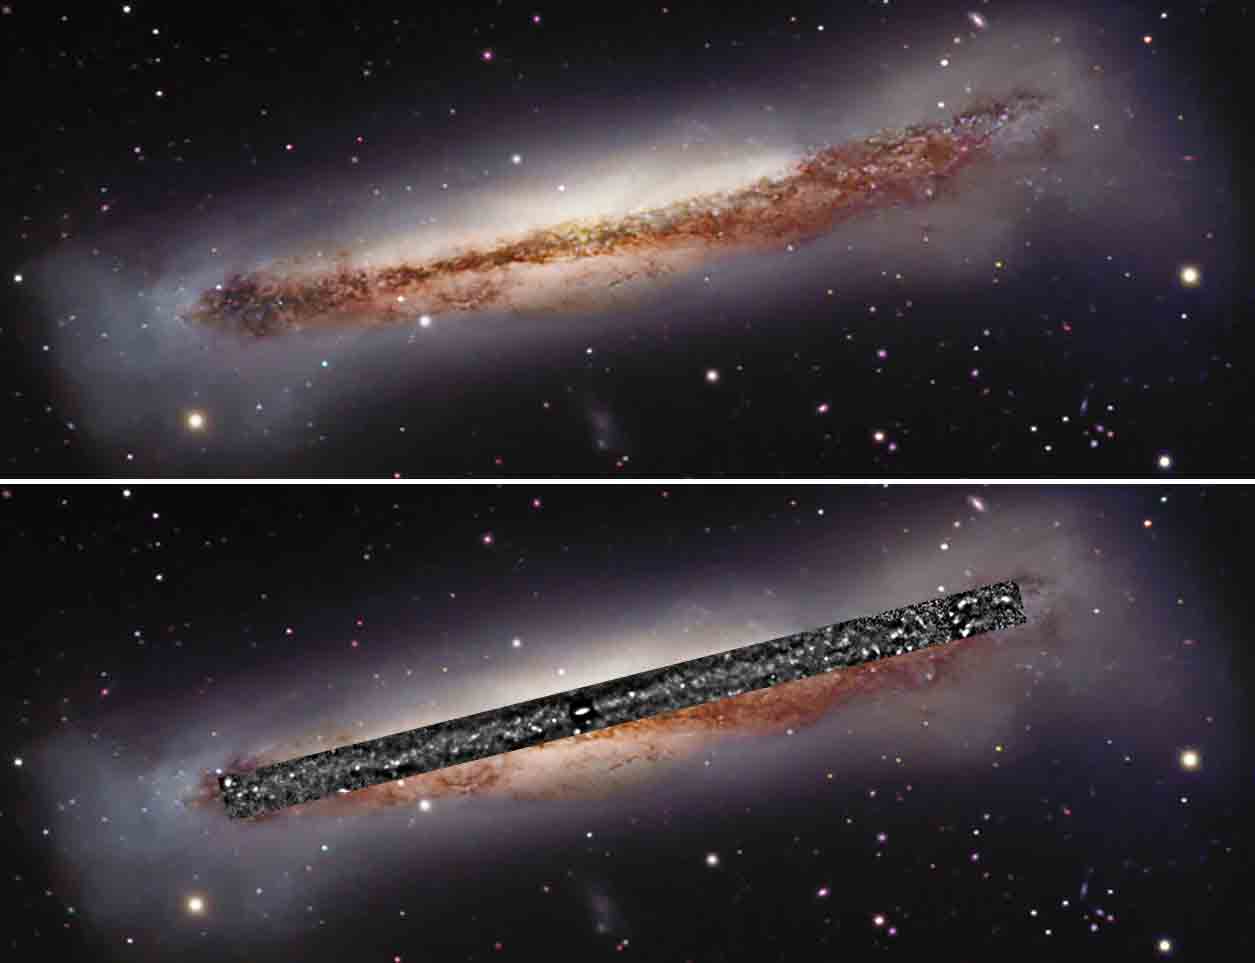
As noted above, NGC 3628 has an asymmetic distribution of m cores around the midplane with a thicker disk in the west because of its interaction with other galaxies in the Leo triplet. The disk of cores is still very thin and straight, however, compared to the extended dust. Figure 14 shows a deep color image of NGC 3628 with the unsharp mask image from Figure 2 superposed to scale. The extreme flatness of the m disk, even in an interacting galaxy, presumably results from a high degree of stability in the perpendicular direction, as suggested for spiral galaxies in general by Saha & Jog (2006). Very few of the m cores are at the positions of optical features, although some at high latitude in Figure 3 may be seen in the dust loop that goes above the disk between the center and the western part.
The optical image thickens or flares at each end of the disk but the core distribution flares primarily in the west (Fig. 8), although it is thicker everywhere than the core distributions in the other galaxies. The thick optical distribution in IC 5052 could be dominated by stars at large radii, which would be perturbed more than the denser inner disk.
5.3 IC 5052
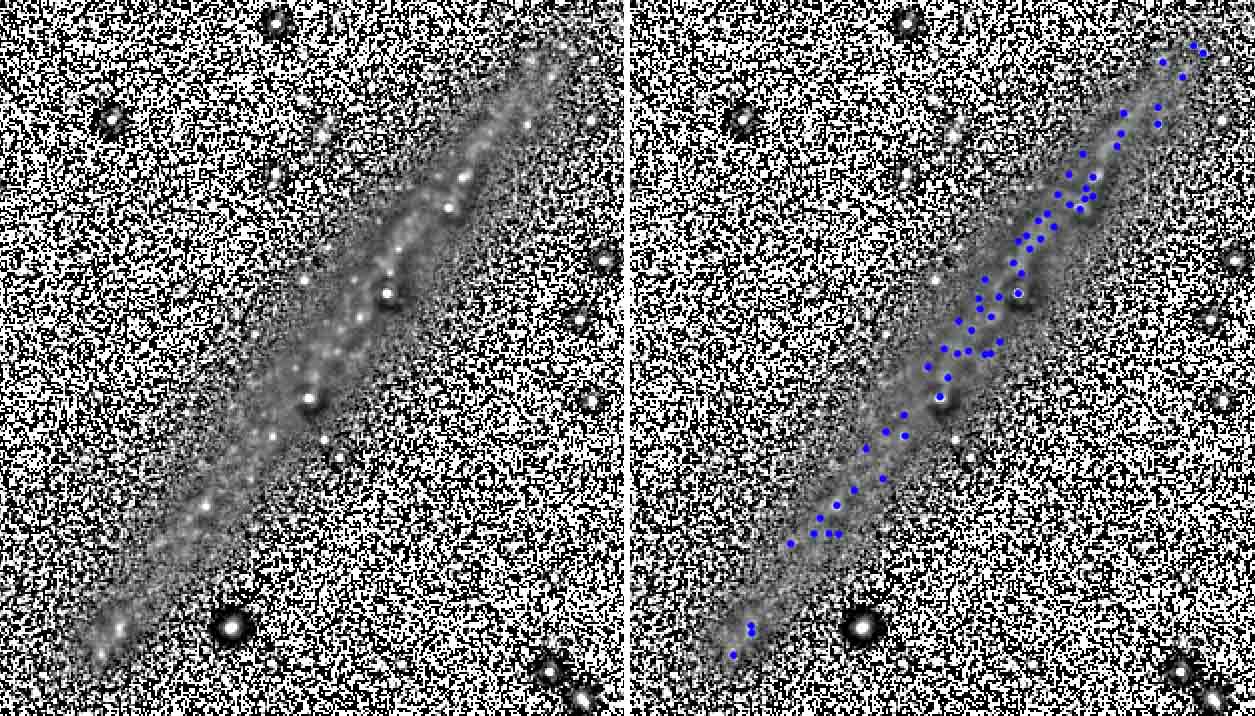
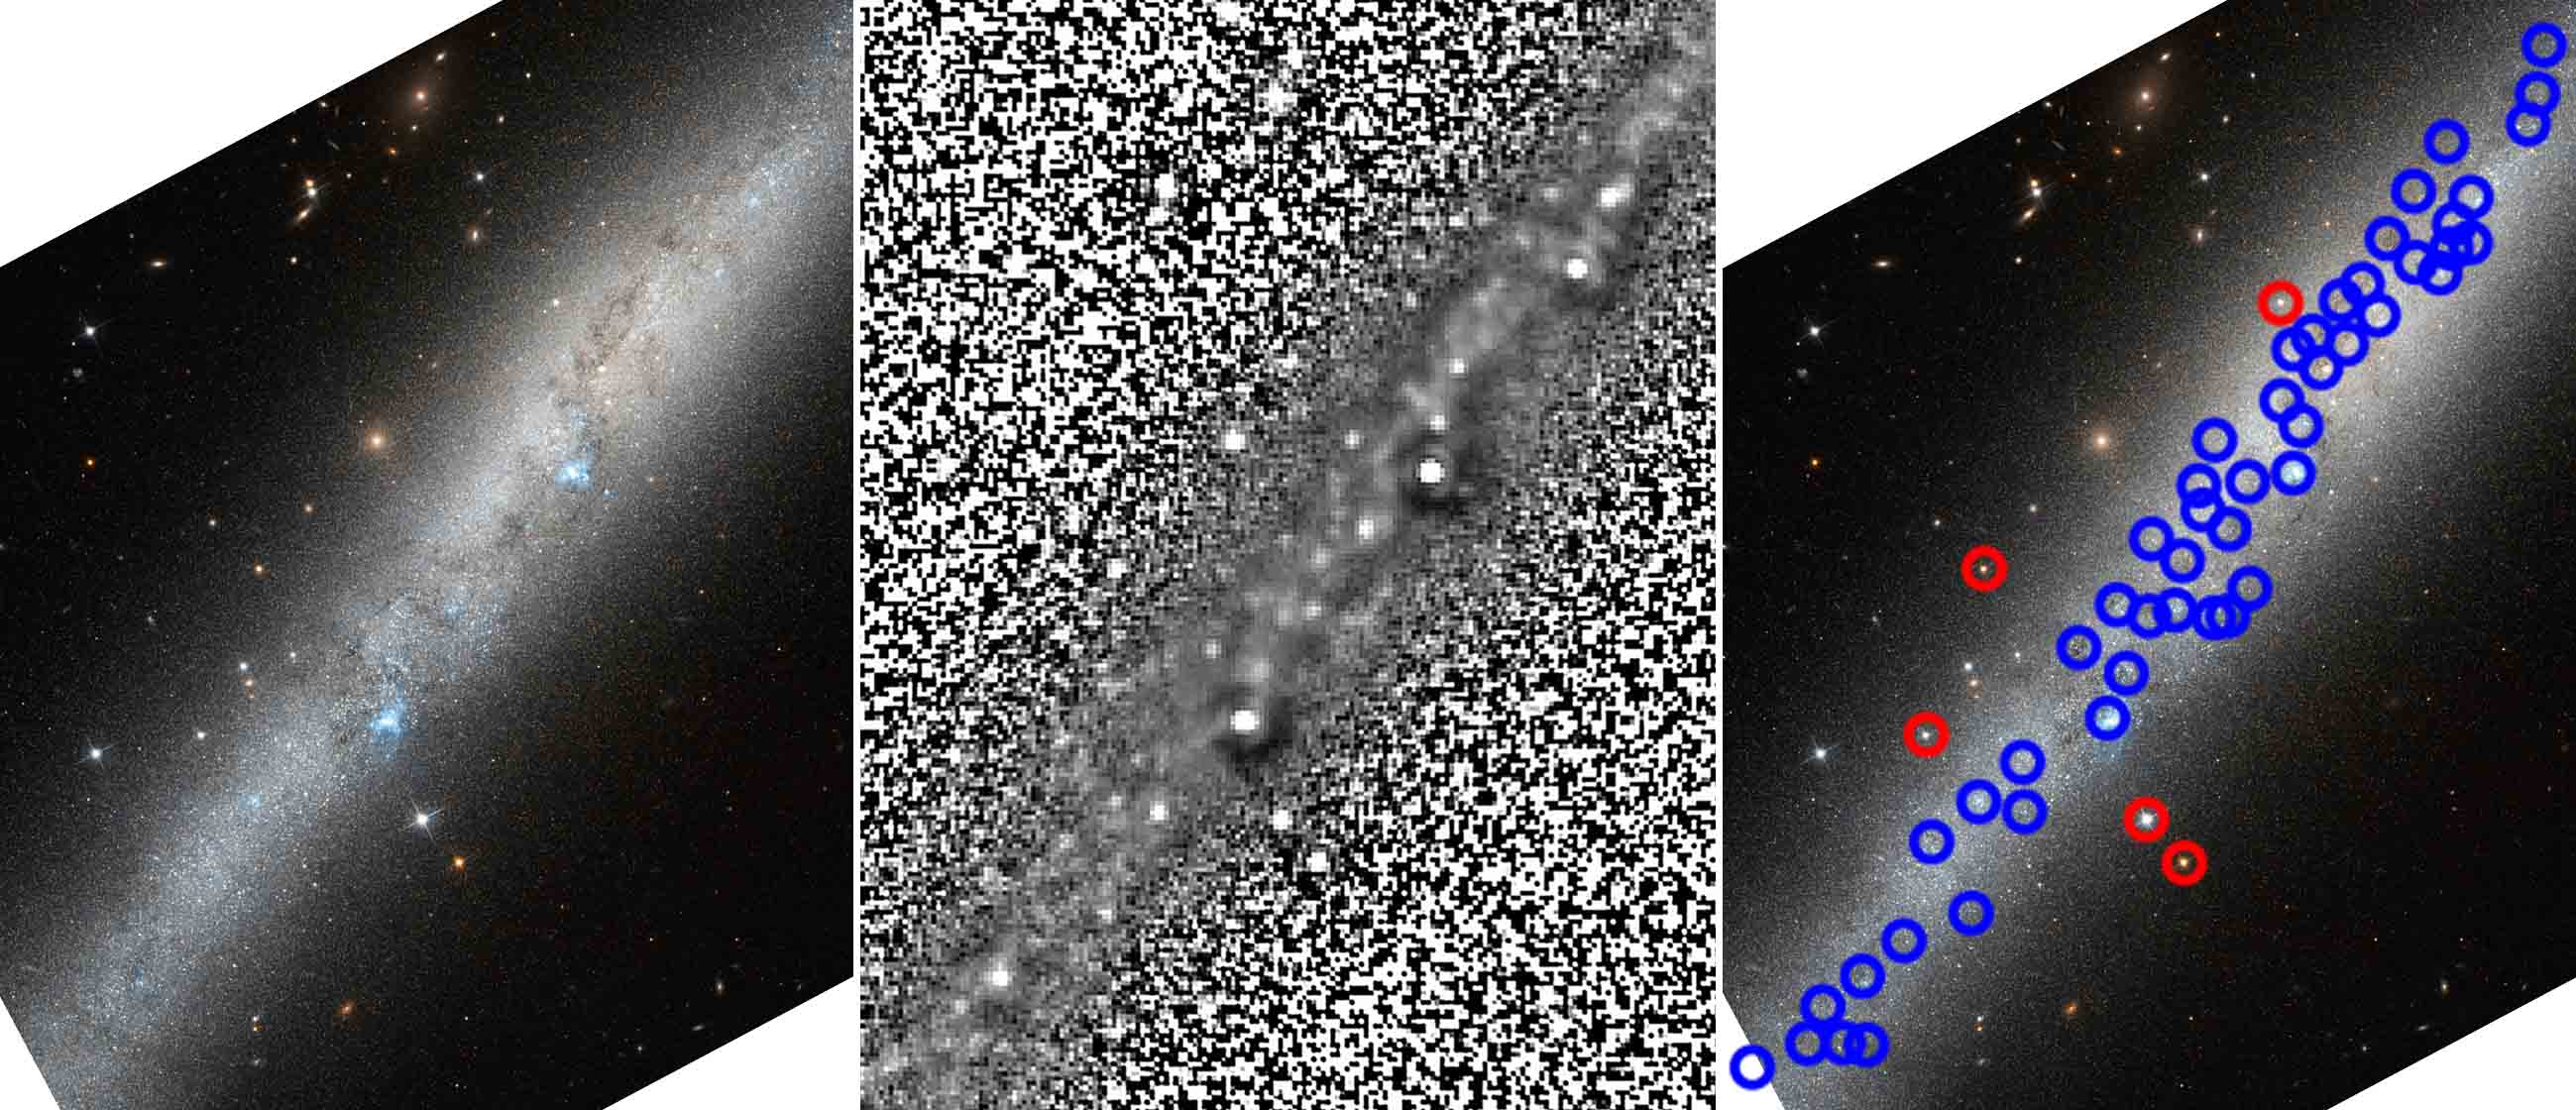
Figure 15 compares an optical image of IC 5052 from the Hubble Space Telescope333https://www.nasa.gov/mission_pages/hubble/science/ic5052.html with the m image studied here. This is the closest of the three galaxies and shows the most detailed features from star formation. The left-hand panel is the HST image, the middle panel is the unsharp mask image from Figure 3, and the right hand image has the positions of the catalogued m cores outlined as blue circles, with stars for alignment outlined are red circles. The two bright blue regions symmetric around the center and slightly below the midline of the galaxy are also m cores, as indicated by the presence of blue optical emission inside the blue circles in the right-hand panel. A few other m core regions contain optical emission also, but most do not. Some cores correspond to dark clouds in the optical image, such as the two symmetrically placed between the bright blue regions and several at high latitude to the northwest. Most of the cores show no clear indication of any optical feature.
IRAC colors of the two bright blue regions in the Hubble image are indicated by red circles in Figure 6. They have redder than average colors suggesting high extinction and/or hotter dust in a deeply embedded, optically-invisible core. They are also the brightest m cores in the unsharp mask image (Fig. 15). Their apparent magnitudes are and . They are the two cores that stand out at the bright magnitude side of the distribution in Figure 5. The cores themselves are not evident as dark clouds in the optical images.
6 Star formation in m cores
The IRAC luminosities of the cores were converted to stellar masses using the procedure in Papers 1 and 2. We first multiply the sum of the luminosities of the four IRAC bands, , by 10 to get an estimate of the total infrared luminosity, based on starburst SEDs in Xu et al. (2001). Then the IR luminosity is converted to young stellar mass using the bolometric magnitude of a young stellar population in Bruzual & Charlot (2003), which is for one solar mass at solar metallicity, an age less than or equal to 1 Myr, and a Salpeter initial mass function (as used to determine the star formation rates in Table 1). Combined with the bolometric magnitude of the Sun, 4.74 mag, this gives the total luminosity per unit solar mass of young stars in erg s-1. After solving for mass, we have the stellar masses associated with each core,
| (4) |
The IRAC luminosities were increased over the observed values to account for extinction in the infrared, assuming an average of mag for each source, foreground and local combined (see above). To do this we use the conversions in Chapman et al. (2009) and Bessell & Brett (1988), which give: , , , and . The extinctions in the IRAC bands are then around 1 magnitude. They have the effect of increasing the stellar masses and effective ages of the regions by about a factor of 2.5 compared to the case with no infrared extinction. Analogous extinctions were not considered for stellar masses in Papers 1 and 2 because the total extinctions were less by about half. Including them would have increased the masses and ages by %.
For the extinction-corrected IRAC luminosities in equation 4, the total stellar masses associated with the catalogued m cores in each galaxy range from to , as listed in Table 4. Dividing these by the total galactic star formation rates (Table 4) under the assumption that they represent all the star-forming regions gives average lifetimes from 0.8 Myr to 2 Myr.
The star formation rates for NGC 891 and NC 3628 are from Shinn & Seon (2015) using IRAS far-infrared observations with the calibration in Kennicutt (1998) and corrected for the distances given here. For NGC 891, Popescu et al. (2011) get a similar SFR using a radiative transfer fit to the SED; their rate converts to yr-1 for our distance. Another radiative transfer model for NGC 891 in Seon et al. (2014) gets a rate of 3-4 yr-1 using Starburst 99 and a distance of 9.5 Mpc. The rate for IC 5052 uses the extinction-corrected H flux in Kaisin et al. (2007) with the calibration in Kennicutt (1998) and the distance given here. All star formation rates assume a Salpeter IMF.
The average stellar masses of individual cores range from to for the three galaxies. These masses do not account for completeness limits, so a better measure is the mass at the peak of the luminosity function shown in Figure 5. Again considering ages of 1 Myr, a Salpeter IMF, and the summed extinction-corrected IRAC luminosities as a proxy for the total luminosities, the average masses within one magnitude range around the peaks in the luminosity functions range between and (Table 4). Lower mass regions are missing because of faintness. Correcting for these missing cores would approximately double the total stellar mass and lifetime (Paper 2).
7 Conclusions
Unsharp masks of m IRAC images show several hundred emission sites in three highly inclined galaxies. The cores have IRAC colors and magnitudes typical of star-forming regions with an average intrinsic extinction of mag, based on the results for face-on galaxies in Paper 2, and a corresponding gas mass surface density of pc-2. Foreground extinction averages mag through the edge-on disks. The average young stellar mass in each region is , depending on galaxy distance. If the local star formation efficiency is 5%, then this mass and extinction imply an average cloud core diameter of pc. The ratio of the total core mass to the star formation rate in each galaxy gives a lifetime for the highly extincted region of 1 to 2 Myr.
The identification of young star-forming regions allows an assessment of where stars form relative to galactic-scale processes. In Papers 1 and 2, we found that most young regions lie along filaments that span several kpc in length and run parallel to spiral arms and spurs. These filaments are presumably shock fronts connected with gas flows in spiral density waves, and the cores are gravitational condensations in the shock fronts. Other cores are in kpc-scale rings that could be made by young stellar feedback. The present paper reveals the vertical distribution of the young regions. The disks studied here have half-thicknesses of 105 pc for NGC 891 and 74 pc for IC 5052, which are typical of molecular layers in normal galaxies. The half-thickness is 438 pc for NGC 3628, but that includes a broad region affected by a galaxy interaction. There is also a loop of several cores above the disk in NGC 891 and possibly coherent loops of cores in the thick part of NGC 3628.
Some of the m cores show coherent structures suggestive of kpc-scale corrugations, shingles, or spiral arms. For example, NGC 3628, which is slightly less inclined than the other galaxies, has arcs composed of several cores each that could be spiral arms viewed tangentially. The spacing between the cores in these arcs is about the same as the spacing between m cores in the spiral arms of M100, studied in Paper 1. Optical images of NGC 3628 show no evidence for these spirals because of extinction. Most of the cores have no trace in the optical images anyway, even in face-on galaxies (Paper 1). This invisibility highlights the importance of the m cores as tracers of an early stage in star formation.
Disk thicknesses for the m cores are either somewhat constant or increase slightly with radius. Because this thickness is directly related to the youngest stages of star formation, its observation may be useful to help us understand the sources of interstellar turbulence before molecular clouds form. The near-constant thickness implies that the effective vertical velocity dispersion, , decreases with galactocentric distance slightly slower than the square root of the total surface density, , considering that the equation for height of an isothermal layer is . That translates to a factor of 1.6 in for each scale length in the disk. Radial decreases in have been observed in face-on galaxies (e.g., Dickey et al., 1990). A square root correlation like this was seen directly in face-on Ultra Luminous Infrared Galaxies (Wilson et al., 2019).
The observation of a slowly varying thickness is also useful to convert the disk surface densities that are usually measured in galaxies into volume densities, which are important to get timescales for gravitationally-driven processes. As is well known, the slope of the Kennicutt-Schmidt relation for total gas is trivially explained if the thickness of the star-forming part of the disk varies more slowly than the surface density, as is the case here. Then the midplane density that determines the timescale for large-scale gravitation collapse is nearly proportional to the surface density, and the square root of this midplane density, which gives the collapse rate and presumably also the star formation rate per unit gas mass, is proportional to the square root of the surface density (Madore, 1977; Elmegreen, 2018). The total star formation rate per unit area is proportional to the gas mass per unit area times the collapse rate.
This work is based in part on observations made with the Spitzer Space Telescope, which is operated by the Jet Propulsion Laboratory, California Institute of Technology under a contract with NASA. We are grateful to Dr. Tom Megeath for help with the conversion from IRAC color to extinction, and to the referee for useful comments.
References
- Alfaro & Efremov (1996) Alfaro, E.J., & Efremov, Y.N. 1996, RMxA&A, 4, 1
- Allen (2004) Allen, L., Calvet, N., D’Alessio, P., Merin, B., Hartmann, L., et al. 2004, ApJS, 154, 363
- Alton et al. (2000) Alton, P.B., Xilouris, E.M., Bianchi, S., Davies, J., & Kylafis, N. 2000, A&A, 356, 795
- Arp (1966) Arp, H. 1966, ApJS, 14, 1
- Baes & Viaene (2016) Baes, M. & Viaene, S. 2016, A&A, 587, A86
- Bessell & Brett (1988) Bessell, M. S. & Brett, J. M. 1988, PASP, 100, 1134
- Bianchi et al. (2008) Bianchi, S. 2008, A&A, 490, 461
- Bohlin et al. (1978) Bohlin, R. C., Savage, B. D., & Drake, J. F. 1978, ApJ, 224, 132
- Bregman et al. (2013) Bregman, J.N., Miller, E.D., Seitzer, P., Cowley, C.R., Miller, M.J. 2013, pJ, 766, 57
- Bruzual & Charlot (2003) Bruzual, G., & Charlot, S. 2003, MNRAS, 344, 1000
- Chambers et al. (2009) Chambers, E. T., Jackson, J. M., Rathborne, J. M., & Simon, R. 2009, ApJS, 181, 360
- Chapman et al. (2009) Chapman, N.L., Mundy, L.G., Lai, S.-P., & Evans, N.J. II 2009, ApJ, 690, 496
- Comerón et al. (2011) Comerón, S., Elmegreen, B. G., Knapen, J.H., et al. 2011, ApJ, 741, 28
- Comerón et al. (2012) Comerón, S., Elmegreen, B. G., Salo, H., et al. 2012, ApJ, 759, 98
- Cowie (1981) Cowie, L. L. 1981, ApJ, 245, 66
- Dickey et al. (1990) Dickey, J. M., Murray-Hanson, M., & Helou, G. 1990, ApJ, 352, 522
- Dobbs (2008) Dobbs, C.L. 2008, MNRAS, 391, 844
- Dumke et al. (2001) Dumke, M., Nieten, Ch., Thuma, G., Wielebinski, R., & Walsh, W. 2001, A&A, 373, 853
- Elmegreen (1979) Elmegreen, B.G. 1979, ApJ, 231, 372
- Elmegreen (2018) Elmegreen, B.G. 2018, ApJ, 854, 16
- Elmegreen et al. (2018) Elmegreen, B.G., Elmegreen, D.M., & Efremov, Y.N 2018, ApJ, 863, 59
- Elmegreen & Elmegreen (2019) Elmegreen, B.G., & Elmegreen, D.M. 2019, ApJS, 245, 14
- Elmegreen et al. (2006) Elmegreen, D.M., Elmegreen, B.G., Kaufman, M., et al. 2006, ApJ, 642, 158
- Elmegreen et al. (2014) Elmegreen, D. M., Elmegreen, B. G., Erroz-Ferrer, S., et al. 2014, ApJ 780, 32
- Fazio et al. (2004) Fazio, G.G., Hora, J.L., Allen, L.E. et al. 2004, ApJS, 154, 10
- Flaherty et al. (2007) Flaherty, K. M., Pipher, J. L., Megeath, S.T., Winston, E.M., Gutermuth, R. A., Muzerolle, J., Allen, L. E., & Fazio, G. G. 2007, ApJ, 663, 1069
- Florido et al. (1991) Florido, E., Battaner, E., Sanchez-Saavedra, M.L., Prieto, M., Madiavilla, E. 1991, MNRAS, 251, 193
- Gutermuth et al. (2009) Gutermuth, R. A., Megeath, S. T., Myers, P. C., et al. 2009, ApJS, 184, 18
- Hannon et al. (2019) Hannon, S., Lee, J.C. Whitmore, B.C. et al. 2019, MNRAS, 490, 4648
- Heyer & Dame (2015) Heyer, M., & Dame, T.M. 2015, ARA&A, 53, 583
- Hodges-Kluck & Bregman (2018) Hodges-Kluck, E.J., & Bregman, J.N. 2018, ApJ, 866, 126
- Howk & Savage (1999) Howk, J. C., & Savage, B.D. 1999, AJ, 117, 2077
- Hughes et al. (2014) Hughes, T.M., Baes, M., Fritz, J. et al. 2014, A&A, 565, A4
- Jo et al. (2018) Jo, Y.S., Seon, K-i, Shinn, J-H., Yang, Y., Lee, D. & Min, K.W. 2018, ApJ, 862, 25
- Kaisin et al. (2007) Kaisin, S.S., Kasparova, A.V., Knyazev, A. Yu., & Karachentsev, I.D. 2007,AstL, 33, 283
- Kennicutt (1998) Kennicutt, R.C., Jr. 1998, ApJ, 498, 541
- Kennicutt & Evans (2012) Kennicutt, R.C., Jr, & Evans, N.J. 2012, ARA&A, 50, 531
- Kim & Ostriker (2001) Kim, W.-T., & Ostriker, E.C. 2001, ApJ, 559, 70
- Kim et al. (2002a) Kim, W.-T., Ostriker, E.C., & Stone, J.M. 2002, ApJ, 581, 1080
- Kim & Ostriker (2002b) Kim, W.-T., & Ostriker, E.C. 2002b, ApJ, 570, 132
- Kim & Ostriker (2006) Kim, T.-T., & Ostriker, E.C. 2006, ApJ, 646, 213
- Kim & Ostriker (2007) Kim, W.-T., & Ostriker, E.C. 2007, ApJ, 660, 1232
- Kolesnik & Vedenicheva (1979) Kolesnik, L.N., & Vedenicheva, I.P. 1979, A&A, 76, 124
- Li & Draine (2001) Li, A., & Draine, B.T. 2001, ApJ, 554, 778
- Lou & Hu (2017) Lou, Y.-Q. & Hu, X.Y. 2017, MNRAS, 468, 2771
- Madore (1977) Madore, B. F. 1977, MNRAS, 178, 1
- Malhotra (1995) Malhotra, S. 1995, ApJ, 448, 138
- Martos & Cox (1998) Martos M. A., & Cox D. P., 1998, ApJ, 509, 703
- Matthews & Uson (2008) Matthews L. D. & Uson J. M., 2008, ApJ, 688, 237
- McKee et al. (2015) McKee, C. F., Parravano, A., & Hollenbach, D. J. 2015, ApJ, 814, 13
- Megeath et al. (2004) Megeath, S.T., Allen, L.E., Gutermuth, R.A., Pipher, J. L., Myers, P.C., Calvet, N., Hartmann, L., Muzerolle, J., & Fazio, G. G. 2004, ApJS, 154, 367
- Mentuch et al. (2010) Mentuch, E., Abraham, R.G., & Zibetti, S. 2010, ApJ, 725, 1971
- Narayan & Jog (2002) Narayan, C.A. & Jog, C.J 2002, A&A, 390, L35
- Oosteroo et al. (2007) Oosterloo, T., Fraternali, F., & Sancisi, R. 2007, AJ, 134, 1019
- Quiroga & Schlosser (1977) Quiroga, R.J., & Schlosser, W. 1977, A&A, 57, 455
- Popescu et al. (2011) Popescu, C.C., Tuffs, R.J., Dopita, M.A., Fischera, J., Kylafis, N.D., & Madore, B.F. 2011, A&A, 527, A109
- Renaud et al. (2013) Renaud, F., Bournaud, F., Emsellem, E., et al. 2013, MNRAS, 436, 1836
- Renaud et al. (2014) Renaud, F., Bournaud, F., Emsellem, E., Elmegreen, B., & Teyssier, R. 2014, ASPC, 480, 247
- Ryon et al. (2017) Ryon, J.E., Gallagher, J.S., Smith, L.J. et al. 2017, ApJ, 841, 92
- Saha & Jog (2006) Saha, K. & Jog, C.J. 2006, MNRAS, 367, 1297
- Sánchez-Gil et al. (2015) Sánchez-Gil, M.C., Alfaro, E.J., & Pérez, E. 2015, MNRAS, 454, 3376
- Sanders et al. (1985) Sanders, D. B., Scoville, N. Z., & Solomon, P.M. 1985, ApJ, 289, 373
- Schmidt-Kaler & Schlosser (1973) Schmidt-Kaler, Th., & Schlosser, W. 1973, A&A, 25, 191
- Scoville et al. (1993) Scoville, N. Z., Thakkar, D., Carlstrom, J. E., & Sargent, A. I. 1993, ApJ, 404, L59
- Seon et al. (2014) Seon, K-i., Witt, A.N., Shinn, J.-h., Kim, I.-j. 2014, ApJL, 785, L18
- Shinn & Seon (2015) Shinn, J.-H., & Seon, K.-I., 2015, AJ, 815, 133
- Simon et al. (2006) Simon, R., Rathborne, J. M., Shah, R. Y., Jackson, J. M., & Chambers, E.T. 2006, ApJ, 653, 1325
- Stern et al. (2005) Stern, D., Eisenhardt, P., Gorjian, V. et al. 2005, ApJ, 631, 163
- Stutz et al. (2013) Stutz, A., Tobin, J., Stanke, T., Megeath, T., Fischer, W. et al. 2013, ApJ, 767, 36
- Tomisaka (1987) Tomisaka, K. 1987, PASJ, 39, 109
- Tully et al. (2013) Tully, R.B., Courtois, H.M. Dolphin, A.E., et al. 2013, AJ, 146, 86
- Vacca et al. (1996) Vacca, W.D., Garmany, C.D., & Shull, J.M. 1996, ApJ, 460, 914
- de Vaucouleurs et al. (1991) de Vaucouleurs, G., de Vaucouleurs, A., Corwin, H., Buta, R., Paturel, G., Fouque, P. 1991, Third Reference Catalogue of Bright Galaxies, (New York: Springer-Verlag)
- Wilding et al. (1993) Wilding, T. Alexander, P., & Green, D.A. 1993, MNRAS, 263, 1075
- Wilson et al. (2019) Wilson, C.D., Elmegreen, B.G., Bemis, A., & Brunetti, N. 2019, ApJ, 882, 5
- Winston et al. (2007) Winston, E., Megeath, S. T., Wolk, S. J., et al. 2007, ApJ, 669, 493
- Winston et al. (2010) Winston, E., Megeath, S.T., Wolk, S.J. et al. 2010, AJ, 140, 266
- Wolk et al. (2008) Wolk, S.J., Spitzbart, B.D., Bourke, T.L., Gutermuth, R.A., Vigil, M. & Comerón, F. 2008, AJ, 135, 693
- Xilouris et al. (1998) Xilouris, E.M., Alton, P.B., Davies, J.I., Kylafis, N.D., Papamastorakis, J., & Trewhella, M. 1998, A&A, 331, 894
- Xu et al. (2001) Xu, C., Lonsdale, C.J., Shupe, D.L., O’Linger, J., & Masci, F. 2001, ApJ, 562, 179
| Name | Dist.aaDistances from Tully et al. (2013), which are consistent with a Hubble constant of | Dist. | Incl.bbInclination for NGC 891 is from Xilouris et al. (1998), and for NGC 3628 and IC 5052 they are from HyperLeda, http://leda.univ-lyon1.fr/ | Hubble typeccHubble types from de Vaucouleurs et al. (1991) | dd from de Vaucouleurs et al. (1991) | pc per | |
|---|---|---|---|---|---|---|---|
| Mpc | Modulus | deg | arcmin | kpc | arcsec | ||
| NGC 891 | 9.12 | 29.8 | 89.7 | SA(s)b III | 6.74 | 17.9 | 44.2 |
| NGC 3630 | 10.3 | 30.7 | 79.3 | Sb pec III | 7.40 | 22.2 | 50.5 |
| IC 5052 | 5.5 | 28.7 | 90 | SBd VII | 2.94 | 4.70 | 26.7 |
| Band | Ang. Resol.aaAngular resolution from Chambers et al. (2009); see also Fazio et al. (2004) | Zero Pt.bbZero magnitude fluxes are from the Fits file headers and also Table 4.1 in the IRAC Instrument Handbook, https://irsa.ipac.caltech.edu/data/SPITZER/docs/irac/iracinstrumenthandbook/17/ | Aper. Corr.ccAperture corrections are for the smallest point sources in Table 4.7 of the IRAC Instrument Handbook, https://irsa.ipac.caltech.edu/data/SPITZER/docs/irac/iracinstrumenthandbook/27/ |
|---|---|---|---|
| m | Arcsec FWHM | Counts | |
| 3.6 | 1.1 | 277.5 | 1.215 |
| 4.5 | 1.3 | 179.5 | 1.233 |
| 5.8 | 1.7 | 116.6 | 1.366 |
| 8.0 | 2.4 | 63.1 | 1.568 |
| Galaxy | NaaThe number of cores includes only those with all three measured colors. Cores with one or more undetected passbands are not here, although they are in the core tabulations that follow. These numbers are 173, 267 and 60 in the order above. | Mask | bbThe color is the dispersion in the measured color distribution. | ) | ) | |||
|---|---|---|---|---|---|---|---|---|
| pc | mag | mag | mag | mag | mag | mag | ||
| NGC 891 | 133 | 199 | 0.52 | 0.64 | 0.33 | |||
| NGC 3628 | 211 | 225 | 0.39 | 0.68 | 0.30 | |||
| IC 5052 | 45 | 120 | 0.42 | 0.80 | 0.40 | |||
| All | 389 | 0.45 | 0.70 | 0.33 |
| Galaxy | SFRaaStar formation rates for NGC 891 and NC 3628 are from Shinn & Seon (2015) using IRAS far infrared observations. IC 5052 uses the extinction-corrected H flux in Kaisin et al. (2007). All star formation rates assume a Salpeter IMF and were converted to the distances assumed here. | Total Measured | Eff. AgebbThe effective age is the ratio of the total stellar mass associated with the m cores to the star formation rate in the galaxy. | Average Clump | Peak Absolute | Ave. Mass |
|---|---|---|---|---|---|---|
| yr-1 | Clump Mass, | Myr | Mass, | Mag Range | Around PeakccThe average mass around the peak is the average within the absolute magnitude interval at m given in the previous column. () | |
| NGC 891 | 2 | 2.3 | to | |||
| NGC 3628 | 4.2 | 0.79 | to | |||
| IC 5052 | 0.056 | 1.7 | to |
| RAbbIn order of RA | DEC | [3.6]ccMagnitudes in the Vega scale | [4.5] | [5.8] | [8.0] | |||
|---|---|---|---|---|---|---|---|---|
| 2:22:43.90 | 42:25:42.9 | |||||||
| 2:22:43.85 | 42:25:36.3 | 0.54 | ||||||
| 2:22:44.06 | 42:25:34.5 | -0.16 | 0.70 | 1.75 | ||||
| 2:22:43.94 | 42:25:31.9 | 0.01 | 1.05 | 2.36 | ||||
| 2:22:43.52 | 42:25:35.5 | 1.54 | ||||||
| … |
| RA | DEC | [3.6] | [4.5] | [5.8] | [8.0] | |||
|---|---|---|---|---|---|---|---|---|
| 11:20:36.09 | 13:34:13.5 | 1.04 | 1.26 | 1.18 | ||||
| 11:20:35.15 | 13:34:26.4 | 0.43 | 1.90 | 1.61 | ||||
| 11:20:34.85 | 13:34:25.7 | 0.26 | 1.97 | 1.79 | ||||
| 11:20:35.64 | 13:34:17.6 | 0.04 | 2.47 | 1.97 | ||||
| 11:20:35.41 | 13:34:18.4 | 0.15 | 2.47 | 2.00 | ||||
| … |
| RA | DEC | [3.6] | [4.5] | [5.8] | [8.0] | |||
|---|---|---|---|---|---|---|---|---|
| 20:52:22.55 | -69:14: 6.8 | 1.06 | 1.67 | 1.79 | ||||
| 20:52:21.24 | -69:13:58.4 | 0.35 | 1.66 | 1.57 | ||||
| 20:52:21.28 | -69:13:55.7 | 0.35 | 1.99 | 1.75 | ||||
| 20:52:18.49 | -69:13:25.0 | 1.90 | ||||||
| 20:52:16.83 | -69:13:21.3 | 0.10 | 1.37 | 2.32 | ||||
| … |