Correlations and lags between X-ray and radio emission of Cyg X-1
Abstract:
Cygnus X-1 is a Galactic black-hole binary and a microquasar. Its X-ray emission originates most likely in the accretion flow, while the radio emission is from a magnetized jet. We study long-term cross-correlations between its X-ray and radio fluxes, searching for lags of the peak of the correlation. We use soft X-ray data from the All Sky Monitor on board of Rossi X-ray Timing Explorer, hard X-ray data from the Burst Alert Telescope on board of Neil Gehrels Swift, and 15 GHz radio monitoring data from the Ryle and AMI telescopes, which light curves cover all of the spectral states of Cyg X-1. Previous studies of radio/X-ray correlations in black-hole binaries concentrated on the soft X-ray/radio correlation in the hard spectral state. In contrast, our strongest correlation is between the hard X-rays and radio in the entire data at a -day lag. This indicates the jet formation from a hard X-ray emitting corona/hot accretion flow through all states of Cyg X-1. We also find evidence for a long lag of the radio with respect to the soft X-rays in the soft state. This indicates long-term advection of the magnetic field through the accretion disc from its high-mass donor, which is similar to the case of another microquasar with a high-mass donor, Cyg X-3.
1 Introduction
The X-ray source Cyg X-1, discovered in 1964 [1], is a high-mass binary consisting of an OB supergiant accreting via stellar wind onto a black hole [2, 3]. It is one of the brightest and best studied X-ray binaries, e.g. [4, 5, 6, 7]. The X-ray emission of Cyg X-1 originates most likely from its accretion flow, while the radio emission is from its jet, resolved by VLBA and VLA observations [8].
Cyg X-1 shows two main spectral states, hard [5] and soft [6], distinguished by the shape of the X-ray spectra. In the hard state, disc emission is weak and the spectrum is dominated by a hard power law with a high energy cut-off at 100 keV, well modelled by thermal Comptonization [5]. In the soft state, the blackbody disc emission [9] dominates the spectrum, and it is followed by a high energy tail with varying strength, well fitted by coronal Comptonization [6].
2 The Data and Analysis Methods
We study long term correlations between the 15 GHz radio emission and the soft and hard X-rays. We use the radio monitoring light curves for MJD 50226–53902 from the Ryle telescope, and for MJD 54573–57748 from the Arcminute Microkelvin Imager Large Array, as published in [10]. We correlate them with the light curve for MJD 50087–55870 from the All Sky Monitor (ASM) [11] on board of Rossi X-ray Timing Explorer, which covers three bands, 1.5–3, 3–5 and 5–12 keV. We also use the light curve for MJD 53416–57848 from the Burst Alert Telescope (BAT) [12] on board of Neil Gehrels Swift, which is for the 15–50 keV band. We correlate the radio and X-ray light curves either separately for the different states or for all of the data. To separate the states, we follow [10]. Since the radio/X-ray correlation has similar properties in both hard and intermediate states [13], we treat them jointly, and hereafter use the term ‘hard’ for the sum of the hard and intermediate states. Some of the results presented here are also given in [14].
The cross-correlation coefficients are calculated using the method of [15] with some modifications described in [16]. Specifically, we calculate the Pearson’s correlation coefficient for two discrete and unevenly spaced light curves, and , shifted in time by ,
| (1) |
where the summation is over all pairs, , corresponding to the time shift of ,
| (2) |
Here, , and , are the light curves average values and standard deviations, respectively, which are calculated for a given for the points satisfying the criterion (2) only, is the number of such pairs, and is the bin size. (Note a typo in equation 3 of [16], where in the numerator should be .) The standard deviation is calculated as [15]
| (3) |
where the summation is over the same pairs as in equation (1). In our convention, positive lags correspond to radio lagging X-rays.
3 Results
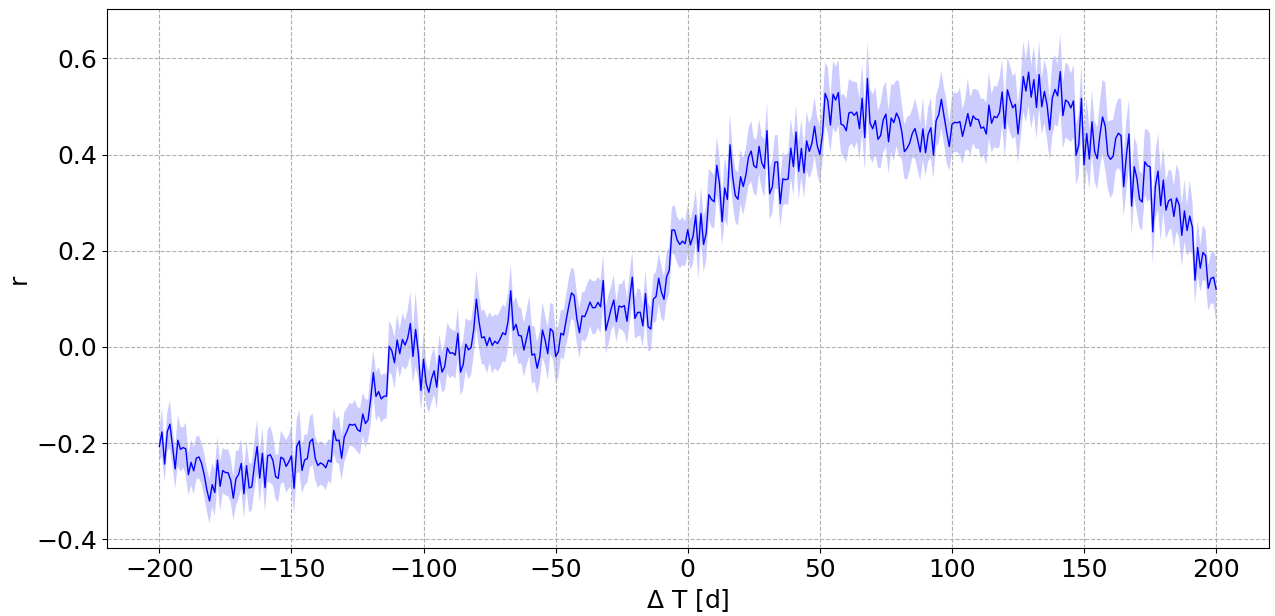
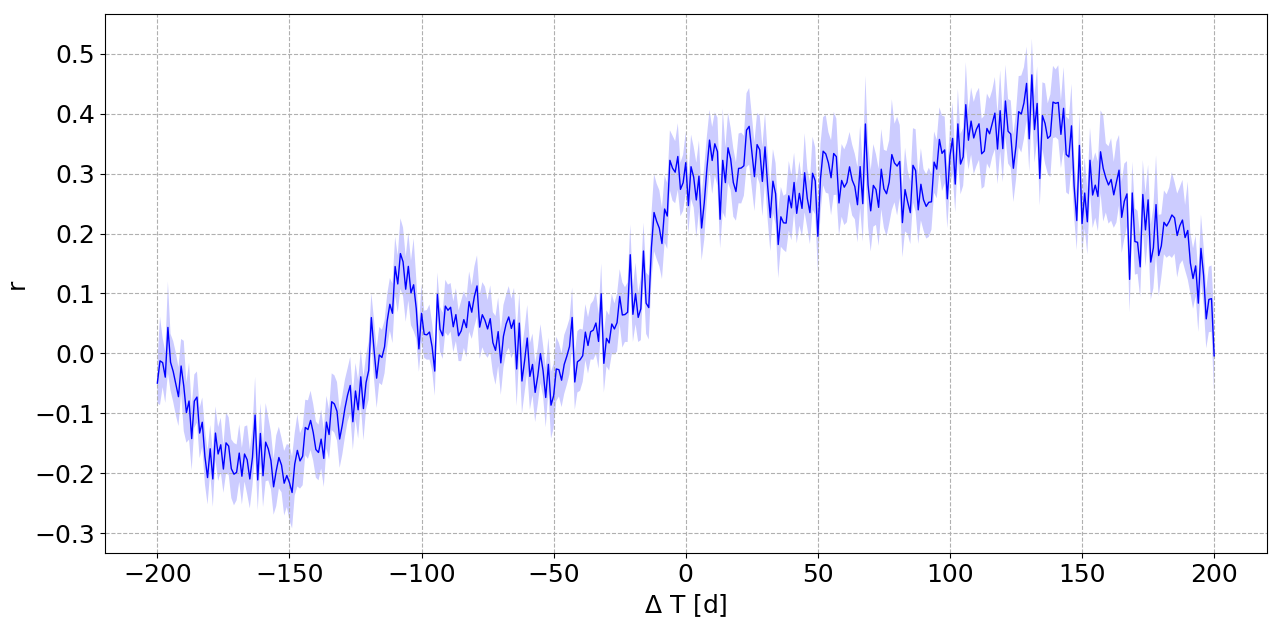
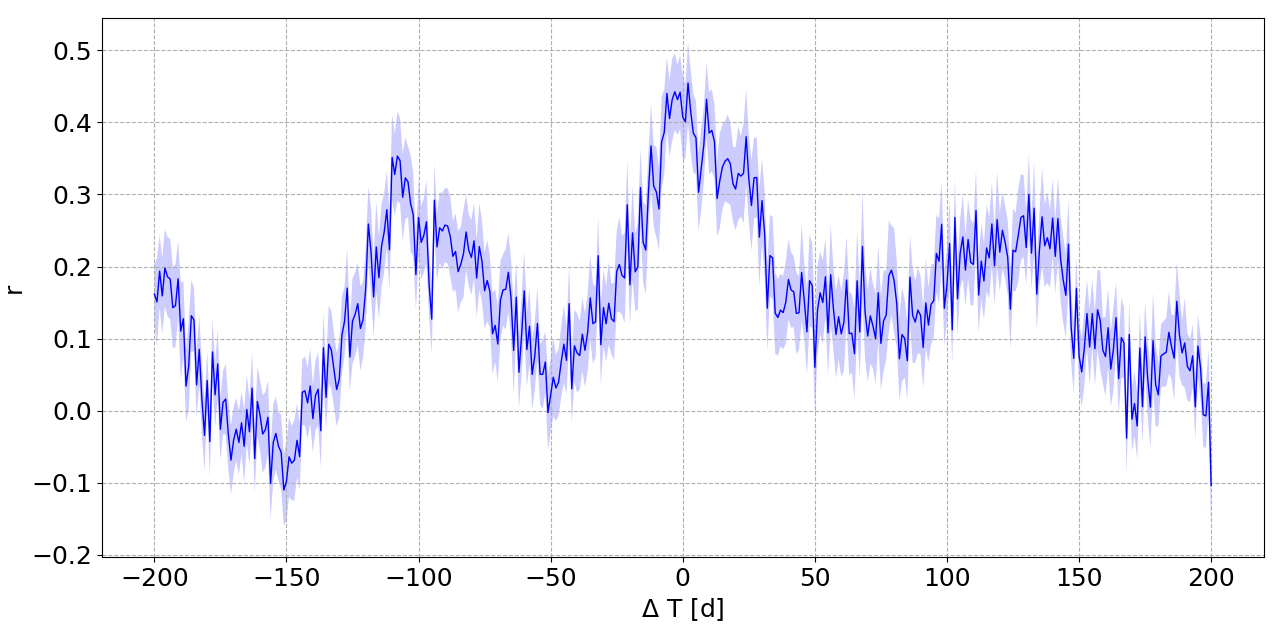
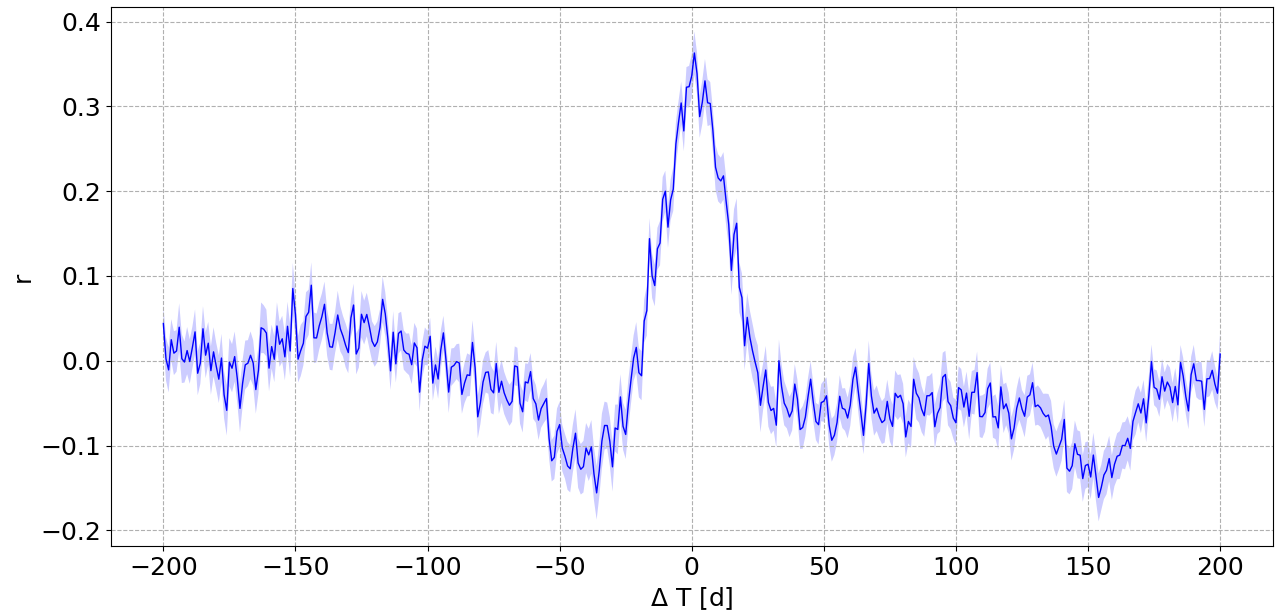
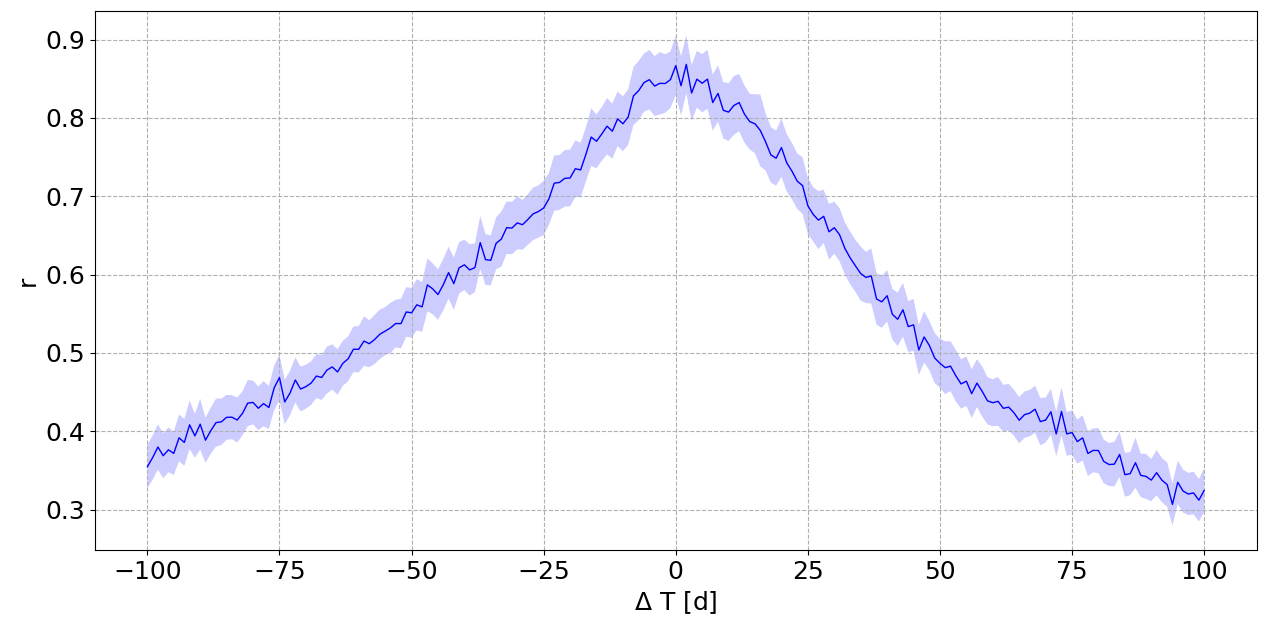
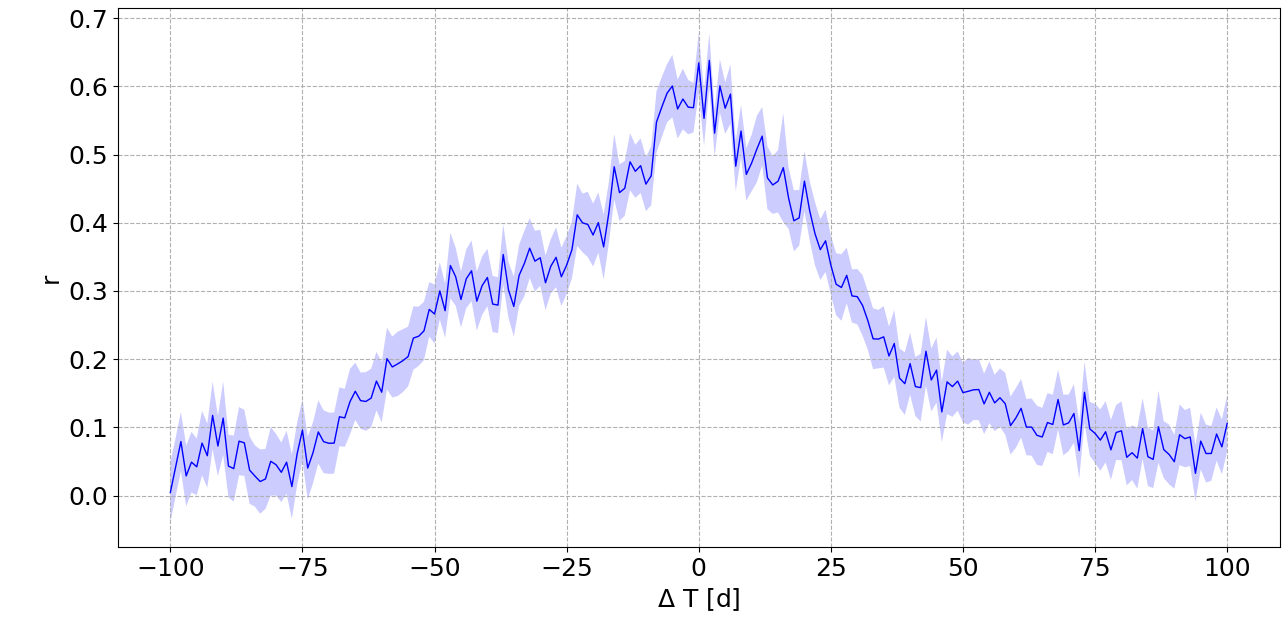
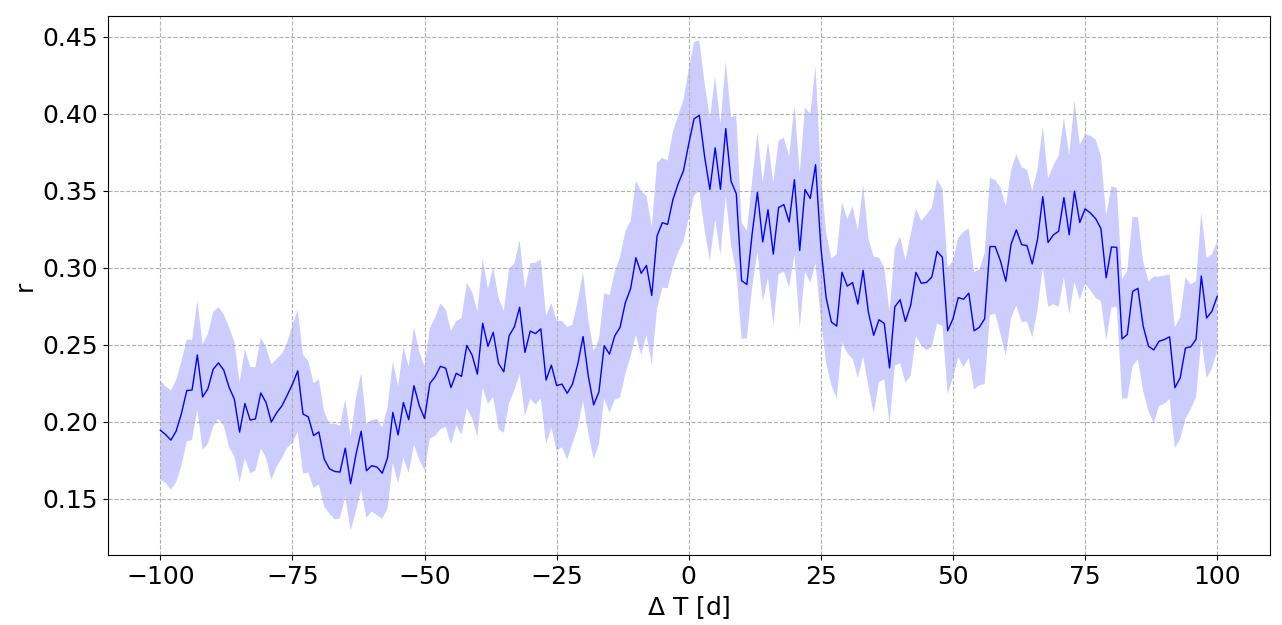
We have calculated cross-correlations for all of the X-ray bands, and for all of the soft, hard and combined states. Most of them show significant correlations; here we show some selected, most interesting results. Fig. 1(a) shows the correlation of the radio with the softest ASM band, 1.5–3 keV in the soft state. We see that while the correlation at zero lag is weak, , it increases with the lag up to the maximum at d. The highest range of values of occurs in the wide range of –150 d. In the 3–5 keV band and the soft state, Fig. 1(b), we see a similar behaviour, but the zero-lag correlation is stronger, , and the maximum at a somewhat longer –150 d is weaker, up to . Following this trend, the 5–12 keV band in the soft state shows the global maximum around zero lag with , and the (local) maximum around –150 d similar to those of the lower-energy bands is now relatively weak, with –0.25, see Fig. 1(c). For the hard state, we show only the result for the sum of the ASM bands, 1.5–12 keV. We see a distinct and relatively narrow maximum around zero lag, though with a relatively small coefficient, .
We then show the correlations with the BAT light curves. Fig. 2(a) shows the results for all the data. We see a very high correlation coefficient, , around zero lag. Then, the correlation in the soft state is similar, with the maximum around zero lag with , see Fig. 2(b). On the other hand, the correlation in the hard state is much weaker, at the zero lag, and the cross-correlation profile is complex, see Fig. 2(c).
4 Interpretation
We have obtained two main results. Our strongest correlation found in the analysed data is that between the 15–50 keV hard X-rays and the 15 GHz radio emission around zero lag for the full light curves, i.e., including both the hard and soft states, shown in Fig. 2(a). When dividing the light curve into the states, a stronger and clearer correlation is in the soft state, though weaker than that for the entire light curves.
The hard X-ray emission appears to be from Comptonization in a corona/hot accretion flow in the vicinity of the black hole [5, 6, 17], while the radio emission is from the jets, in particular the approaching one [8]. Surprisingly, the correlation for the entire data is very strong, with close to unity. The correlation of radio and X-rays in the hard state, Figs. 1(d), 2(c), is similar at zero lag to that in other accreting binaries containing a black hole, e.g., [18]. Such correlations agree with the results of magneto-hydrodynamical simulations, showing a formation of a strong jet by a geometrically thick disc [19], with the X-rays being due to thermal Comptonization in the thick hot disc [5]. However, the correlation of radio with hard X-rays in Cyg X-1 is stronger in the soft state, whereas this state in other X-ray binaries accreting onto a black hole is associated either with jet quenching or occasional ejection of individual radio-emitting blobs [20]. In contrast, the jet in the soft state of Cyg X-1 is present almost always, and is very tightly linked to the high-energy tail beyond the disc blackbody. That tail is well modelled by Comptonization in a corona above the surface of the accretion disc [6]. This points out to the jet emission being strongly linked to the hot Comptonizing medium, either a hot disc or a hot corona, in all of the states of Cyg X-1. This conclusion was reached before by [13], but at a much weaker statistical significance.
Second, we have found the cross-correlation with soft X-rays in the soft state of Cyg X-1 is relatively strong and positive, but only for long lags in a wide range of –150 d. The strength of this lagged correlation is highest in the 1.5–3 keV band, as shown in Fig. 1(a), and it decreases with the increasing energy. In hard X-rays, 15–50 keV, the lagged correlation disappears completely, see Fig. 2(b). The cross-correlation for the 1.5–3 keV band has a very asymmetric shape, showing mostly positive lags, which appears to be highly significant statistically.
We interpret these lags as due to the time between a fluctuation of the thin accretion disc arriving near the black hole and the subsequent response of the jet. The jet production in a thin disc requires the presence of poloidal magnetic field, e.g. [21], and this field can be advected from the donor star. A similar radio lag with respect to the soft X-rays in the soft state was found in Cyg X-3 [16], and the mechanism for field advection in Cyg X-1 can be similar to that proposed for Cyg X-3 by [22].
Acknowledgments.
We thank Barbara De Marco for valuable comments. We acknowledge support from the Polish National Science Centre under the grant 2015/18/A/ST9/00746.References
- [1] S. Bowyer, E. T. Byram, T. A. Chubb and H. Friedman, Cosmic X-ray Sources, Science 147 (1965) 394.
- [2] D. R. Gies and C. T. Bolton, The optical spectrum of HDE 226868 = Cygnus X-1. I - Radial velocities and orbital elements, Astrophys. J. missing (missing) missing 260 (1982) 240.
- [3] D. R. Gies and C. T. Bolton, The optical spectrum of HDE 226868 = Cygnus X-1. II Spectrophotometry and mass estimates, Astrophys. J. missing (missing) missing 304 (1986) 371.
- [4] T. Belloni and G. Hasinger, Variability in the noise properties of Cygnus X-1, Astronomy & Astrophysics 227 (1990) L33.
- [5] M. Gierliński, A. A. Zdziarski, C. Done, W. N. Johnson, K. Ebisawa, Y. Ueda et al., Simultaneous X-ray and gamma-ray observations of Cyg X-1 in the hard state by GINGA and OSSE, Monthly Notices of the Royal Astronomical Society 288 (1997) 958 [arXiv:astro-ph/9610156].
- [6] M. Gierliński, A. A. Zdziarski, J. Poutanen, P. S. Coppi, K. Ebisawa and W. N. Johnson, Radiation mechanisms and geometry of Cygnus X-1 in the soft state, Monthly Notices of the Royal Astronomical Society 309 (1999) 496 [arXiv:astro-ph/9905146].
- [7] J. A. Orosz, J. E. McClintock, J. P. Aufdenberg, R. A. Remillard, M. J. Reid, R. Narayan et al., The Mass of the Black Hole in Cygnus X-1, Astrophysical Journal 742 (2011) 84 [1106.3689].
- [8] A. M. Stirling, R. E. Spencer, C. J. de la Force, M. A. Garrett, R. P. Fender and R. N. Ogley, A relativistic jet from Cygnus X-1 in the low/hard X-ray state, Monthly Notices of the Royal Astronomical Society 327 (2001) 1273 [astro-ph/0107192].
- [9] N. I. Shakura and R. A. Sunyaev, Black holes in binary systems: Observational appearance, Astronomy & Astrophysics 24 (1973) 337.
- [10] A. A. Zdziarski, D. Malyshev, M. Chernyakova and G. G. Pooley, High-energy gamma-rays from Cyg X-1, Monthly Notices of the Royal Astronomical Society 471 (2017) 3657 [1607.05059].
- [11] A. M. Levine, H. Bradt, W. Cui, J. G. Jernigan, E. H. Morgan, R. Remillard et al., First Results from the All-Sky Monitor on the Rossi X-Ray Timing Explorer, The Astrophysical Journal Letters 469 (1996) L33 [astro-ph/9608109].
- [12] S. D. Barthelmy, L. M. Barbier, J. R. Cummings, E. E. Fenimore, N. Gehrels, D. Hullinger et al., The Burst Alert Telescope (BAT) on the SWIFT Midex Mission, Space Science Reviews 120 (2005) 143 [astro-ph/0507410].
- [13] A. A. Zdziarski, G. K. Skinner, G. G. Pooley and P. Lubiński, X-ray variability patterns and radio/X-ray correlations in Cyg X-1, Monthly Notices of the Royal Astronomical Society 416 (2011) 1324 [1103.2988].
- [14] A. A. Zdziarski, J. N. S. Shapopi and G. G. Pooley, The Persistent Radio Jet Coupled to Hard X-Rays in the Soft State of Cyg X-1, The Astrophysical Journal Letters 894 (2020) L18 [2002.12152].
- [15] R. A. Edelson and J. H. Krolik, The discrete correlation function - A new method for analyzing unevenly sampled variability data, Astrophys. J. missing (missing) missing 333 (1988) 646.
- [16] A. A. Zdziarski, D. Malyshev, G. Dubus, G. G. Pooley, T. Johnson, A. Frankowski et al., A comprehensive study of high-energy gamma-ray and radio emission from Cyg X-3, Monthly Notices of the Royal Astronomical Society 479 (2018) 4399 [1804.07460].
- [17] C. Done, M. Gierliński and A. Kubota, Modelling the behaviour of accretion flows in X-ray binaries. Everything you always wanted to know about accretion but were afraid to ask, The Astronomy and Astrophysics Review 15 (2007) 1 [0708.0148].
- [18] S. Corbel, M. Coriat, C. Brocksopp, A. K. Tzioumis, R. P. Fender, J. A. Tomsick et al., The ‘universal’ radio/X-ray flux correlation: the case study of the black hole GX 339-4, Monthly Notices of the Royal Astronomical Society 428 (2013) 2500 [1211.1600].
- [19] M. Liska, A. Tchekhovskoy and E. Quataert, Large-scale poloidal magnetic field dynamo leads to powerful jets in GRMHD simulations of black hole accretion with toroidal field, Monthly Notices of the Royal Astronomical Society 494 (2020) 3656 [1809.04608].
- [20] R. P. Fender, T. M. Belloni and E. Gallo, Towards a unified model for black hole X-ray binary jets, Monthly Notices of the Royal Astronomical Society 355 (2004) 1105 [astro-ph/0409360].
- [21] M. Liska, A. Tchekhovskoy, A. Ingram and M. van der Klis, Bardeen-Petterson alignment, jets, and magnetic truncation in GRMHD simulations of tilted thin accretion discs, Monthly Notices of the Royal Astronomical Society 487 (2019) 550 [1810.00883].
- [22] X. Cao and A. A. Zdziarski, Jets in the soft state in Cyg X-3 caused by advection of the donor magnetic field and unification with low-mass X-ray binaries, Monthly Notices of the Royal Astronomical Society 492 (2020) 223 [1910.01377].