Optic disc and fovea localisation in ultra-widefield scanning laser ophthalmoscope images captured in multiple modalities
Abstract
We propose a convolutional neural network for localising the centres of the optic disc (OD) and fovea in ultra-wide field of view scanning laser ophthalmoscope (UWFoV-SLO) images of the retina. Images captured in both reflectance and autofluorescence (AF) modes, and central pole and eyesteered gazes, were used. The method achieved an OD localisation accuracy of 99.4% within one OD radius, and fovea localisation accuracy of 99.1% within one OD radius on a test set comprising of 1790 images. The performance of fovea localisation in AF images was comparable to the variation between human annotators at this task. The laterality of the image (whether the image is of the left or right eye) was inferred from the OD and fovea coordinates with an accuracy of 99.9%.
Keywords:
Optic disc detection Fovea detection Laterality determination Retinal images Convolutional neural networks.1 Introduction
The OD and fovea are two anatomical landmarks found in the retina. The OD is where vasculature and nervous connections are made to the rest of body, and appears as a bright disc or oval in retinal images. The fovea, the centre of vision, is the area with the highest density of cone receptor cells, and is found on-axis to the lens of the eye.
Automating the location of these landmarks in retinal images is an important first step in the computer-aided diagnosis of many retinal diseases. For example, glaucoma can be graded by measuring morphology parameters of the OD [24], and automation of this measurement requires the OD to be located [7]. In the detection of diabetic retinopathy, it is often necessary to identify the OD before detection of exudates [4].
UWFoV-SLO \AC@resetAF \AC@resetRG \AC@resetFC \AC@resetCNN
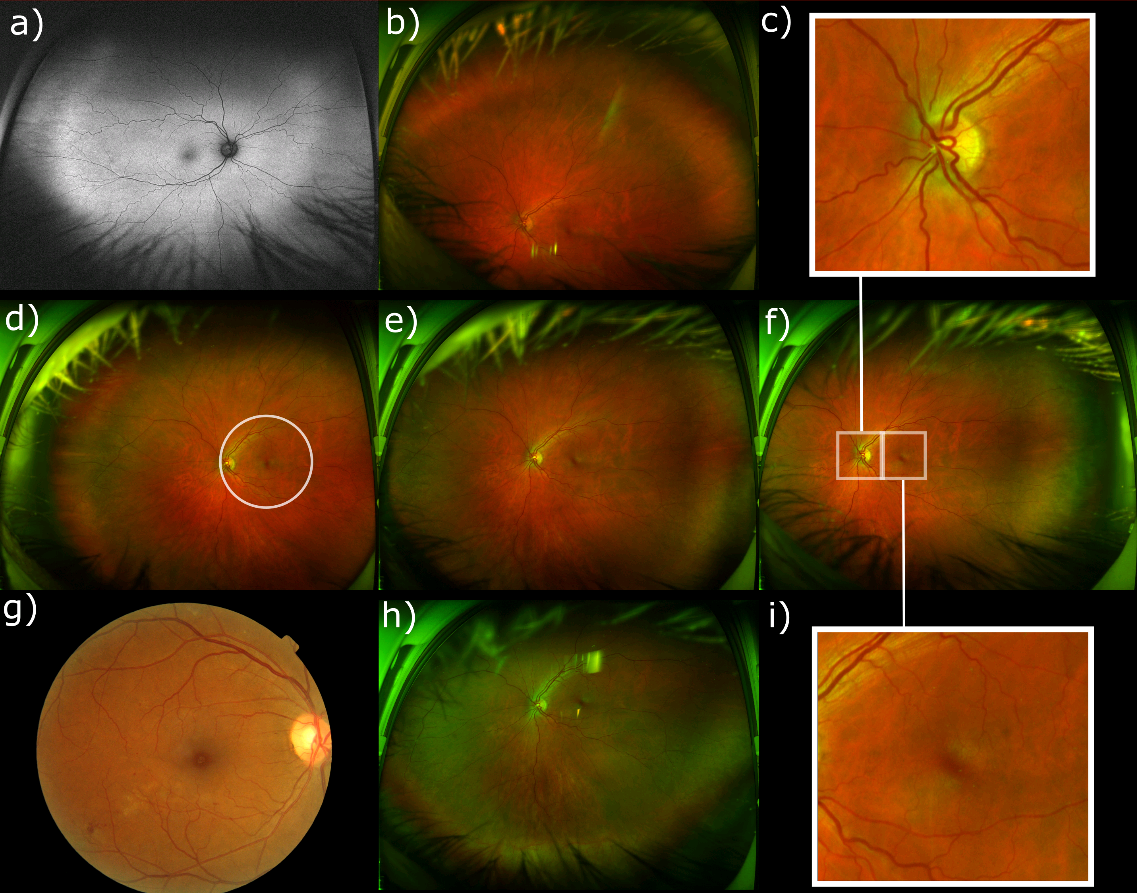
The automatic classification of the laterality of the image, i.e., whether the image is of the right or left eye, is of clinical interest as it allows the image to be labeled without manual input from an operator. This can save valuable time in the clinical environment, with the benefit of classification accuracy similar to human grading [10], as operators are prone to error due to the repetitive nature of this task. The laterality of an image can be inferred from the coordinates of the OD and fovea; in images of the left eye, the OD is to the left of the fovea. The opposite is true for the right eye (see Fig. 1).
A fundus camera captures white-light photographs of the retina, whereas an scanning laser ophthalmoscope (SLO) uses directed laser beams to measure reflectance at each point on the retina to build a reflectance image. This technique allows imaging of a wider field of view — for instance, Optos UWFoV-SLOs used in this study attain field of view (FoV), covering 82% of the retina. Fundus camera images cover a smaller FoV (typically ), resulting in features such as the OD appearing proportionally larger with respect to the imaged area in fundus camera images compared to UWFoV-SLOs images. See Fig. 1 d) and 1 g) for a FoV comparison between fundus camera images and UWFoV-SLO images.
In addition to red-green (RG) reflectance images, UWFoV-SLO systems are capable of capturing autofluorescence (AF) images, in which a laser is used to stimulate emission at longer wavelengths. This allows cell respiration to be visualised, and aids the detection and diagnosis of retinal diseases [8]. AF images have higher intensity levels than reflectance images, and exhibit higher levels of noise. Fig. 1 shows examples of RG and AF images for comparison.
The work presented here is novel for a number of reasons. Firstly, to the best of our knowledge this is the first time an OD and fovea localisation method has been reported on UWFoV-SLO images. Secondly, we are the first to investigate images captured in the AF modality. Thirdly, we show that the proposed convolutional neural network (CNN) architecture can be trained and tested with retinal images captured in multiple modalities. Lastly, we show that the accuracy of the laterality inferred from the OD and fovea coordinates predicted by the proposed method is higher than that of a second CNN which was specifically trained to perform laterality classification.
2 Related work
Sinthanayothin et al. [21] were the first to propose an automated method to estimate the locations of the OD and fovea in digital fundus camera photographs. The OD was located by finding the region of highest intensity variation to the surrounding pixels, and the fovea located by finding the darkest region near the OD. Hoover et al. [9] showed that the direction of the retinal vasculature could be used to locate the OD, as vasculature extends from there.
Foracchia et al. [6] used the technique of fitting parametric models to the blood vessels to locate the OD after extracting the vasculature. Fleming et al. [5] showed that the retinal vasculature could be modeled as an elliptical form and analysed with the Hough transform, yielding approximate locations of the OD and fovea. These locations were refined with edge and intensity measurements. Tobin et al. [25] took the segmented retinal vasculature map, and spatially measured parameters such as vessel density and thickness. This was used with a geometric model of the retina for OD and fovea location estimation.
Niemeijer et al. [17] was first to treat retinal landmark localisation as a regression problem, in which the landmark coordinates were to be estimated. They showed that parameters estimated from the vasculature could be used to train a kNN regressor to return the coordinates of both the OD and fovea. Morphological operations on the blood vessels have also been used to determine the location of the OD, for example the work of Marin et al. [12].
With the advent of deep learning, methods employing these have been developed to locate retinal landmarks in fundus camera images. Calimeri et al. [3] employed transfer-learning of a CNN trained for face-detection for OD detection. Niu et al. [18] showed the region in the image containing the OD could be determined by generating saliency maps from the image (maps which indicate ‘interesting’ features, such as high spatial frequency). From these maps, a number of candidate OD regions were selected. These were then processed with a CNN, which was trained to classify each region as containing OD or not. Similarly, Mitra et al. [16] used a CNN to return a region-of-interest containing the OD, and Meng et al. [13] used a CNN trained on images where the blue channel is replaced with a vasculature map, to locate the OD.
Simultaneous OD and fovea localisation in fundus camera images with CNNs has been shown by Al-Bander et al. [1], whereby a single CNN returned four outputs, the and coordinates of the OD and fovea. This was further developed [2], in which two networks were utilised — the first gave an approximate location of the coordinates of both features, which were used to extract two image patches centred around the OD and fovea respectively. These image patches were then passed to the second network for refined feature centre estimation.
Recently, Meyer et al. [14] showed that a U-net architecture [19] could be used to predict the distance of each pixel from the nearest landmark. A predicted distance map was calculated, and image processing techniques were employed to identify the two landmarks in the map. At this stage, it was not known which landmark was the OD and which the fovea. A further step, based on assumptions of retinal brightness, was used to label the landmarks.
Automated laterality determination using fundus camera images has also been studied. For example Tan et al. [23] extracted blood vessels and the OD which were passed to a support vector machine for laterality classification. Roy et al. [20] deployed transfer-learning with a CNN, which also contained auxiliary inputs for extracted image data, such as blood vessel density and orientation. More recently, Jang et al. [10] demonstrated that CNNs could be put to this task, achieving 99.0% classification accuracy.
3 Materials
Images captured in both RG and AF modes were used in this experiment. The majority of images were captured in the central-pole (CP) gaze, in which the scan is centred on the fovea. Images were also captured with the eyesteered (ES) gazes, in which the scan was centred on the superior, inferior, nasal or temporal fields of the retina (Fig. 1). The data set contained 4732 left eye images and 4786 right eye images. The data set was doubled in size by generating a horizontally-flipped version of each image, and the associated laterality class was swapped.
Table 1 shows the number of images and subjects from the RG and AF modes, split by gaze (CP or ES), including the horizontally flipped version of each original image. Some subjects were imaged in CP and ES or RG and AF so subject totals are not the sum of rows and columns.
| CP | ES | Total | |
|---|---|---|---|
| RG | 11132 (1153) | 1818 (87) | 12950 (1157) |
| AF | 5792 (987) | 294 (77) | 6086 (993) |
| Total | 16924 (2139) | 2112 (164) | 19036 (2149) |
Annotations of all images in the data set were obtained from a trained observer, who was required to annotate the location of the OD and fovea, and the image laterality and gaze. Three additional graders were required to annotate 100 RG and 100 AF images, so that inter-grader variation could be assessed.
4 Method
A CNN was devised, which accepted an UWFoV-SLO retinal image as input, and predicted four parameters; the OD and fovea and coordinates.
4.1 Preprocessing
To avoid overfitting and obtain a fair evaluation of results, images were split into training, validation and test sets on the constraints that 1) all images from any one subject were not put into more than one of the training, validation or test sets 2) The training, validation or test sets contained approximately 70%, 20% and 10% of the data set, respectively.
Images were downsampled from 30723900 to 768975 pixels to reduce computational complexity. Only the green reflectance channel was used, so a single network could be devised to accept both reflectance and AF images, which are composed of one channel. The green reflectance channel was selected because the vasculature (the topography of which can be used for inferring laterality) contrast was higher. Images were not cropped, as landmarks can be located in the extremes of the capture area in ES images (Fig. 1). Image intensity values were scaled to have zero mean and unit standard deviation.
OD and fovea coordinates were normalised by dividing both and coordinates by the image width, , so all coordinates were in the range [0,1], and the loss function was not biased in favour of the coordinate. Predicted values were mapped back to image coordinates at the inference stage. In the case of horizontally flipped images, the flipped coordinates of the OD and fovea, , were calculated by .
4.2 Architecture
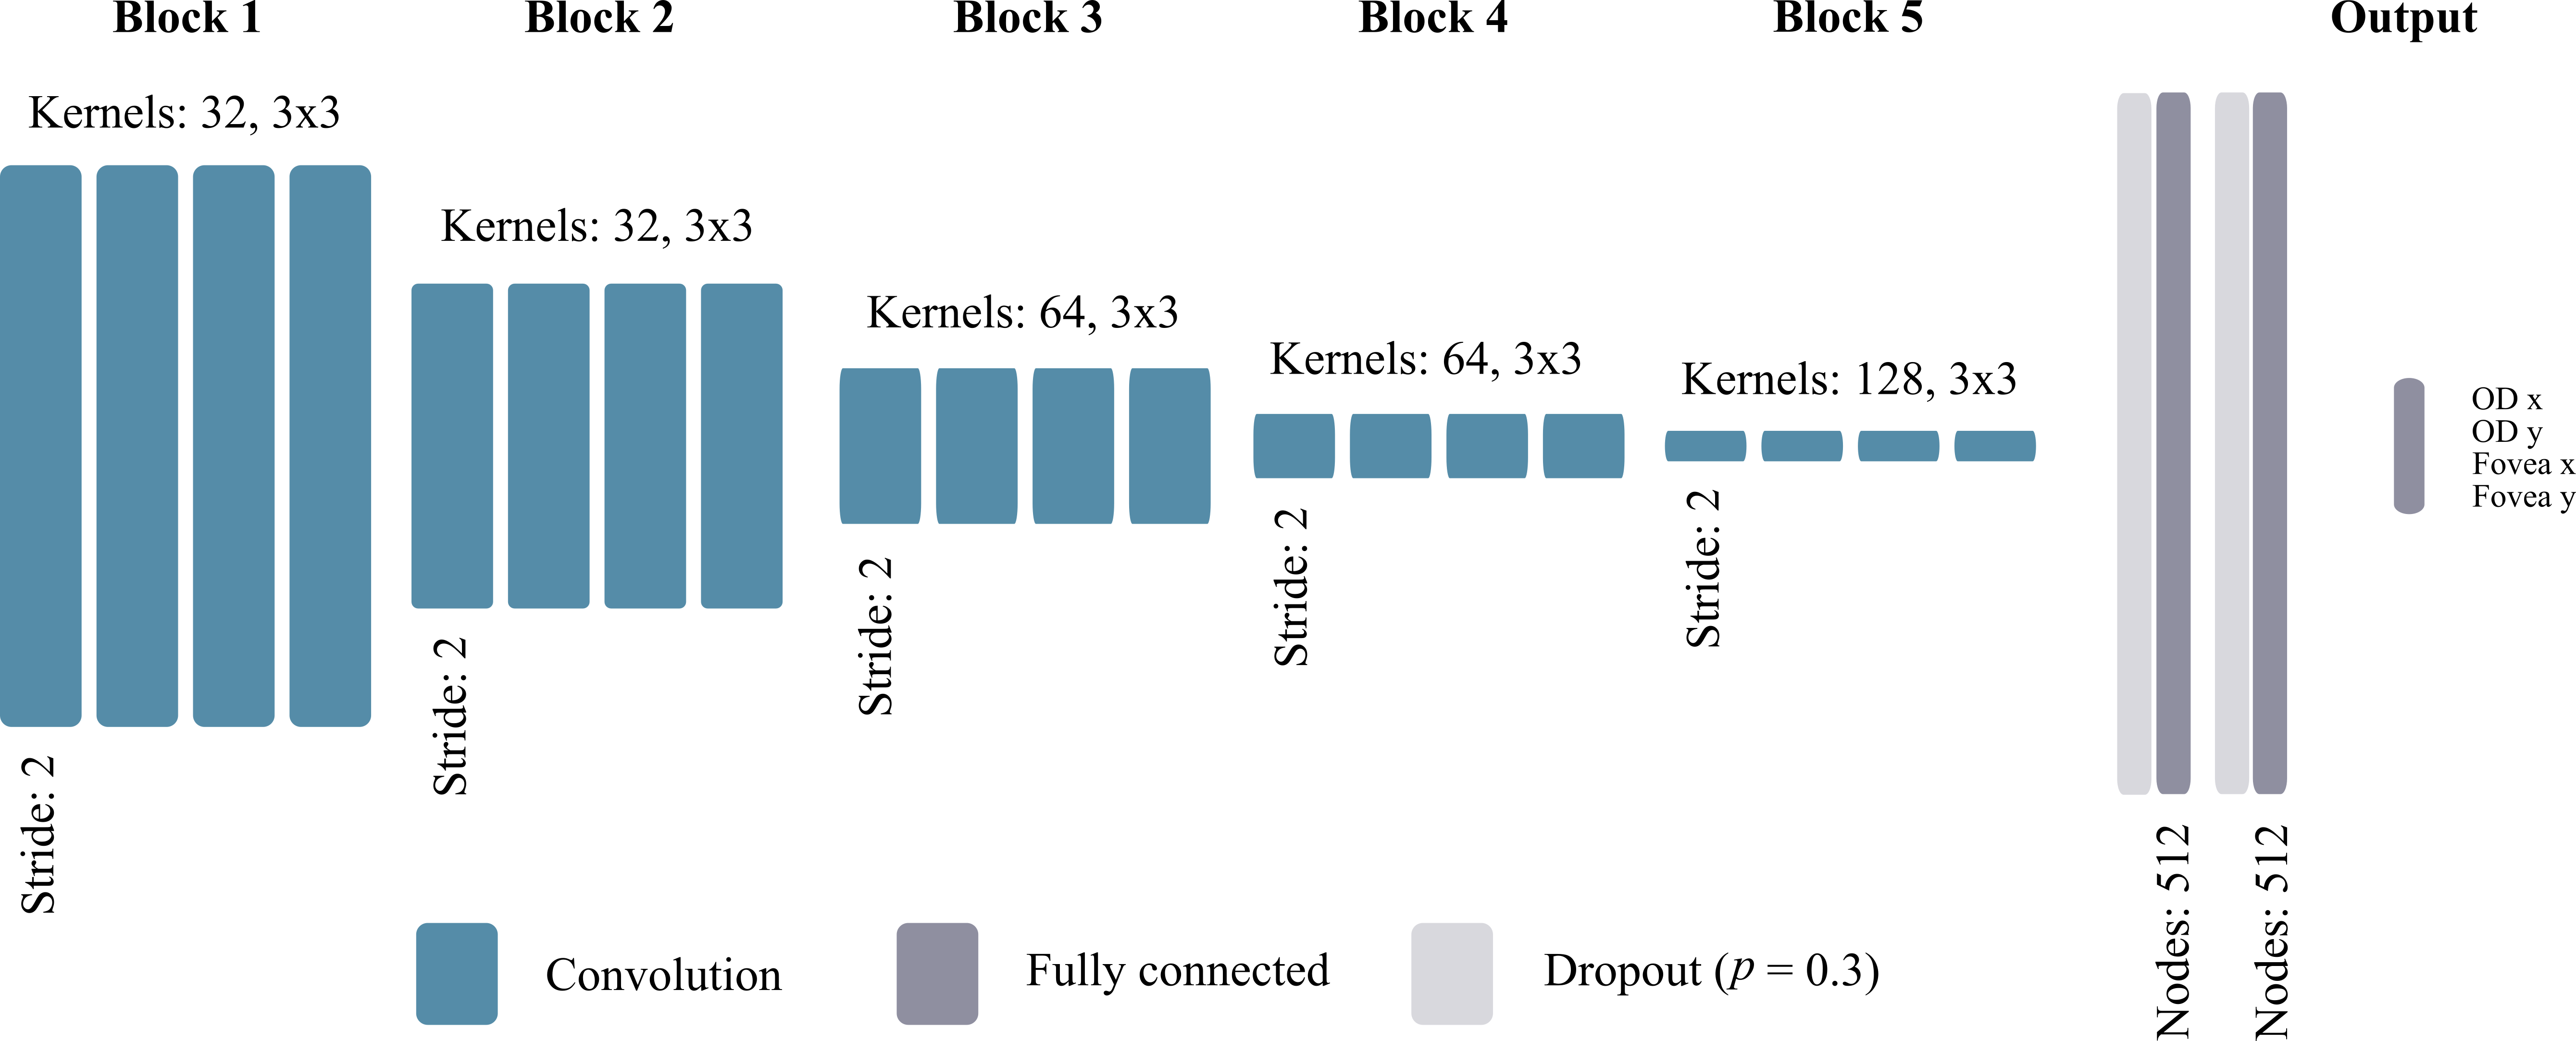
Five blocks of four convolutional layers were stacked, and convolutional layers in the same block had the same number of kernels. Blocks 1 and 2 had 32 kernels, 3 and 4 had 64 kernels, 5 had 128 kernels. The initial convolutional layer of each block had a stride of 2, all subsequent convolutional layers in each block had stride 1. The output from the final convolutional block was flattened, and two fully connected layers of 512 nodes followed, each preceded by dropout layers of dropout probability [22]. The output layer was a fully connected layer of four nodes, one for each and coordinate of OD and fovea (Fig. 2).
The network was optimised using the Adam optimiser [11] with learning rate of 0.0001 and decay rate parameters and . The norm of the gradients was clipped at 1.0 to avoid instability of the loss during training. The mean squared error loss function between the ground truth landmark coordinates and the predicted coordinates was used.
The network (containing 49,882,660 trainable parameters) was trained using Keras with TensorFlow backend, and was performed on a mixture of RG and AF images presented in batches of 16 images. 13,550 training images from 1,587 subjects were used.
4.3 Landmark localisation evaluation
OD and fovea localisation accuracy was defined as the percentage of images for which the Euclidean distance between the predicted landmark location and the ground truth was below OD radii ().
To determine the OD radius, a modification to the OD diameter approximation proposed by Al-Bander et al. was used [2]. The OD radius for each image was estimated from the Euclidean distance between the ground truth and coordinates of the OD and fovea (Equation 1) as
| (1) |
The OD and fovea annotations of three additional graders for 100 RG and 100 AF images were compared to the ground-truth labels. The mean Euclidean distance and the between the annotations, and the standard deviation, was calculated.
An open-source implementation [15] of the method for OD and fovea localisation in fundus camera images proposed by Meyer et al. [14] was tested on RG and AF UWFoV-SLO images. Given the constraints on the input size of the pre-trained network, RG and AF images were resized to pixels, and padded with zeros to pixels. Distance probability maps were analysed with the image processing pipeline presented [15] to predict the OD and fovea coordinates.
4.4 Laterality classification evaluation
Laterality accuracy was calculated as the percentage of images which were classified as belonging to the correct class, from left or right eye. The class sizes were balanced as a result of the flipping operation, thus the accuracy score did not require weighting.
The laterality of the input image can be inferred from the OD and fovea coordinates, as shown in Equation 2.
| (2) |
A modified version of the proposed architecture was used to implement a laterality classifier. The output layer was replaced with a fully connected layer with a single, Sigmoid activated node to predicted the laterality class of the input image. This allowed the laterality inferred from the landmark coordinates predicted by the proposed method to be compared with a classifier baseline. The classification network was trained in the same fashion as the landmark localisation network, but using binary cross-entropy loss between the ground truth class and predicted class labels.
5 Results
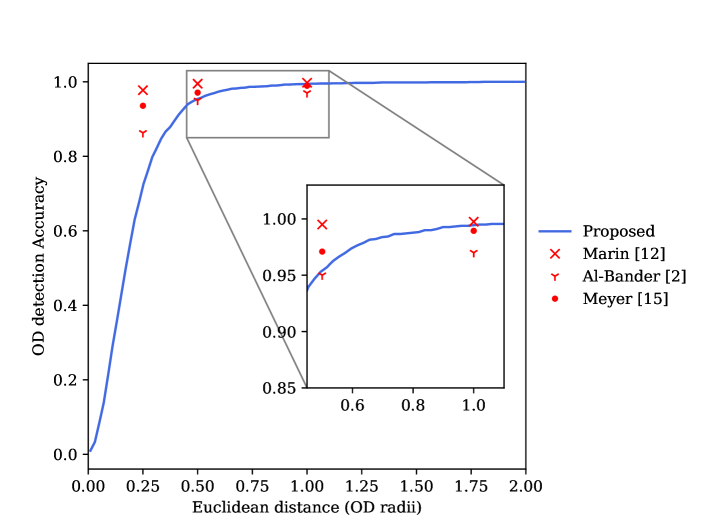
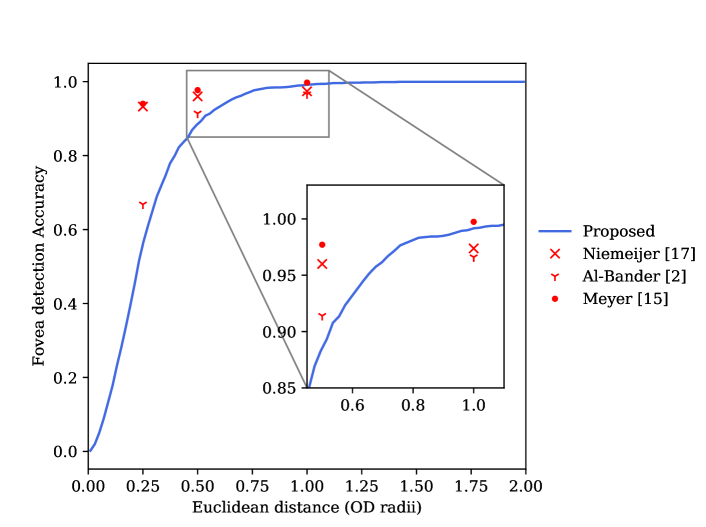
Results for landmark localisation accuracy and laterality classification accuracy for 1790 test images are shown in Table 2. Results of the proposed method are split by modality and gaze. Other methods demonstrated on fundus camera images are presented for comparison. Plots of OD and fovea accuracy as as function of distance are shown in Fig. 3 and Fig. 4. The accuracy of laterality inferred from the coordinates of the OD and fovea is shown in Table 2. The laterality classification network accuracy is also shown.
| Method | Mode | Gaze | OD Accuracy | Fovea accuracy | Lat. Acc. | Images | |||||
| 0.25 | 0.5 | 1 | 0.25 | 0.5 | 1 | Inf. | Class. | ||||
| Jang [10] | FC | x | x | x | x | x | x | x | 99.0 | 5180 | |
| Niemeijer [17] | FC | x | x | x | 93.3 | 96.0 | 97.4 | x | x | 800 | |
| Marin [12] | FC | 97.8 | 99.5 | 99.8 | x | x | x | x | x | 1200 | |
| Al-Bander [2] | FC | 83.6 | 95.0 | 97.0 | 66.8 | 91.4 | 96.6 | x | x | 1200 | |
| Meyer [14] | FC | 93.6 | 97.1 | 98.9 | 94.0 | 97.7 | 99.7 | x | x | 1136 | |
| Proposed | RG | All | 67.6 | 93.7 | 99.5 | 56.0 | 88.2 | 99.1 | 99.8 | 99.0 | 1144 |
| Proposed | RG | CP | 71.3 | 95.1 | 99.5 | 58.7 | 90.4 | 99.0 | 99.8 | 98.9 | 1006 |
| Proposed | RG | ES | 40.6 | 83.3 | 99.3 | 36.2 | 72.5 | 100.0 | 100.0 | 100.0 | 138 |
| Proposed | AF | All | 73.4 | 96.3 | 99.2 | 48.6 | 85.3 | 99.1 | 100.0 | 100.0 | 646 |
| Proposed | AF | CP | 74.9 | 97.0 | 99.3 | 49.3 | 85.9 | 99.3 | 100.0 | 100.0 | 610 |
| Proposed | AF | ES | 47.2 | 83.3 | 97.2 | 36.1 | 75.0 | 94.4 | 100.0 | 100.0 | 36 |
| Proposed | All | All | 69.7 | 94.6 | 99.4 | 53.4 | 87.2 | 99.1 | 99.9 | 99.4 | 1790 |
| Proposed | All | CP | 72.6 | 95.9 | 99.4 | 55.2 | 88.7 | 99.1 | 99.9 | 99.3 | 1616 |
| Proposed | All | ES | 42.0 | 83.3 | 98.9 | 36.2 | 73.0 | 98.9 | 100.0 | 100.0 | 174 |
The mean Euclidean distance and standard deviation , normalised by , between three additional graders and the ground-truth landmark coordinates is shown in Table 3. 100 RG and 100 AF images were used. The proposed method, tested on 1790 test images, is shown for comparison.
| RG | AF | |||||||
|---|---|---|---|---|---|---|---|---|
| Grader | OD | OD | Fovea | Fovea | OD | OD | Fovea | Fovea |
| 1 | 0.127 | 0.074 | 0.205 | 0.159 | 0.117 | 0.073 | 0.323 | 0.222 |
| 2 | 0.126 | 0.082 | 0.167 | 0.112 | 0.139 | 0.078 | 0.318 | 0.238 |
| 3 | 0.164 | 0.089 | 0.198 | 0.120 | 0.139 | 0.093 | 0.331 | 0.239 |
| Mean | 0.139 | 0.082 | 0.190 | 0.130 | 0.132 | 0.081 | 0.324 | 0.233 |
| Proposed | 0.226 | 0.174 | 0.278 | 0.219 | 0.207 | 0.160 | 0.302 | 0.205 |
The pixel landmark distance prediction method proposed by Meyer [14] achieved 0% accuracy for both OD and fovea localisation within on 1790 UWFoV-SLO images. The inferred laterality classification accuracy was 52.7%. These results could be expected given the model was trained on fundus camera images, and highlight the difference between the two image capturing systems.
6 Conclusion
In this paper, we have proposed a CNN architecture for the localisation of the OD and the fovea in UWFoV-SLO images of two modalities — RG reflectance and AF emission. The method achieved an OD localisation accuracy of 99.4% within one OD radius, and fovea localisation accuracy of 99.1% within one OD radius (Table 2). These values are higher than those from other methods applied to fundus camera images, found in the literature, at 0.5 and 1 distances, but not at 0.25. However, a fair, direct comparison between these results cannot be made due to the differences between the imaging techniques. The UWFoV-SLO has a larger FoV, which results in features such as the OD and fovea appearing smaller compared to fundus camera images (Fig. 1). When comparing the performance with human graders, the proposed method achieves AF fovea localisation distance errors comparable with inter-grader variation (Table 3).
We have shown that this CNN can also be used to infer the laterality of the input image by considering the predicted coordinates of the retinal landmarks. This method achieves laterality classification accuracy values higher than a similar network trained only to predict the laterality of the input image (99.9% vs 99.4%), and results are in line with published literature using fundus camera images [10].
Testing of a CNN with weights trained on fundus camera images [15, 14] on UWFoV-SLO images lead to extremely low accuracy values. This highlights the inherent differences between the images captured by fundus cameras and UWFoV-SLOs, and confirms that direct transfer of pre-trained networks between the two image types is not possible.
Future work will involve retraining the Meyer model on UWFoV-SLO images to compare performance. However, modification to the image processing technique for determining which landmark is the OD and fovea will be required, as the existing method assumes that the OD is brighter than the fovea, which does not hold in the case of AF images. Future work will also include training and testing our method on fundus camera data sets, ideally of subjects also imaged with UWFoV-SLOs, so direct comparison can be made.
References
- [1] Al-Bander, B., Al-Nuaimy, W., Al-Taee, M.A., Al-Ataby, A., Zheng, Y.: Automatic Feature Learning Method for Detection of Retinal Landmarks. In: Proceedings - 2016 9th International Conference on Developments in eSystems Engineering. pp. 13–18 (2016). https://doi.org/10.1109/DeSE.2016.4
- [2] Al-Bander, B., Al-Nuaimy, W., Williams, B.M., Zheng, Y.: Multiscale sequential convolutional neural networks for simultaneous detection of fovea and optic disc. Biomedical Signal Processing and Control 40, 91–101 (2018). https://doi.org/10.1016/j.bspc.2017.09.008
- [3] Calimeri, F., Marzullo, A., Stamile, C., Terracina, G.: Optic Disc Detection Using Fine Tuned Convolutional Neural Networks. In: Proceedings - 12th International Conference on Signal Image Technology and Internet-Based Systems. pp. 69–75 (2016). https://doi.org/10.1109/SITIS.2016.20
- [4] Faust, O., Acharya, R., Ng, E.Y., Ng, K.H., Suri, J.S.: Algorithms for the automated detection of diabetic retinopathy using digital fundus images: A review. Journal of Medical Systems 36(1), 145–157 (2012). https://doi.org/10.1007/s10916-010-9454-7
- [5] Fleming, A.D., Goatman, K.A., Philip, S., Olson, J.A., Sharp, P.F.: Automatic detection of retinal anatomy to assist diabetic retinopathy screening. Physics in Medicine and Biology 52(2), 331–345 (2007). https://doi.org/10.1088/0031-9155/52/2/002
- [6] Foracchia, M., Grisan, E., Ruggeri, A.: Detection of optic disc in retinal images by means of a geometrical model of vessel structure. IEEE Transactions on Medical Imaging 23(10), 1189–1195 (2004). https://doi.org/10.1109/TMI.2004.829331
- [7] Haleem, M.S., Han, L., van Hemert, J., Li, B.: Automatic extraction of retinal features from colour retinal images for glaucoma diagnosis: A review. Computerized Medical Imaging and Graphics 37(7-8), 581–596 (2013). https://doi.org/10.1016/j.compmedimag.2013.09.005
- [8] Holz, F.G., Spaide, R.F., Schmitz-Valckenberg, S., Bird, A.C. (eds.): Atlas of fundus autofluorscence imaging. Springer-Verlag (2007). https://doi.org/10.1007/978-3-540-71994-6
- [9] Hoover, A., Goldbaum, M.: Locating the optic nerve in a retinal image using the fuzzy convergence of the blood vessels. IEEE Transactions on Medical Imaging 22(8), 951–958 (2003). https://doi.org/10.1109/TMI.2003.815900
- [10] Jang, Y., Son, J., Park, K.H., Park, S.J., Jung, K.H.: Laterality Classification of Fundus Images Using Interpretable Deep Neural Network. Journal of Digital Imaging pp. 1–6 (2018). https://doi.org/10.1007/s10278-018-0099-2
- [11] Kingma, D.P., Ba, J.L.: Adam: A Method for Stochastic Optimization. CoRR abs/1412.6, 1–15 (2014). https://doi.org/10.1016/j.nano.2011.03.005, http://arxiv.org/abs/1412.6980
- [12] Marin, D., Gegundez-Arias, M.E., Suero, A., Bravo, J.M.: Obtaining optic disc center and pixel region by automatic thresholding methods on morphologically processed fundus images. Computer Methods and Programs in Biomedicine 118(2), 173–185 (2015). https://doi.org/10.1016/j.cmpb.2014.11.003
- [13] Meng, X., Xi, X., Yang, L., Zhang, G., Yin, Y., Chen, X.: Fast and effective optic disk localization based on convolutional neural network. Neurocomputing 312, 285–295 (2018). https://doi.org/10.1016/j.neucom.2018.05.114
- [14] Meyer, M.I., Galdran, A., Mendonca, A.M., Campilho, A.: A Pixel-Wise Distance Regression Approach for Joint Retinal Optical Disc and Fovea Detection. In: Medical Image Computing and Computer Assisted Intervention – MICCAI 2018. vol. 1, pp. 39–47 (2018). https://doi.org/10.1007/978-3-030-00934-25
- [15] Meyer, M.I., Galdran, A., Mendonca, A.M., Campilho, A.: Joint Retinal Optical Disc and Fovea Detection (2018), https://github.com/minesmeyer/od-fovea-regression
- [16] Mitra, A., Banerjee, P.S., Roy, S., Roy, S., Setua, S.K.: The region of interest localization for glaucoma analysis from retinal fundus image using deep learning. Computer Methods and Programs in Biomedicine 165, 25–35 (2018). https://doi.org/10.1016/j.cmpb.2018.08.003
- [17] Niemeijer, M., Abràmoff, M.D., van Ginnekena, B.: Fast detection of the optic disc and fovea in color fundus photographs. Medical Image Analysis 13(6), 859–870 (2009). https://doi.org/10.1016/j.media.2009.08.003
- [18] Niu, D., Xu, P., Wan, C., Cheng, J., Liu, J.: Automatic localization of optic disc based on deep learning in fundus images. In: 2017 IEEE 2nd International Conference on Signal and Image Processing. pp. 208–212 (2017). https://doi.org/10.1109/SIPROCESS.2017.8124534
- [19] Ronneberger, O., Fischer, P., Brox, T.: U-net: Convolutional networks for biomedical image segmentation. In: Navab, N., Hornegger, J., Wells, W.M., Frangi, A.F. (eds.) Medical Image Computing and Computer-Assisted Intervention – MICCAI 2015. pp. 234–241. Springer International Publishing (2015). https://doi.org/10.1007/978-3-319-24574-428
- [20] Roy, P.K., Chakravorty, R., Sedai, S., Mahapatra, D., Garnavi, R.: Automatic Eye Type Detection in Retinal Fundus Image Using Fusion of Transfer Learning and Anatomical Features. In: 2016 International Conference on Digital Image Computing: Techniques and Applications. pp. 538–544 (2016). https://doi.org/10.1109/DICTA.2016.7797012
- [21] Sinthanayothin, C., Boyce, J.F., Cook, H.L., Williamson, T.H.: Automated localisation of the optic disc, fovea, and retinal blood vessels from digital colour fundus images. British Journal of Ophthalmology 83(8), 902–910 (1999). https://doi.org/10.1136/bjo.83.8.902
- [22] Srivastava, N., Hinton, G., Krizhevsky, A., Sutskever, I., Salakhutdinov, R.: Dropout : A Simple Way to Prevent Neural Networks from Overfitting. Journal of Machine Learning Research 15, 1929–1958 (2014)
- [23] Tan, N.M., Liu, J., Wong, D.W.K., Zhang, Z., Lu, S., Lim, J.H., Li, H., Wong, T.Y.: Classification of left and right eye retinal images. In: Proceedings of SPIE. vol. 7624 (2010). https://doi.org/10.1117/12.844638, http://proceedings.spiedigitallibrary.org/proceeding.aspx?doi=10.1117/12.844638
- [24] Tangelder, G.J., Reus, N.J., Lemij, H.G.: Estimating the clinical usefulness of optic disc biometry for detecting glaucomatous change over time. Eye 20(7), 755–763 (2006). https://doi.org/10.1038/sj.eye.6701993
- [25] Tobin, K.W., Chaum, E., Govindasamy, V.P., Karnowski, T.P.: Detection of anatomic structures in human retinal imagery. IEEE transactions on medical imaging 26(12), 1729–1739 (2007)