Magnetism driven by strong electronic correlation in the heavily carrier-doped iron oxypnictide LaFeAsO0.49H0.51
Abstract
The magnetism of the second antiferromagnetic phase (AF2) arising in the iron-based LaFeAsO1-xHx superconductor for was investigated by muon spin rotation measurements under hydrostatic pressure up to 2.6 GPa. The Néel temperature () obtained for a sample with exhibits considerably greater sensitivity to pressure than that in the pristine antiferromagnetic phase (AF1, ). Moreover, while the AF1 phase is always accompanied by the structural transition (from tetragonal to orthorhombic) at a temperature () which is slightly higher than , the AF2 phase prevails at higher pressures above 1.5 GPa where the structural transition is suppressed (). These features indicate that the microscopic origin of the AF2 phase is distinct from that of AF1, suggesting that electronic correlation plays important role in the former phase. We argue that the orbital-selective Mott transition is a plausible scenario to account for the observed pressure dependence of and in the AF2 phase.
I Introduction
Since the discovery of high- superconductivity in iron-based oxypnictides FeAsO1-xFx (where denotes a lanthanide) Kamihara ; Ren2008 ; Wang2008 ; Hosono_review , the interplay between magnetism and superconductivity in iron-based compounds has been a fascinating topic. While iron is an essential element of the electrically conducting FeAs planes, it usually plays an antagonistic role against superconductivity by bringing about magnetism. As a matter of fact, these compounds in pristine conditions exhibit antiferromagnetic (AF) order below the Néel temperature (), where superconductivity emerges as the AF order is suppressed by carrier doping of the FeAs plane Lumsden .
The emergence of high- superconductivity upon suppression of AF order bears remarkable similarity with that in cuprates, where the parent compounds are regarded as typical Mott insulators. Although the microscopic mechanism of high is still under debate, it seems now commonly presumed that the electronic correlation on the CuO2 planes (i.e., the strong on-site Coulomb repulsion, which leads to the metal-insulator transition upon half filling of the Cu band) is the essential ingredient in cuprates Keimer:15 . Meanwhile, the iron-based compounds are distinct from cuprates in that the pristine compounds exhibit metallic AF order (or spin density wave). Moreover, the AF order is always accompanied by a structural transition at the temperature which is slightly higher than , suggesting a correlation between magnetism and the orbital degrees of freedom. These observations lead to the suggestion that spin and/or orbital fluctuations enhanced by the specific Fermi surface topology mediate the Cooper pairing Hosono_review .
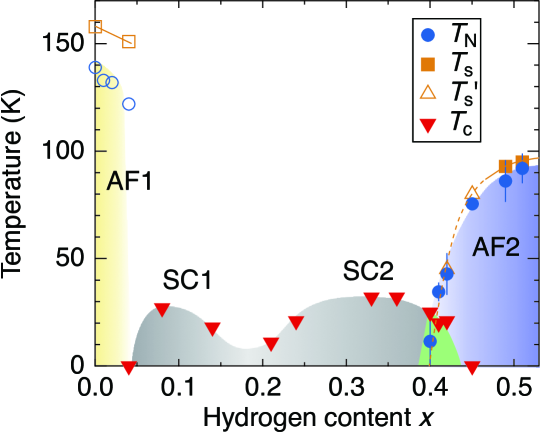
The recent development of carrier-doping technique using hydride ion (FeAsO1-xHx) paved a path to large doping concentration up to , providing opportunity to investigate the relationship between magnetism and superconductivity over unprecedented range of Hanna2011 ; Matsuishi_Ce ; Iimura ; LnFeAsOH_review . As shown in Fig. 1, the extended doping for the case of La Iimura led to the discovery of a new superconducting phase (SC2) marked by the second peak of around (with a dome-like dependence of ) and associated AF phase (AF2) that emerges for in place of the SC2 phase, establishing a novel bipartite phase diagram together with the pristine AF phase (, denoted AF1) and the known superconducting phase (SC1, accompanying another dome with a peak around ) which is separated by a valley of near NMR_Fujiwara2013 ; Hiraishi ; NMR_Sakurai2015 .
As inferred from the previous studies on a sample with , the AF2 phase is characterized by a unique structural modulation and magnetic structure different from the AF1 phase Hiraishi . Although the existence of the AF2 phase adjacent to SC2 in the bipartite phase diagram suggests a causal relationship between these two phases, the subtle difference between the AF1 and AF2 phases hints for possible distinction in the mechanism of superconductivity between the corresponding SC phases.
According to the earlier resistivity measurements, the domes of SC1 and SC2 phases tend to overlap when applying a hydrostatic pressure, merging into a single dome at 6 GPa, with a maximum of 52 K Takahashi . Furthermore, it is inferred from the recent synchrotron X-ray diffraction measurements that the structural transition ( K, for ) under ambient pressure is suppressed () under a relatively low pressure of 1.5 GPa Kobayashi . These features suggest a strong connection between and the lattice structure, providing an important clue for understanding the mechanism behind high- superconductivity in LaFeAsO1-xHx. This connection naturally raises questions regarding the interrelationship between lattice structure and magnetism in the AF2 phase. To address this issue, we conducted muon spin rotation (SR) measurements under hydrostatic pressures on a LaFeAsO1-xHx sample with situated in the AF2 phase.
II Experimental Methods
A polycrystalline sample identical to that used for the X-ray diffraction experiment () Kobayashi was adopted for the SR experiment to avoid ambiguity coming from possible fluctuation of doping concentration, where the details of the sample preparation are reported in Ref. Hanna2011 . Conventional SR measurements under a hydrostatic pressure were performed using the general purpose decay-channel (GPD) spectrometer of the Swiss-Muon-Source facility at the Paul Scherrer Institute, Switzerland. A powder sample (1.5 g) was pressurized within a cylindrical space with diameter of 5.9 mm using Daphne oil 7373 as pressure-transmitting medium. The sample was sealed by a double-wall pressure-cell (PC) made of CuBe and MP35N (Ni, Co, Cr, and Mo alloy) Khasanov . The exact pressure inside the cell was determined from the superconducting transition temperature of a small piece of indium, which was also mounted on the same sample mount space In_Tc . A muon beam with momentum of 99.25 MeV/ was irradiated to penetrate the thick wall of the pressure-cell and to maximize the number of muons stopped in the sample space. The pressure-cell was loaded onto a cryostat under He gas flow to monitor the time-dependent SR spectra [positron decay asymmetry ] under a zero (ZF) or transverse (TF, 5 mT) external field in the 5–140 K temperature range.
III Results
In the high-pressure setup, the SR spectra consist of two signal components, one corresponding to muons stopped in the sample and the other from the pressure-cell. In ZF, these are described by
| (1) | |||||
where and represent the time evolution of the muon spin polarization in the sample and in the pressure-cell, respectively, with their respective partial asymmetry being and (). is known to be described by the static Kubo-Toyabe relaxation function multiplied by an exponential damping of rate to empirically account for the depolarization in the cell, with the term representing the linewidth caused by nuclear magnetic moments Khasanov .
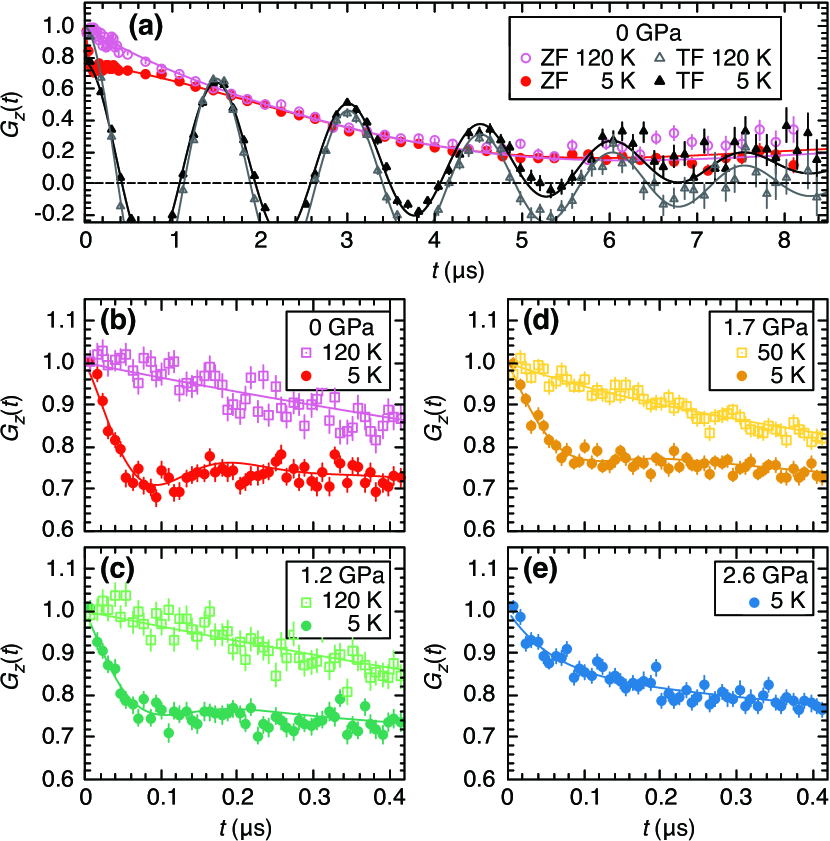
Figure 2(a) shows typical examples of ZF- and TF-SR spectra under ambient pressure. The ZF spectrum at 5 K () is dominated by a slow Gaussian-like depolarization for s, indicating that the lineshape at later times is predominantly determined by for muons stopped in the non-magnetic pressure cell. Meanwhile, the slow exponential-like depolarization at 120 K () represents the behavior of overlapped with , which originates from residual iron impurities known to exist in the present specimen Iimura_private . Considering that the situation resembles the canonical dilute spin glass (e.g., Fe) Uemura:85 , we attribute this behavior to a spin glass-like impurity phase that coexists with the AF phase below .
It is clear in magnified Figs. 2(b)–(e) that the spectra at 5 K exhibits fast damping precession under ambient pressure, and that the precession becomes obscure with increasing pressure, suggesting the decrease of internal field (and/or the fractional yield) of the AF phase probed by muon because of progressive suppression of magnetic correlation. Considering these observations, the spectra were analyzed by -square-minimization curve fitting using Eq. (1) and the following expression for :
Here, represents the component exhibiting the relatively well-defined AF order with the volume fraction , and accounts for the remaining non-magnetic () fraction dominated by spin glass-like behavior. Assuming quasi-static magnetism, and are approximated by
| (2) | ||||
| (3) |
where the first term represents the fraction of muons subject to the component of the quasi-static local field parallel to the initial muon spin direction and is 1/3 for powder samples, and the second term represents that for . In , the muon spin exhibits precession with a frequency (with MHz/T being the muon gyro magnetic ratio) for non-zero . We adopted the Lorentzian Kubo-Toyabe function for to describe the spin glass-like behavior Uemura:85 , where was for the relevant temperature range. In the quasi-static magnetic phase, the local field probed by muons is mainly determined by a vector sum of the magnetic dipolar field of the Fe atoms,
| (4) |
where is the magnetic moment of the -th Fe located at distance from the muon site, and
is the dipolar tensor. Although is a scalar quantity, it provides a strong criterion to verify the consistency among muon site(s), magnetic structure, and the Fe-moment magnitude inferred from other experimental techniques (see below). In the following curve-fit analysis, the fraction of muons stopped in the sample, , and the total asymmetry at the four applied pressures are fitted simultaneously in order to impose a common value for all temperatures, yielding –0.52 and . For the signal coming from the pressure-cell, was fixed to the value obtained by interpolation at each temperature, and was fixed to since it is known to be almost unchanged down to 1 K Khasanov that is far below the lowest temperature attained in our study.
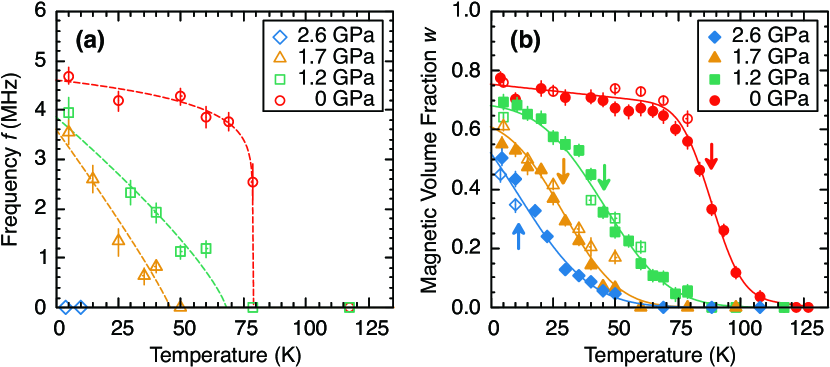
The temperature dependence of the frequency under four different pressures is shown in Fig. 3(a). We note that was fixed to 0 in analyzing the spectrum under 2.6 GPa because no clear precession signal was discernible [see Fig. 2(e)]. The decrease of at the lowest-temperature with increasing applied pressure indicates that is reduced accordingly. Assuming that the magnetic structure is unchanged, this suggests that the magnitude of the Fe moments [which is proportional to , see Eq. (4)] decreases for increasing pressure (For the discussion on the possible broadening of induced by pressure, see Sect. IV.2).
The fact that a long-lived precession with a frequency proportional to the external field is observed above for the entire asymmetry of TF-SR spectra [including that corresponding to , see Fig. 2(a)] indicates that the mean field in the spin glass-like phase is much weaker than , while those in the magnetic phase are depolarized rapidly because of the distribution of originated from the magnetic order,
The upward shift of the 5 K spectrum seen in Fig. 2(a) derives from the first term in Eq. (2), which reflects the muons subject to the total local field parallel to . The SR spectra under a TF of 5 mT were analyzed using Eq. (1) by replacing and respectively with
where is the relaxation rate in TF-SR measurements caused by the nuclear magnetic moments in the pressure-cell and is the initial phase of the precession. and were also fixed to the values reported in Ref. Khasanov , as described above. The temperature dependence of under different pressures is shown in Fig. 3(b), where the onset temperature decreases with increasing pressure. At the lowest temperature, decreases upon increasing pressure, indicating that the volume fraction of the AF2 phase decreases. These results were used to determine the mean value and uncertainty of (see below).
IV Discussion
IV.1 Muon Site
In evaluating the magnetism of the AF2 phase based on the SR results, it is important to have a good estimate of the muon site. Since muons behave as a pseudo-hydrogen in matter, the variation in total energy upon inclusion of H estimated by density functional theory (DFT) calculations serves as a guide to narrow down the candidate muon sites. The most probable site is inferred from the consistency of the calculated using Eq. (4) for the candidate sites with that measured. We calculated the total energy for interstitial H in the orthorhombic phase using the OpenMX code, which is based on the generalized gradient approximation to DFT (DFT-GGA) and the norm-conserving pseudopotential method openmx . We used a cutoff energy of 150 Ry and a mesh at the -point with the experimentally obtained lattice constant Hiraishi .
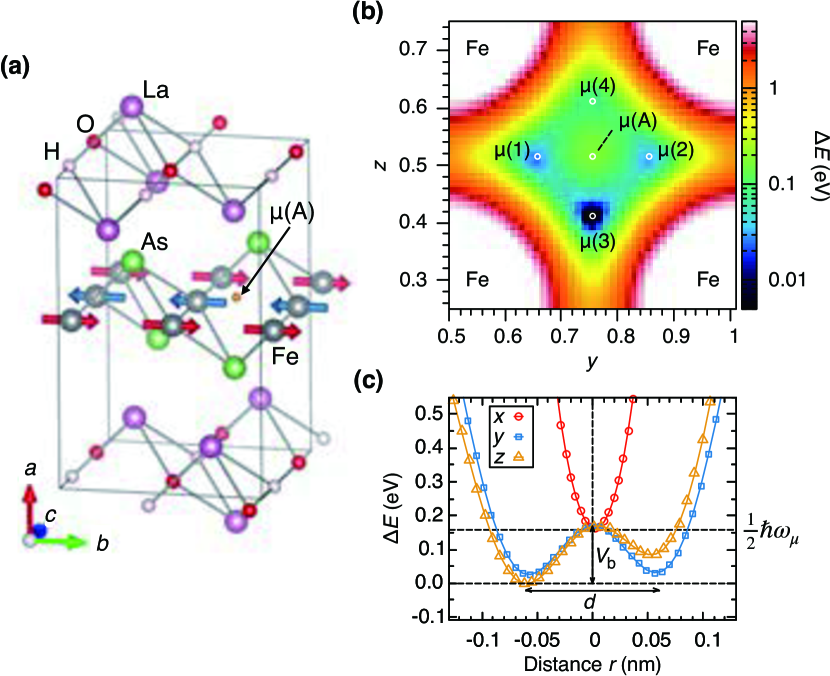
Figure 4(b) shows the variation of the total energy against the H position , where is the global minimum of . As marked by –(4), four minima of are revealed around the central position , which corresponds to the saddle point. The slightly different values of at the minima may be attributed to the off-center deformation of the FeAs4 tetrahedron in the structure. The distance from is 0.056 nm, 0.059 nm, and 0.053 nm for , , and , respectively. Figure 4(c) represents the profiles along the -, -, and -axis passing through the site. rapidly increases along the -axis ( to the FeAs plane) when increasing the distance from , indicating that muons may be confined within the -plane. However, along the - and -axis, exhibits an asymmetric double-well potential structure with maximum potential barrier meV located between and at a distance nm. In the harmonic approximation of the sinusoidal potential curve, the energy level splitting for the bound state muon is derived from the relation , where MeV/ is the muon mass. The corresponding zero-point energy in this approximation is estimated to be 156.5 meV, comparable to . This suggests that the muon is virtually located at the site for a time longer than , constituting a typical example of the isotope effect between muon and hydrogen.
The muon site was identified by comparing the obtained from the ZF-SR measurements in the magnetically ordered phase with that calculated using Eq. (4) for the candidate sites, summing the Fe moments located within 10 nm from the muon site. The values calculated at each muon site for and the –(4) minima, using the reported crystal and magnetic structure for Qureshi and Hiraishi , are summarized in Table. 1. For , although agrees with the value obtained experimentally at , it is larger than by a factor of 1.51.8 at the –(4) sites. Similarly, for , at –(4) is much larger than , by a factor of 10. Simulated value at for represents the range of within pm from position, where corresponds to the resultant mesh size for real-space in our DFT calculation. Although changes steeply from 0 to 49.7 mT even for such a small mesh size (see Fig. 5(b)), its simple average within pm yields 38 mT in close agreement with the experimental value. These results indicate that the muon occupies for and 0.51 because of its small mass, unlike hydrogen for Yamaura2019 .
| Muon site | Magnetic field (mT) | |
|---|---|---|
| ( Qureshi ) | ( Hiraishi ) | |
| 144.3 | 0–49.7 | |
| (1), (2) | 259.2 | 467.0 |
| (3) | 306.6 | 371.9 |
| (4) | 306.6 | 319.9 |
| Experiment | 173.2 Luetkens2009 ; MaeterPRB2009 | 37.70.5 Hiraishi |
IV.2 Magnitude and Distribution of below
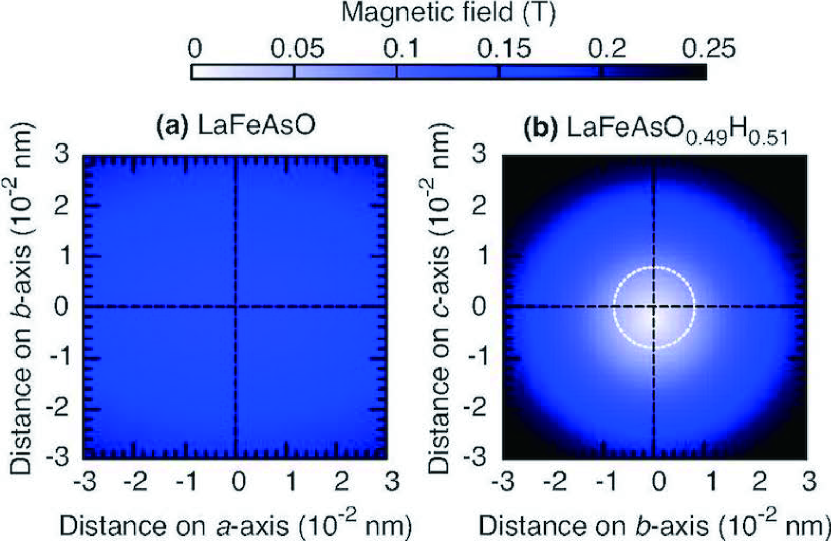
Figure 5(a) and (b) represent the simulated internal magnetic field distribution around muon site in the plane parallel to the FeAs layer for and , respectively. Although the profile of the field around muon site (at the center of the graph) is nearly independent of position for , a steep profile is revealed for . This indicates that a tiny displacement of the muon site does not affect the field profile probed by muons for , whereas a strong dependence is expected for . This is especially important when considering that a muon site displacement is more probable for than for because the substituted hydrogen randomly occupies the oxygen site. Thus, for , muons may probe the broad field profile, causing the fast depolarization spectrum below seen in Fig. 2(b). The underestimated value of at for may be attributed to this broad profile.
We examined the influence of pressure to the local field by calculating for the lattice constants reduced by external pressure reported in Ref. Kobayashi . According to the recent NMR experiment, the AF2 phase is stable below 2 GPa because of a large gap Takeuchi_PRB2019 , suggesting that the magnetic structure is unchanged. Under the further assumption that the muon site is also intact with pressure, at 2 GPa increases by 2 %, as expected from the definition of provided by Eq. (4). This trend is opposite to the experimental results, as shown in Fig. 3(a), necessitating other causes for the observed decrease of with increasing pressure. In this regard, it is interesting to note that a reduction of the Fe-moment magnitude under pressure is predicted by theoretical studies of LaFeAsO Opahle ; Labegue ; Yang , which is understood as a result of increased energy band width. Our estimation indicates that the reduction of the Fe moment by 25 % is sufficient to account for the experimental result around 2 GPa.
We also draw the attention to that the SR spectrum for at the lowest temperature and under ambient pressure is dominated by one precession term with fast depolarization. This is in sharp contrast to the case, where the spectrum at the lowest temperature is well reproduced by the sum of higher (lower) frequency term of 23 MHz (3 MHz) with the fractional ratio of 7:3 Luetkens2009 ; MaeterPRB2009 ; Klauss2008 ; Renzi . This indicates the presence of two magnetically inequivalent muon sites. The second lowest energy site, for , is assumed to be in the La-O/H layer with distance nm from the nearest oxygen. This suggests the formation of a local state bound to oxygen, as that empirically established in many oxides (typical nm).
We calculated the local field at the site, finding mT. The smaller is ascribed to the greater for the site from Fe moments [see Eq. (4)], where the distance from the nearest Fe atom to the (A) and (B) sites are 0.20 nm and 0.37 nm, respectively. Although the corresponding signal at MHz has a magnitude that can be detected by conventional SR measurements, in our experimental conditions (0.5) the low fractional ratio (0.3–0.4) for the site MaeterPRB2009 ; Klauss2008 ; Renzi and a signal-to-noise ratio of 1 impede separating this component from the slowly depolarizing ones, i.e., and/or in Eq. (1). This may result in underestimating in Fig. 3(b). Actually, the nonmagnetic volume fraction deduced under ambient pressure at , could correspond to the fraction of muons stopped at (B). Supporting this, we note that its value is comparable with the expected value of in the present setup, ––0.18 with . We also refer to the possibility that exhibits broader distribution under pressure, which will result in the absence of any detectable oscillation for the spectrum stems from the (B) site.
IV.3 Magnetism vs Lattice Structure
The solid curves of Fig. 3(b) are the best fits using an equation
in which a Gaussian distribution of width is assumed around the average transition temperature (a linear term was added only for ambient pressure data to account for the gradual increase with decreasing temperature) Sanna2009 . The obtained and that for Renzi are shown in Fig. 6 as a function of pressure, along with the structural transition temperature determined for the same sample in Ref. Kobayashi . The width is represented as error bars for , although itself is well determined within an error of 1 K, except for the highest pressure. The large error bars resulting for GPa)6 K may originate from the strong temperature-dependent behavior of in the lowest temperature region seen in Fig. 3(b).
It is remarkable that the structural transition to the orthorhombic phase for decreasing temperature is suppressed near 1.5 GPa (, whereas the AF2 phase survives even under 2.6 GPa. This is in sharp contrast with the AF1 phase, in which is always below , indicating that the magnetic order of the AF2 is induced by a purely electronic mechanism. According to a theoretical study based on molecular orbitals Iimura2 , the electronic state of the AF2 phase is understood through an orbital-selective Mott transition, where Fe- becomes half-filled when increasing . This situation is similar to that of the orbital in pristine cuprate compounds, implying that the AF order of the AF2 phase is induced by electronic correlation. The fact that is independent of in the AF2 phase supports above expectation. The pressure dependence of is also understood within this scenario (see below).
Here, it may be worth mentioning that the appearance of the AF order that precedes structural transition with reducing temperature bears a remarkable similarity with the so called electronic nematicity revealed in the BaFe2As2 (122) family compounds, where the isovalent substitution of As with P induces a unidirectional self-organized state that breaks the rotational symmetry of the underlying lattice above Nematic_2012 . In addition, the coexistence of AF2 phase and SC2 phase observed over a finite doping range of Hiraishi comprises yet another parallelism with the 122 family Ba122 , hinting for the importance of electronic correlation in the latter compounds.
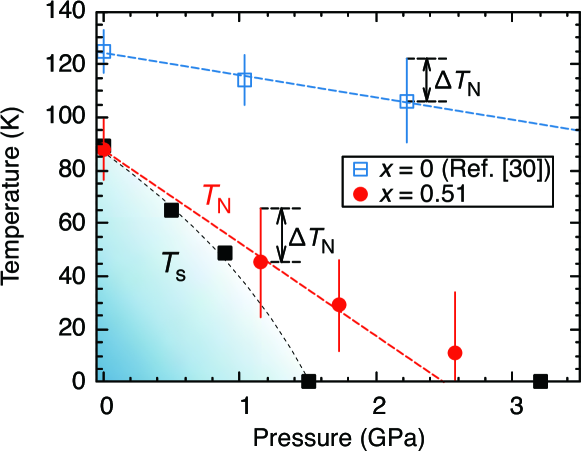
The sensitivity of magnetism to pressure in the AF2 phase is quantitatively described by the gradient KGPa-1, which is much greater than the KGPa-1 of the AF1 phase () Renzi , indicating that the AF2 phase is more susceptible to pressure than AF1. This contrast may originate from the different mechanism of magnetic order. In the AF1 phase, the AF order is induced by nesting of the Fermi surface, as is concluded by a theoretical study on LaFeAsO (, AF1 phase) reporting that the nesting condition is almost unchanged between 0.1419 nm3 and 0.120 nm3 (corresponding to GPa and 10 GPa), indicating the robustness of the AF1 phase against pressure Opahle . On the other hand, monotonic degradation of the nesting with doping due to the expansion of the electron Fermi surface at the point SuzukiPRL2014 disfavors the similar scenario for the AF2 phase.
It is reported that the energy gap between bonding and antibonding orbitals upon Fe 3-As 4 hybridization in the low -region decreases when the height of the As ion from Fe plane increases. As increases (which is equivalent to an increase in ), the non-bonding Fe-3 orbital becomes half-filled, resulting in the orbital-selective Mott state. Because external pressure induces a considerable decrease of in LaFeAsO1-xHx Kobayashi , the fragility of the AF2 phase against pressure is readily understood within the scenario of orbital-selective Mott transition Iimura2 . In fact, for and at ambient pressure, nm, decreasing to 0.1375 nm under 2.2 GPa. This value is comparable to that for , where the AF2 phase is nearly suppressed Hiraishi ; Kobayashi .
Finally, we note that the strong pressure dependence of combined with spatial inhomogeneity of pressure in the sample space originating from a partial non-hydrostaticity may also contribute to the non-magnetic phase () below , the confirmation of which remains as a future task using more refined SR sample environment for high pressure.
V Summary and Conclusion
To summarize, our SR study of LaFeAsO1-xHx with under external pressure revealed that the AF2 phase survives under a pressure as high as 2.6 GPa, far beyond the pressure where the structural transition to the orthorhombic phase is suppressed. The AF2 phase for is more susceptible to pressure than the AF1 phase for , suggesting a different magnetic ordering mechanism. Considering theoretical works, the AF1 phase is robust against external pressure because the nesting of the Fermi surface that induces it is nearly independent of pressure. In contrast, the AF2 phase is understood through the orbital-selective Mott state, in which the height parameter plays an essential role. Because decreases when applying external pressure, the AF2 phase is sensitive to the latter.
Acknowledgment
This work was supported by the MEXT Elements Strategy Initiative to Form Core Research Centers (Grant Number JPMXP0112101001). The SR measurements were carried out at the Paul Scherrer Institute (PSI), Switzerland, under user program (Proposal No. 20152061). We would like to thank the staff of the PSI for their technical support during experiments.
References
- (1) Y. Kamihara, T. Watanabe, M. Hirano, and H. Hosono, J. Am. Chem. Soc. 130, 3296 (2008).
- (2) Z.-A. Ren, W. Lu, J. Yang, W. Yi, X.-L. Shen, Z.-C. Li, G.-C. Che, X.-L. Dong, L.-L. Sun, F. Zhou, and Z.-X. Zhao, Chin. Phys. Lett. 25, 2215 (2008).
- (3) C. Wang, L. Li, S. Chi, Z. Zhu, Z. Ren, Y. Li, Y. Wang, X. Lin, Y. Luo, S. Jiang, X. Xu, G. Cao, and Z. Xu, Europhys. Lett. 83, 67006 (2008).
- (4) H. Hosono, and K. Kuroki, Physica C 514, 399 (2015).
- (5) M. D. Lumsden, and A. D. Christianson, J. Phys,: Condens. Matter 22, 203203 (2010).
- (6) See, for example, B. Keimer, S. A. Kivelson, M. R. Norman, S. Uchida, and J. Zaanen, Nature 518, 179 (2015).
- (7) T. Hanna, Y. Muraba, S. Matsuishi, N. Igawa, K. Kodama, S.-I. Shamoto, and H. Hosono, Phys. Rev. B 84, 024521 (2011).
- (8) S. Matsuishi, T. Hanna, Y. Muraba, S. W. Kim, J. E. Kim, M. Takata, S.-I. Shamoto, R. I. Smith, and H. Hosono, Phys. Rev. B 85, 014514 (2012).
- (9) S. Iimura, S. Matsuishi, H. Sato, T. Hanna, Y. Muraba, S. W. Kim, J. E. Kim, M. Takata, and H. Hosono, Nat. Commun. 3, 943 (2012).
- (10) S. Iimura, and H. Hosono, J. Phys. Soc. Jpn. 89, 051006 (2020).
- (11) N. Fujiwara, S. Tsutsumi, S. Iimura, S. Matsuishi, H. Hosono, Y. Yamakawa, and H. Kontani, Phys. Rev. Lett. 111, 097002 (2013).
- (12) M. Hiraishi, S. Iimura, K. M. Kojima, J. Yamaura, H. Hiraka, K. Ikeda, P. Miao, Y. Ishikawa, S. Torii, M. Miyazaki, I. Yamauchi, A. Koda, K. Ishii, M. Yoshida, J. Mizuki, R. Kadono, R. Kumai, T. Kamiyama, T. Otomo, Y. Murakami, S. Matuishi, and H. Hosono, Nat. Phys. 10, 300 (2014).
- (13) R. Sakurai, N. Fujiwara, N. Kawaguchi, Y. Yamakawa, H. Kontani, S. Iimura, S. Matsuishi, and H. Hosono, Phys. Rev. B 91, 064509 (2015).
- (14) H. Takahashi, H. Soeda, M. Nukii, C. Kawashima, T. Nakanishi, S. Iimura,Y. Muraba, S. Matsuishi, H. Hosono, Sci. Rep. 5, 7829 (2015).
- (15) K. Kobayashi, J. Yamaura, S. Iimura, S. Maki, H. Sagayama, R. Kumai, Y. Murakami, H. Takahashi, S. Matsuishi, and H. Hosono, Sci. Rep. 6, 39646 (2016).
- (16) R. Khasanov, Z. Guguchia, A. Maisuradze, D. Andreica, M. Elender, A. Raselli, Z. Shermadini, T. Goko, F. Knecht, E. Morenzoni, and A. Amato, High Pressure Research 36, 140 (2016).
- (17) A. Eiling, and J. S. Schilling, J Phys F: Met Phys. 11, 623 (1981).
- (18) S. Iimura, (private communication).
- (19) Y. J. Uemura, T. Yamazaki, D. R. Harshman, M. Senba, and E. J. Ansaldo, Phys. Rev. B 31, 546 (1985).
- (20) T. Ozaki, Phys. Rev. B 67, 155108 (2003).; http://www.openmx-square.org
- (21) N. Qureshi, Y. Drees, J. Werner, S. Wurmehl, C. Hess, R. Klingeler, B. Bchner, M. T. Fernández-Díaz, and M. Braden, Phys. Rev. B 82, 184521 (2010).
- (22) J. Yamaura, H. Hiraka, S. Iimura, Y. Muraba, J. Bang, K. Ikeuchi, M. Nakamura, Y. Inamura, T. Honda, M. Hiraishi, K. M. Kojima, R. Kadono, Y. Kuramoto, Y. Murakami, S. Matsuishi, and H. Hosono, Phys. Rev. B 99, 220505(R) (2019).
- (23) Masayoshi Takeuchi, Naoki Fujiwara, Takanori Kuwayama, Satoshi Nakagawa, Soshi Iimura, Satoru Matsuishi, Youichi Yamakawa, Hiroshi Kontani,and Hideo Hosono, Phys. Rev. B 99, 174517 (2019).
- (24) I. Opahle, H. C. Kandpal, Y. Zhang, C. Gros, and R. Valentí, Phys. Rev. B 79, 024509 (2009).
- (25) S. Lebgue, Z. P. Yin, and W. E. Pickett, New J. of Phys. 11, 025004 (2009).
- (26) Y. Yang, and X. Hu, J. Appl. Phys. 106, 073910 (2009).
- (27) H.-H. Klauss, H. Luetkens, R. Klingeler, C. Hess, F. J. Litterst, M. Kraken, M. M. Korshunov, I. Eremin, S.-L. Drechsler, R. Khasanov, A. Amato, J. Hamann-Borrero, N. Leps, A. Kondrat, G. Behr, J. Werner, and B. Bchner, Phys. Rev. Lett. 101, 077005 (2008).
- (28) H. Maeter, H. Luetkens, Y. G. Pashkevich, A. Kwadrin, R. Khasanov, A. Amato, A. A. Gusev, K. V. Lamonova, D. A. Chervinskii, R. Klingeler, C. Hess, G. Behr, B. Bchner, and H.-H. Klauss, Phys. Rev. B 80, 094524 (2009).
- (29) H. Luetkens, H.-H. Klauss, M. Kraken, F. J. Litterst, T. Dellmann, R. Klingeler, C. Hess, R. Khasanov, A. Amato, C. Baines, M. Kosmala, O. J. Schumann, M. Braden, J. Hamann-Borrero, N. Leps, A. Kondrat, G. Behr, J. Werner, and B. Bchner, Nat. Mater. 8, 305 (2009).
- (30) R. De Renzi, P. Bonfá, M. Mazzani, S. Sanna, G. Prando, P. Carretta, R. Khasanov, A. Amato, H. Luetkens, M. Bendele, F. Bernardini, S. Massidda, A. Palenzona, M. Tropeano, and M. Vignolo Super. Sci. Technol. 25, 084009 (2012).
- (31) S. Sanna, R. De Renzi, G. Lamura, C. Ferdeghini, A. Palenzona, M. Putti, M. Tropeano, and T. Shiroka, Phys. Rev. B 80, 052503 (2009).
- (32) S. Iimura, S. Matsuishi, and H. Hosono, Phys. Rev. B 94, 024512 (2016).
- (33) S. Kasahara, H. J. Shi, K. Hashimoto, S. Tonegawa, Y. Mizukami, T. Shibauchi, K. Sugimoto, T. Fukuda, T. Terashima, Andriy H. Nevidomskyy, and Y. Matsuda, Nature 486, 382 (2012).
- (34) H. Chen, Y. Ren, Y. Qiu, Wei Bao, R. H. Liu, G. Wu, T. Wu, Y. L. Xie, X. F. Wang, and Q. Huang, Euro. Phys. Lett 85, 17006 (2009).
- (35) K. Suzuki, H. Usui, S. Iimura, Y. Sato, S. Matsuishi, H. Hosono, and K. Kuroki, Phys. Rev. Lett. 113, 027002 (2014).