Spectropolarimetric properties of Swift J1818.01607: a 1.4 s radio magnetar
Abstract
The soft-gamma repeater Swift J1818.01607 is only the fifth magnetar found to exhibit pulsed radio emission. Using the Ultra-Wideband Low receiver system of the Parkes radio telescope, we conducted a 3 h observation of Swift J1818.01607. Folding the data at a rotation period of s, we obtained wideband polarization profiles and flux density measurements covering radio frequencies between 704-4032 MHz. After measuring, and then correcting for the pulsar’s rotation measure of rad m-2, we find the radio profile is between 80-100 per cent linearly polarized across the wide observing band, with a small amount of depolarization at low frequencies that we ascribe to scatter broadening. We also measure a steep spectral index of across our large frequency range, a significant deviation from the flat or inverted spectra often associated with radio-loud magnetars. The steep spectrum and temporal rise in flux density bears some resemblance to the behaviour of the magnetar-like, rotation-powered pulsar PSR J11196127. This leads us to speculate that Swift J1818.01607 may represent an additional link between rotation-powered pulsars and magnetars.
1 Introduction
Magnetars are a rare class of relatively slow rotating neutron star that are inferred to possess some of the strongest magnetic fields in the Universe. Until recently, only 4 of the 23 confirmed magnetars 111http://www.physics.mcgill.ca/~pulsar/magnetar/main.html (Olausen & Kaspi, 2014) were seen to exhibit pulsed radio emission (Camilo et al., 2006, 2007a; Levin et al., 2010; Eatough et al., 2013; Shannon & Johnston, 2013). Unlike standard rotation-powered pulsars, the radio pulses seen from these magnetars have generally flat spectra and display highly variable flux densities over timescales ranging between seconds to months (Camilo et al., 2007b; Lazaridis et al., 2008). Their single pulses are often comprised of many burst-like sub-pulses that display a remarkable range of temporal phenomenology. These sub-pulses have drawn comparisons to similar ‘spiky’ emission seen in high magnetic field strength pulsars (Weltevrede et al., 2011), rotating radio transients (RRATs; McLaughlin et al., 2006), and fast radio bursts (FRBs; Pearlman et al., 2018). Observations covering wide radio frequency bands may shed light on their magnetospheric conditions following outbursts, in particular whether the same processes that produce coherent, highly polarized emission in rotation-powered pulsars is also responsible for pulsed radio emission from magnetars.
Recently a fifth radio-bright magnetar was identified. Swift J1818.01607 was discovered by the Swift space observatory following the detection of a gamma-ray outburst by the Burst Alert Telescope on MJD 58920 (2020-03-12-21:16:47 UT). The burst was quickly localized to an X-ray point source by the on-board X-ray telescope (Evans et al., 2020). Observations by the Neutron star Interior Composition Explorer found the source exhibited pulsed X-ray emission with a periodicity of s (Enoto et al., 2020). Two days after the initial outburst, highly linearly polarized radio pulsations were detected with a dispersion measure (DM) of pc cm-3 during follow-up observations by the 100-m Effelsberg radio telescope observing in a band centered on 1.37 GHz (Karuppusamy et al., 2020). Continued timing provided an initial measurement of the spin-period derivative, (Esposito et al., 2020), firmly cementing its status as the fastest rotating, and possibly the youngest magnetar found to date. Observations performed at multiple radio wavelengths indicated the magnetar’s radio emission has a steep spectral index (Gajjar et al., 2020; Lower & Shannon, 2020). This is similar to the observed radio spectra of many ordinary, rotation-powered radio pulsars, but significantly differs from the flat or inverted spectra of the four other radio loud magnetars. The apparently low surface temperature (Esposito et al., 2020) and lack of coincident supernova remnant, indicate Swift J1818.01607 may be significantly older than implied by its characteristic age of yrs, and may represent a transitional link between magnetars and the population of high B-field, rotation-powered pulsars. In particular, the reported spectral flattening by Majid et al. (2020) may indicate a possible link to the 2016 magnetar-like outburst of PSR J11196127 (Majid et al., 2017).
In this letter we report on observations of Swift J1818.01607 using the Ultra-wideband Low (UWL) receiver system (Hobbs et al., 2020) of the CSIRO 64-m Parkes radio telescope. Using Bayesian inference techniques, we measured the broadband properties of the time averaged polarization spectrum and analyzed the sample of bright single pulses observed throughout the approximately hour-long observation. We then compare these results to previous observations of the four other radio loud magnetars and the general pulsar population. Finally, we discuss the potential evolutionary pathways of Swift J1818.01607.
2 Observation and analysis
We conducted a 10473 s observation of Swift J1818.01607 on MJD 58939 using the Parkes UWL receiver (Hobbs et al., 2020) under the target of opportunity request PX057 (PI: Lower). Pulsar search-mode data with 128 s sampling covering the full UWL band from 704-4032 MHz with full Stokes information were recorded using the medusa backend and coherently dedispersed on a channel by channel basis at a DM of pc cm-3 to minimize dispersive smearing of the pulse profile. Note the profiles shown in Figures 1 and 3 have been dedispersed using the inferred DM of pc cm-3 from Section 2.3. The data were then folded at the pulse period of the magnetar using DSPSR (van Straten & Bailes, 2011) and saved to a psrfits (Hotan et al., 2004) format archive with 1024 phase bins, and 3328 frequency channels with 1 MHz frequency resolution. Approximately 35 per cent of the 3328 frequency channels were heavily contaminated by radio frequency interference (RFI), and were subsequently excised using the standard paz and pazi tools in PSRCHIVE (Hotan et al., 2004; van Straten et al., 2012). The data were flux and polarization calibrated in the same manner as Dai et al. (2019), with the exception that we used the radio galaxy PKS B0407658 as a flux density reference instead of 3C 218. Unlike 3C 218, PKS B0407658 is not resolved by Parkes above GHz, making it a more reliable calibrator for the UWL. We used an observation of a linearly polarized noise diode prior to observing the magnetar, in addition to on- and off-source observations of PKS B0407658 taken on MJD 58638 to measure the noise diode brightness and to correct the phase and absolute gain of the system. We note that any leakage terms were not corrected for, which may be of order 5 per cent toward the top of the band.
2.1 Profile phenomenology and flux density
| Frequency | ||||
|---|---|---|---|---|
| (MHz) | (ms) | (mJy) | ||
| 3879 | 0.73 | 0.19 | ||
| 3656 | 0.94 | 0.18 | ||
| 3386 | 0.86 | 0.18 | ||
| 3137 | 0.88 | 0.20 | ||
| 2880 | 0.88 | 0.18 | ||
| 2612 | 0.92 | 0.16 | ||
| 2304 | 0.73 | 0.12 | ||
| 2106 | 0.92 | 0.11 | ||
| 1858 | 0.97 | 0.12 | ||
| 1598 | 0.93 | 0.11 | ||
| 1356 | 0.93 | 0.10 | ||
| 1070 | 0.83 | 0.16 | ||
| 809 | 0.52 | 0.18 |
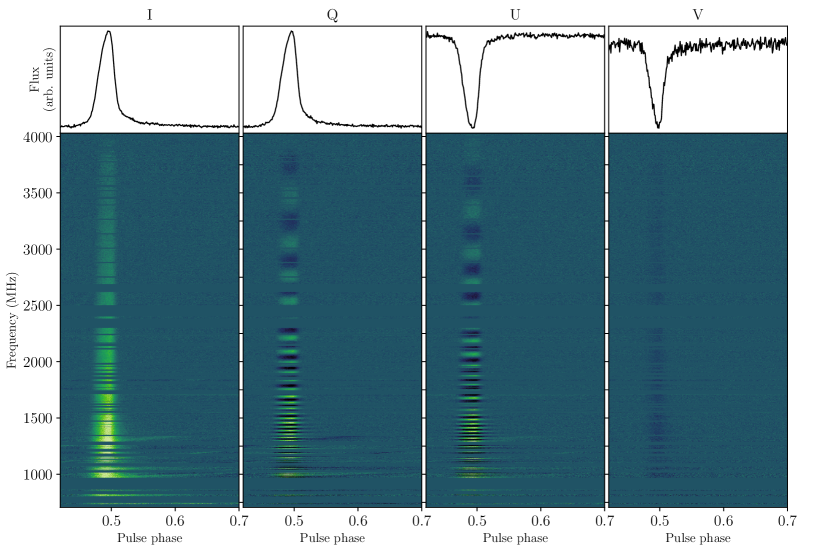
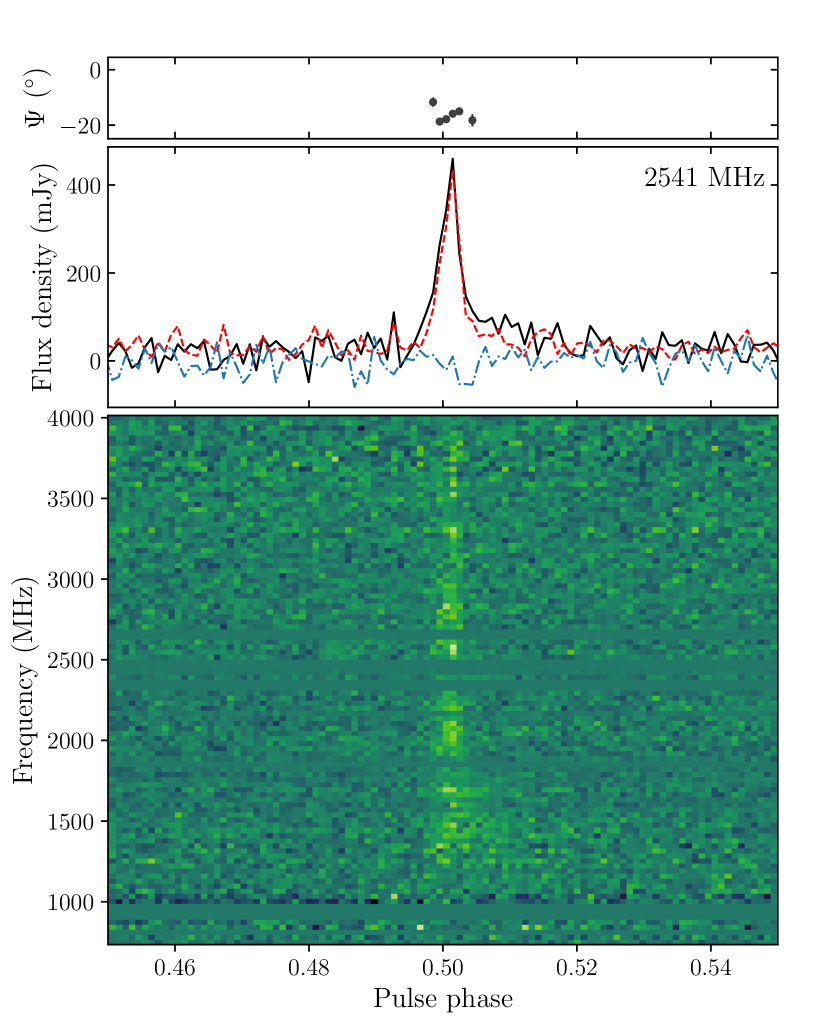
Dynamic spectra showing the four Stokes parameters across the continuous 704-4032 MHz UWL band are displayed in Figure 1. The pulse profile shows clear evidence of a steep negative gradient in flux density, and can be described as the superposition of two Gaussian components ( and hereafter). The narrower component appears brighter toward the lower end of the UWL band, indicating it has a steeper spectral index than .
We further analyzed the profile by dividing the data into 13 sub-bands, each having 256 MHz of bandwidth. These sub-bands were then averaged in frequency and polarization before being fit with a two-component Gaussian profile convolved with a one-sided exponential pulse broadening function
| (1) |
where and are the centroids and widths of the -th Gaussian component, indicates a convolution and is the scattering timescale. The resulting posterior probability distributions were sampled using the bilby software package (Ashton et al., 2019) as a front-end to the dynesty nested sampling algorithm (Speagle, 2020). Initially we fit the sub-bands assuming uniform priors on the widths of the profile components and . However, we found the component widths were highly covariant with the scattering timescale, to the point where we could only recover upper-limits for scattering in sub-bands above 2106 MHz. As the profile width does not appear to undergo significant evolution with frequency, aside from scatter broadening, we re-fit the sub-banded data assuming Gaussian priors of and for the widths of and respectively.
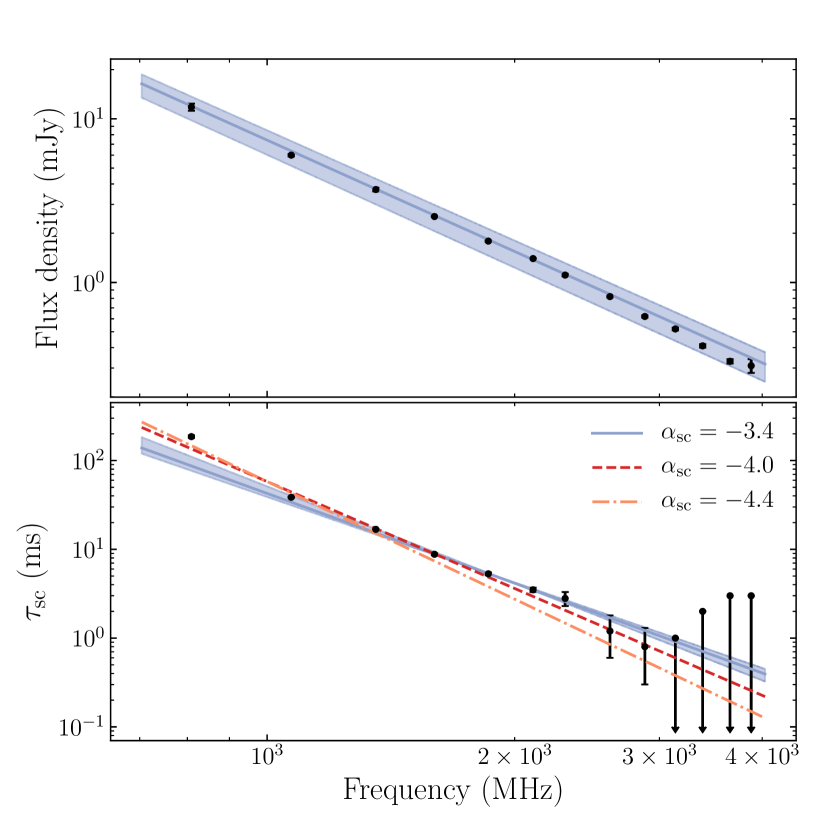
The resulting scattering timescale and period-averaged flux density – measured by averaging the best-fit template for each sub-band in pulse phase – are presented in Table 1. We measure a scattering timescale referenced to 1 GHz of ms, with a scattering index of . Similar but less well constrained values of and ms were obtained when we used uniform priors on the widths of and . In either case, the scattering timescale is consistent with the expected value of ms from the NE2001 galactic electron density model at 1 GHz (Cordes & Lazio, 2002). While the scattering index is smaller than the expected value of or expected from Kolmogorov turbulence, they are consistent with the scattering indices of many other pulsars (see for example Geyer et al., 2017). We also fit the period-averaged flux density spectrum using a simple power-law function, , obtaining a spectral index of . The fits to the spectral index and scattering timescale are plotted in Figure 2. The reduced for the scattering relation shown in Figure 2 is . We attribute the high value to overestimation of the scattering timescale in the RFI-affected 809 MHz band. Removing the 809 MHz data point confirms this suspicion, as refitting the scattering relation returns a consistent scattering index of and a reduced of .
2.2 Polarimetry
Figure 1 clearly shows the linear polarization has undergone significant Faraday rotation, as evidenced by the large number of changes in sign for Stokes Q and U. Following the Bayesian methodology presented in Bannister et al. (2019), we measured the phase averaged rotation measure (RM) of the magnetar by directly fitting Stokes Q and U as a function of frequency, obtaining a value of rad m-2 ( per cent confidence interval). Note, this measurement does not include corrections for the ionosphere which can often exceed our measurement uncertainty. At Parkes, the ionospheric contribution is typically between to rad m-2 (Han et al., 2018).
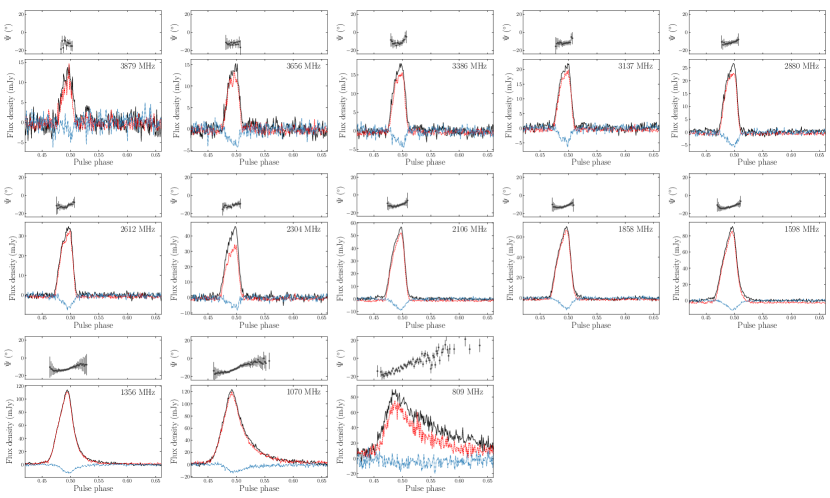
To better visualize the polarization profiles, we plot the averaged polarization pulse profiles at 13 frequencies in Figure 3, along with the linear polarization position angle for each sub-band. The pulse profile is almost than 90 per cent linearly polarized across most of the UWL band, although a small amount of circular polarization is also present. Apparent depolarization due to scatter broadening (Li & Han, 2003) is evident below 1356 MHz. Slight variations in the fractional linear and circular polarizations listed in Table 1 likely result from a combination of noise and polarization impurities in the receiver system. The apparent depolarization in the 2304 MHz band is an artefact of residual RFI from wireless communications contaminating the narrow strip of non-excised channels between 2380 and 2400 MHz. Additionally, the lack of polarisation in the ‘bump’ visible in the off-pulse noise of the 3879 MHz sub-band suggests this feature is likely to be residual impulsive RFI, not an additional profile component. There is a slight upward slope in the linear polarization position angle (PA), with little frequency dependent evolution except for scatter-induced smearing at lower frequencies.
2.3 Single pulses
To analyse the single pulses from the magnetar, we created single pulse archives from the original psrfits search-mode filterbank. We then performed a boxcar search for single pulses on copies of these archives where all frequency channels outside the 1300-2500 MHz band had been excised to minimize confusion with RFI. We limited this search to only the on-pulse region of each archive. Applying a maximum boxcar width of 85 ms and threshold S/N of 7, we find 5052 of the 7008 single pulse archives contained a single pulse candidate that met our criterion with a median S/N of 13.8. Upon visual inspection, we found the single pulses typically consist of 1-3 ‘spiky’ sub-pulses with similar phenomenology to single pulses seen from the four other radio loud magnetars. We did not observe any single pulses emitted at rotational phases outside the ‘on-pulse’ region represented by the integrated profiles in Figure 3, nor evidence of sporadic pulses from the additional profile component reported by Maan & van Leeuwen (2020). Occasional gaps or nulls in emission were seen throughout the observation. Similar behaviour has been reported in observations of the galactic centre magnetar SGR J17452900 (Yan et al., 2018). However, it is not clear whether the gaps we observed represent true nulls, where the radio emission mechanism completely shuts off, or if the radio pulses during these rotations were simply below the detection threshold of the receiver.
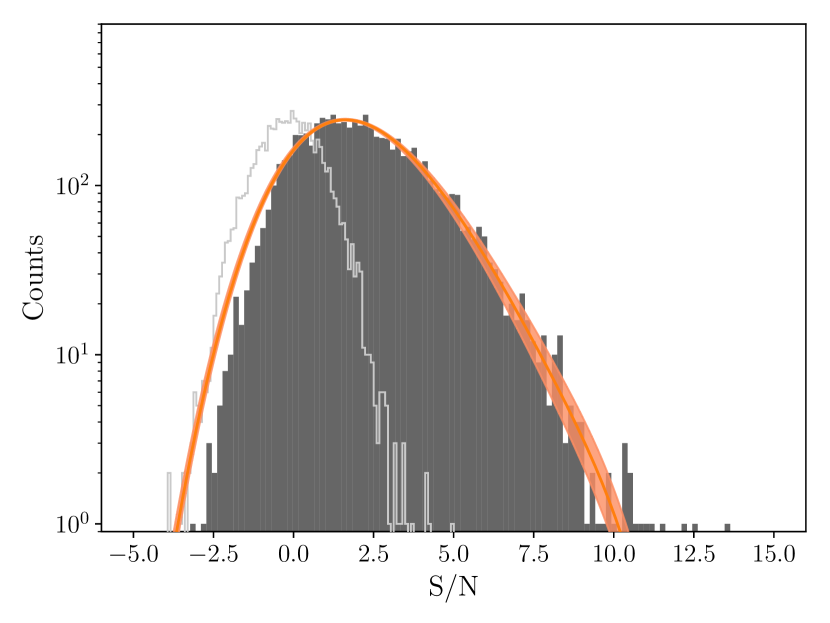
We measured the flux density of the on- and off-pulse regions of each single-pulse archive using the psrflux tool from PSRCHIVE by cross-correlating the data with a scatter-broadened Gaussian template. Both the on- and off-pulse flux density measurements were then converted to units of matched-filter S/N by scaling each measurement by a factor of 1.4 – the scale factor needed to scale the off-pulse distribution such that it has a mean of zero and variance of one. The resulting on- and off-pulse S/N distributions are shown in Figure 4. We note this definition of S/N is different to the one used in the earlier single pulse search, which was a top-hat S/N used to place quantitative constraints on the number of single pulses we detected. Negative S/N ratios can be attributed to the on-pulse flux being below zero due to fluctuations in the baseline. The on-pulse distribution is well described by a log-normal with a log-mean of and width of that has been convolved with a Gaussian distribution with zero mean and unit variance. This distribution width is typical of the rotation-powered pulsar population as a whole (Burke-Spolaor et al., 2012). While there are some outliers, the lack of a power-law tail in the distribution indicates no giant pulses were detected during our observation, contradictory to the claim by Esposito et al. (2020) that the single pulses are dominated by sporadic giant pulses. It is possible their giant pulse detections originated from the transient profile component seen in early observations by Maan & van Leeuwen (2020), which had disappeared sometime prior to our observation with Parkes.
The narrow widths of magnetar single pulses and sub-pulses enable high-accuracy DM measurements, particularly when observed across large bandwidths. For example, the bright single pulse shown in Figure 5 returned a structure-optimized DM of pc cm-3. Repeating this for the brightest 215 single pulses in our sample, we find the distribution of structure-optimised DMs is well described by a Gaussian with a mean of pc cm-3 and a standard deviation of pc cm-3. From this, we estimated the magnetar’s DM to be pc cm-3 where the uncertainty is derived from the standard deviation of the DM distribution pc cm-3. The variations in DM are more likely to have resulted from systematic errors in the structure-optimization algorithm combined with the variable number of sub-pulses in each pulse as opposed to short-timescale variations in the local environment of the magnetar. Long-term monitoring over year-long timescales will reveal if Swift J1818.01607 experiences DM variations similar to those seen in repeating FRBs (e.g. Hessels et al., 2019).
Using the NE2001 (Cordes & Lazio, 2002) and YMW16 (Yao et al., 2017) galactic free electron density models, the distance to the magnetar is estimated to be either kpc (NE2001) or kpc (YMW16), where the uncertainty is dominated by the model chosen.
From our measurements of both the RM and DM, we can estimate the average parallel magnetic field strength along the line of sight to the magnetar using the equation , where is in units of G, and the RM and DM are in their usual units (rad m-2 and pc cm-3). Our measured value of 2.5 G is fairly typical of line-of-sight measurements from pulsars within the galactic plane (Han et al., 2018)
3 Discussion
In general, the pulsed radio emission from Swift J1818.01607 shares a lot of the same phenomenology seen in other radio loud magnetars: a high degree of linear polarization, burst-like sub-pulses and extremely variable pulse-to-pulse flux densities. However, the steep spectral index we measure is more consistent with the spectral indices of many rotation powered pulsars when compared to the flat spectral indices of the four other radio magnetars which typically range between to (Lazaridis et al., 2008; Torne et al., 2015; Dai et al., 2019), making this new magnetar a significant outlier. Given the DM and location of the magnetar, the effects of diffractive interstellar scintillation are negligible at the UWL observing band. For instance, the NE2001 model predicts a scintillation bandwidth of only Hz at 1 GHz. Hence the steep spectrum is intrinsic to Swift J1818.01607. This indicates that it was premature to assume that all radio magnetars have flat spectra. At the large DMs typical of magnetars, those that have steep radio spectra might be so scatter-broadened as to induce a significant selection effect towards those with flatter spectra. When compared to the 276 pulsars in Jankowski et al. (2018) that have spectra best fit by a simple power-law, only per cent of pulsars have steeper spectra than Swift J1818.01607, while the four other radio magnetars all have spectral indices that are flatter than per cent of their sample. Hence, Swift J1818.01607 may be an example of the diversity that could exist in the wider, as-of-yet undetected radio magnetar population. The spectral properties could also be related to the magnetar possessing a less evolved magnetic field structure due to its youth.
Assuming Swift J1818.01607 was born rapidly rotating ( ms) and its spin-down is dominated by magnetic dipole radiation (braking index = 3), measurements of its spin and spin-down place its characteristic age between only - yrs (Champion et al., 2020; Hu et al., 2020; Esposito et al., 2020), the second smallest of any pulsar after SGR J180620 (Mereghetti et al., 2005). However, given large amount of uncertainty surrounding neutron star rotation periods at birth and the diversity in measured pulsar (and magnetar) braking indices, its true age is likely to be significantly different than the inferred spin-down age. Indeed the period derivatives of magnetars can change by large factors within just a few years (see for example Scholz et al., 2017). A more accurate kinematic age could be inferred from associating the magnetar to a progenitor supernova remnant, combined with a proper-motion measurement from very-long baseline interferometry. However, we find there are no catalogued supernova remnants or pulsar-wind nebula co-located with its position (Green, 2019). The two closest supernova remnants (G014.30.1 and G014.10.1) are approximately arcmin and arcmin away from the position of the magnetar on sky (Galactic coordinates: ∘, ∘) respectively, making an association highly unlikely. The lack of an associated supernova remnant is not too surprising, as only eight of the twenty-three known magnetars have claimed associations. Additionally, the strong spin-down powered wind from new-born magnetars can accelerate the remnant expansion to the point that only anomalously diffuse shells, or no remnant at all, remains on century-long timescales (Duncan & Thompson, 1992). If the progenitor supernova remnant has not been dissipated, then deep radio and X-ray imaging may be able to detect it.
Alternatively, we speculate the steep spectrum and its unusually faint X-ray luminosity of ergs s-1 (Esposito et al., 2020)222As noted in Esposito et al. (2020), the quoted X-ray luminosity assumes the smaller, YMW16 DM distance to the magnetar, and that a larger source distance (as implied by the NE2001 model) may yield a more normal luminosity. may be evidence this new magnetar was initially born as a rotation powered pulsar that obtained the rotational properties of a magnetar over time, similar to what is predicted for PSR J17343333 (Espinoza et al., 2011). Such evolution can occur if the magnetic and spin axes underwent rapid alignment over time (Johnston & Karastergiou, 2017), or if the pulsar underwent an extended period of magnetic field growth after the surface magnetic field was initially buried due to fall-back accretion (e.g. Ho, 2015).
If the properties of Swift J1818.01607 are the result of rapid magnetic and spin axes alignment, we would expect the PA to be consistent with that of an aligned rotator. There is some evidence magnetars tend toward aligned spin and magnetic axes. Both 1E 1547.05408 and PSR J16224950 have PA swings that are consistent with being aligned rotators (Camilo et al., 2008; Levin et al., 2012). This is further backed up by the wide radio profiles, and low pulsed X-ray fractions of these two magnetars (Halpern et al., 2008; Camilo et al., 2018). There is some ambiguity as to whether the spin and magnetic axes of XTE J1810197 are aligned or orthogonal, as Camilo et al. (2007b) found both scenarios adequately describe the PA swing across its main pulse and inter-pulse. Conversely, Kramer et al. (2007) found that an offset dipole described by two separate rotating vector models (RVMs, Radhakrishnan & Cooke, 1969) could also describe its PA behaviour, and speculated it may be evidence for XTE J1810197 having a multi-pole magnetic field. Additionally, Dai et al. (2019) observed distinctly non-RVM PA variations following its 2018 outburst. For Swift J1818.01607, the flat PA in the higher-frequency panels of Figure 3 is broadly consistent with the RVM for a dipole magnetic field. However, the narrow pulse duty cycle makes it difficult to constrain the star’s magnetic geometry, as the relatively flat PA could be consistent with either nearly aligned magnetic and spin axes, or a large offset between the magnetic axis and our line-of-sight. Given the radio profiles of magnetars evolve over the weeks to months following an outburst (Kramer et al., 2007; Dai et al., 2019), it may be possible to measure the magnetic geometry of Swift J1818.01607 in the future.
Pulsars that experienced fall-back accretion soon after their birth can undergo apparent magnetic field growth as their magnetic fields diffuse to the surface over time (see for example Muslimov & Page, 1995). This can result in a seemingly ‘normal’ rotation-powered, young pulsar obtain magnetar-like rotational properties within - kyr (Ho, 2015). If Swift J1818.01607 is a result of this evolutionary path, then we may expect it to show similar radio properties to the high B-field PSRs J11196127, J12086238 and J18460258. While PSRs J18460258 (Gavriil et al., 2008) and J11196127 (Archibald et al., 2016) have been observed to undergo magnetar-like outbursts in the past, only PSR J11196127 has been observed to emit radio pulses. Observationally, we can draw parallels between the radio properties of Swift J1818.01607 and those of PSR J11196127 during its 2016 outburst. Following the initial suppression and re-emergence of radio pulses from PSR J11196127, multi-band flux measurements found the pulsar possessed a steeper radio spectrum than its nominal , with values of ranging between to (Majid et al., 2017). Later observations found its radio spectrum had undergone spectral flattening to a more magnetar-like spectral index of over the months following the outburst (Pearlman et al., 2016). The flux density of PSR J11196127 also underwent a factor of increase in two weeks after the outburst before recovering back to its normal levels (Dai et al., 2018). In addition to having a comparably steep post-outburst spectral index, Swift J1818.01607 appears to have also undergone a similar radio brightening, as the flux densities at 1356 MHz and 1598 MHz in Table 1 are a factor of - times higher than measurements at similar observing frequencies two weeks prior to our Parkes UWL observation (Karuppusamy et al., 2020; Esposito et al., 2020; Lower & Shannon, 2020). The refractive modulation timescale is expected to be very long (years) and the modulation index to be low (Cordes & Lazio, 2002). Thus the increase in flux density cannot be ascribed to refractive effects. If the current outburst of Swift J1818.01607 continues to proceed in a similar manner to the 2016 outburst of PSR J11196127, then we may expect the steep spectral index to undergo a similar flattening and for the flux density to decay to a more steady state over the coming months. A more recent spectral index measurement of from multi-band observations (Majid et al., 2020) suggests some amount of spectral-flattening may have already occurred. Continued monitoring with multi-band and wide-bandwidth receiver systems will either confirm the spectral index is flattening toward a more magnetar-like value, or is simply fluctuating about some mean value. Additionally, a measurement of the braking index would allow us to understand the future spin and magnetic field evolution of the magnetar and potentially confirm or rule out a rotation-powered pulsar origin.
Acknowledgements
The Parkes radio telescope is part of the Australia Telescope National Facility which is funded by the Australian Government for operation as a National Facility managed by CSIRO. We acknowledge the Wiradjuri people as the traditional owners of the Observatory site. This work made use of the OzSTAR national HPC facility, which is funded by Swinburne University of Technology and the National Collaborative Research Infrastructure Strategy (NCRIS). This work was supported by the Australian Research Council (ARC) Laureate Fellowship FL150100148 and the ARC Centre of Excellence CE170100004 (OzGrav). MEL receives support from the Australian Government Research Training Program and CSIRO Astronomy and Space Science. RMS is supported through ARC Future Fellowship FT190100155. We thank Shi Dai for useful discussions and suggestions on calibrating the UWL data. We are grateful to the ATNF staff, in particular James Green, for allocating us time to perform this observation. We also thank the anonymous referee for their helpful comments and suggestions. This work made use of the Astronomer’s Telegram and NASA’s Astrophysics Data Service.
References
- Archibald et al. (2016) Archibald, R. F., Kaspi, V. M., Tendulkar, S. P., & Scholz, P. 2016, ApJ, 829, L21, doi: 10.3847/2041-8205/829/1/L21
- Ashton et al. (2019) Ashton, G., Hübner, M., Lasky, P. D., et al. 2019, ApJS, 241, 27, doi: 10.3847/1538-4365/ab06fc
- Bannister et al. (2019) Bannister, K. W., Deller, A. T., Phillips, C., et al. 2019, Science, 365, 565, doi: 10.1126/science.aaw5903
- Burke-Spolaor et al. (2012) Burke-Spolaor, S., Johnston, S., Bailes, M., et al. 2012, MNRAS, 423, 1351, doi: 10.1111/j.1365-2966.2012.20998.x
- Camilo et al. (2007a) Camilo, F., Ransom, S. M., Halpern, J. P., & Reynolds, J. 2007a, ApJ, 666, L93, doi: 10.1086/521826
- Camilo et al. (2006) Camilo, F., Ransom, S. M., Halpern, J. P., et al. 2006, Nature, 442, 892, doi: 10.1038/nature04986
- Camilo et al. (2008) Camilo, F., Reynolds, J., Johnston, S., Halpern, J. P., & Ransom, S. M. 2008, ApJ, 679, 681, doi: 10.1086/587054
- Camilo et al. (2007b) Camilo, F., Reynolds, J., Johnston, S., et al. 2007b, ApJ, 659, L37, doi: 10.1086/516630
- Camilo et al. (2018) Camilo, F., Scholz, P., Serylak, M., Buchner, S., et al. 2018, ApJ, 856, 180, doi: 10.3847/1538-4357/aab35a
- Champion et al. (2020) Champion, D., Desvignes, G., Jankowski, F., et al. 2020, The Astronomer’s Telegram, 13559, 1
- Cordes & Lazio (2002) Cordes, J. M., & Lazio, T. J. W. 2002, arXiv e-prints, astro. https://arxiv.org/abs/astro-ph/0207156
- Dai et al. (2018) Dai, S., Johnston, S., Weltevrede, P., et al. 2018, MNRAS, 480, 3584, doi: 10.1093/mnras/sty2063
- Dai et al. (2019) Dai, S., Lower, M. E., Bailes, M., et al. 2019, ApJ, 874, L14, doi: 10.3847/2041-8213/ab0e7a
- Duncan & Thompson (1992) Duncan, R. C., & Thompson, C. 1992, ApJ, 392, L9, doi: 10.1086/186413
- Eatough et al. (2013) Eatough, R. P., et al. 2013, Nature, 501, 391, doi: 10.1038/nature12499
- Enoto et al. (2020) Enoto, T., Sakamoto, T., Younes, G., et al. 2020, The Astronomer’s Telegram, 13551, 1
- Espinoza et al. (2011) Espinoza, C. M., Lyne, A. G., Kramer, M., Manchester, R. N., & Kaspi, V. M. 2011, ApJ, 741, L13, doi: 10.1088/2041-8205/741/1/L13
- Esposito et al. (2020) Esposito, P., Rea, N., Borghese, A., et al. 2020, ApJ, submitted, arXiv:2004.04083. https://arxiv.org/abs/2004.04083
- Evans et al. (2020) Evans, P. A., Gropp, J. D., Kennea, J. A., et al. 2020, GRB Coordinates Network, 27373, 1
- Gajjar et al. (2020) Gajjar, V., Perez, K., Siemion, A., et al. 2020, The Astronomer’s Telegram, 13575, 1
- Gavriil et al. (2008) Gavriil, F. P., Gonzalez, M. E., Gotthelf, E. V., et al. 2008, Science, 319, 1802, doi: 10.1126/science.1153465
- Geyer et al. (2017) Geyer, M., Karastergiou, A., Kondratiev, V. I., et al. 2017, MNRAS, 470, 2659, doi: 10.1093/mnras/stx1151
- Green (2019) Green, D. A. 2019, Journal of Astrophysics and Astronomy, 40, 36, doi: 10.1007/s12036-019-9601-6
- Halpern et al. (2008) Halpern, J. P., Gotthelf, E. V., Reynolds, J., Ransom, S. M., & Camilo, F. 2008, ApJ, 676, 1178, doi: 10.1086/527293
- Han et al. (2018) Han, J. L., Manchester, R. N., van Straten, W., & Demorest, P. 2018, ApJS, 234, 11, doi: 10.3847/1538-4365/aa9c45
- Hessels et al. (2019) Hessels, J. W. T., Spitler, L. G., Seymour, A. D., et al. 2019, ApJ, 876, L23, doi: 10.3847/2041-8213/ab13ae
- Ho (2015) Ho, W. C. G. 2015, MNRAS, 452, 845, doi: 10.1093/mnras/stv1339
- Hobbs et al. (2020) Hobbs, G., Manchester, R. N., Dunning, A., et al. 2020, PASA, 37, e012, doi: 10.1017/pasa.2020.2
- Hotan et al. (2004) Hotan, A. W., van Straten, W., & Manchester, R. N. 2004, PASA, 21, 302, doi: 10.1071/AS04022
- Hu et al. (2020) Hu, C.-P., Strohmayer, T. E., Ray, P. S., et al. 2020, The Astronomer’s Telegram, 13588, 1
- Hunter (2007) Hunter, J. D. 2007, Comput. in Sci. & Eng., 9, 90, doi: 10.1109/MCSE.2007.55
- Jankowski et al. (2018) Jankowski, F., van Straten, W., Keane, E. F., et al. 2018, MNRAS, 473, 4436, doi: 10.1093/mnras/stx2476
- Johnston & Karastergiou (2017) Johnston, S., & Karastergiou, A. 2017, MNRAS, 467, 3493, doi: 10.1093/mnras/stx377
- Karuppusamy et al. (2020) Karuppusamy, R., Desvignes, G., Kramer, M., et al. 2020, The Astronomer’s Telegram, 13553, 1
- Kramer et al. (2007) Kramer, M., Stappers, B. W., Jessner, A., Lyne, A. G., & Jordan, C. A. 2007, MNRAS, 377, 107, doi: 10.1111/j.1365-2966.2007.11622.x
- Lazaridis et al. (2008) Lazaridis, K., Jessner, A., Kramer, M., et al. 2008, MNRAS, 390, 839, doi: 10.1111/j.1365-2966.2008.13794.x
- Levin et al. (2010) Levin, L., Bailes, M., Bates, S., et al. 2010, ApJ, 721, L33, doi: 10.1088/2041-8205/721/1/L33
- Levin et al. (2012) Levin, L., Bailes, M., Bates, S. D., et al. 2012, MNRAS, 422, 2489, doi: 10.1111/j.1365-2966.2012.20807.x
- Li & Han (2003) Li, X. H., & Han, J. L. 2003, A&A, 410, 253, doi: 10.1051/0004-6361:20031190
- Lower & Shannon (2020) Lower, M. E., & Shannon, R. M. 2020, The Astronomer’s Telegram, 13587, 1
- Maan & van Leeuwen (2020) Maan, Y., & van Leeuwen, J. 2020, The Astronomer’s Telegram, 13560, 1
- Majid et al. (2017) Majid, W. A., Pearlman, A. B., Dobreva, T., et al. 2017, ApJ, 834, L2, doi: 10.3847/2041-8213/834/1/L2
- Majid et al. (2020) Majid, W. A., Pearlman, A. B., Prince, T. A., et al. 2020, The Astronomer’s Telegram, 13649, 1
- McLaughlin et al. (2006) McLaughlin, M. A., Lyne, A. G., Lorimer, D. R., et al. 2006, Nature, 439, 817, doi: 10.1038/nature04440
- Mereghetti et al. (2005) Mereghetti, S., Tiengo, A., Esposito, P., et al. 2005, ApJ, 628, 938, doi: 10.1086/430943
- Morello et al. (2019) Morello, V., Barr, E. D., Cooper, S., et al. 2019, MNRAS, 483, 3673, doi: 10.1093/mnras/sty3328
- Muslimov & Page (1995) Muslimov, A., & Page, D. 1995, ApJ, 440, L77, doi: 10.1086/187765
- Olausen & Kaspi (2014) Olausen, S. A., & Kaspi, V. M. 2014, ApJS, 212, 6, doi: 10.1088/0067-0049/212/1/6
- Oliphant (2006) Oliphant, T. 2006, NumPy: A guide to NumPy, USA: Trelgol Publishing. http://www.numpy.org/
- Pearlman et al. (2016) Pearlman, A. B., Majid, W. A., Horiuchi, S., et al. 2016, The Astronomer’s Telegram, 9870, 1
- Pearlman et al. (2018) Pearlman, A. B., Majid, W. A., Prince, T. A., Kocz, J., & Horiuchi, S. 2018, ApJ, 866, 160, doi: 10.3847/1538-4357/aade4d
- Radhakrishnan & Cooke (1969) Radhakrishnan, V., & Cooke, D. J. 1969, Astrophys. Lett., 3, 225
- Scholz et al. (2017) Scholz, P., Camilo, F., Sarkissian, J., et al. 2017, ApJ, 841, 126, doi: 10.3847/1538-4357/aa73de
- Seymour et al. (2020) Seymour, A., Michilli, D., & Pleunis, Z. 2020, DM_phase, GitHub. https://github.com/danielemichilli/DM_phase
- Shannon & Johnston (2013) Shannon, R. M., & Johnston, S. 2013, MNRASLetters, 435, L29, doi: 10.1093/mnrasl/slt088
- Speagle (2020) Speagle, J. S. 2020, MNRAS, 493, 3132, doi: 10.1093/mnras/staa278
- Torne et al. (2015) Torne, P., Eatough, R. P., Karuppusamy, R., et al. 2015, MNRAS, 451, L50, doi: 10.1093/mnrasl/slv063
- van der Velden (2020) van der Velden, E. 2020, The Journal of Open Source Software, 5, 2004, doi: 10.21105/joss.02004
- van Straten & Bailes (2011) van Straten, W., & Bailes, M. 2011, Publications of the Astronomical Society of Australia, 28, 1, doi: 10.1071/AS10021
- van Straten et al. (2012) van Straten, W., Demorest, P., & Oslowski, S. 2012, Astronomical Research and Technology, 9, 237. https://arxiv.org/abs/1205.6276
- Weltevrede et al. (2011) Weltevrede, P., Johnston, S., & Espinoza, C. M. 2011, MNRAS, 411, 1917, doi: 10.1111/j.1365-2966.2010.17821.x
- Yan et al. (2018) Yan, W. M., Wang, N., Manchester, R. N., Wen, Z. G., & Yuan, J. P. 2018, MNRAS, 476, 3677, doi: 10.1093/mnras/sty470
- Yao et al. (2017) Yao, J. M., Manchester, R. N., & Wang, N. 2017, ApJ, 835, 29, doi: 10.3847/1538-4357/835/1/29