Motility-induced wall aggregation of Active Brownian Particles (ABPs) is a well-studied phenomenon. Here, we study the aggregation of ABPs on porous walls, which allows the particles to penetrate through at large motility. We show that the active aggregates undergo a morphological transition from a connected dense-phase to disconnected droplets with an increase in wall porosity and the particle self-motility, similar to wetting-dewetting transitions in equilibrium fluids. We show that both morphologically distinct states are stable, and independent of initial conditions at least in some parameter regions. Our analysis reveals that changes in wall porosity affect the intrinsic properties of the aggregates and changes the effective wall-aggregate interfacial tension, consistent with the appearance of the morphological transition. Accordingly, a close analysis of the density, as well as orientational distribution, indicates that the underlying reason for such morphological transitions is not necessarily specific to the systems with porous walls, and it can be possible to observe in a larger class of confined, active systems by tuning the properties of confining walls.
Morphological transitions of active Brownian particle aggregates on porous walls
Active matter is a prominent class of non-equilibrium systems where microscopic autonomous motion leads to distinct types of collective ordering Marchetti et al. (2013); Ramaswamy (2010); Vicsek and Zafeiris (2012). Such non-equilibrium ordering is ubiquitous in a range of biological Ballerini et al. (2008); Katz et al. (2011); Dombrowski et al. (2004); Sanchez et al. (2012); Patteson et al. (2018); Dell’Arciprete et al. (2018); Wioland et al. (2016, 2013); DeCamp et al. (2015); Kawaguchi et al. (2017), as well as synthetic systems Theurkauff et al. (2012); Palacci et al. (2013); Volpe et al. (2011); Buttinoni et al. (2013); Bricard et al. (2013); Thutupalli et al. (2011); Bechinger et al. (2016); van der Linden et al. (2019); Nishiguchi and Sano (2015); Yan et al. (2016). A particular kind of non-equilibrium ordering observed in active matter is the Motility induced phase separation (MIPS), where active elements segregate into a dense and to a dilute phase without any cohesive interactions Redner et al. (2013); Fily and Marchetti (2012); Cugliandolo et al. (2017); Farage et al. (2015); Klamser et al. (2018); Liu et al. (2019); Herminghaus and Mazza (2017); Cates and Tailleur (2015); Caprini et al. (2020). Despite being an intrinsically non-equilibrium process, MIPS shows striking similarities to equilibrium liquid-gas phase coexistence. Due to this property, several concepts of equilibrium statistical physics, such as pressure Takatori et al. (2014); Winkler et al. (2015); Fily et al. (2017); Solon et al. (2015); Nikola et al. (2016); Marini Bettolo Marconi et al. (2016); Patch (2018); Speck and Jack (2016); Patch et al. (2017, 2018); Jamali and Naji (2018); Das et al. (2019), surface tension Bialké et al. (2015); Paliwal et al. (2017); Prymidis et al. (2016); Solon et al. (2018); del Junco and Vaikuntanathan (2019); Cagnetta et al. (2020); Zakine et al. (2020); Omar et al. (2020), and chemical potential Takatori and Brady (2015); Paliwal et al. (2018); Tjhung et al. (2018); Guioth and Bertin (2019) have been applied to describe MIPS. In the presence of non-adhesive walls, a formation of dense-phase of active particles is observed on the wall surface as the wall reduces particle motility Lee (2017); Yang et al. (2014); Sepúlveda and Soto (2017, 2018); Ni et al. (2015); Knežević and Stark (2020).
Active particle aggregation on solid surfaces has a special interest in the context of understanding microbial dynamics near walls Lauga et al. (2006); Elgeti and Gompper (2013), and the formation of biofilms Hall-Stoodley et al. (2004); Keller et al. (2019); Hartmann et al. (2019); Liu et al. (2019). In the case of simple excluded volume interactions between solid surfaces and particles, the aggregates spread almost uniformly on the wall Ni et al. (2015); Lee (2017). Recent studies have shown qualitative similarities to capillary condensation in equilibrium fluids Wysocki and Rieger (2020); Knežević and Stark (2020). It has also been shown that the reorientation rate of active particles changes the wall aggregation properties Sepúlveda and Soto (2017, 2018). Recently, there is a growing interest in studying the targeted assembly of active particles, either by varying the interactions or the environment. One of the major objectives of such studies is to find an optimum arrangement of excluded regions in space, to achieve aggregates of desired shape and size. So far, the focus of such studies has been to optimize the geometry, distribution, and the mutual orientation angles between smooth, impenetrable obstacles to facilitate particle trapping Kaiser et al. (2012); Kumar et al. (2019); Magiera and Brendel (2015); Wu et al. (2018); Reichhardt and Reichhardt (2017). However, the possibility of tuning the wall-particle interaction to control the self-assembly has not been explored much. One possible way to change the physical interaction between the particles and the wall is to introduce wall penetrability. Recent studies showing particle trapping by penetrable membranes also indicate possible biomedical applications of such studies Daddi-Moussa-Ider et al. (2019, 2019).
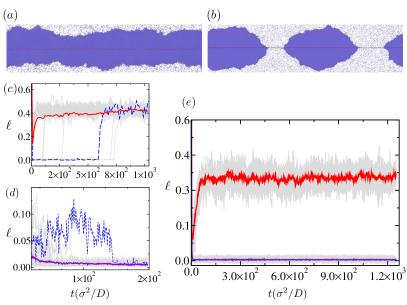
To study the effect of wall penetrability in aggregate morphology, we simulate the dynamics of Active Brownian particles (ABPs) in the presence of a rigid and porous wall. We show that the dense-phase on the wall surface displays two morphologically distinct states, a connected dense-phase (CDP), where the dense-phase spreads entirely on the wall (Fig 1(a)) (Movie§1 SI )), and disconnected droplets (Fig. 1(b)) (Movie§2 SI )) where complete spreading is prevented by the formation of multiple finite-sized aggregates with a macroscopically curved interface. The CDP state is similar in structure to the cluster formation observed on the surface of perfectly impenetrable, smooth walls Ni et al. (2015); Knežević and Stark (2020). We observe that the transition from one morphological state to the other happens when either the pore size or the particle motility is varied. Also, for a large enough ABP motility, changing the wall porosity alone leads to a morphological transition. To analyze this phenomenon, we calculate the mechanical tension at the solid-liquid interface, following the method used in equilibrium interfaces Kirkwood and Buff (1949); Nijmeijer et al. (1990), recently extended for active systems Bialké et al. (2015); Paliwal et al. (2017). We show that the preference to form disconnected droplets over a connected dense-phase concurs with an increase in solid-liquid interfacial tension, as the wall changes the internal properties of the aggregates.
We study a two-dimensional system of disk-like particles in a square simulation box (length ) with periodic boundary conditions. The particles interact via short-ranged repulsive, Weeks-Chandler-Anderson (WCA) Weeks et al. (1971) potential. The porous wall is modelled by linearly arranging static ‘wall’ particles at a uniform separation at the center of the simulation box along the direction (at = L/2). The particle-wall interaction is also modeled by WCA potential. The dynamics of the particle’s position is governed by,
| (1) |
, is the diffusion coefficient, and is Gaussian white noise such that = 0 and . The self-propulsive speed , acts along , where evolves as where , is the rotational diffusion coefficient. We measure the distances in unit of WCA parameter , time in , and energy in . We also set the WCA potential interaction strength to unity. We parameterize the activity by a dimensionless Péclet number and porosity by . For all the simulations, we choose the area fraction , in order to avoid the phase separation away from the wall Redner et al. (2013); Fily and Marchetti (2012). With this constraint, we study the system by varying the number of particles from to ( to ). However, we conduct most of the analysis at and . We run the simulations maximum up to time with simulation time step . Each parameter values are examined up to 120 independent simulations. When , the steric hindrance due to wall particles does not permit ABPs to penetrate through the wall, leading to a dense-phase formation of ABPs on the wall at large enough . On the other hand, when , ABPs penetrate through the wall with minimal resistance, hence no particle aggregation on the wall. For , the pores only permit a single ABP to pass at a time, which can cause oppositely moving particles to clog at the pores, causing a dense-phase formation. We focus our study at this intermediate range of .
To quantify the steady-state properties of the dense-phase, we calculate the fraction of ABPs that are part of the dense-phase, which we call the cluster fraction, (see SI for details). Subsequently, we calculate the local ‘height’ () of the dense-phase on the wall, from the coordinate of the ABP within the dense-phase at the largest separation from a given point on the wall. These measurements also provide the location of the interface between the dense-phase and the dilute phase (see SI ). When the dense-phase uniformly spreads (forms CDP) on the wall, everywhere (Fig 1(a)), while localized dense-phases (droplets) leave ‘empty’ regions with (Fig 1(b)). Thus, we use the fraction of the empty region on the wall () as an identifier for different dense-phase morphologies. Considering the fluctuation in at transition points, we identify the dense-phase to be connected if . Fig 1(c-e) indicates the temporal evolution of the cluster for various parameters via . For most parameters, the dense-phase geometry converges either to stable CDP () or to stable droplets () within a relatively short time (). However, in a few cases, the cluster shape shows a probabilistic behavior for a finite duration such that a major fraction of the independent simulations converge to CDP while the remaining simulations show droplet formation. In many such cases, we observe late-time transitions from CDP to droplets (Fig 1(c), MOVIE§3 SI ) or in the reverse direction (Fig 1(d), MOVIE§4 SI ) leading to convergence to one of the two states. However, we also observed that for a narrow range of parameters, these late-time transitions become exceedingly rare, and the clusters show a robust bistable behavior (Fig 1(e)).
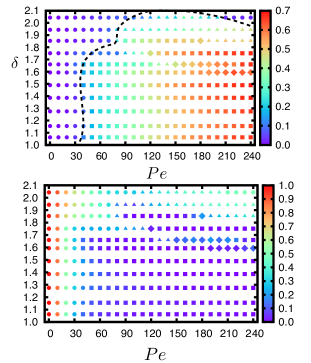
In Fig. 2, we summarise the properties of ABP condensate as a function of and for . For , we only observe CDP formation at large enough . At a higher porosity (), the ABPs also form droplets. The bistable behaviour is observed in the range of at high . We have also analyzed the dependence of these morphological states on finite system sizes for selected parameter values corresponding to both the morphological states. We have found that both CDP and droplets persist for all the system sizes. However, the bistable region in the phase diagram shifts to different parameter values when the system size is increased. (see SI for details).
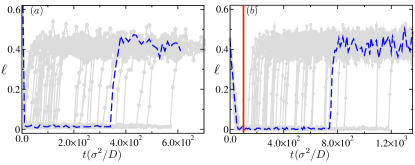
Cluster stability and reversibility: To verify that the droplet states are genuine, not a transient state which slowly evolves to a CDP, we conduct the following tests. First, we artificially induce CDP for parameters where dense-phase form droplets, by placing nucleation ‘seeds’ at regular intervals. These seeds are planted by blocking two adjacent pores on the wall in such a way that they close a region of length . Placing the seeds on the wall reduces locally and induces local dense-phase formation. In Fig 3(a) we plot the fraction of empty region on the wall () for independent runs with , with seed separation (). When the seeds are sufficiently close, these local clusters merge together to form CDP. Initially, drops to zero within a short time (), indicating the formation of a seed-induced CDP in all the runs. However, at later times, all the continuous clusters spontaneously switch to droplets as converges to a non-zero value (Fig 3(a), Movie§5 SI ), indicating that CDP is unstable for these parameters and droplets are indeed the preferred state. If the droplet states were transient and CDP is the globally preferred state, the induced CDP would have remained stable in these simulations. However, the late-time transitions from CDP to droplets in these simulations assert the robustness of the droplet states. Repeated tests at smaller seed separations (L/5) also show similar behaviour. To further verify the robustness of both the morphological state, we also study the coarsening behaviour of the aggregates of these states by calculating the size of the largest cluster as a function of time Redner et al. (2013) (SI ). In all these cases, we do not observe any increase in the aggregate size beyond , where a single large cluster is formed, again confirming that cluster shapes are not transient states. Next, we study the time-evolution of aggregates by varying the particle motility with time (Fig 3(b)). We choose a droplet as an initial configuration and conduct the simulation for and , where CDP is apparently stable. The time-evolution of (Fig 3(b) and Movie§6 SI ) in such a simulation for at indicates that the initial droplets transform into CDP, as drops to zero within a relatively short time, . Afterwards, at (vertical line in Fig 3(b)), motility is increased to a higher value (). We find that the CDP destabilizes at this motility and transforms into droplets. These tests confirm the motility dependence of both the morphological states. Also, these results show that time-dependent motility dynamically alters the dense-phase morphology on the wall.
Wall-liquid interfacial tension: The ABP aggregation on the wall leads to the formation of at least two different types of interfaces, one at the boundary between dense(liquid) and the dilute(vapor) phases and the second one separating the wall and the liquid phase. It has been shown previously that the presence of interfaces changes the mechanical stress distribution in active-materials Bialké et al. (2015); Paliwal et al. (2017). To understand the modifications in stress distributions due to walls, we calculate the components of the pressure tensor as a function of the distance from the wall. The self propulsion of ABPs contributes to the swim pressure,
| (2) |
where indicates time-average within rectangular bins of width aligned parallel to the wall and to the interfaces, are the Cartesian components. denotes the active impulse given by and the velocity of the -th particle Fily et al. (2017); Das et al. (2019). The stress caused by inter-particle interactions , separated by a distance is given as,
| (3) |
Extending the equilibrium studies Nijmeijer et al. (1990), the stress due to wall interaction is,
| (4) |
where is the distance of the -th active particle with the -th wall particle. When the dense-phase forms CDP, the non-vanishing, diagonal components and become the tangential () and the normal () components to the interfaces. In the limit of large , we neglect the thermal stress contributions.
To understand the effect of wall properties in the dense-phase morphology, we compare the pressure distribution for the same , but at different , where we observe contrasting aggregate morphology. Thus, we closely analyse systems at , which provides a stable CDP at , but form droplets at . Also, in the latter case, the dense-phase remains in CDP for a significant amount of time (cf. Fig. 1(c)), before they break-up into droplets. The geometric similarity between the stable CDP () and the ‘unstable’ CDP , allows us to directly compare the distribution of in these cases. We choose those configurations which remain as CDP for this comparison. For such a geometry, one obtains the total surface tension, including contributions from all the four interfaces by extending the approach used in equilibrium wetting phenomena Kirkwood and Buff (1949); Nijmeijer et al. (1990),
| (5) |
Thus we calculate the difference, () for the three pressure contributions for and as a function of as given in Fig 4(a)-(c). Interestingly, we find significant difference () inside the dense region and away from the wall (Fig. 4(a)), which eventually vanishes near the liquid-vapour interface. This behaviour is in contrast with the observations inside dense phase without the walls, where () vanishes in the bulk Bialké et al. (2015)(see SI ). This result indicates that, even though the wall force acts only on the first contact layer of ABPs, it alters the stress distribution over multiple layers of particles. Thus, the dense region doesn’t attain bulk properties in these simulations. Also, for , in the dense-phase while it is weakly positive for (Fig 4(a)). The contributions from direct wall interaction is non-zero only within a distance from the wall (Fig. 4(b)). However, the swim pressure difference, () is not significant in the dense-phase whereas it shows a large (negative) value near the liquid-vapour interface as observed previously (Fig 4(c)). Using these measurements, we calculate the wall-liquid surface tension,
| (6) |
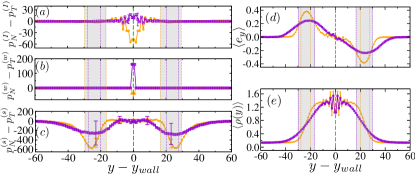
We ignore the swim pressure contribution Eq, 6, as it is negligible near the wall-liquid interface. Also, the tangential component of does not vanish since the particles can penetrate the wall. Similarly, we also calculate the liquid-vapour interfacial tension , considering that has negligible contribution at the liquid-vapor interface. Our calculations indicate that when , the wall acts as a high-energy surface () and as a low-energy surface (). We also observe a steady increase in with increase in at (SI -Table§2) as the dense-phase shows increasing tendency to form droplets. Subsequently, we define a spreading parameter following the approach in equilibrium surface-wetting studies de Gennes et al. (2004). Here we ignore as its values are not significant. We obtain for . However, we couldn’t observe this trend in when we repeat analysis by varying from - at , where the preference to form droplets increase with . We note that the value of S is influenced by , which is a large negative quantity. Also, unlike the interaction pressure, is more difficult to estimate locally, partly due to its sensitivity to the finite system size.
The observed difference in interaction pressure components is due to the modification of inter-particle interaction in the dense-phase in the presence of wall, as we do not observe such a difference in its absence Bialké et al. (2015)(SI ). Since the ABP interactions are linked to the local particle orientation and the density, we compare the orientation (Fig. 4(d)), and the density distributions (Fig. 4(e)), as a function of distance from the wall , for and at . Evidently, an increase in wall porosity increases the width and decreases the peak value of the . Also, we note that the does not reach a plateau (especially for ) as seen for a bulk phase. We observe a similar trend in (Fig. 4(d)). The orientation distribution shows a non-vanishing particle orientation inside the dense region, while such an orientational preference is localized in the liquid-vapour interface in the absence of walls (SI ). This indicates a significant influence of the wall in the dense region. Also, the properties of the dense region is different from the bulk behaviour, since the thickness of the dense layer on the wall is smaller than the effective range of influence of the wall. Since the active force along the particle orientation is balanced by the interaction force, a non-vanishing mean orientation influences the stress distribution within the aggregates, hence the change in . Also, a broader density distribution indicates enhanced structural disorder, triggered by particles crossing the wall, which effectively changes the interaction energy inside the dense-phase.
In summary, we demonstrate that a morphological transition in the dense-phase on porous walls by ABPs can be achieved either by changing the wall porosity or the particle motility. This transition is reversible, and the wall spreading of the dense-phase can be tuned by altering these two quantities. Interestingly, the droplet formation on the walls coincides with an increase in effective wall-liquid interfacial tension. Higher wall porosity influences the physical properties of the dense-phase by altering the local density and the polarity, which leads to a change in interaction pressure in the dense-phase. These observations imply that the underlying reason for morphological transformation is more general and can be observed in a variety of ways, even for impenetrable walls. A general understanding of this phenomenon requires the development of theoretical models for active-morphological transitions. Understanding such morphological transitions can be useful for many practical applications, such as the design of surfaces that prevent microbial spreading, especially in the context of recent studies Liu et al. (2019) revealing the role of MIPS in the aggregation of Myxococcus xanthus.
I Acknowledgements
We thank Gerhard Gompper, Roland Winkler, Sriram Ramaswamy, and Julien Tailleur for discussions. RC thanks Arvind Gopinath and Mandar Inamdar for going through the manuscript. SD thanks Debasmit Sarkar for technical help. RC acknowledges the financial support from SERB, India via the grants SB/S2/RJN-051/2015 and SERB/F/10192/2017-2018. We acknowledge SpaceTime2 HPC facility at IIT Bombay.
References
- Marchetti et al. (2013) M. C. Marchetti, J. F. Joanny, S. Ramaswamy, T. B. Liverpool, J. Prost, M. Rao and R. A. Simha, Rev. Mod. Phys., 2013, 85, 1143–1189.
- Ramaswamy (2010) S. Ramaswamy, Annual Review of Condensed Matter Physics, 2010, 1, 323–345.
- Vicsek and Zafeiris (2012) T. Vicsek and A. Zafeiris, Physics Reports, 2012, 517, 71 – 140.
- Ballerini et al. (2008) M. Ballerini, N. Cabibbo, R. Candelier, A. Cavagna, E. Cisbani, I. Giardina, V. Lecomte, A. Orlandi, G. Parisi, A. Procaccini, M. Viale and V. Zdravkovic, Proceedings of the National Academy of Sciences, 2008, 105, 1232–1237.
- Katz et al. (2011) Y. Katz, K. Tunstrøm, C. C. Ioannou, C. Huepe and I. D. Couzin, Proceedings of the National Academy of Sciences, 2011, 108, 18720–18725.
- Dombrowski et al. (2004) C. Dombrowski, L. Cisneros, S. Chatkaew, R. E. Goldstein and J. O. Kessler, Phys. Rev. Lett., 2004, 93, 098103.
- Sanchez et al. (2012) T. Sanchez, D. T. N. Chen, S. J. DeCamp, M. Heymann and Z. Dogic, Nature, 2012, 491, 431 EP –.
- Patteson et al. (2018) A. E. Patteson, A. Gopinath and P. E. Arratia, Nature Communications, 2018, 9, 5373.
- Dell’Arciprete et al. (2018) D. Dell’Arciprete, M. L. Blow, A. T. Brown, F. D. C. Farrell, J. S. Lintuvuori, A. F. McVey, D. Marenduzzo and W. C. K. Poon, Nature Communications, 2018, 9, 4190.
- Wioland et al. (2016) H. Wioland, E. Lushi and R. E. Goldstein, New Journal of Physics, 2016, 18, 075002.
- Wioland et al. (2013) H. Wioland, F. G. Woodhouse, J. Dunkel, J. O. Kessler and R. E. Goldstein, Phys. Rev. Lett., 2013, 110, 268102.
- DeCamp et al. (2015) S. J. DeCamp, G. S. Redner, A. Baskaran, M. F. Hagan and Z. Dogic, Nature Materials, 2015, 14, 1110 EP –.
- Kawaguchi et al. (2017) K. Kawaguchi, R. Kageyama and M. Sano, Nature, 2017, 545, 327 EP –.
- Theurkauff et al. (2012) I. Theurkauff, C. Cottin-Bizonne, J. Palacci, C. Ybert and L. Bocquet, Phys. Rev. Lett., 2012, 108, 268303.
- Palacci et al. (2013) J. Palacci, S. Sacanna, A. P. Steinberg, D. J. Pine and P. M. Chaikin, Science, 2013, 339, 936–940.
- Volpe et al. (2011) G. Volpe, I. Buttinoni, D. Vogt, H.-J. Kümmerer and C. Bechinger, Soft Matter, 2011, 7, 8810–8815.
- Buttinoni et al. (2013) I. Buttinoni, J. Bialké, F. Kümmel, H. Löwen, C. Bechinger and T. Speck, Phys. Rev. Lett., 2013, 110, 238301.
- Bricard et al. (2013) A. Bricard, J.-B. Caussin, N. Desreumaux, O. Dauchot and D. Bartolo, Nature, 2013, 503, 95 EP –.
- Thutupalli et al. (2011) S. Thutupalli, R. Seemann and S. Herminghaus, New Journal of Physics, 2011, 13, 073021.
- Bechinger et al. (2016) C. Bechinger, R. Di Leonardo, H. Löwen, C. Reichhardt, G. Volpe and G. Volpe, Rev. Mod. Phys., 2016, 88, 045006.
- van der Linden et al. (2019) M. N. van der Linden, L. C. Alexander, D. G. A. L. Aarts and O. Dauchot, Phys. Rev. Lett., 2019, 123, 098001.
- Nishiguchi and Sano (2015) D. Nishiguchi and M. Sano, Phys. Rev. E, 2015, 92, 052309.
- Yan et al. (2016) J. Yan, M. Han, J. Zhang, C. Xu, E. Luijten and S. Granick, Nature Materials, 2016, 15, 1095 EP –.
- Redner et al. (2013) G. S. Redner, M. F. Hagan and A. Baskaran, Phys. Rev. Lett., 2013, 110, 055701.
- Fily and Marchetti (2012) Y. Fily and M. C. Marchetti, Phys. Rev. Lett., 2012, 108, 235702.
- Cugliandolo et al. (2017) L. F. Cugliandolo, P. Digregorio, G. Gonnella and A. Suma, Phys. Rev. Lett., 2017, 119, 268002.
- Farage et al. (2015) T. F. F. Farage, P. Krinninger and J. M. Brader, Phys. Rev. E, 2015, 91, 042310.
- Klamser et al. (2018) J. U. Klamser, S. C. Kapfer and W. Krauth, Nature Communications, 2018, 9, 5045.
- Liu et al. (2019) G. Liu, A. Patch, F. Bahar, D. Yllanes, R. D. Welch, M. C. Marchetti, S. Thutupalli and J. W. Shaevitz, Phys. Rev. Lett., 2019, 122, 248102.
- Herminghaus and Mazza (2017) S. Herminghaus and M. G. Mazza, Soft matter, 2017, 13, 898–910.
- Cates and Tailleur (2015) M. E. Cates and J. Tailleur, Annual Review of Condensed Matter Physics, 2015, 6, 219–244.
- Caprini et al. (2020) L. Caprini, U. M. B. Marconi and A. Puglisi, Physical Review Letters, 2020, 124, 078001.
- Takatori et al. (2014) S. C. Takatori, W. Yan and J. F. Brady, Phys. Rev. Lett., 2014, 113, 028103.
- Winkler et al. (2015) R. G. Winkler, A. Wysocki and G. Gompper, Soft Matter, 2015, 11, 6680–6691.
- Fily et al. (2017) Y. Fily, Y. Kafri, A. P. Solon, J. Tailleur and A. Turner, Journal of Physics A: Mathematical and Theoretical, 2017, 51, 044003.
- Solon et al. (2015) A. P. Solon, Y. Fily, A. Baskaran, M. E. Cates, Y. Kafri, M. Kardar and J. Tailleur, Nature Physics, 2015, 11, 673 EP –.
- Nikola et al. (2016) N. Nikola, A. P. Solon, Y. Kafri, M. Kardar, J. Tailleur and R. Voituriez, Phys. Rev. Lett., 2016, 117, 098001.
- Marini Bettolo Marconi et al. (2016) U. Marini Bettolo Marconi, C. Maggi and S. Melchionna, Soft Matter, 2016, 12, 5727–5738.
- Patch (2018) A. E. Patch, PhD thesis, 2018.
- Speck and Jack (2016) T. Speck and R. L. Jack, Phys. Rev. E, 2016, 93, 062605.
- Patch et al. (2017) A. Patch, D. Yllanes and M. C. Marchetti, Phys. Rev. E, 2017, 95, 012601.
- Patch et al. (2018) A. Patch, D. M. Sussman, D. Yllanes and M. C. Marchetti, Soft Matter, 2018, 14, 7435–7445.
- Jamali and Naji (2018) T. Jamali and A. Naji, Soft Matter, 2018, 14, 4820–4834.
- Das et al. (2019) S. Das, G. Gompper and R. G. Winkler, Scientific reports, 2019, 9, 6608.
- Bialké et al. (2015) J. Bialké, J. T. Siebert, H. Löwen and T. Speck, Phys. Rev. Lett., 2015, 115, 098301.
- Paliwal et al. (2017) S. Paliwal, V. Prymidis, L. Filion and M. Dijkstra, The Journal of chemical physics, 2017, 147, 084902.
- Prymidis et al. (2016) V. Prymidis, S. Paliwal, M. Dijkstra and L. Filion, The Journal of chemical physics, 2016, 145, 124904.
- Solon et al. (2018) A. P. Solon, J. Stenhammar, M. E. Cates, Y. Kafri and J. Tailleur, New Journal of Physics, 2018, 20, 075001.
- del Junco and Vaikuntanathan (2019) C. del Junco and S. Vaikuntanathan, The Journal of Chemical Physics, 2019, 150, 094708.
- Cagnetta et al. (2020) F. Cagnetta, M. R. Evans and D. Marenduzzo, EPJ Web of Conferences, 2020, p. 00001.
- Zakine et al. (2020) R. Zakine, Y. Zhao, M. Knežević, A. Daerr, Y. Kafri, J. Tailleur and F. van Wijland, Phys. Rev. Lett., 2020, 124, 248003.
- Omar et al. (2020) A. K. Omar, Z.-G. Wang and J. F. Brady, Phys. Rev. E, 2020, 101, 012604.
- Takatori and Brady (2015) S. C. Takatori and J. F. Brady, Physical Review E, 2015, 91, 032117.
- Paliwal et al. (2018) S. Paliwal, J. Rodenburg, R. van Roij and M. Dijkstra, New Journal of Physics, 2018, 20, 015003.
- Tjhung et al. (2018) E. Tjhung, C. Nardini and M. E. Cates, Phys. Rev. X, 2018, 8, 031080.
- Guioth and Bertin (2019) J. Guioth and E. Bertin, The Journal of Chemical Physics, 2019, 150, 094108.
- Lee (2017) C. F. Lee, Soft matter, 2017, 13, 376–385.
- Yang et al. (2014) X. Yang, M. L. Manning and M. C. Marchetti, Soft matter, 2014, 10, 6477–6484.
- Sepúlveda and Soto (2017) N. Sepúlveda and R. Soto, Physical review letters, 2017, 119, 078001.
- Sepúlveda and Soto (2018) N. Sepúlveda and R. Soto, Phys. Rev. E, 2018, 98, 052141.
- Ni et al. (2015) R. Ni, M. A. C. Stuart and P. G. Bolhuis, Physical review letters, 2015, 114, 018302.
- Knežević and Stark (2020) M. Knežević and H. Stark, EPL (Europhysics Letters), 2020, 128, 40008.
- (63) Supplementary Information.
- Lauga et al. (2006) E. Lauga, W. R. DiLuzio, G. M. Whitesides and H. A. Stone, Biophysical Journal, 2006, 90, 400 – 412.
- Elgeti and Gompper (2013) J. Elgeti and G. Gompper, EPL (Europhysics Letters), 2013, 101, 48003.
- Hall-Stoodley et al. (2004) L. Hall-Stoodley, J. W. Costerton and P. Stoodley, Nature reviews microbiology, 2004, 2, 95.
- Keller et al. (2019) N. Keller, J. Bruchmann, T. Sollich, C. Richter, R. Thelen, F. Kotz, T. Schwartz, D. Helmer and B. E. Rapp, ACS applied materials & interfaces, 2019, 11, 4480–4487.
- Hartmann et al. (2019) R. Hartmann, P. K. Singh, P. Pearce, R. Mok, B. Song, F. Díaz-Pascual, J. Dunkel and K. Drescher, Nature Physics, 2019, 15, 251–256.
- Wysocki and Rieger (2020) A. Wysocki and H. Rieger, Phys. Rev. Lett., 2020, 124, 048001.
- Kaiser et al. (2012) A. Kaiser, H. H. Wensink and H. Löwen, Phys. Rev. Lett., 2012, 108, 268307.
- Kumar et al. (2019) N. Kumar, R. K. Gupta, H. Soni, S. Ramaswamy and A. K. Sood, Phys. Rev. E, 2019, 99, 032605.
- Magiera and Brendel (2015) M. P. Magiera and L. Brendel, Phys. Rev. E, 2015, 92, 012304.
- Wu et al. (2018) J.-C. Wu, K. Lv, W.-W. Zhao and B.-Q. Ai, Chaos: An Interdisciplinary Journal of Nonlinear Science, 2018, 28, 123102.
- Reichhardt and Reichhardt (2017) C. Reichhardt and C. J. O. Reichhardt, Journal of Physics: Condensed Matter, 2017, 30, 015404.
- Daddi-Moussa-Ider et al. (2019) A. Daddi-Moussa-Ider, B. Liebchen, A. M. Menzel and H. Löwen, New Journal of Physics, 2019, 21, 083014.
- Daddi-Moussa-Ider et al. (2019) A. Daddi-Moussa-Ider, S. Goh, B. Liebchen, C. Hoell, A. J. Mathijssen, F. Guzmán-Lastra, C. Scholz, A. M. Menzel and H. Löwen, The Journal of chemical physics, 2019, 150, 064906.
- Kirkwood and Buff (1949) J. G. Kirkwood and F. P. Buff, The Journal of Chemical Physics, 1949, 17, 338–343.
- Nijmeijer et al. (1990) M. Nijmeijer, C. Bruin, A. Bakker and J. Van Leeuwen, Physical Review A, 1990, 42, 6052.
- Weeks et al. (1971) J. D. Weeks, D. Chandler and H. C. Andersen, The Journal of Chemical Physics, 1971, 54, 5237–5247.
- de Gennes et al. (2004) P.-G. de Gennes, F. Brochard-Wyart and D. Quéré, in Capillarity: Deformable Interfaces, Springer New York, New York, NY, 2004, pp. 1–31.