A New Optimized Quasihelically Symmetric Stellarator
Abstract
A new optimized quasihelically symmetric configuration is described that has the desirable properties of improved energetic particle confinement, reduced turbulent transport by 3D shaping, and non-resonant divertor capabilities. The configuration presented in this paper is explicitly optimized for quasihelical symmetry, energetic particle confinement, neoclassical confinement, and stability near the axis. Post optimization, the configuration was evaluated for its performance with regard to energetic particle transport, ideal magnetohydrodynamic (MHD) stability at various values of plasma pressure, and ion temperature gradient instability induced turbulent transport. The effect of discrete coils on various confinement figures of merit, including energetic particle confinement, are determined by generating single-filament coils for the configuration. Preliminary divertor analysis shows that coils can be created that do not interfere with expansion of the vessel volume near the regions of outgoing heat flux, thus demonstrating the possibility of operating a non-resonant divertor.
1 Introduction
This paper discusses results from optimizations to produce quasihelically symmetric (QHS) equilibria that simultaneously demonstrate multiple desirable properties for advanced stellarators. These properties include excellent neoclassical and energetic particle confinement, a reduction in turbulent transport, and a functional non-resonant divertor (Bader et al., 2017; Boozer & Punjabi, 2018). The baseline targets for the configuration also avoided low order rational surfaces, and included a vacuum magnetic well to avoid interchange instabilities. In this paper, we present a configuration that includes both the desired confinement and global macroscopic properties.
Optimization studies of stellarators have a long and rich history(Grieger et al., 1992). The two constructed optimized stellarator experiments to date are the quasihelically (QH) symmetric Helically Symmetric eXperiment (HSX) (Anderson et al., 1995) and the quasi-omnigenous Wendelstein 7-X (W7-X) (Beidler et al., 1990). Examples of quasiaxisymmetric (QA) stellarator concepts are the National Compact Stellarator eXperiment (NCSX) (Zarnstorff et al., 2001) and the Chinese First Quasi-axisymmetric Stellarator (Shimizu et al., 2018). Optimized stellarator configurations have also been the focus of reactor concepts. These include the ARIES-CS project (Ku et al., 2008) adapted from the NCSX design, the HELIAS reactor concept (Beidler et al., 2001) adapted from W7-X, and the Stellarator Pilot Plant Study (Miller et al., 1996) a QH configuration adapted from HSX.
Improvements in optimization tools have led to new configuration designs. These advances come in several forms including the identification of new QA configurations (Henneberg et al., 2019b). Advances in theoretical understanding have produced mechanisms for optimization in the areas of turbulent transport (Mynick et al., 2010; Xanthopoulos et al., 2014; Hegna et al., 2018), energetic particle transport (Bader et al., 2019; Henneberg et al., 2019a), and non-resonant divertors (Bader et al., 2018). Also, construction of optimized equilibria from first principles has been demonstrated for quasisymmetric stellarators (Landreman & Sengupta, 2018; Landreman et al., 2019) and quasi-omnigenous stellarators (Plunk et al., 2019).
The structure of the paper is as follows. Section 2 provides a more detailed description of the optimization process for stellarators. Section 3 describes the generation of coils for the device. In section 4, detailed properties of the device are examined. These include, in order, energetic particle transport, turbulent transport, MHD stability, and divertor construction. A conclusion and a description of future work is given in section 5. Additionally Appendix A provides a description of an optimized configuration evaluated for a midscale device.
2 Optimization
Typically, stellarators are optimized by representing the plasma boundary in a two-dimensional Fourier series and perturbing that boundary in an optimization scheme. The boundaries for stellarator symmetric equilibria are given as,
| (1) |
Here represent a cylindrical coordinate system, is a poloidal-like variable, and , are the Fourier coefficients for the th poloidal and th toroidal mode numbers. This representation enforces stellarator symmetry, as is commonly used in stellarator design.
Using the boundary defined in 1 and profiles for the plasma pressure and current, the equilibrium can be solved for at all points inside the boundary. Equilibrium solutions in this paper are calculated using the Variational Moments Equilibrium Code (VMEC) (Hirshman & Whitson, 1983). The full equilibrium can then be evaluated for various properties of interest and the overall performance of the configuration can thus be determined.
Optimization of the equilibrium is performed by the ROSE (Rose Optimizes Stellarator Equilibria) code (Drevlak et al., 2018). ROSE evaluates boundaries by first computing a VMEC equilibrium solution and then applying user defined metrics with appropriate weights. A target function for the equilibrium is computed as
| (2) |
Here, and represent the arrays of the and coefficients that define the boundary. The summation is over the different penalty functions, the s, chosen by the user, each of which has a weight, , a target, and a function which determines whether the penalty function is a target or a constraint. A target function tries to minimize while a constraint only requires either or .
The variation of the boundary coefficients, and is performed through an optimization algorithm. For the resulting configuration shown here, Brent’s algorithm is used (Brent, 2013). Additional details of this optimization technique can be found in (Drevlak et al., 2018; Henneberg et al., 2019b) and results for similar optimizations of quasisymmetric stellarators can be found in (Ku et al., 2008).
The optimization for this new quasihelically symmetric configuration is an extension of a scheme that focused on improved energetic particle transport (Bader et al., 2019). For the new optimization, a four field period device is chosen. The six metrics included in this optimization are the following:
-
•
The deviation from quasisymmetry, where the quantity to be minimized is defined as the energy in the non-symmetric modes normalized to some reference field, here the field on axis. In more detail, the configuration is converted into Boozer coordinates (Boozer, 1981) and the magnitude of the magnetic field strength is represented in a discrete Fourier series with coefficients . Then the quasisymmetry deviation for a four field period device is calculated as,
(3) where is the field on axis.
-
•
The metric is a proxy for energetic particle confinement (Nemov et al., 2008). In brief, this metric seeks to align contours of the second adiabatic invariant, with flux surfaces. Its viability in producing configurations with excellent energetic ion confinement was demonstrated in (Bader et al., 2019).
-
•
A magnetic well (Greene, 1997), where present, provides stability against interchange modes. Because finite effects in quasihelical symmetry tend to deepen magnetic wells, it suffices to have a vacuum magnetic well of any strength. In this optimization, the vacuum well was required to exist at the magnetic axis, but was not optimized further beyond that.
-
•
The rotational transform profile was chosen to avoid low order rational surfaces, and to be sufficiently high above the = 1 surface to avoid a resonance when nominal amounts of plasma current are added.
-
•
The aspect ratio of the configuration was fixed at the starting aspect ratio of 6.7. No deviations to the aspect ratio were allowed beyond that value.
-
•
The neoclassical transport metric, (Nemov et al., 1999) is required to remain below some nominal value, here 0.01. In practice, adequate quasisymmetry enforces this constraint automatically. In addition, proxies that attempt to align the maxima and minima values of the magnetic field strength on a field line were also employed in the optimizations. These proxies compute the contour of maximum (or minimum) magnetic field on a surface and seek to minimize the variance of the magnetic field strength on that contour.
-
•
Although not explicitly optimized for, it was desired that the configuration has lower turbulent transport for the same profile values relative to that in HSX. Explicit optimization for turbulent transport is a subject of future work.
2.1 Configuration characteristics
A new optimized configuration, hereby termed the WISTELL-A configuration, has been generated through the optimization procedures described above. Figure 1 shows some of the properties of the configuration. Contours of the vacuum magnetic field strength on the boundary are shown in figure 1a. The helical nature of the magnetic field strength, a feature of quasihelical symmetry, is clearly seen. Figure 1b shows toroidal cuts of the boundary surface at toroidal angles 0, and , colloquially referred to as the "bean", "teardrop" and "triangle" surfaces respectively. Shown are both the vacuum boundary surfaces (red) and the surfaces with normalized plasma pressure . The surfaces with finite pressure are generated by a free boundary solution using coils and self consistent bootstrap current. The procedure will be described in section 4.3. The finite pressure boundary is somewhat smaller than the vacuum boundary. Figure 1c shows the Boozer spectrum for the vacuum equilibrium where the mode has been suppressed. The mode is dominant, which is expected for a four-period quasihelically symmetric equilibrium. The largest nonsymmetric modes are the mirror mode at and the mode. Note that the mode is also symmetric. Figure 1d shows the rotational transform profile both for vacuum at %. The dashed black lines represent the major low order rational surfaces that should be avoided, these are the = 1.0 and = 4/3 surfaces. The configuration passes through the = 8/7 surface at the edge in the vacuum configuration. This vacuum surface can possibly be used to test island divertor features, which will be discussed in section 4.4. The blue dotted line in figure 1d represents the rotational transform profile at %. As can be seen, the minimum of the rotational transform profile is just above the surface.
In addition, we note some derived features of the configuration. In figure 2, we show the neoclassical transport, as quantified by the metric, the quasisymmetry deviation, as described in equation 3, and the metric for vacuum configurations. In order to provide a baseline for comparison, we include the same quantities calculated for the HSX equilibrium (black). HSX has better values obtained for the quasisymmetry metric, but slightly worse values for and over the majority of the minor radius. In addition to the optimized vacuum configuration, we also show the quantities for the vacuum fields produced by filamentary coils. The results here show that the configuration produced with coils does a very good job at reproducing the important qualities of the equilibrium.
3 Coil construction
Coils to reproduce the vacuum boundary were produced by the FOCUS code (Zhu et al., 2018) using an initial coil set generated by the REGCOIL code (Landreman, 2017). The FOCUS code targets the average normal field on the magnetic boundary (a quantity to minimize) and the minimal radius of curvature for the coils (a quantity to maximize). A representation of the coils are given in figure 3 along with the magnetic field magnitude on the boundary.
Of particular importance is the fact that the FOCUS code does not require a specified coil winding surface, and is therefore able to move the coils further from the plasma in regions where the reliability of reproducing the configuration is less sensitive to the coil position. The ability to optimize without being confined to a winding surface is a new capability within FOCUS that was not available for the coil sets designed for HSX and W7-X. Previous results showed that areas of low sensitivity can be calculated for stellarator equilibria using shape gradients (Landreman & Paul, 2018). Fortuitously, these regions of low sensitivity are also the areas were divertor heat fluxes tend to exit the plasma (Bader et al., 2017), allowing for the construction of a non-resonant divertor as described in section 4.4.
4 Performance evaluation
The performance of the configuration is evaluated in several topical areas. These include confinement of energetic particles evaluated by Monte Carlo analysis, turbulent transport evaluated by non-linear GENE simulations (Jenko et al., 2000), stability at finite pressure evaluated by COBRAVMEC (Sanchez et al., 2000), and an initial attempt at edge transport and divertor behavior evaluated by EMC3-EIRENE (Feng et al., 2004).
4.1 Energetic particles
Energetic particle optimization was obtained in these configurations by targeting the metric that seeks to align contours of the second adiabatic invariant, with flux surfaces. The calculation for is given in Nemov et al. (2008, Eq. 61) as
| (4) |
where the electric field contribution is ignored and the arbitrary reference field . The quantity is
| (5) |
Here, is the bounce averaged radial drift, is the bounce averaged poloidal drift. The ratio is the key quantity to minimize. A method to calculate from geometrical quantities of the magnetic field line is described in Nemov et al. (2008, Eq. 51). The summation in eq. 4 is taken over all the wells for a suitably long field-line. In our case between 60 and 100 toroidal transits were used. The calculation considers trapping wells encountered by all possible trapped-particle pitch angles, with representing a normalized value of the reflecting field. The bounce time for a particle in a specific magnetic well is given by . The parameters and are the maximum and minimum magnetic field strength on the flux surface.
Previously, equilibria in ROSE were optimized by simultaneously minimizing and the quasihelical symmetry deviation. This resulted in configurations with very low collisionless particle losses (Bader et al., 2019). However, calculations to assess energetic confinement used ideal, fixed boundary equilibria and did not include the effects of coils. For the following evaluation of our new configuration, energetic particle transport is calculated using the magnetic field structure produced from the filamentary coils presented in Sec. 3.
To evaluate energetic particle transport, the transport of fusion-born alpha particles are examined in a configuration scaled to the ARIES-CS volume (450 m3) and on-axis field strength (5.7 T). We choose a flux surface and distribute the alpha particles on the flux surface such that they properly resemble a distribution of alpha particles. The evaluation is done with the ANTS code (Drevlak et al., 2014), which constructs a magnetic field grid in cylindrical coordinates. Therefore, ANTS is well suited to evaluate both the ideal equilibrium and the equilibrium produced by the filamentary coils. In both cases, 5000 particles are included in the evaluation for each flux surface for 200 ms. Previous calculations indicated that 5000 particles per flux surface were sufficient for Monte-Carlo statistical purposes (Bader et al., 2019). These calculations only consider the vacuum fields, and improvements with finite pressure and plasma currents are left for future optimization studies. Similarly, calculations including collisional effects are left for future analyses.
The results for the energetic particle confinement are shown both with and without coils in figure 4. The confinement does deteriorate slightly with the presence of coils. Some particles are lost at whereas in the ideal case, no particles are lost. The losses just outside the mid-radius, at increase from 1.2% in the ideal case to 1.7% in the configuration with coils.
The lost particles can be shown as a function of starting pitch angle at in figure 5. Here, the x-axis represents the field at which the particle reflects, where and are the particle’s energy and magnetic moment. Low values of represent deeply trapped particles, and high values of represent particles near the trapped-passing boundary. The trapped passing boundary is indicated with a vertical dashed line. All passing particles are confined.
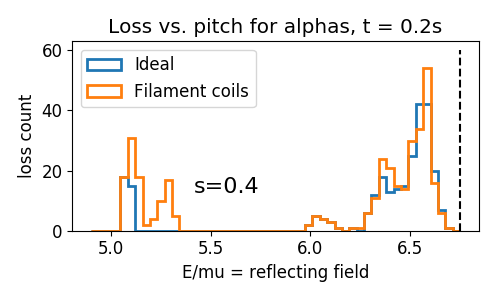
As is clear from the results in figure 5, most of the particle losses are from particles near the trapped-passing boundary. However, there are a few additional losses of deeply trapped particles, and from particles somewhat further from the trapped passing boundary, at .
4.2 Turbulent Transport
Improving turbulent transport is a key area for stellarator research. Recent results from W7-X indicate turbulent transport determines the overall energy and particle confinement (Pablant et al., 2020). The dominance of turbulent transport in optimized stellarators had also been previously shown for HSX plasmas (Canik et al., 2007). The configuration presented here is not explicitly optimized for turbulent transport. However, previous gyrokinetic calculations indicate that quasihelically symmetric configurations demonstrate enhanced nonlinear energy transfer properties over other optimized configurations (Plunk et al., 2017; McKinney et al., 2019). It is anticipated that future iterations will include optimization of nonlinear turbulent energy transfer using a novel metric modeling turbulent energy transfer to stable modes (Hegna et al., 2018; Faber, 2020). Despite the lack of the turbulence metric in the optimization scheme, some aspects of the turbulence properties can be deduced from analyzing the equilibrium.
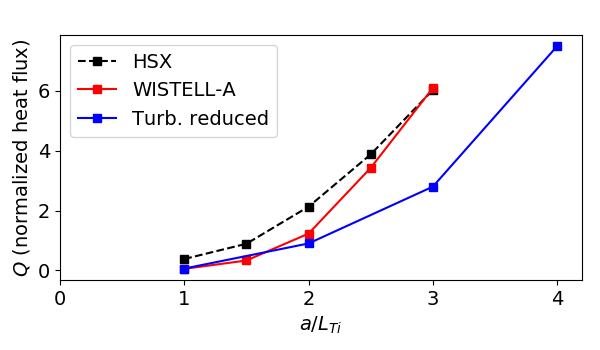
Non-linear flux-tube gyrokinetic calculations were performed to describe ion temperature gradient (ITG) turbulence at the surface using the Gene code (Jenko et al., 2000) for various values of the ion temperature scale length, assuming adiabatic electrons. In figure 6, the heat flux for WISTELL-A are compared to two other configurations, the HSX configuration which has been well-analyzed for turbulent transport (Faber et al., 2015; Pueschel et al., 2016; Faber et al., 2018; McKinney et al., 2019), and a third “turbulent reduced” configuration, which was the result of a separate optimization calculation. The turbulence reduced configuration is identical to the configuration in (Bader et al., 2019) labeled "Opt. for QHS and ." It possessed favorable energetic particle properties, but did not possess a vacuum magnetic well, and thus was not considered as a viable configuration. Nevertheless, the turbulent properties of this configuration are of interest. The results show that WISTELL-A reduces turbulent heat flux relative to HSX in the low ion temperature scale length regime. However, for , the heat flux is comparable to that of HSX. The turbulence-reduced configuration, on the other hand, demonstrates reduced heat flux across a range of and a dramatic reduction in heat flux from HSX and WISTELL-A at .
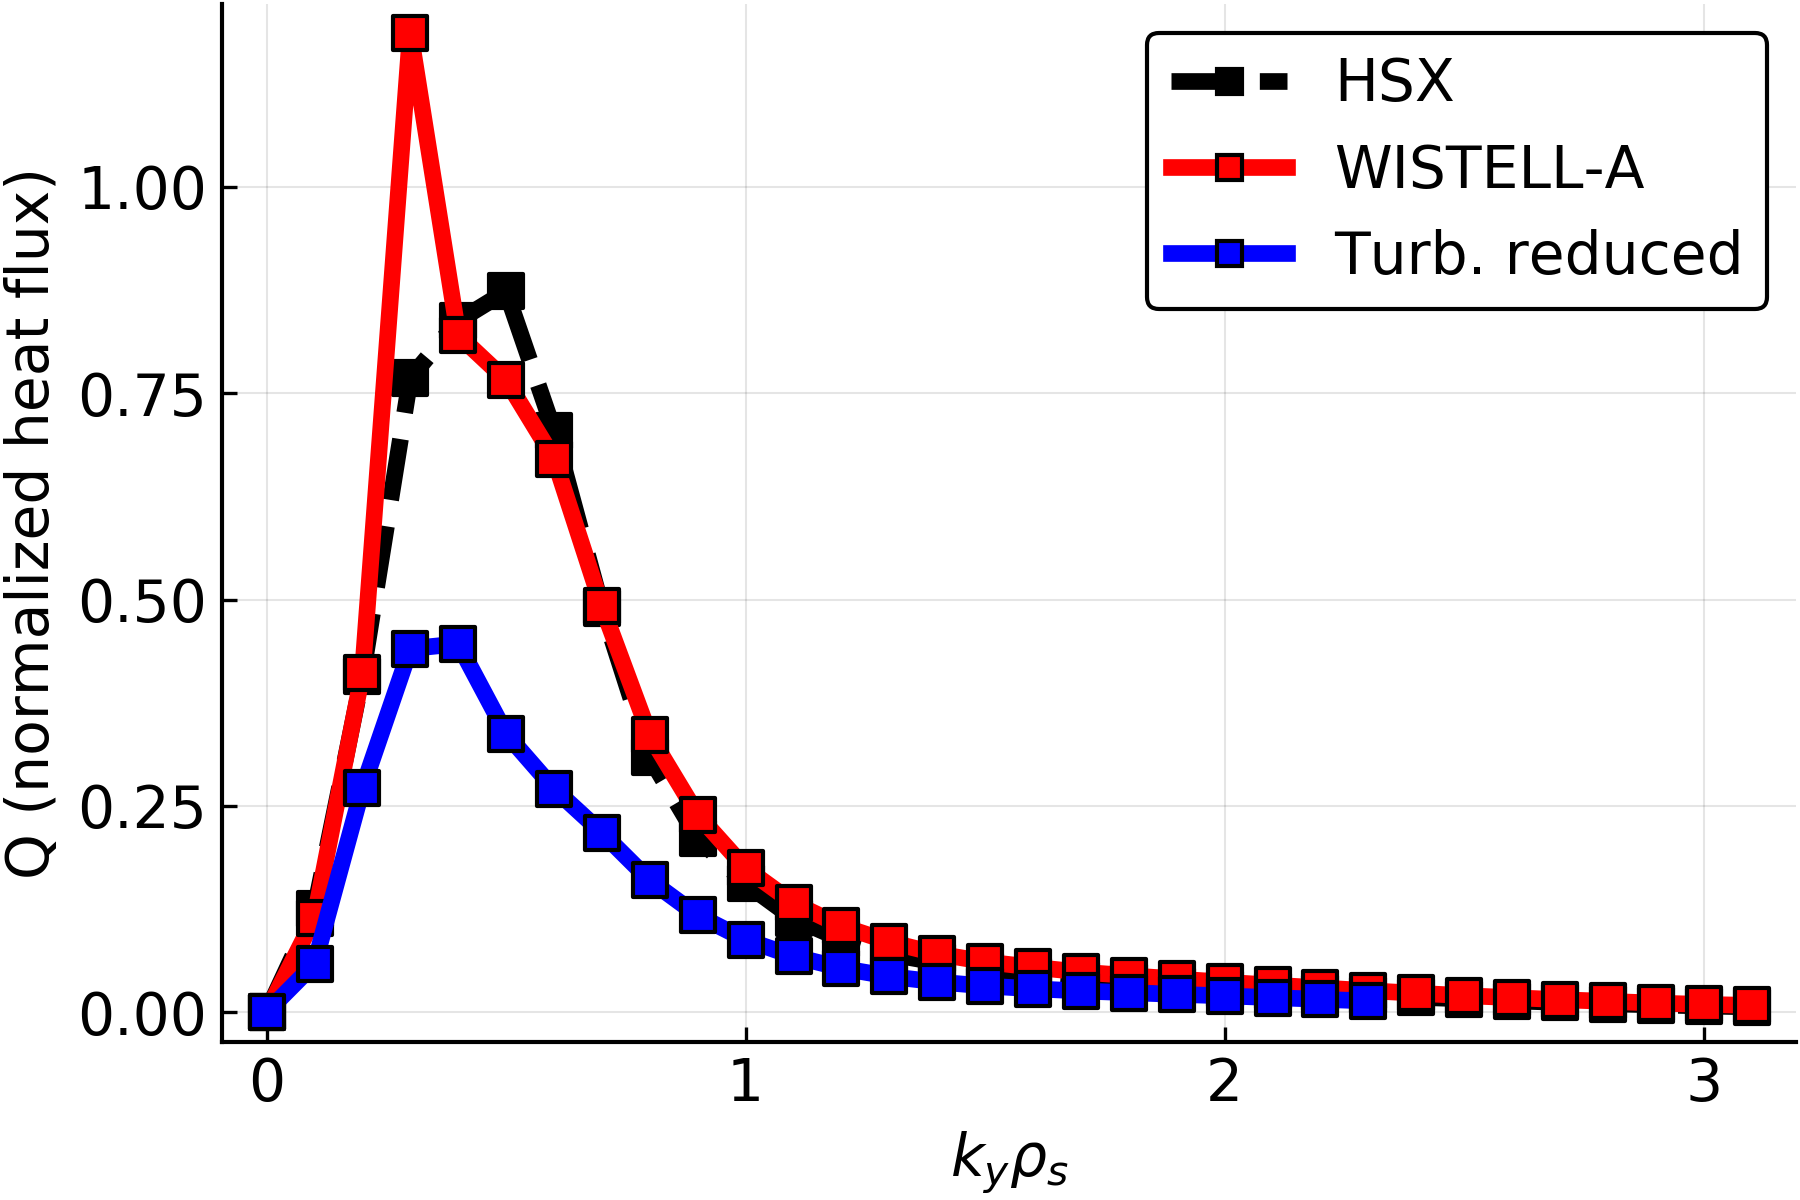
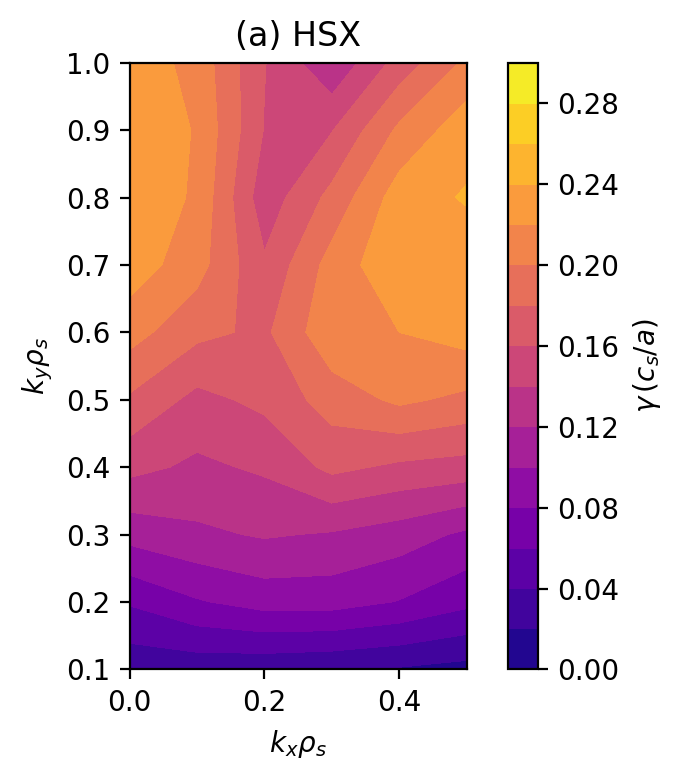
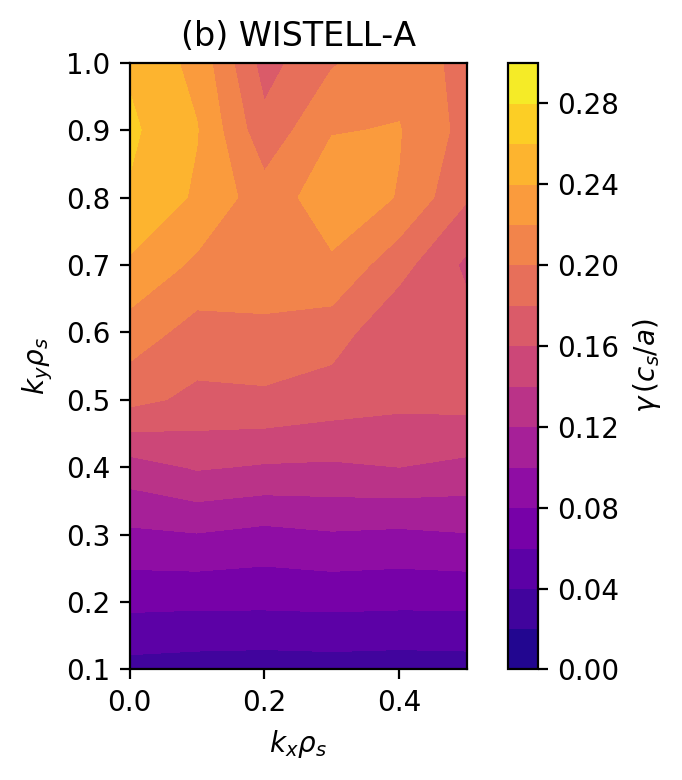
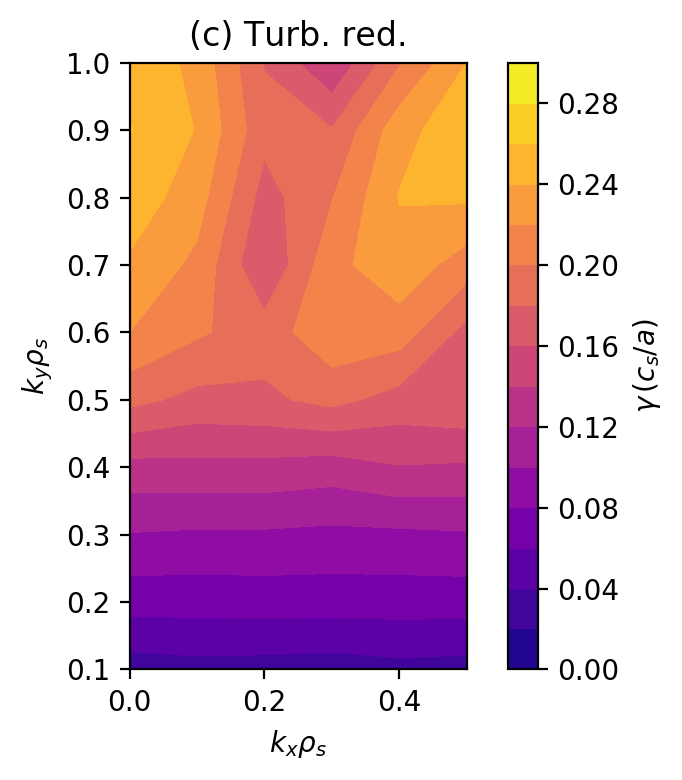
Analysis of the turbulence at for each configuration indicates that the differences in the ion heat flux values at are not associated with changes in the linear ITG instability spectrum. Figure 7 shows the heat flux at for each configuration as a function of . The HSX and WISTELL-A show similar heat flux spectra, with the flux peaking at . The prominent feature in the WISTELL-A flux spectrum at has been previously observed and analyzed in gyrokinetic simulations of HSX (Faber et al., 2015, 2018) and while large in value, does not contribute substantially to the bulk of the heat flux. More strikingly, the bulk of the heat flux spectrum in the turbulent reduced configuration is down-shifted in from to . The linear growth rate spectra as a function of for each configuration at is shown in figure 8. Visual inspection of the growth rate spectra indicates there is little difference in the dominant linear instability between each configuration, and in fact, the turbulence-reduced configuration (figure 8c) has larger growth rates than either HSX or WISTELL-A. This observation is supported more directly by using the eigenmode data from Fig. 8 in a quasilinear heat flux calculation using the model described in Pueschel et al. (2016, Eq. 2), which is reproduced here:
| (6) |
The linear growth rate is calculated from a linear Gene simulation at normalized perpendicular wavenumber and produces an eigenmode , where is the field-line-following coordinate. The Jacobian along the field line is given by and each contribution to the sum is weighted by , where and are the calculated linear gyrokinetic heat flux and density perturbations from Gene. The normalizing coefficient is fit to a nonlinear gyrokinetic heat flux calculation and is the normalized temperature gradient; only ratios of will be considered here to avoid model ambiguity. The quasilinear calculation predicts the heat flux for the turbulence reduced configuration should actually be larger than for HSX at by a factor of approximately 1.1. This does not agree with the nonlinear gyrokinetic heat fluxes shown in Fig. 6. The discrepancy between the linear growth rates and the full nonlinear heat flux is consistent with trends found in McKinney et al. (2019). The results presented here also indicate that linear growth rates can be a misleading indicator for stellarator turbulence and turbulent transport. Furthermore, these results suggest that the turbulence-reduced configuration possesses enhanced turbulence saturation mechanisms.
To make a preliminary assessment of the turbulence saturation characteristics, the turbulence saturation theory from Hegna et al. (2018) will be applied. A crucial aspect of the this theory is the supposition that the dominant nonlinear physics involves energy transfer from unstable to damped eigenmodes at comparable wavenumbers. This is accomplished through a three-wave interaction quantified by a triplet correlation lifetime between unstable and stable ITG modes as defined in Hegna et al. (2018, Eq. 104) by
| (7) |
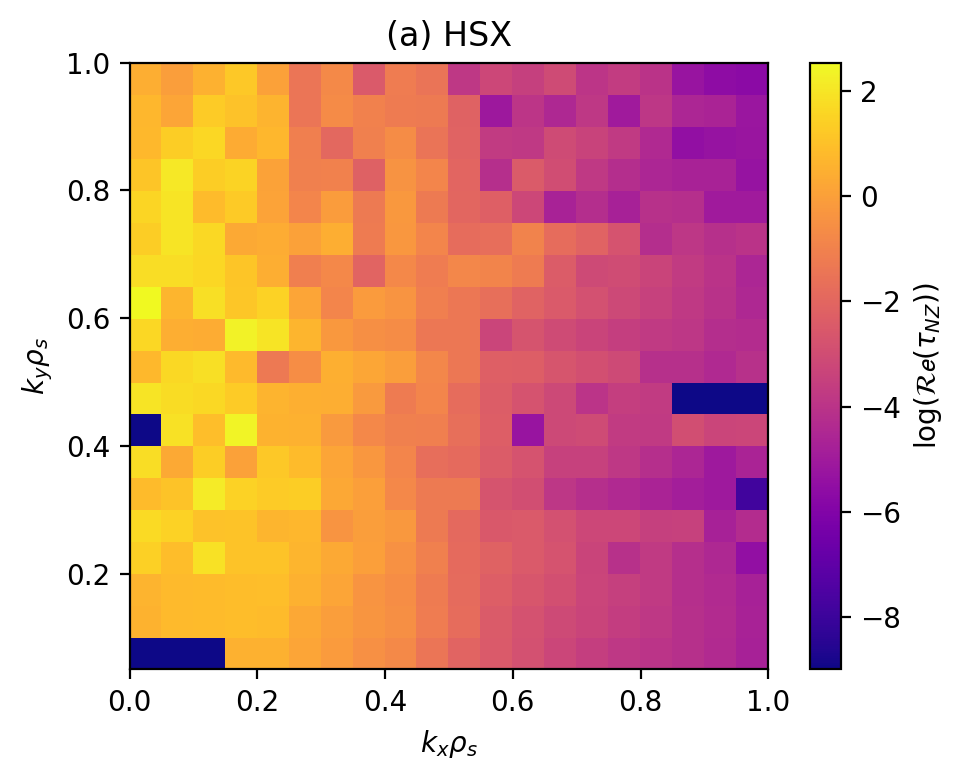
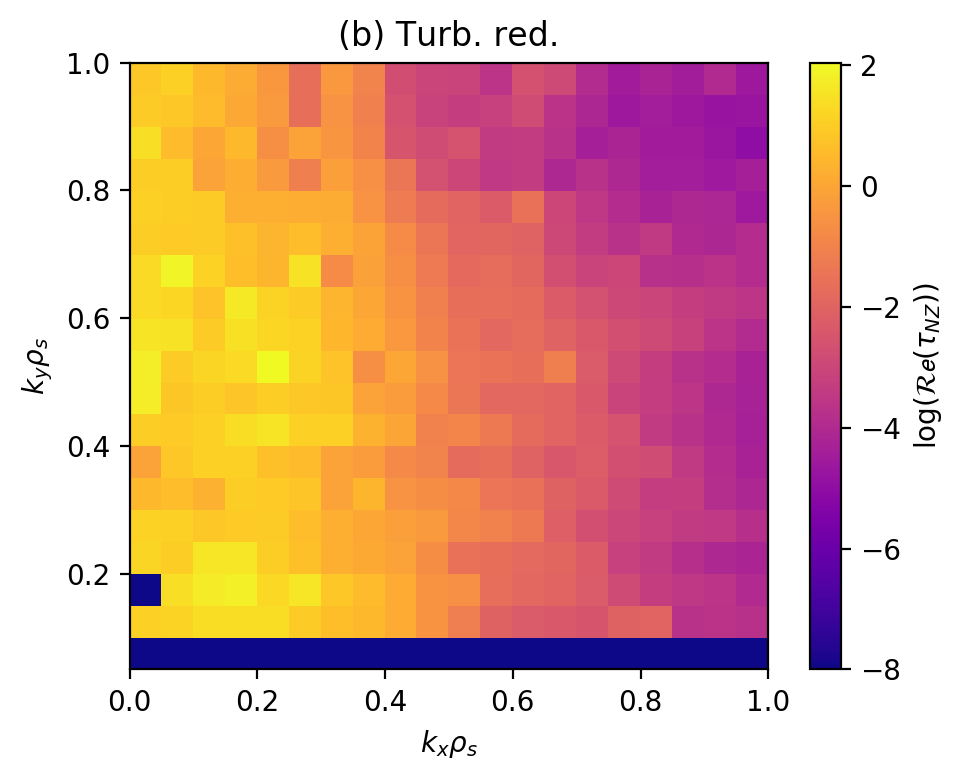
where is the complex linear ITG frequency at normalized wavenumber . Large values of the triplet lifetimes suggest energy can be very effectively transferred out of turbulent-transport-inducing instabilities into damped eigenmodes that either dissipate energy or transfer it back to the bulk distribution function. High values of correspond to lowered turbulent fluctuation levels and correspondingly reduced turbulent transport. In figure 9, the triplet correlation lifetimes are shown for the HSX and the turbulence optimized configuration. Importantly, the turbulence-reduced configuration shows larger triplet correlation lifetimes in the region compared to HSX, where the larger correlation lifetimes are observed at higher . This is an important difference, as instabilities at larger scales (smaller ) can more easily contribute to turbulent transport. Thus, larger triplet correlation lifetimes at smaller where at least one unstable and one stable mode are involved suggests energy is being transferred more efficiently from the modes driving the fluctuation spectrum to dissipation and thus lowering the contribution to turbulent transport at that . This may be contributing to both the decrease in overall transport in figure 6 and the downshift in heat flux spectrum in figure 7 between HSX and the turbulence-reduced configuration. The connections between nonlinear turbulent heat flux, quasilinear turbulent heat flux, and the triplet correlation lifetimes are summarized in table 1. The triplet correlation lifetimes for each configuration are quantified by computing a spectral average defined as
| (8) |
The weighting factor is a turbulent fluctuation spectrum computed from a characteristic nonlinear gyrokinetic simulation that preferentially weights low contributions to provide consistency with the nonlinear simulations. The decrease in nonlinear flux between HSX and the turbulence reduced configuration by a factor of 2 correlates with an increase in triplet correlation lifetimes by more than a factor of two, while the increase in nonlinear flux between WISTELL-A and HSX correlates with a decrease in triplet correlation lifetimes. This will be explored in more detail in future work, but this result already indicates that quasihelically symmetric configurations with lower ITG-driven transport can be obtained.
| Config. | |||
|---|---|---|---|
| HSX | 1 | 1 | 1 |
| WISTELL-A | 1.1 | 1.05 | 0.76 |
| Turb. red. | 0.5 | 1.1 | 2.85 |
4.3 MHD Stability
The MHD properties of QH stellarators (Nührenberg & Zille, 1988) are somewhat distinct from other classes of optimized stellarators. The relatively reduced connection length (the distance along the field line between and ) implies that QH stellarators have reduced banana widths, reduced orbit drifts for passing particles (Talmadge et al., 2001), smaller Pfrisch-Schlüter (Boozer, 1981; Schmitt et al., 2013) and bootstrap currents (Boozer & Gardner, 1990; Schmitt et al., 2014) and reduced Shafranov shift than an equivalent sized tokamak at the same parameters. This is quantified by the “effective" rotational transform where is the periodicity of the stellarator. Moreover, the bootstrap current in a QH stellarator is in the opposite direction relative to what occurs in a tokamak. This has the consequence of reducing the value of with rising plasma pressure and producing negative in the core region. Negative values of can have beneficial effects for both ideal ballooning (Hegna & Hudson, 2001) and magnetic island physics (Hegna & Callen, 1994).
The only stability quantity constrained in the ROSE optimization is the magnetic well depth as described by , the second derivative of volume with respect to toroidal flux, at the magnetic axis for the vacuum equilibrium. A magnetic well () is necessary for stability against interchange modes. The magnetic well depth at points away from the magnetic axis was not explicitly optimized for, but can be quantified with
| (9) |
For calculations including finite pressure, a pressure profile is assumed where temperature is linear in normalized flux, and the density profile is broad, . Here, and represent the temperature and density at the magnetic axis respectively. The pressure profiles as a function of normalized flux are given in figure 10a. The pressure was varied by varying at fixed = 0.9 , with ranging from 1.3 keV to 3.5 keV. The free-boundary equilibrium was calculated with VMEC using the vacuum magnetic field given by the filamentary coils described in section 3. The self-consistent bootstrap current profiles are calculated using SFINCS (Landreman et al., 2014) in an iterative loop with the VMEC equilibrium. In the neoclassical calculations, a pure plasma with was assumed, and the bootstrap current was calculated at the ambipolar radial electric field. The rotational transform profiles from the VMEC equilibria evaluated for several different pressures are shown in figure 10b.
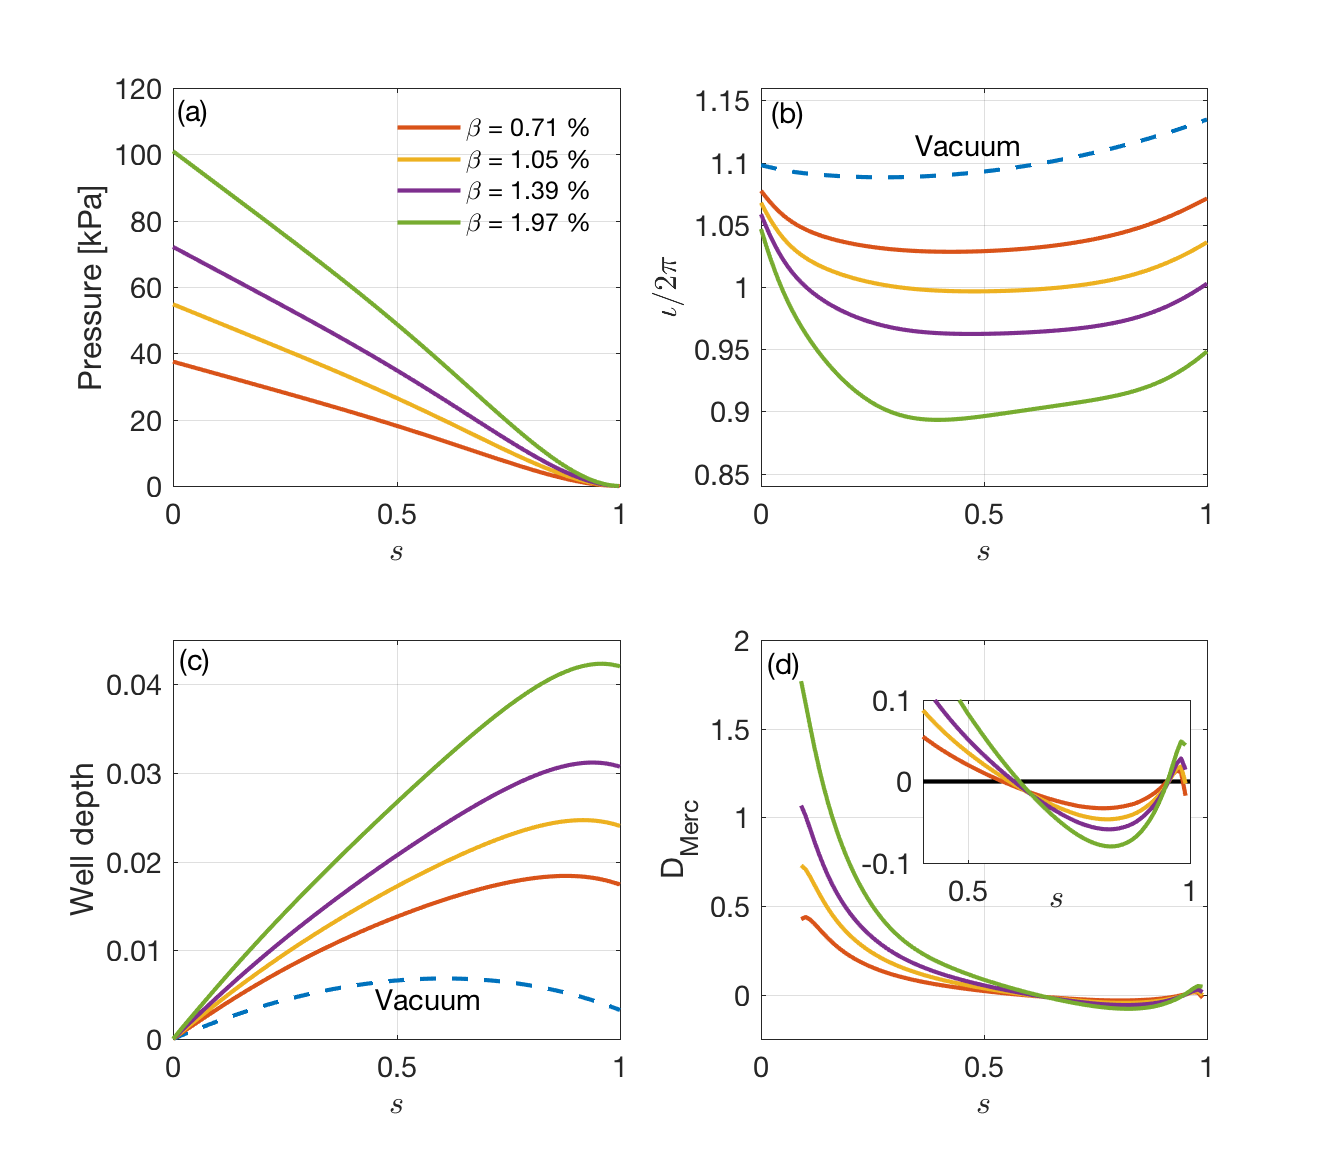
As noted previously, the bootstrap current tends to lower the value of and produce reversed magnetic shear in the core. As seen in figure 10b, the rotational transform profile crosses around when the normalized pressure, . Unless compensated for, this potentially sets an operational limit for this configuration.
With finite beta equilibria, relevant stability metrics can be calculated. The well depths, as given by equation 9 are shown in figure 10c. As seen in the figure, the vacuum configuration has a magnetic well, and the well depth gets larger as the pressure increases. However, a magnetic hill region remains near the plasma edge.
The Mercier criterion is given by the sum (Bauer et al., 1984; Carreras et al., 1988):
| (10) |
where the individual terms in eq. 10 represent contributions (stabilizing or destabilizing) from the shear, magnetic well, current and geodesic curvature and are given by the following:
In the above expressions, and are the toroidal and poloidal magnetic fluxes, is the Jacobian, is the pressure, is the net toroidal current enclosed within a magnetic surface, and the metric element .
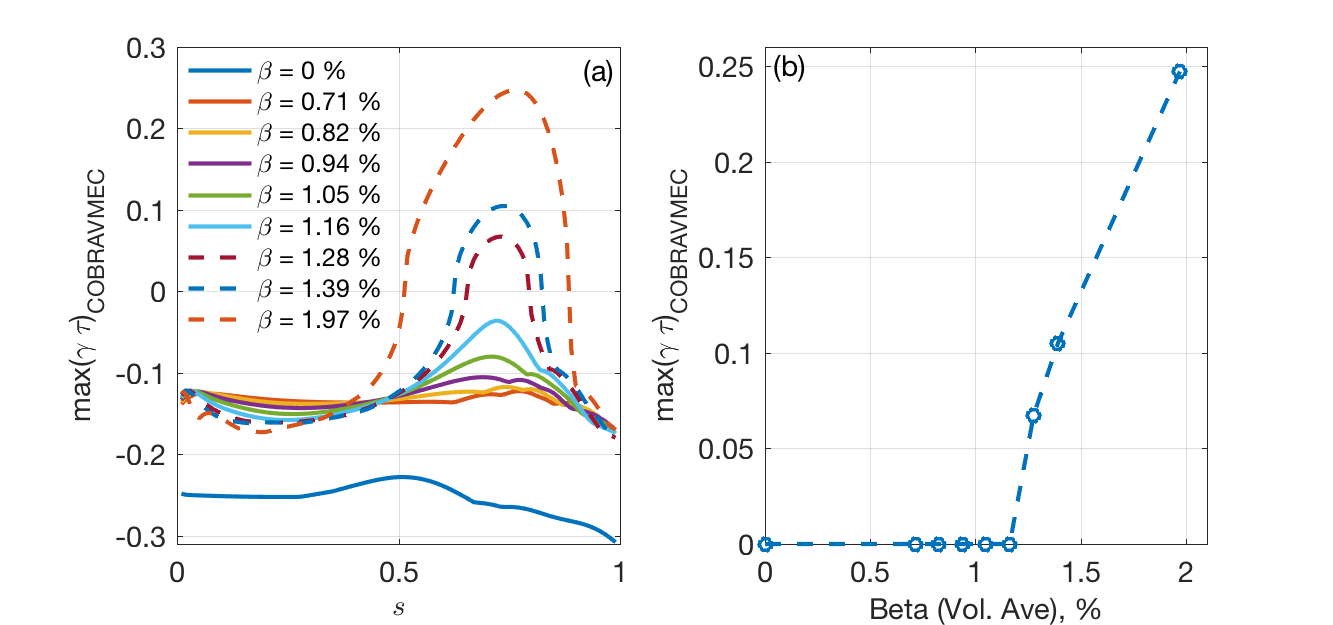
Figure 10d shows the Mercier stability criterion as given by eq. 10 and evaluated by VMEC. All configurations are Mercier stable () for . Calculations of ballooning stability were obtained with COBRAVMEC (Sanchez et al., 2000) and are shown in figure 11. The configuration is stable to ballooning modes up to values of . Ballooning stability is violated at higher values of with the specified pressure profile shape. The region where ballooning instability tends to occur first is near . Higher critical values for ideal ballooning instability can be obtained by tuning the pressure profile. This will be pursued in future work.
While the configuration presented here has only modest MHD stability properties, it is anticipated these properties can be improved through further optimization. However, there is little evidence to support the notion that MHD stability provides any rigorous limit for stellarator operation (Weller et al., 2001). Rather, MHD equilibrium properties are thought to provide a more stringent limit on plasma .
4.4 Divertor
Divertors for quasisymmetric stellarators require either resilience to changes in the plasma current and pressure profiles, or active control mechanisms to ensure proper function of a resonant divertor, often referred to as an island divertor, from startup to the operational point (König et al., 2002). Properties for non-resonant divertors have been explored both theoretically and numerically (Boozer & Punjabi, 2018; Bader et al., 2017, 2018). In this section we present a methodology for constructing such a divertor, and provide a first attempt at what a non-resonant divertor could look like for a quasihelically symmetric stellarator.
The methodology for constructing the divertor is to begin with a wall at some uniform distance from the last closed flux surface. A field line diffusion model can then be used to calculate the strike positions on the wall (Strumberger, 1992; Bader et al., 2017). The model works by distributing field lines uniformly on good internal flux surfaces. Points are followed along the field line but given a random perpendicular displacement in accordance with a specified diffusion parameter. The "diffusive" field lines eventually leave the confined region and terminate on the wall. These exiting field lines are always seen to exit the plasma in regions of high curvature of the last closed flux surface (Strumberger, 1992; Bader et al., 2017).
As noted above, a benefit of the FOCUS code is that it allows the coils to expand away from the plasma in regions where they are not required to be close to the plasma. Fortuitously, the regions of high curvature where strike lines exit are also regions where coil expansion is possible. Therefore, a method for divertor construction is to adjust the uniform wall so it is expanded in these regions. This allows for both longer connection lengths between the plasma and the wall, and some degree of divertor closure, allowing for access to high neutral pressure.
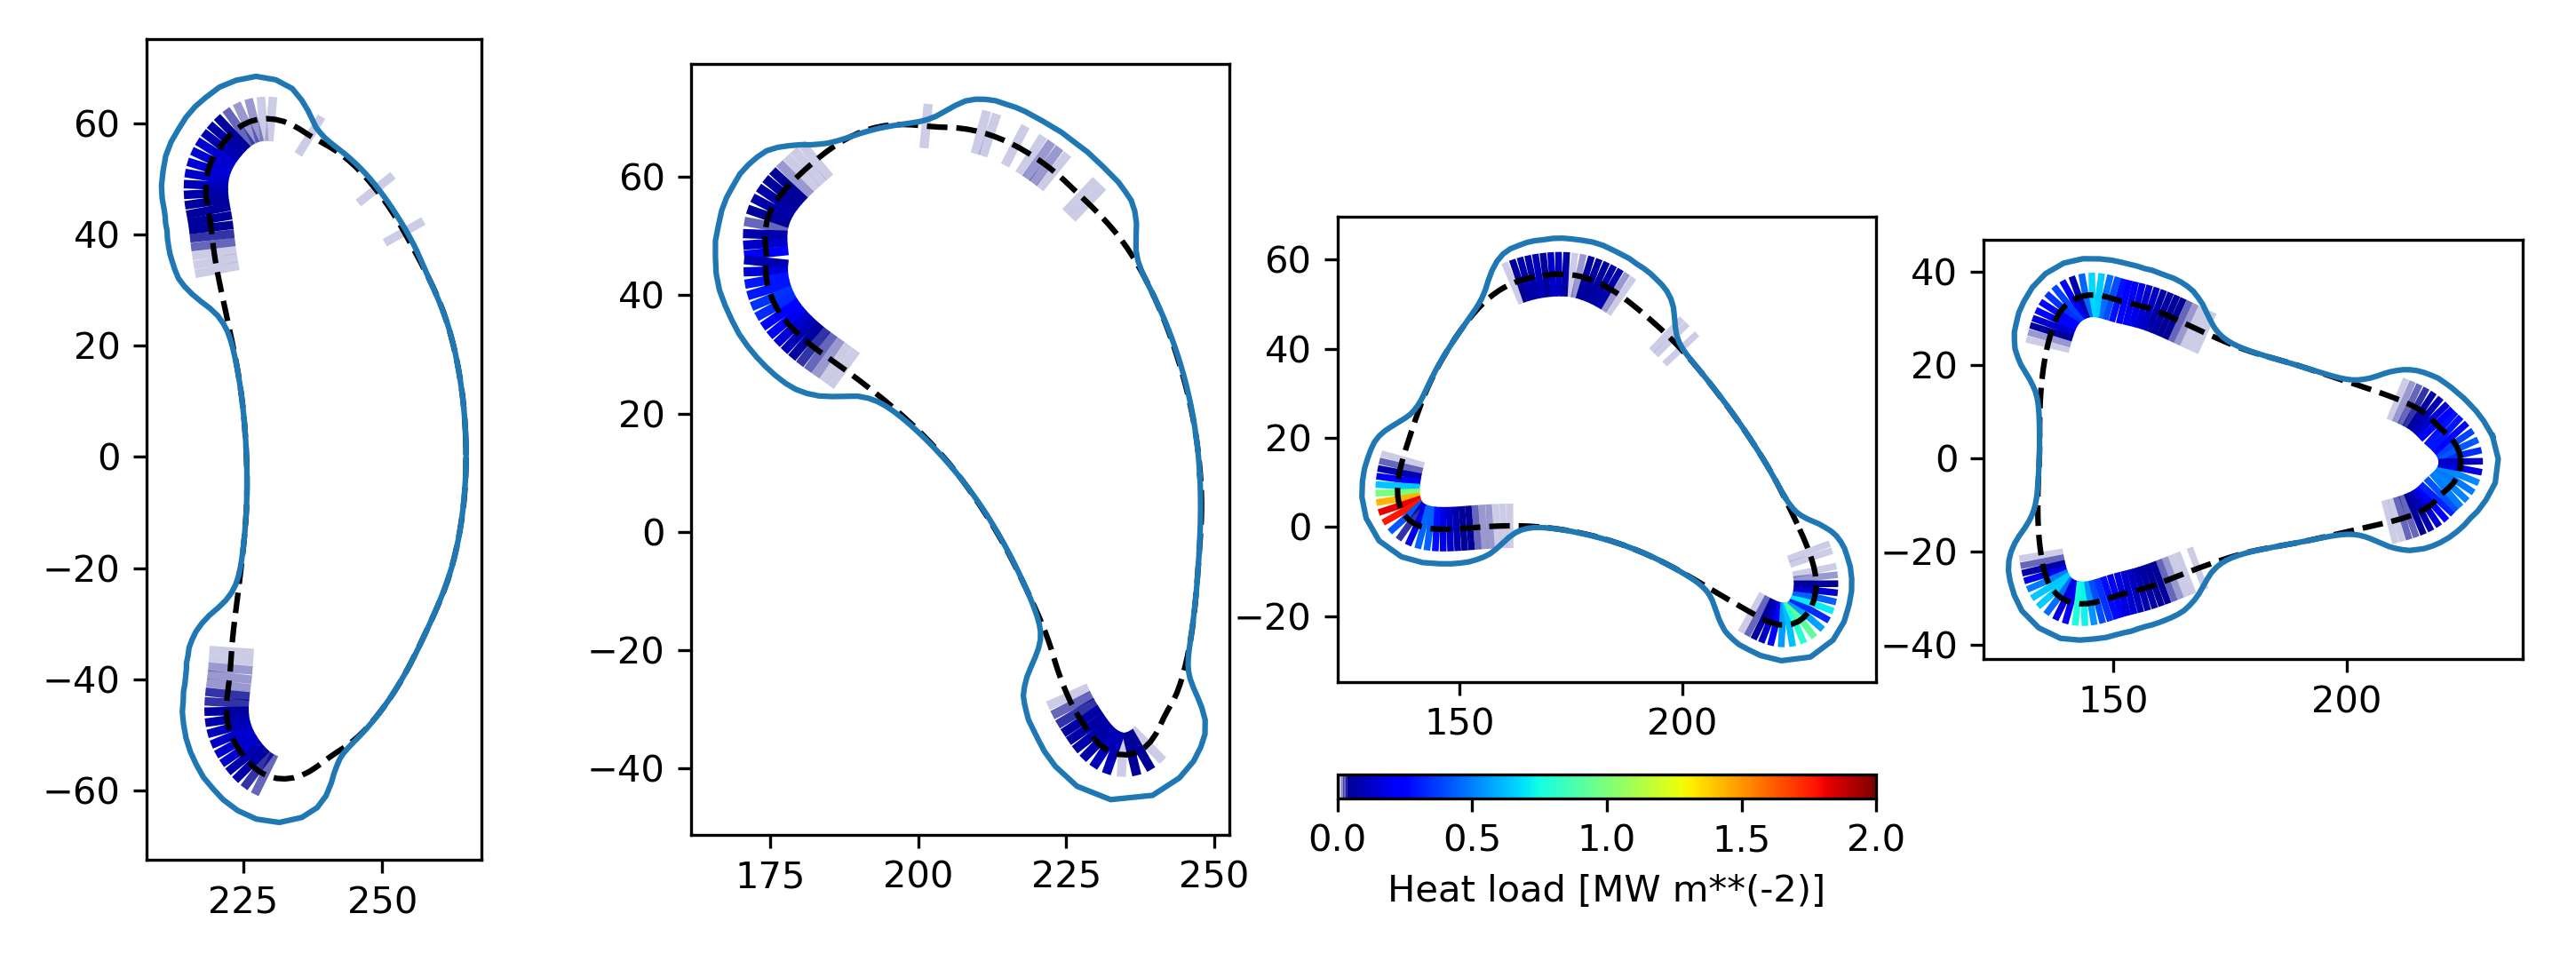
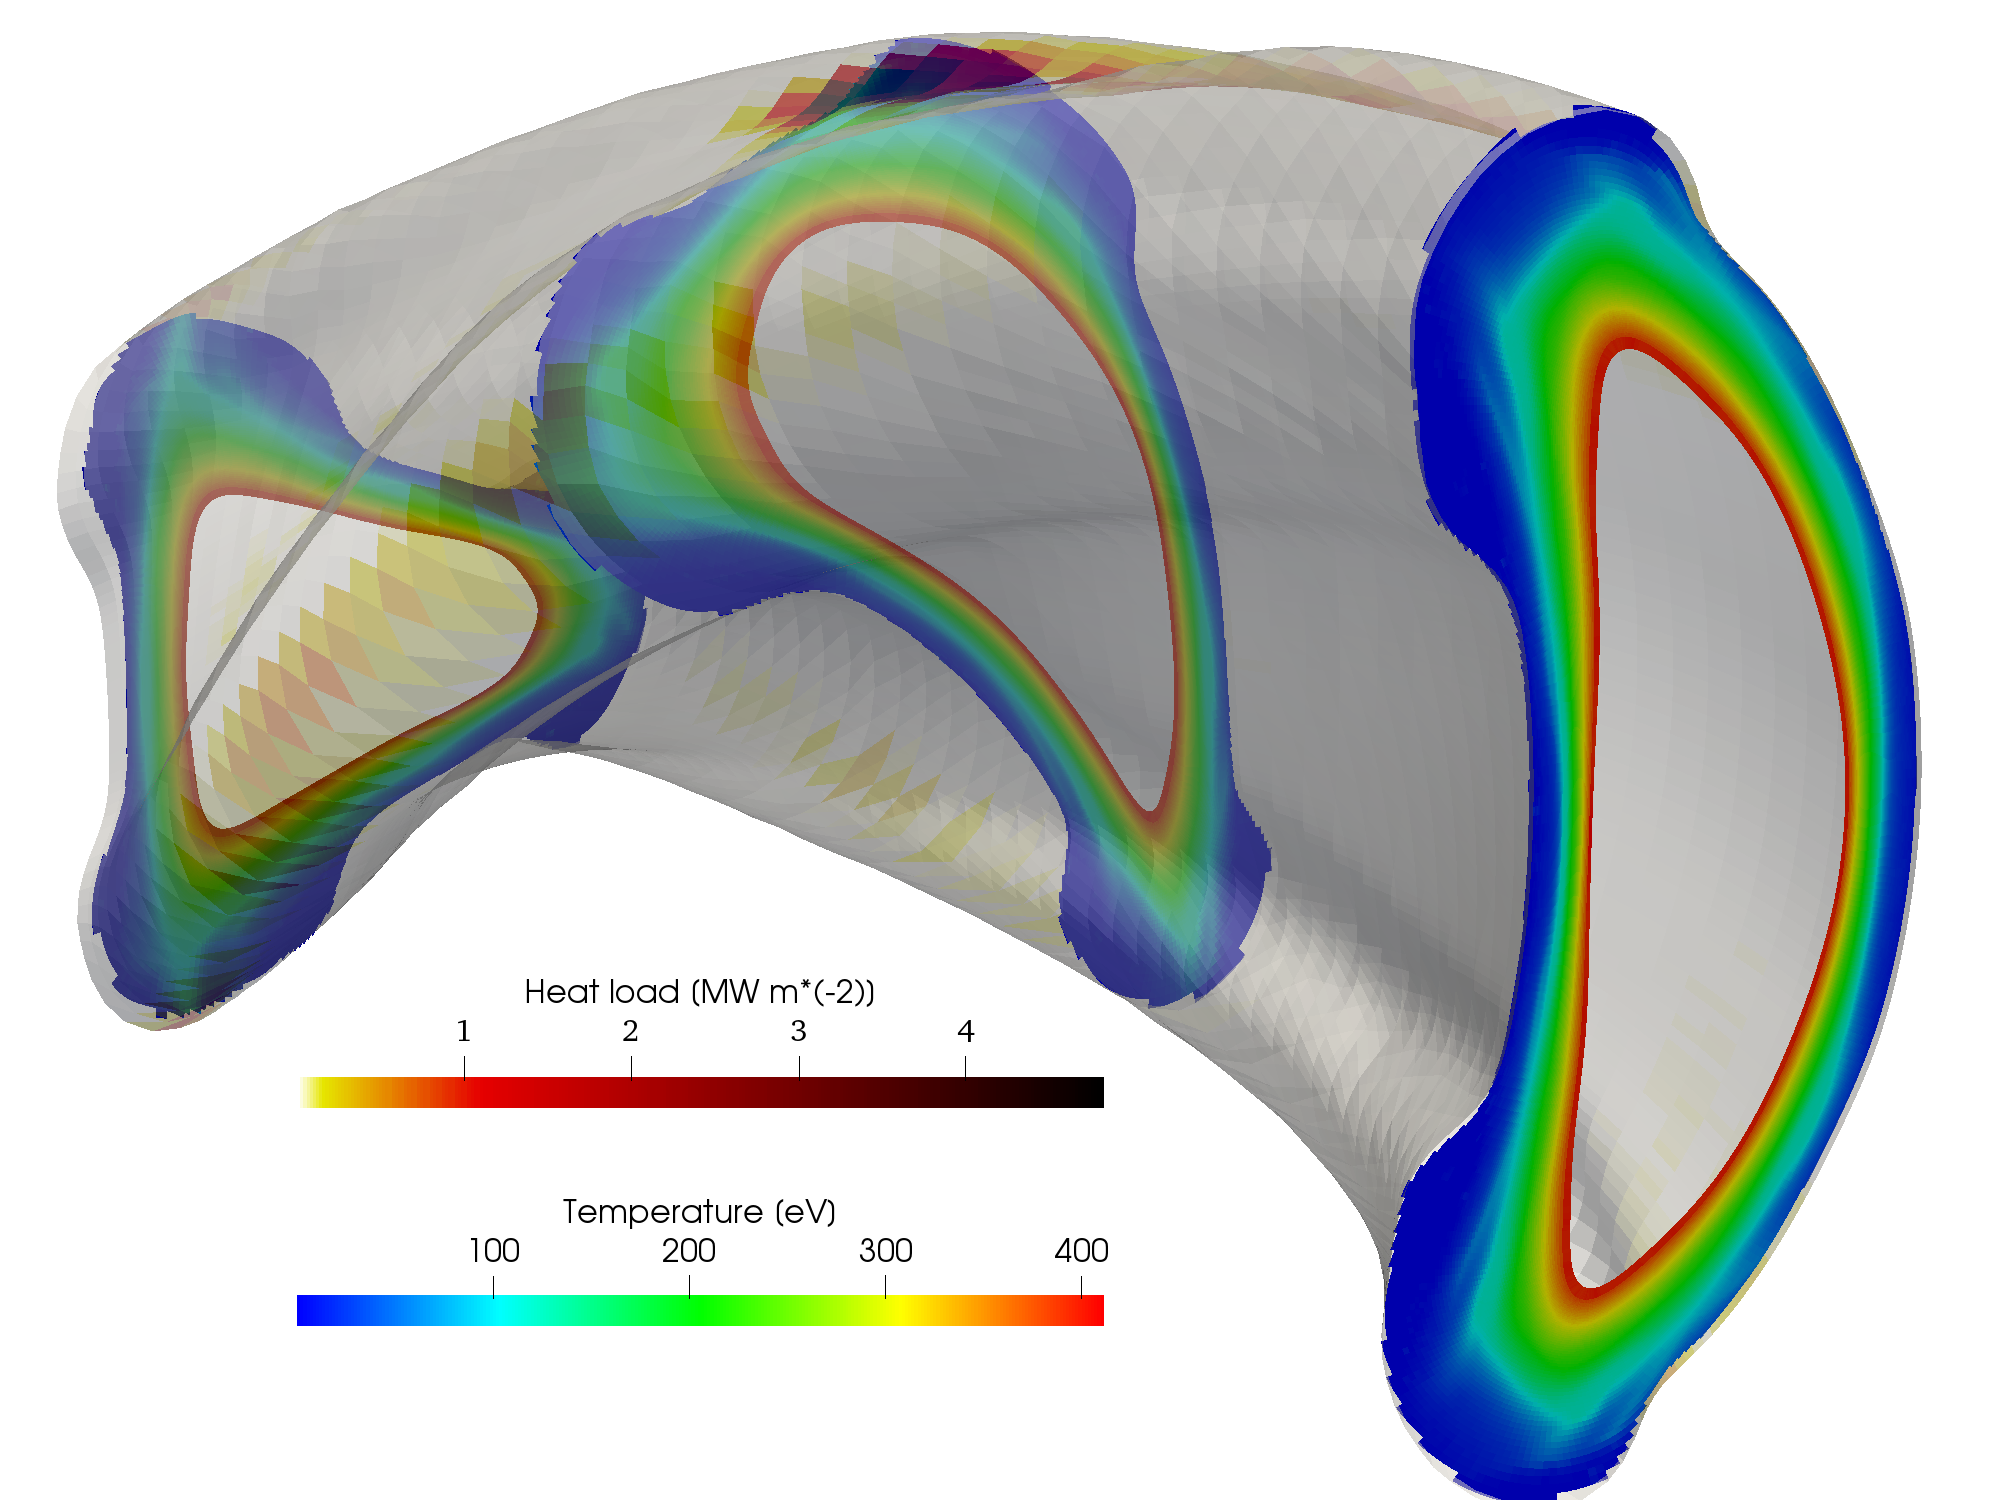
An initial attempt at such a construction is shown in figure 12. Here four plots of the divertor structure at toroidal values of = 0∘, 15∘, 30∘ and 45∘ are shown. In addition, an EMC3-EIRENE simulation was carried out with nominal operating parameters for the upgraded scenario. The calculation from EMC3-EIRENE indicates that the heat flux is concentrated in specific areas toroidally and poloidally near = 30∘. A three dimensional representation of the divertor design is shown in figure 13
Future iterations of the divertor structure design are necessary in order to smooth the heat flux deposition. The results presented here are therefore meant to indicate a first attempt at how divertor design could proceed and not indicative of a final design.
In addition, the configuration will have access to island divertor experiments by exploiting the resonance. However, due to the presence of self-generated plasma currents in quasisymmetric equilibria, ensuring the island position is maintained throughout the discharge to the operating point requires some external control, whether by auxiliary coils or current drive. Designing such operational scenarios are beyond the scope of this current work.
5 Conclusion
A new optimized quasihelically symmetric stellarator is developed that has a number of desirable features including improved energetic ion confinement, low neoclassical transport, reduced turbulent transport and non-resonant divertor capability. This configuration is made possible through the simultaneous improvements in optimization (ROSE) and coil (FOCUS) tools as well as advances in physics understanding. Stellarator optimization is a rapidly developing field with new advancements in physics metrics, equilibrium solutions and optimization algorithms occurring at an impressive pace. Individual optimized equilibria represent markers of where progress is at a given point in time. They highlight recent advancements and provide benchmarks for testing further optimizations.
A particularly significant advance is the development of configurations with excellent energetic particle confinement. Importantly, this improved energetic ion confinement is realized in the presence of external magnetic fields generated from filamentary coils. These improvements were only possible due to recent improvements in stellarator optimization.
A relatively new element in stellarator optimization is targeting reduced turbulent transport. In addition to the configuration presented here, another turbulence-reduced configuration has been identified. Nonlinear gyrokinetic simulations of ion temperature gradient turbulence demonstrate that this configuration has improved normalized values of heat flux relative to that predicted in HSX for all values of ion temperature gradient drive. Interestingly, improvements in turbulent transport are not correlated to significant changes to the linear stability properties. Rather, there are indications that the improved turbulent transport is related to changes in the nonlinear energy transfer physics.
Quasihelically symmetric stellarators have a number of intrinsic advantages when compared to other optimized stellarators. The reduced connection lengths of QH relative to QA implies they have smaller banana widths, Shafranov shifts, and plasma generated currents. However, MHD effects need to be accounted for in comprehensive stellarator optimization. Only modest attempts were made to improve the MHD properties of this new configuration. Nevertheless, configurations with magnetic wells throughout the core confinement regime are realized with ballooning instability onset at a few percent . There is reason to believe this property can be improved.
There is a need for a viable divertor option for stellarators with finite bootstrap current. Initial calculations show that non-resonant divertors, which do not rely on a low-order resonance at the edge, may be a possible solution. The complex interaction between edge plasma, impurities, neutral gas, and plasma boundary surfaces in a stochastic edge are only accessible numerically with the EMC3-EIRENE code. Validation of this code in different edge scenarios in experiments with relevant geometries and conditions is necessary to predict the functionality of next step experiments.
A final advantage of new equilibria is that they can be the foundation for new experimental designs. In the appendix of this paper, a conception of a midscale quasihelically-symmetric stellarator is given.
6 Acknowledgments
This work was supported by the University of Wisconsin, UW2020-135AAD3116 and the US Department of energy grants DE-FG02-93ER54222 and DE-FG02-99ER54546. BJF is supported by the U.S. Department of Energy Fusion Energy Sciences Postdoctoral Research Program administered by the Oak Ridge Institute for Science and Education (ORISE) for the DOE. ORISE is managed by Oak Ridge Associated Universities (ORAU) under DOE contract number DE-SC0014664. All opinions expressed in this paper are the author’s and do not necessarily reflect the policies and views of DOE, ORAU, or ORISE. This research used resources of the National Energy Research Scientific Computing Center (NERSC), a U.S. Department of Energy Office of Science User Facility operated under Contract No. DE-AC02-05CH11231.
Appendix A
This appendix details a possible realization of the new configuration as a midscale experiment. Such an experiment could significantly advance the quasisymmetric concept and retire some of the risks related to energetic particle transport, turbulent transport and divertor operation in quasisymmetry.
A 0-Dimensional analysis was carried out in order to determine a target equilibrium for a realization of the WISTELL-A configuration for a midscale experiment. Details are presented in table 2. The major size and cost drivers are the magnetic field strength and the minor radius. In addition the operation is split into two phases, an initial operational phase at half field (1.25 T), and a full operational phase at 2.5 T. The magnetic field strength is chosen to take advantage of Electron Cyclotron Heating (ECH) from commercially available 70 GHz gyrotrons at the second harmonic in the initial phase. In the full operational phase, the 70 GHz gyrotrons can be used at the fundamental o-mode harmonic, or 140 GHz gyrotrons can be used to heat at the second harmonic. The choice of gyrotron frequency sets the density cut-off, the maximum operational density for ECH plasmas. The cutoff density is , where is the permittivity of free space, is the electron mass, is the fundamental charge and is the angular frequency of the launched wave. For 70 GHz gyrotrons the cutoff is 0.6 1020 m-3. For 140 GHz gyrotrons the cutoff is 2.4 1020 m-3. The Sudo density limit for 1 MW absorbed power is 9.0 1020 m-3 (Sudo et al., 1990).
| Param. | Initial | Upg.(=1) | Upg.(=1.5) | Upg.(=2) |
|---|---|---|---|---|
| (m) | 2.0 | |||
| (m) | 0.3 | |||
| (m3) | 3.55 | |||
| 1.1 | ||||
| (T) | 1.25 | 2.5 | 2.5 | 2.5 |
| ECH (MW) | 0.5 | 1.0 | 1.0 | 1.0 |
| NBI (MW) | 0.0 | 1.0 | 1.0 | 1.0 |
| factor | 1.5 | 1.0 | 1.5 | 2.0 |
| (1020 m-3) | 0.15 | 0.9 | 0.9 | 0.9 |
| (keV) | 1.2 | 0.8 | 1.3 | 1.7 |
| (keV) | 0.7 | 0.8 | 1.3 | 1.7 |
| % | 0.36 | 0.49 | 0.73 | 0.98 |
| 0.13 | 0.5 | 0.22 | 0.12 | |
| (ms) | 48 | 65 | 98 | 130 |
| (ms) | 35 | 5 | 9 | 14 |
The confinement time (in ms) is given by the ISS04 empirical scaling law (Yamada et al., 2005),
| (11) |
Here, and are the major and minor radii respectively in meters, is the total absorbed power in MW, is the electron density in units of 1019 m-3, is the magnetic field on axis in T and is the rotational transform value at = 2/3. While the convention for the ISS04 scaling is to use density in units of 1019 m-3, from this point forward, all calculations will use the convention of density in units of 1020 m-3. The average temperature, in eV is given by,
| (12) |
where is the plasma volume, is the power absorbed by ions (taken here as power from the neutral beam) and is the power transmitted to the electrons. (taken here as ECH power). In the table a confinement improvement factor is included anticipating potential advances in understanding how to reduce turbulent transport.
The electron-ion energy equilibration time, is
| (13) |
Here, is the permittivity of free space, is the mean temperature in joules, is the density, is the particle charge (taken to be 1), is the fundamental electric charge, and are the electron and ion masses respectively, and is the coulomb logarithm, taken to be 17. For the values calculated in table 2, we assume main species hydrogen with .
The energy partition between ions and electrons is calculated assuming,
| (14) |
Where, ion and electron temperature, and respectively are in joules.
The normalized ion collisionality, is given by,
| (15) |
where, is the inverse aspect ratio evaluated at the mid-radius, , the ion temperature, is evaluated in joules, and the usual tokamak safety factor, has been replaced by the stellarator equivalent for a QHS stellarator, with the number of field periods. The 0-D analysis indicates that for relatively modest amounts of external heating, small regimes can be realized.
The normalized pressure, is
| (16) |
with the permeability of free space.
The midscale design employs water cooled copper coils, and thus pulse length is expected to be limited by coil heating.
The parameters for the coil quality of fit and relevant engineering parameters for the midscale realization are given in table 3. These data include a preliminary analysis of the coils including a finite build made up of multiple filaments and a winding pack size commensurate with realizable current densities. The error is given by
| (17) |
where represents the boundary surface, and represents the normal field on the boundary. More information on the procedure for generating these coils can be found in (Singh et al., 2020).
| Param. | Single-filament | Multi-filament |
|---|---|---|
| Minimum Coil-Plasma Distance | 19.5 cm | 13.0 cm |
| Average Coil-Plasma Distance | 22.5 cm | 16.0 cm |
| Integrated Normal Field |
References
- Anderson et al. (1995) Anderson, F Simon B, Almagri, Abdulgader F, Anderson, David T, Matthews, Peter G, Talmadge, Joseph N & Shohet, J Leon 1995 The helically symmetric experiment,(hsx) goals, design and status. Fusion Technology 27 (3T), 273–277.
- Bader et al. (2017) Bader, A, Boozer, AH, Hegna, CC, Lazerson, SA & Schmitt, JC 2017 Hsx as an example of a resilient non-resonant divertor. Physics of Plasmas 24 (3), 032506.
- Bader et al. (2019) Bader, Aaron, Drevlak, M, Anderson, DT, Faber, BJ, Hegna, CC, Likin, KM, Schmitt, JC & Talmadge, JN 2019 Stellarator equilibria with reactor relevant energetic particle losses. Journal of Plasma Physics 85 (5).
- Bader et al. (2018) Bader, Aaron, Hegna, CC, Cianciosa, M & Hartwell, GJ 2018 Minimum magnetic curvature for resilient divertors using compact toroidal hybrid geometry. Plasma Physics and Controlled Fusion 60 (5), 054003.
- Bauer et al. (1984) Bauer, F., Betancourt, 0. & Garabedian, P.A. 1984 Magnetohydrodynamic Equilibrium and Stability of Stellarators. Springer-Verlag, New York.
- Beidler et al. (1990) Beidler, Craig, Grieger, Günter, Herrnegger, Franz, Harmeyer, Ewald, Kisslinger, Johann, Lotz, Wolf, Maassberg, Henning, Merkel, Peter, Nührenberg, Jürgen, Rau, Fritz & others 1990 Physics and engineering design for wendelstein vii-x. Fusion Technology 17 (1), 148–168.
- Beidler et al. (2001) Beidler, CD, Harmeyer, E, Herrnegger, F, Igitkhanov, Yu, Kendl, A, Kisslinger, J, Kolesnichenko, Ya I, Lutsenko, VV, Nührenberg, C, Sidorenko, I & others 2001 The helias reactor hsr4/18. Nuclear Fusion 41 (12), 1759.
- Boozer (1981) Boozer, A H 1981 Plasma equilibrium with rational magnetic surfaces. Physics of Fluids 24 (11), 1999.
- Boozer & Gardner (1990) Boozer, A H & Gardner, H. J. 1990 The bootstrap current in stellarators. Physics of Fluids B-Plasma Physics 2 (10), 2408.
- Boozer & Punjabi (2018) Boozer, Allen H & Punjabi, Alkesh 2018 Simulation of stellarator divertors. Physics of Plasmas 25 (9), 092505.
- Brent (2013) Brent, Richard P 2013 Algorithms for minimization without derivatives. Courier Corporation.
- Canik et al. (2007) Canik, J. M., Anderson, D. T., Anderson, F. S. B., Likin, K. M., Talmadge, J. N. & Zhai, K. 2007 Experimental demonstration of improved neoclassical transport with quasihelical symmetry. Phys. Rev. Lett. 98, 085002.
- Carreras et al. (1988) Carreras, B.A., Dominguez, N., Garcia, L., Lynch, V.E., Lyon, J.F., Cary, J.R., Hanson, J.D. & Navarro, A.P. 1988 Low-aspect-ratio torsatron configurations. Nuclear Fusion 28, 1195–1207.
- Drevlak et al. (2018) Drevlak, M, Beidler, CD, Geiger, J, Helander, P & Turkin, Y 2018 Optimisation of stellarator equilibria with rose. Nuclear Fusion 59 (1), 016010.
- Drevlak et al. (2014) Drevlak, M, Geiger, J, Helander, P & Turkin, Yu 2014 Fast particle confinement with optimized coil currents in the w7-x stellarator. Nuclear Fusion 54 (7), 073002.
- Faber et al. (2018) Faber, B. J., Pueschel, M. J., Terry, P. W., Hegna, C. C. & Roman, J. E. 2018 Stellarator microinstabilities and turbulence at low magnetic shear. Journal of Plasma Physics 84 (5), 905840503.
- Faber (2020) Faber, B. J. 2020 PTSM3D. https://doi.org/10.5281/zenodo.3726923.
- Faber et al. (2015) Faber, B. J., Pueschel, M. J., Proll, J. H. E., Xanthopoulos, P., Terry, P. W., Hegna, C. C., Weir, G. M., Likin, K. M. & Talmadge, J. N. 2015 Gyrokinetic studies of trapped electron mode turbulence in the Helically Symmetric eXperiment stellarator. Physics of Plasmas 22, 072305.
- Feng et al. (2004) Feng, Y, Sardei, F, Kisslinger, J, Grigull, P, McCormick, K & Reiter, D 2004 3d edge modeling and island divertor physics. Contributions to Plasma Physics 44 (1-3), 57–69.
- Greene (1997) Greene, John M 1997 A brief review of magnetic wells. Comments on Plasma Physics and Controlled Fusion 17, 389–402.
- Grieger et al. (1992) Grieger, G, Lotz, W, Merkel, P, Nührenberg, J, Sapper, J, Strumberger, E, Wobig, H, Burhenn, R, Erckmann, V, Gasparino, U & others 1992 Physics optimization of stellarators. Physics of Fluids B: Plasma Physics 4 (7), 2081–2091.
- Hegna & Callen (1994) Hegna, C.C. & Callen, J. D. 1994 Stability of boostrap current driven magnetic islands in stellarators. Phys. Plasmas 1 (9), 3135.
- Hegna & Hudson (2001) Hegna, C.C. & Hudson, S. R. 2001 Loss of second ballooning stability in three-dimensional equilibria. Phys. Rev. Lett. 87 (3), 035001.
- Hegna et al. (2018) Hegna, C.C., Terry, P.W. & Faber, B.J. 2018 Theory of itg turbulent saturation in stellarators: identifying mechanisms to reduce turbulent transport. Physics of Plasmas 25 (2), 022511.
- Henneberg et al. (2019a) Henneberg, SA, Drevlak, M & Helander, P 2019a Improving fast-particle confinement in quasi-axisymmetric stellarator optimization. Plasma Physics and Controlled Fusion 62 (1), 014023.
- Henneberg et al. (2019b) Henneberg, SA, Drevlak, M, Nührenberg, C, Beidler, CD, Turkin, Y, Loizu, J & Helander, P 2019b Properties of a new quasi-axisymmetric configuration. Nuclear Fusion 59 (2), 026014.
- Hirshman & Whitson (1983) Hirshman, Steven P & Whitson, JC 1983 Steepest-descent moment method for three-dimensional magnetohydrodynamic equilibria. The Physics of fluids 26 (12), 3553–3568.
- Jenko et al. (2000) Jenko, F., Dorland, W., Kotschenreuther, M. & Rogers, B. N. 2000 Electron temperature gradient driven turbulence. Physics of Plasmas 7 (5), 1904–1910.
- König et al. (2002) König, R, Grigull, P, McCormick, K, Feng, Y, Kisslinger, J, Komori, A, Masuzaki, Suguru, Matsuoka, K, Obiki, T, Ohyabu, N & others 2002 The divertor program in stellarators. Plasma physics and controlled fusion 44 (11), 2365.
- Ku et al. (2008) Ku, LP, Garabedian, PR, Lyon, J, Turnbull, A, Grossman, A, Mau, TK, Zarnstorff, M & Team, ARIES 2008 Physics design for aries-cs. Fusion Science and Technology 54 (3), 673–693.
- Landreman (2017) Landreman, Matt 2017 An improved current potential method for fast computation of stellarator coil shapes. Nuclear Fusion 57 (4), 046003.
- Landreman & Paul (2018) Landreman, Matt & Paul, Elizabeth 2018 Computing local sensitivity and tolerances for stellarator physics properties using shape gradients. Nuclear Fusion 58 (7), 076023.
- Landreman & Sengupta (2018) Landreman, Matt & Sengupta, Wrick 2018 Direct construction of optimized stellarator shapes. part 1. theory in cylindrical coordinates. Journal of Plasma Physics 84 (6).
- Landreman et al. (2019) Landreman, Matt, Sengupta, Wrick & Plunk, Gabriel G 2019 Direct construction of optimized stellarator shapes. part 2. numerical quasisymmetric solutions. Journal of Plasma Physics 85 (1).
- Landreman et al. (2014) Landreman, M., Smith, H.M., Mollén, A. & Helander, P. 2014 Comparison of particle trajectories and collision operators for collisional transport in nonaxisymmetric plasmas. Physics of Plasmas 21, 042503.
- McKinney et al. (2019) McKinney, IJ, Pueschel, MJ, Faber, BJ, Hegna, CC, Talmadge, JN, Anderson, DT, Mynick, HE & Xanthopoulos, P 2019 A comparison of turbulent transport in a quasi-helical and a quasi-axisymmetric stellarator. Journal of Plasma Physics 85 (5).
- Miller et al. (1996) Miller, R, Team, SPPS & others 1996 The stellarator power plant study. University of California San Diego Report UCSD-ENG-004 .
- Mynick et al. (2010) Mynick, HE, Pomphrey, N & Xanthopoulos, P 2010 Optimizing stellarators for turbulent transport. Physical review letters 105 (9), 095004.
- Nemov et al. (1999) Nemov, VV, Kasilov, SV, Kernbichler, W & Heyn, MF 1999 Evaluation of 1/ neoclassical transport in stellarators. Physics of plasmas 6 (12), 4622–4632.
- Nemov et al. (2008) Nemov, VV, Kasilov, SV, Kernbichler, Winfried & Leitold, GO 2008 Poloidal motion of trapped particle orbits in real-space coordinates. Physics of plasmas 15 (5), 052501.
- Nührenberg & Zille (1988) Nührenberg, J. & Zille, R. 1988 Quasi-helically symmetric toroidal stellarators. Physics Letters A 129 (2), 113–117.
- Pablant et al. (2020) Pablant, N. & others 2020 Investigation of the neoclassical ambipolar electric field in ion-root plasmas on W7-X. Nuclear Fusion 60 (3), 036021.
- Plunk et al. (2019) Plunk, Gabriel G, Landreman, Matt & Helander, Per 2019 Direct construction of optimized stellarator shapes. iii. omnigenity near the magnetic axis. arXiv preprint arXiv:1909.08919 .
- Plunk et al. (2017) Plunk, G. G., Xanthopoulos, P. & Helander, P. 2017 Distinct turbulence saturation regimes in stellarators. Phys. Rev. Lett. 118, 105002.
- Pueschel et al. (2016) Pueschel, M. J., Faber, B. J., Citrin, J., Hegna, C. C., Terry, P. W. & Hatch, D. R. 2016 Stellarator turbulence: Subdominant eigenmodes and quasilinear modeling. Phys. Rev. Lett. 116, 085001.
- Sanchez et al. (2000) Sanchez, R., Hirshman, S. P. & Ware, A. S. 2000 Cobra:an optimized code for fast evaluation of ideal ballooning stability of three dimensional equilibria. J. Comp. Phys. 161 (2), 576.
- Schmitt et al. (2013) Schmitt, J.C., Talmadge, J.N. & Anderson, D.T. 2013 Measurement of a helical pfirsch-schlüuter current with reduced magnitude in hsx. Nuclear Fusion 53, 0820001.
- Schmitt et al. (2014) Schmitt, J.C., Talmadge, J.N., Anderson, D.T. & Hanson, J.D. 2014 Modeling, measurement and 3-d equilibrium reconstruction of the bootstrap current in the helically symmetric experiment. Physics of Plasmas 21, 092518.
- Shimizu et al. (2018) Shimizu, Akihiro, Liu, Haifeng, Isobe, Mitsutaka, Okamura, Shoichi, Nishimura, Shin, Suzuki, Chihiro, Xu, Yuhong, Zhang, Xin, Liu, Bing, Huang, Jie & others 2018 Configuration property of the chinese first quasi-axisymmetric stellarator. Plasma and Fusion Research 13, 3403123–3403123.
- Singh et al. (2020) Singh, L., Kruger, T.G., Bader, A., Zhu, C., Hudson, S.R. & Anderston, D.T. 2020 Optimization of finite-build stellarator coils. Submitted to Journal of Plasma Physics .
- Strumberger (1992) Strumberger, Erika 1992 Magnetic field line diversion in helias stellarator configurations: perspectives for divertor operation. Nuclear fusion 32 (5), 737.
- Sudo et al. (1990) Sudo, S, Takeiri, Y, Zushi, H, Sano, F, Itoh, K, Kondo, K & Iiyoshi, A 1990 Scalings of energy confinement and density limit in stellarator/heliotron devices. Nuclear Fusion 30 (1), 11.
- Talmadge et al. (2001) Talmadge, J.N., Sakaguchi, V., Anderson, F. S. B., Anderson, D. T. & Almagri, A. F. 2001 Experimental determination of the magnetic field spectrum in the helically symmetric experiment using passing particle orbits. Physics of Plasmas 8, 5165.
- Weller et al. (2001) Weller, A., Anton, M., Geiger, J., Hirsch, R., Jaenicke, R., Werner, A., Team, W7-AS, Nührenberg, J., Sallander, E. & Spong, D. A. 2001 Survey of magnetohydrodynamic instabilities in the advanced stellarator wendelstein 7-as. Phys. Plasmas 8 (3), 931.
- Xanthopoulos et al. (2014) Xanthopoulos, P, Mynick, HE, Helander, P, Turkin, Yu, Plunk, GG, Jenko, F, Görler, T, Told, D, Bird, T & Proll, JHE 2014 Controlling turbulence in present and future stellarators. Physical review letters 113 (15), 155001.
- Yamada et al. (2005) Yamada, H, Harris, JH, Dinklage, Andreas, Ascasibar, E, Sano, F, Okamura, S, Talmadge, J, Stroth, U, Kus, A, Murakami, S & others 2005 Characterization of energy confinement in net-current free plasmas using the extended international stellarator database. Nuclear Fusion 45 (12), 1684.
- Zarnstorff et al. (2001) Zarnstorff, MC, Berry, LA, Brooks, A, Fredrickson, E, Fu, GY, Hirshman, S, Hudson, S, Ku, LP, Lazarus, E, Mikkelsen, D & others 2001 Physics of the compact advanced stellarator ncsx. Plasma Physics and Controlled Fusion 43 (12A), A237.
- Zhu et al. (2018) Zhu, Caoxiang, Hudson, Stuart R, Song, Yuntao & Wan, Yuanxi 2018 Designing stellarator coils by a modified newton method using focus. Plasma Physics and Controlled Fusion 60 (6), 065008.