SensitiveLoss: Improving Accuracy and Fairness
of Face Representations with
Discrimination-Aware Deep Learning
Abstract
We propose a discrimination-aware learning method to improve both accuracy and fairness of biased face recognition algorithms. The most popular face recognition benchmarks assume a distribution of subjects without paying much attention to their demographic attributes. In this work, we perform a comprehensive discrimination-aware experimentation of deep learning-based face recognition. We also propose a general formulation of algorithmic discrimination with application to face biometrics. The experiments include tree popular face recognition models and three public databases composed of 64,000 identities from different demographic groups characterized by gender and ethnicity. We experimentally show that learning processes based on the most used face databases have led to popular pre-trained deep face models that present a strong algorithmic discrimination. We finally propose a discrimination-aware learning method, Sensitive Loss, based on the popular triplet loss function and a sensitive triplet generator. Our approach works as an add-on to pre-trained networks and is used to improve their performance in terms of average accuracy and fairness. The method shows results comparable to state-of-the-art de-biasing networks and represents a step forward to prevent discriminatory effects by automatic systems.
Index Terms:
Machine Behavior, bias, fairness, discrimination, machine learning, learning representations, face, biometrics.1 Introduction
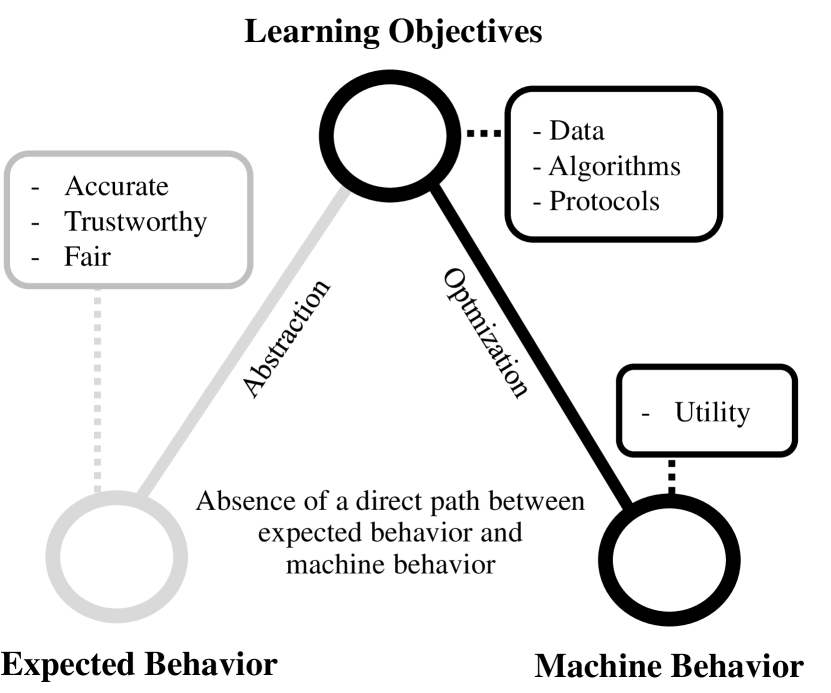
Artificial Intelligence (AI) is developed to meet human needs that can be represented in the form of objectives. To this end, the most popular machine learning algorithms are designed to minimize a loss function that defines the cost of wrong solutions over a pool of samples. This is a simple but very successful scheme that has enhanced the performance of AI in many fields such as Computer Vision, Speech Technologies, and Natural Language Processing. But this optimization of specific computable objectives may not lead to the behavior one may expect or desire from AI. International agencies, academia and industry are alerting policymakers and the public about unanticipated effects and behaviors of AI agents, not initially considered during the design phases [1]. In this context, aspects such as trustworthiness and fairness should be included as learning objectives and not taken for granted. (See Fig. 1).
Machine vision in general and face recognition algorithms in particular are good examples of recent advances in AI [3, 4, 5, 6]. The performance of automatic face recognition has been boosted during the last decade, achieving very competitive accuracies in the most challenging scenarios [7]. These improvements have been made possible due to advances in machine learning (e.g., deep learning), powerful computation (e.g., GPUs), and larger databases (e.g., on a scale of millions of images). However, the recognition accuracy is not the only aspect to be considered when designing biometric systems. Algorithms play an increasingly important role in the decision-making of several processes involving humans. So these decisions have an increasing impact on our lives. Thus, there is currently a growing need to study AI behavior in order to better understand its impact on our society [1]. Face recognition systems are especially sensitive due to the personal information present in face images (e.g., identity, gender, ethnicity, and age).
The objective of a face recognition algorithm is to recognize when two face images belong to the same person. For this purpose, deep neural networks are usually trained to minimize a cost function over a dataset. Like many other supervised learning processes, the training methods of these networks consist of an iterative process where input images must be associated with the output labels (e.g. identities). This learning by imitation is highly sensitive to the characteristics of the dataset. The literature has demonstrated that face recognition accuracy is affected by demographic covariates [8, 9, 10, 11]. This behavior is a consequence of biases introduced into the dataset and cost functions focused exclusively on performance improvement. The number of published works pointing out the potential discriminatory effects in the results of face detection and recognition algorithms is large [12, 13, 10, 14, 8, 9, 15, 16, 11].
In this environment, only a limited number of works analyze how biases affect the learning process of algorithms dealing with personal information [17, 18]. There is a lack of understanding regarding how demographic information affects popular and widely used pre-trained AI models beyond the performance.
On the other hand, the right to non-discrimination is deeply rooted in the normative framework that underlies various national and international regulations, and can be found, for example, in Article 7 of the Universal Declaration of Human Rights and Article 14 of the European Convention on Human Rights, among others. As evidence of these concerns, in April 2018 the European Parliament adopted a set of laws aimed at regulating the collection, storage and use of personal information: the General Data Protection Regulation (GDPR)111EU 2016/679 (General Data Protection Regulation). Available online at: https://gdpr-info.eu/. According to paragraph 71 of GDPR, data controllers who process sensitive data have to “implement appropriate technical and organizational measures …” that “… prevent, inter alia, discriminatory effects”.
The aim of this work is to analyze face recognition models using a discrimination-aware perspective and to demonstrate that learning processes involving such discrimination-aware perspective can be used to train more accurate and fairer algorithms. The main contributions of this work are:
-
•
A general formulation of algorithmic discrimination for machine learning tasks. In this work, we apply this formulation in the context of face recognition.
-
•
A comprehensive analysis of causes and effects of biased learning processes including: (i) discrimination-aware performance analysis based on three public datasets, with 64K identities equally distributed across demographic groups; (ii) study of deep representations and the role of sensitive attributes such as gender and ethnicity; (iii) complete analysis of demographic diversity present in some of the most popular face databases, and analysis of new databases available to train models based on diversity.
-
•
Based on our analysis of the causes and effects of biased learning algorithms, we propose an efficient discrimination-aware learning method to mitigate bias in deep face recognition models: Sensitive Loss. The method is based on the inclusion of demographic information in the popular triplet loss representation learning. Sensitive Loss incorporates fairness as a learning objective in the training process of the algorithm. The method works as an add-on to be applied over pre-trained representations and allows improving its performance and fairness without a complete re-training. We evaluate the method in three public databases showing an improvement in both overall accuracy and fairness. Our results show how to incorporate discrimination-aware learning rules to significantly reduce bias in deep learning models.
Preliminary work in this research line was presented in [19]. Key improvements here over [19] include: (i) in-depth analysis of the state-of-the-art, including an extensive survey of face recognition databases; (ii) inclusion of two new datasets in the experiments involving 40,000 new identities and more than 1M images; and (iii) a novel discrimination-aware learning method called Sensitive Loss.
The rest of the paper is structured as follows: Section 2 summarizes the related works. Section 3 presents our general formulation of algorithmic discrimination. Section 4 presents the face recognition architectures used in this work. Section 5 evaluates the causes and effects of biased learning in face recognition algorithms. Section 6 presents the proposed discrimination-aware learning method. Section 7 presents the experimental results. Finally, Section 8 summarizes the main conclusions.
2 Related Work
2.1 Face recognition: methods
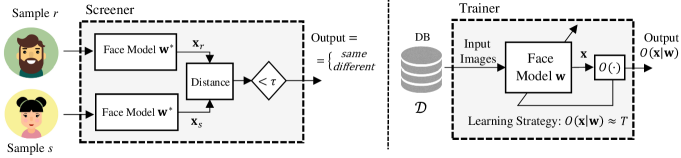
A face recognition algorithm, like other machine learning systems, can be divided into two different algorithms: screener and trainer. Both algorithms are used for a different purpose [20].
The screener takes the characteristics of an individual and returns a prediction of that individual’s outcome, while the trainer produces the screener itself. In our case the screener (see Fig. 2) is an algorithm that given two face images generates an output associated with the probability that they belong to the same person. This probability is obtained comparing the two learned representations obtained from a face model defined by the parameters w. These parameters are trained previously based on a training dataset (see Fig. 2). If trained properly, the output of the trainer would be a model with parameters capable of representing the input data (e.g., face images) in a highly discriminant feature space x.
The most popular architecture used to model face attributes is the Convolutional Neural Network (CNN). This type of network has drastically reduced the error rates of face recognition algorithms in the last decade [21] by learning highly discriminative features from large-scale databases.
The pre-trained models are used as an embedding extractor where x is a -normalised learned representation of a face image. The similarity between two face descriptors and is calculated as the Euclidean distance . Two faces are assigned the same identity if their distance is smaller than a threshold . The recognition accuracy is obtained by comparing distances between positive matches (i.e., and belong to the same person) and negative matches (i.e., and belong to different persons).
2.2 Bias in face databases
Following the trainer-screener division, bias is rooted in the trainer. The trainer is a common algorithm that usually varies in the loss function, the optimization algorithm and in the data it uses for training. Bias is traditionally associated with the unequal representation of classes in a dataset. The history of automatic face recognition has been linked to the history of the databases used for algorithm training during the last two decades. The number of publicly available databases is high, and they allow the training of models using millions of face images.
Table I summarizes the demographic statistics of some of the most frequently cited face databases. In order to obtain demographic statistics, gender and ethnicity classification algorithms were trained based on a ResNet-50 model [22] and 12K identities of DiveFace database (equally distributed between the six demographic groups). Models were evaluated in 20K labeled images of Celeb-A with performance over 97%.
Each of these databases is characterized by its own biases (e.g. image quality, pose, backgrounds, and aging). In this work, we highlight the unequal representation of demographic information in very popular face recognition databases. As can be seen, the differences between ethnic groups are serious. Even though the people in Asia constitute more than 35% of the world’s population, they account for only 9% of the content of these popular face recognition databases.
Biased databases imply a double penalty for underrepresented classes. On the one hand, models are trained according to non-representative diversity. On the other hand, accuracies are measured on privileged classes and overestimate the real performance over a diverse society.
Recently, diverse and discrimination-aware databases have been proposed in [13, 23, 17]. These databases are valuable resources for exploring how diversity can be used to improve face biometrics. However, some of these databases do not include identities [13, 23], and face images cannot be matched to other images. Therefore, these databases do not allow to properly train or test face recognition algorithms.
Note that the groups into which the databases have been divided are heterogeneous and they include people of different ethnicities. We are aware of the limitations of grouping all human ethnic origins into only three categories. According to studies, there are more than 5,000 ethnic groups in the world. Our experiments are similar to those reported in the literature, and include only three groups in order to maximize differences between classes. Automatic classification algorithms based on these reduced categories show performances of up to 98% accuracy [10].
-
Algorithmic Discrimination implications: classes are unequally represented in the most popular face databases . New databases and benchmarks are needed to train more diverse and heterogeneous algorithms. Evaluation over representative populations from different demographic groups is important to prevent discriminatory effects.
| Caucasian | African/Indian | Asian | |||||||
| Dataset [ref] | # images | # identities | # avg. images per identity | Male | Female | Male | Female | Male | Female |
| FRVT2018 [24] | 27M | 12M | 2 | 48.4% | 16.5% | 19.9% | 7.4% | 1.2% | 0.4% |
| MSCeleb1M [25] | 8.5M | 100K | 85 | 52.4% | 19.2% | 12.1% | 3.9% | 7.7% | 4.5% |
| MegaFace [26] | 4.7M | 660K | 7 | 40.0% | 30.3% | 6.2% | 4.7% | 10.6% | 8.1% |
| VGGFace2 [27] | 3.3M | 9K | 370 | 45.9% | 30.2% | 10.5% | 6.3% | 3.4% | 3.6% |
| VGGFace [28] | 2.6M | 2.6K | 1K | 43.7% | 38.6% | 5.8% | 6.9% | 2.1% | 2.9% |
| YouTube [29] | 621K | 1.6K | 390 | 56.9% | 20.3% | 7.7% | 4.0% | 7.9% | 3.0% |
| CASIA [30] | 500K | 10.5K | 48 | 48.8% | 33.2% | 7.2% | 5.7% | 2.6% | 2.6% |
| CelebA [31] | 203K | 10.2K | 20 | 33.9% | 41.5% | 6.4% | 8.2% | 4.4% | 5.5% |
| PubFig [32] | 58K | 200 | 294 | 49.5% | 35.5% | 6.5% | 5.5% | 2.0% | 1.0% |
| IJB-C [33] | 21K | 3.5K | 6 | 40.3% | 30.2% | 11.8% | 6.0% | 5.4% | 6.2% |
| UTKface [34] | 24K | - | - | 26.2% | 20.0% | 21.5% | 16.3% | 7.1% | 8.9% |
| LFW [35] | 13K | 5.7K | 2 | 58.9% | 18.7% | 9.6% | 3.3% | 7.2% | 2.2% |
| BioSecure [36] | 2.7K | 667 | 4 | 50.1% | 36% | 3.1% | 2.1% | 4.3% | 4.5% |
| Average | 46% | 29% | 10% | 6% | 5% | 4% | |||
| Databases for discrimination-aware learning | |||||||||
| BUPT-B [17] | 1.3M | 28K | 46 | 33.33% | 33.33% | 33.33% | |||
| DiveFace [37] | 125K | 24K | 5 | 16.7% | 16.7% | 16.7% | 16.7% | 16.7% | 16.7% |
| FairFace [38] | 100K | - | - | 25.0% | 20.0% | 14.4% | 13.9% | 13.6% | 13.1% |
| RFW [39] | 40K | 12K | 3 | 33.33% | 33.33% | 33.33% | |||
| DemogPairs [15] | 10.8K | 600 | 18 | 16.7% | 16.7% | 16.7% | 16.7% | 16.7% | 16.7% |
2.3 Bias in face recognition
Facial recognition systems can suffer various biases, ranging from those derived from variables of unconstrained environments like illumination, pose, expression and resolution of the face, through systematic errors such as image quality, to demographic factors of age, gender and race [9].
An FBI-coauthored study [12] tested three commercial algorithms of supplier companies to various public organizations in the US. In all three algorithms, African Americans were less likely to be successfully identified —i.e., more likely to be falsely rejected— than other demographic groups. A similar decline surfaced for females compared to males and younger subjects compared to older subjects.
More recently, the latest NIST evaluation of commercial face recognition technology, the Face Recognition Vendor Test (FRVT) Ongoing, shows that at sensitivity thresholds that resulted in white men being falsely matched once in K, out of a list of algorithms, all but two were more than twice as likely to misidentify black women, some reaching times more [24]. The number of academic studies analyzing fairness of face recognition algorithms has grown during last years [16].
2.4 De-biasing face recognition
There are attempts to eliminate bias in face recognition, as in [14], with so-called unlearning, which improves the results, but at the cost of losing recognition accuracy. Das et al. proposed a Multi-Task CNN that also managed to improve performance across subgroups of gender, race, and age [40]. Finally, in [37] an extension of the triplet loss function is developed to remove sensitive information in feature embeddings, without losing performance in the main task.
In [17], researchers proposed a race-balanced reinforcement learning network to adaptively find appropriate margins losses for the different demographic groups. Their model significantly reduced the performance difference obtained between demographic groups. [18] with an adversarial network, disentangles feature representation of gender, age, race and face recognition and minimizes their correlation. Both methods [17, 18] were applied to train de-biasing deep architectures for face recognition from scratch.
3 Formulating Algorithmic Discrimination
Discrimination is defined by the Cambridge Dictionary as treating a person or particular group of people differently, especially in a worse way than the way in which you treat other people, because of their skin color, sex, sexuality, etc.
For the purpose of studying discrimination in artificial intelligence at large, we now formulate mathematically Algorithmic Discrimination based on the above dictionary definition. Even though ideas similar to those included in our formulation can be found elsewhere [41, 42], we didn’t find this kind of formulation in related works. We hope that the formalization of these concepts can be beneficial in fostering further research and discussion on this hot topic.
Let’s begin with notation and preliminary definitions. Assume is a learned representation of individual (out of different individuals) corresponding to an input image ( samples per individual). That representation x is assumed to be useful for task , e.g., face authentication or emotion recognition. That representation x is generated from the input image I using an artificial intelligence approach with parameters w. We also assume that there is a goodness criterion in that task that maximizes some real-valued performance function in a given dataset (collection of multiple images) in the form:
| (1) |
The most popular form of the previous expression minimizes a loss function over a set of training images in the form:
| (2) |
where O is the output of the learning algorithm that we seek to bring closer to the target function (or groundtruth) T defined by the task at hand. On the other hand, the I individuals can be classified according to D demographic criteria , with , which can be the source for discrimination, e.g., (the demographic criterion Gender has two classes in this example). The particular class for a given demographic criterion and a given sample is noted as , e.g., . We assume that all classes are well represented in dataset , i.e., the number of samples for each class in all criteria in is significant. represents all the samples corresponding to class of demographic criterion .
Finally, our definition of Algorithmic Discrimination:
-
An algorithm discriminates the group of people represented with class (e.g., Female) when performing the task T (e.g., face verification), if the goodness G in that task when considering the full set of data (including multiple samples from multiple individuals), is significantly larger than the goodness in the subset of data corresponding to class of the demographic criterion .
The representation x and the model parameters w will typically be real-valued vectors, but they can be any set of features combining real and discrete values. Note that the previous formulation can be easily extended to the case of varying number of samples for different subjects, which is a usual case; or to classes K that are not disjoint. Note also that the previous formulation is based on average performances over groups of individuals. In many artificial intelligence tasks it is common to have different performance between specific individuals due to various reasons, e.g., specific users who were not sensed properly [43], even in the case of algorithms that, on average, may have similar performance for the different classes that are the source of discrimination. Therefore, in our formulation and definition of Algorithmic Discrimination we opted to use average performances in demographic groups.
Other related works are now starting to investigate discrimination effects in AI with user-specific methods, e.g. [44, 45], but they are still lacking a mathematical framework with clear definitions of User-specific Algorithmic Discrimination (U-AD), in comparison to our defined Group-based Algorithmic Discrimination (G-AD). We will study and augment our framework with an analysis of U-AD in future work.
4 Proposed Approach: Sensitive Loss
Models trained and evaluated over privileged demographic groups may fail to generalize when the model is evaluated over groups other than the privileged one. This is a behavior caused by the wrong assumption of homogeneity in face characteristics of the world population. In this work we propose to reduce the bias in face recognition models incorporating a discrimination-aware learning process.
The methods proposed in this work to reduce bias are based on two strategies:
- i)
-
ii)
A modified loss function (Sensitive Loss) that incorporates demographic information to guide the learning process into a more inclusive feature space. The development of new cost functions capable of incorporating discrimination-aware elements into de training process is another way to reduce bias. Our approach is based on the popular triplet loss function and it can be applied to pre-trained models without needing the full re-training of the network.
4.1 Discrimination-aware learning into triplet loss
Triplet loss was proposed as a distance metric in the context of nearest neighbor classification [46] and adapted to improve the performance of face descriptors in verification algorithms [47, 28]. In this work we propose to incorporate demographic data to generate discrimination-aware triplets to train a new representation that mitigates biased learning.
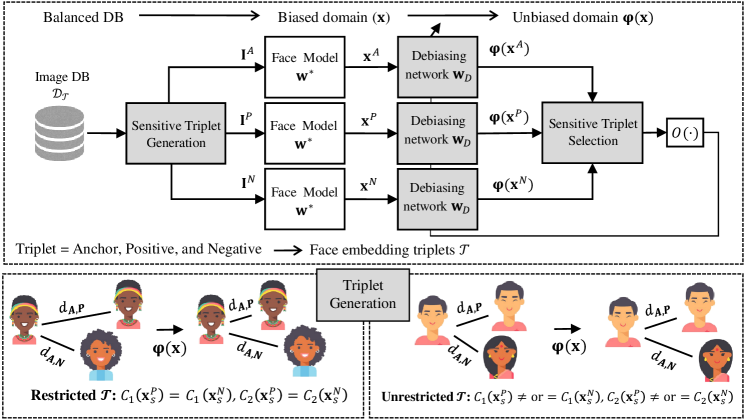
Assume that an image is represented by an embedding descriptor obtained by a pre-trained model (see Section 3 for notation). That image corresponds to the demographic group . A triplet is composed of three different images of two different people: Anchor () and Positive () are different images of the same person, and Negative () is an image of a different person. The Anchor and Positive share the same demographic labels, but these labels may differ for the Negative sample . The transformation represented by parameters ( for De-biasing) is trained to minimize the loss function:
| (3) |
where is the Euclidean Distance, is a margin between genuine and impostor distances, and is a set of triplets generated by an online sensitive triplet generator that guides the learning process (see details in Section 4.2). The effects of biased training include a representation that fails to model properly the distance between faces from different people () belonging to the same minority demographic groups (e.g. ). The proposed triplet loss function considers both genuine and impostor comparisons and also allows to introduce demographic-aware information. In order to guide the learning process in that discrimination-aware spirit, triplets from demographic groups with worst performances are prioritized in the online sensitive triplet generator (e.g. for Asian Females). Fig. 3 shows the block diagram of the learning algorithm.
4.2 Sensitive Loss: sensitive triplets
Inspired in the semi-hard selection proposed in [47, 28], we propose an online selection of triplets that prioritizes the triplets from demographic groups with lower performances (see Fig. 3). On the one hand, triplets within the same demographic group improve the ability to discriminate between samples with similar anthropometric characteristics (e.g. reducing the false acceptance rate in Asian Females). On the other hand, heterogeneous triplets (i.e. triplets involving different demographic groups) improve the generalization capacity of the model (i.e. the overall accuracy).
During the training process we distinguish between generation and selection of triplets:
-
•
Triplet Generation: this is where the triplets are formed and joined to compose a training batch. In our experiments, each batch is generated randomly with images from different identities equally distributed among the different demographic groups ( images in total). We propose two types of triplets generation (see Fig. 3):
-
–
Unrestricted (U): the generator allows triplets with mixed demographic groups (i.e. or ), but identities are equally distributed, that is, there are the same number of identities for each demographic group. Thus, with 300 identities, around 135K triplets are generated (from which the semi-hard ones will be selected).
-
–
Restricted (R): the generator does not allow triplets with mixed demographic groups (i.e. ) and identities are equally distributed. Thus, with 300 identities, more than 22K triplets are generated (from which the semi-hard ones will be selected).
-
–
-
•
Triplet Selection: Triplet selection is done online during the training process for efficiency. Among all the triplets in the generated batches, the online selection chooses those for which: . These are semi-hard triplets and are crucial to have an adequate convergence and not to lead to bad local minima [47]. If a demographic group is not well modeled by the network (both in terms of genuine or impostor comparisons), more triplets from this group are likely to be included in the online selection. This selection is purely guided by performance over each demographic group and could change for each batch depending on model deficiencies.
We chose triplet loss as the basis for Sensitive Loss because it allows us to incorporate the demographic-aware learning in a natural way. The process is data driven and does not require a large number of images per identity (e.g. while softmax requires a large number of samples per identity we only use images per identity). Another advantage is that it is not necessary to train the entire network, and triplet loss can be applied as a domain adaptation technique. In our case, we trained the model to move from a biased domain x to an unbiased domain . Our results demonstrate that biased representations x that exhibit clear performance differences contain the information necessary to reduce such differences. In other words, bias can be at least partially corrected from representations obtained from pre-trained networks, and new models trained from scratch are not necessary. Similar strategies might be applied to other loss functions.
5 Evaluation Procedure
5.1 Databases for discrimination-aware learning
DiveFace [37] contains annotations equally distributed among six classes related to gender and ethnicity. There are 24K identities (4K per class) and 3 images per identity for a total number of images equal to 72K. Users are grouped according to their gender (male or female) and three categories related with ethnic physical characteristics: Caucasian: people with ancestral origins in Europe, North-America, and Latin-America (with European origin). African/Indian: people with ancestral origins in Sub-Saharan Africa, India, Bangladesh, Bhutan, among others. Asian: people with ancestral origin in Japan, China, Korea, and other countries in that region.
Races Face in the Wild (RFW) [39] is divided into four demographic classes: Caucasian, Indian, Asian and African. Each class has about 10K images of 3K individuals. There are no major differences in pose, age and gender distribution between Caucasian, Asian and Indian groups. The African set has smaller age difference than the others, and while in the other groups women represent about 35%, in Africans they represent less than 10%.
BUPT-Balancedface (BUPT-B) [17] contains 1.3M images from 28K celebrities obtained from MS-Celeb-1M [25]. Divided into 4 demographic groups, it is roughly balanced by race with 7K subjects per race: Caucasian, Indian, Asian, and African; with 326K, 325K, 275K and 324K images respectively. No gender data is available for this dataset.
5.2 Deep face recognition models
VGG-Face [28]: Model based on the VGG-Very-Deep-16 CNN traditional architecture with 138M parameters. We used a pre-trained model222Available on https://github.com/rcmalli/keras-vggface trained with the VGGFace2 dataset according to the details provided in [27]. The VGG models were developed by the Visual Geometry Group (VGG) at the University of Oxford for face recognition and demonstrated on benchmark computer vision datasets [28].
ResNet-50 [22]: ResNet-50 is a CNN model with 25M parameters initially proposed for general purpose image recognition tasks [22]. Combines convolutional neural networks with residual connections to allow information to skip layers and improve gradient flow. These models have been tested on competitive evaluations and public benchmarks [28, 27]. The model2 we used has been trained with the VGGFace2 dataset.
5.3 Implementation details
The proposed de-biasing method Sensitive Loss does not require retraining the entire pre-trained model (see Fig. 3). The sensitive triplets are used to train a dense layer with the following characteristics: number of units equal to the size of the pre-trained representation x (,, , and units for VGG-Face, ResNet-50 and ArcFace respectively), dropout (of 0.5 for VGG-Face and Resnet-50 and 0.05 for ArcFace), linear activation, random initialization, and normalization. This layer, relatively easy to train (10 epochs and Adam optimizer), will be used to generate the new representation .
The experiments are carried out with -fold cross-validation across users and three images per identity (therefore genuine and impostor combinations per identity), with 5 folds. Thus, the three databases are divided into a training set () and a test set () in every fold. Resulting in a total of K genuine comparisons (DiveFace K, RFW K y BUPT K) and M impostor comparisons (DiveFace M, RFW M y BUPT M).
6 Experiments
6.1 Demographic bias in learned representations
We applied a popular data visualization algorithm to better understand the importance of ethnic features in the embedding space generated by deep models. t-SNE is an algorithm to visualize high-dimensional data. This algorithm minimizes the Kullback-Leibler divergence between the joint probabilities of the low-dimensional embedding and the high-dimensional data.
Fig. 4 shows the projection of each face into a 2D space generated from ResNet-50 embeddings and the t-SNE algorithm. This t-SNE projection is unsupervised and just uses as input the face embeddings without any labels. After running t-SNE, we have colored each projected point according to its ethnic attribute. As we can see, the consequent face representation results in three clusters highly correlated with the ethnicity attributes. Note that ResNet-50 has been trained for face recognition, not ethnicity detection. However, the gender and ethnicity information is highly embedded in the feature space and the unsupervised t-SNE algorithm reveals the presence of this information.
We have used the t-SNE algorithm also on the embeddings of our method, and the result is the same as in Fig.4. This means that ethnic information is still present. We do not propose to remove racial information, this information is key to recognition and it isnot our goal to remove it, in fact removing it decreases performance, as shown in [18].
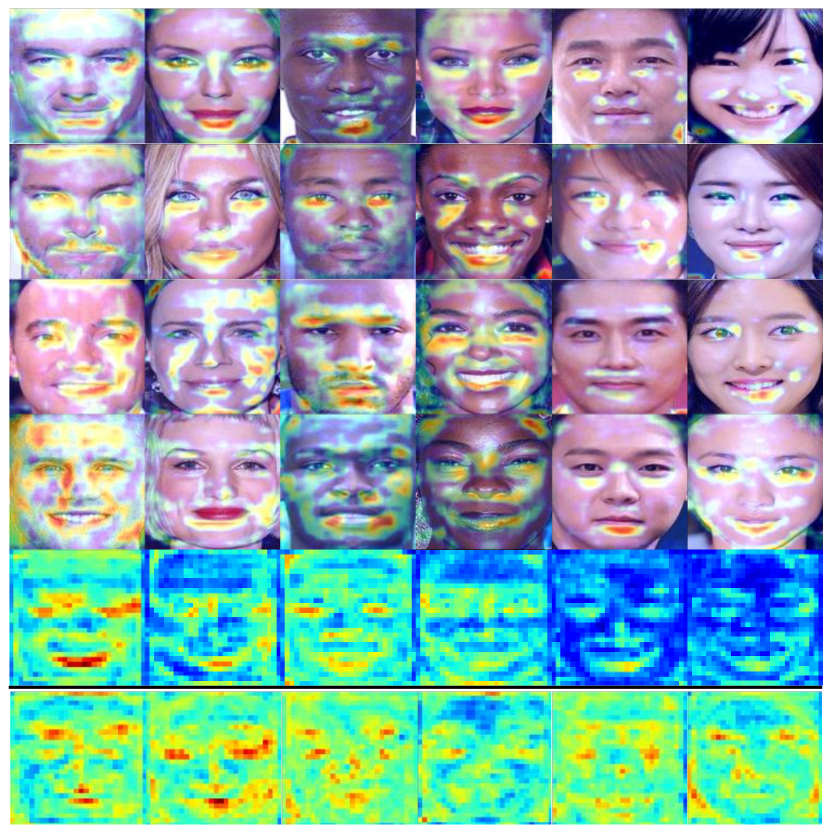
On a different front, CNNs are composed of a large number of stacked filters. These filters are trained to extract the richest information for a pre-defined task (e.g. face recognitionin). Since face recognition models are trained to identify individuals, it is reasonable to think that the response of the models may vary slightly from one person to another. In order to visualize the response of the model to different faces, we consider the specific Class Activation MAP (CAM) proposed in [51], named Grad-CAM. This visualization technique uses the gradients of a target flowing into the selected convolutional layer to produce a coarse localization map. The resulting heatmap highlights the activated regions in the image for the selected target (e.g. an individual identity in our case).
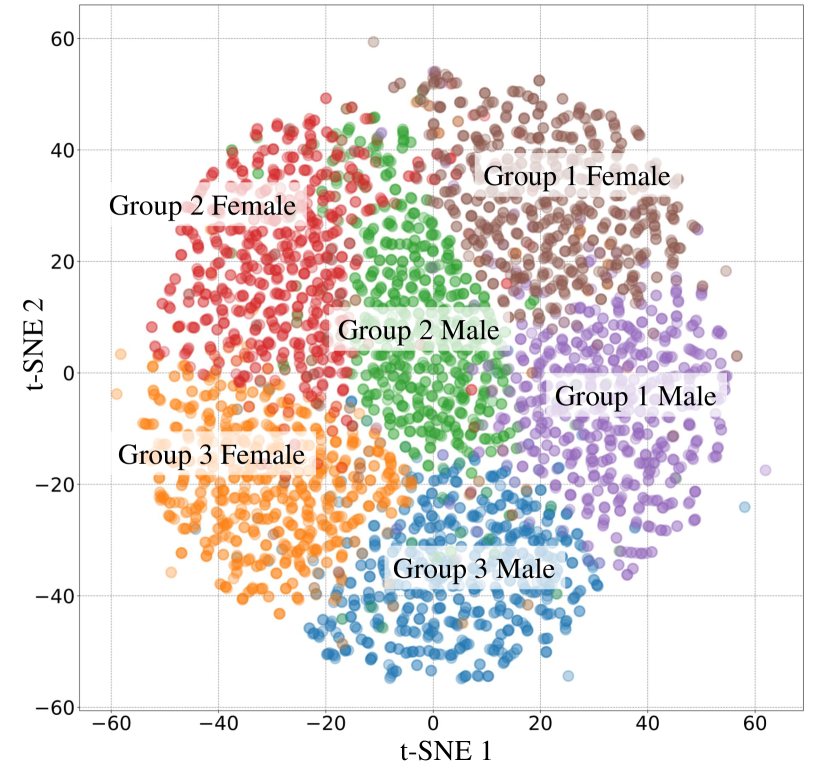
Fig. 5 represents the heatmaps obtained in the first filter of the third convolutional block of ResNet-50 for faces from the six demographic groups included in DiveFace. Each column corresponds to a demographic group. The first rows contain face images with their heatmap superimposed. The last two rows represent the heatmaps obtained in the same ResNet-50 filter without and with our method after averaging results from 120 different individuals. For a better visualization the 120 images chosen are all frontal. We only averaged a small group of individuals because if we did it with the whole dataset nothing would be seen, since the images vary widely in pose and morphology.
The activation maps show clear differences between ethnic groups with the highest activation for caucasians and the lowest for asians. These differences suggest that features extracted by the model are, at least, partially affected by the ethnic attributes. However, with our method (last row) the activations are more homogeneous across demographic groups. This homogeneous activation suggests a better representation across the different ethnic groups. Recent work has shown that there is a correlation between high activations and performance in CNN’s architectures [52]. The activation maps obtained with the VGG-Face and ArcFace models are similar to those of ResNet-50.
These two experiments illustrate the presence and importance of ethnic attributes in the feature space generated by face deep models.
-
Algorithmic Discrimination implications: popular deep models trained for task T on biased databases (i.e., unequally represented classes for a given demographic criterion such as gender) result in feature spaces (corresponding to the solution of the Eq. 2) that introduce strong differentiation between classes . This differentiation affects the representation x and enables classifying between classes using x, even though x was trained for solving a different task .
| Model | DiveFace | |||||||
|---|---|---|---|---|---|---|---|---|
| Caucasian | Indian/African | Asian | ||||||
| Male | Female | Male | Female | Male | Female | Avg | Std | |
| VGG-Face | 1.62 | 1.76 | 2.06 | 2.33 | 2.53 | 3.15 | 2.24 | 0.51 |
| VGG-Face-U | 1.84 | 1.98 | 1.63 | 1.77 | 1.38 | 1.44 | 1.67 (25%) | 0.21 (58%) |
| VGG-Face-R | 1.80 | 1.97 | 1.65 | 1.77 | 1.42 | 1.42 | 1.67 (25%) | 0.20 (61%) |
| ResNet-50 | 0.63 | 0.73 | 0.88 | 1.41 | 0.99 | 1.26 | 0.98 | 0.28 |
| ResNet-50-U | 0.84 | 0.90 | 0.74 | 1.21 | 0.58 | 0.60 | 0.81 (17%) | 0.21 (24%) |
| ResNet-50-R | 0.90 | 0.93 | 0.78 | 1.22 | 0.61 | 0.62 | 0.84 (14%) | 0.21 (25%) |
| ArcFace | 0.79 | 0.85 | 1.11 | 1.98 | 1.34 | 1.27 | 1.22 | 0.39 |
| ArcFace-U | 0.71 | 0.67 | 1.08 | 1.79 | 1.24 | 1.17 | 1.11 (9%) | 0.37 (5%) |
| ArcFace-R | 0.69 | 0.65 | 0.96 | 1.88 | 1.22 | 1.19 | 1.10 (10%) | 0.41 (5%) |
| Model | RFW | |||||
|---|---|---|---|---|---|---|
| Caucasian | Indian | African | Asian | |||
| Avg | Std | |||||
| VGG-Face | 8.22 | 10.38 | 17.24 | 13.67 | 12.38 | 3.41 |
| VGG-Face-U | 7.34 | 7.78 | 13.09 | 9.47 | 9.42 (24%) | 2.27 (34%) |
| VGG-Face-R | 7.26 | 7.75 | 12.79 | 9.05 | 9.21 (26%) | 2.17 (36%) |
| ResNet-50 | 3.62 | 4.72 | 5.75 | 5.96 | 5.01 | 0.93 |
| ResNet-50-U | 3.02 | 3.29 | 3.99 | 3.83 | 3.53 (30%) | 0.40 (58%) |
| ResNet-50-R | 3.02 | 3.22 | 4.06 | 3.92 | 3.56 (29%) | 0.44 (53%) |
| BUPT-Balanceface | ||||||
|---|---|---|---|---|---|---|
| VGG-Face | 7.18 | 7.44 | 9.78 | 12.56 | 9.24 | 2.17 |
| VGG-Face-U | 6.49 | 4.97 | 7.73 | 8.29 | 6.87 (26%) | 1.28 (41%) |
| VGG-Face-R | 6.48 | 5.03 | 7.68 | 8.20 | 6.85 (26%) | 1.22 (44%) |
| ResNet-50 | 3.24 | 2.65 | 3.80 | 5.56 | 3.82 | 1.09 |
| ResNet-50-U | 2.62 | 1.69 | 2.72 | 3.19 | 2.56 (33%) | 0.54 (50%) |
| ResNet-50-R | 2.62 | 1.72 | 2.77 | 3.12 | 2.56 (32%) | 0.52 (52%) |
6.2 Performance of Sensitive Loss
Table II shows the performance (Equal Error Rate EER in %) for each demographic group as well as the average EER on the DiveFace, RFW and BUPT test sets for the baseline models (VGG-Face, ResNet-50 and ArcFace), and the Sensitive Loss methods described in Section 4.1 (Unrestricted and Restricted). In order to measure the fairness, Table II includes the Standard deviation of the EER across demographic groups (Std). Theses measures were proposed in [17, 18] to analyze the performance of de-biasing algorithms.
If we focus on the results obtained by the Baseline systems (denoted as VGG-Face, ResNet-50 and ArcFace), the different performances obtained for similar demographic groups in the three databases are caused by the different characteristics of each database (e.g. the African set has a smaller age difference than the others in RFW). The results reported in Table II exhibit large gaps between the performances obtained by the different demographic groups, suggesting that both gender and ethnicity significantly affect the performance of biased models. These effects are particularly high for ethnicity, with a very large degradation in performance for the class less represented in the training data. For DiveFace, this degradation produces a relative increment of the Equal Error Rate (EER) of , and for VGG-Face, ResNet-50 and ArcFAce, respectively, with regard to the best class (Caucasian Male). For RFW and BUPT-Balanceface the differences between demographic groups are similar but not so large, because the distinction between the demographic groups is only of ethnic origin and not of sex.
These differences are important as they mark the percentage of faces successfully matched and faces incorrectly matched for a certain threshold. These results indicate that ethnicity can greatly affect the chances of being mismatched (false positives).
Concerning the triplet generation method (Unrestricted or Resticted, see Section 4.2), both methods show competitive performances with similar improvements over the baseline approaches. The higher number of triplets generated by the Unrestricted method (about times more) does not show clear improvements compared to the Restricted method. We can see that the biggest improvements are achieved for VGG-Face, and that ArcFace barely improves (in fact ArcFace-R worsens its std by 5%). This is due to the fact that the size of the embedding obtained from VGG-Face is 8 times larger than in ArcFace, a model whose performance is already highly optimized, and therefore the margin of improvement in VGG-Face and ResNet-50 is much greater.
One would think that ResNet-50 is not part of the state of the art. Yet, in Table II you can see that ResNet-50 has a better average accuracy (lower average EER) than ArcFace in the DiveFace database. Normally performance evaluations are done on unbalanced datasets (See Table 2.2), so they don’t show a full picture of their performance. For example, a model that does not perform that well in the Asian Females demographic group, if evaluated on a test set which barely contains samples from this group, will see little or no effect on its overall performance and will appear to be a good model.
The relatively low performance in some groups seems to be originated by a limited ability to capture the best discriminant features for the samples underrepresented in the training databases. ResNet-50 seems to learn better discriminant features as it performs better than VGG-Face. Additionally, ResNet-50 shows smaller difference between demographic groups. The results suggest that features capable of reaching high accuracy for a specific demographic group may be less competitive in others.
Let’s now analyze the causes behind this degradation. Fig. 6 represents the probability distributions of genuine and impostor distance scores for all demographic groups. A comparison between genuine and impostor distributions reveals large differences for impostors. The genuine distribution (intra-class variability) between groups is similar, but the impostor distribution (inter-class variability) is significantly different. The baseline models behave differently between demographic groups when comparing face features from different people.
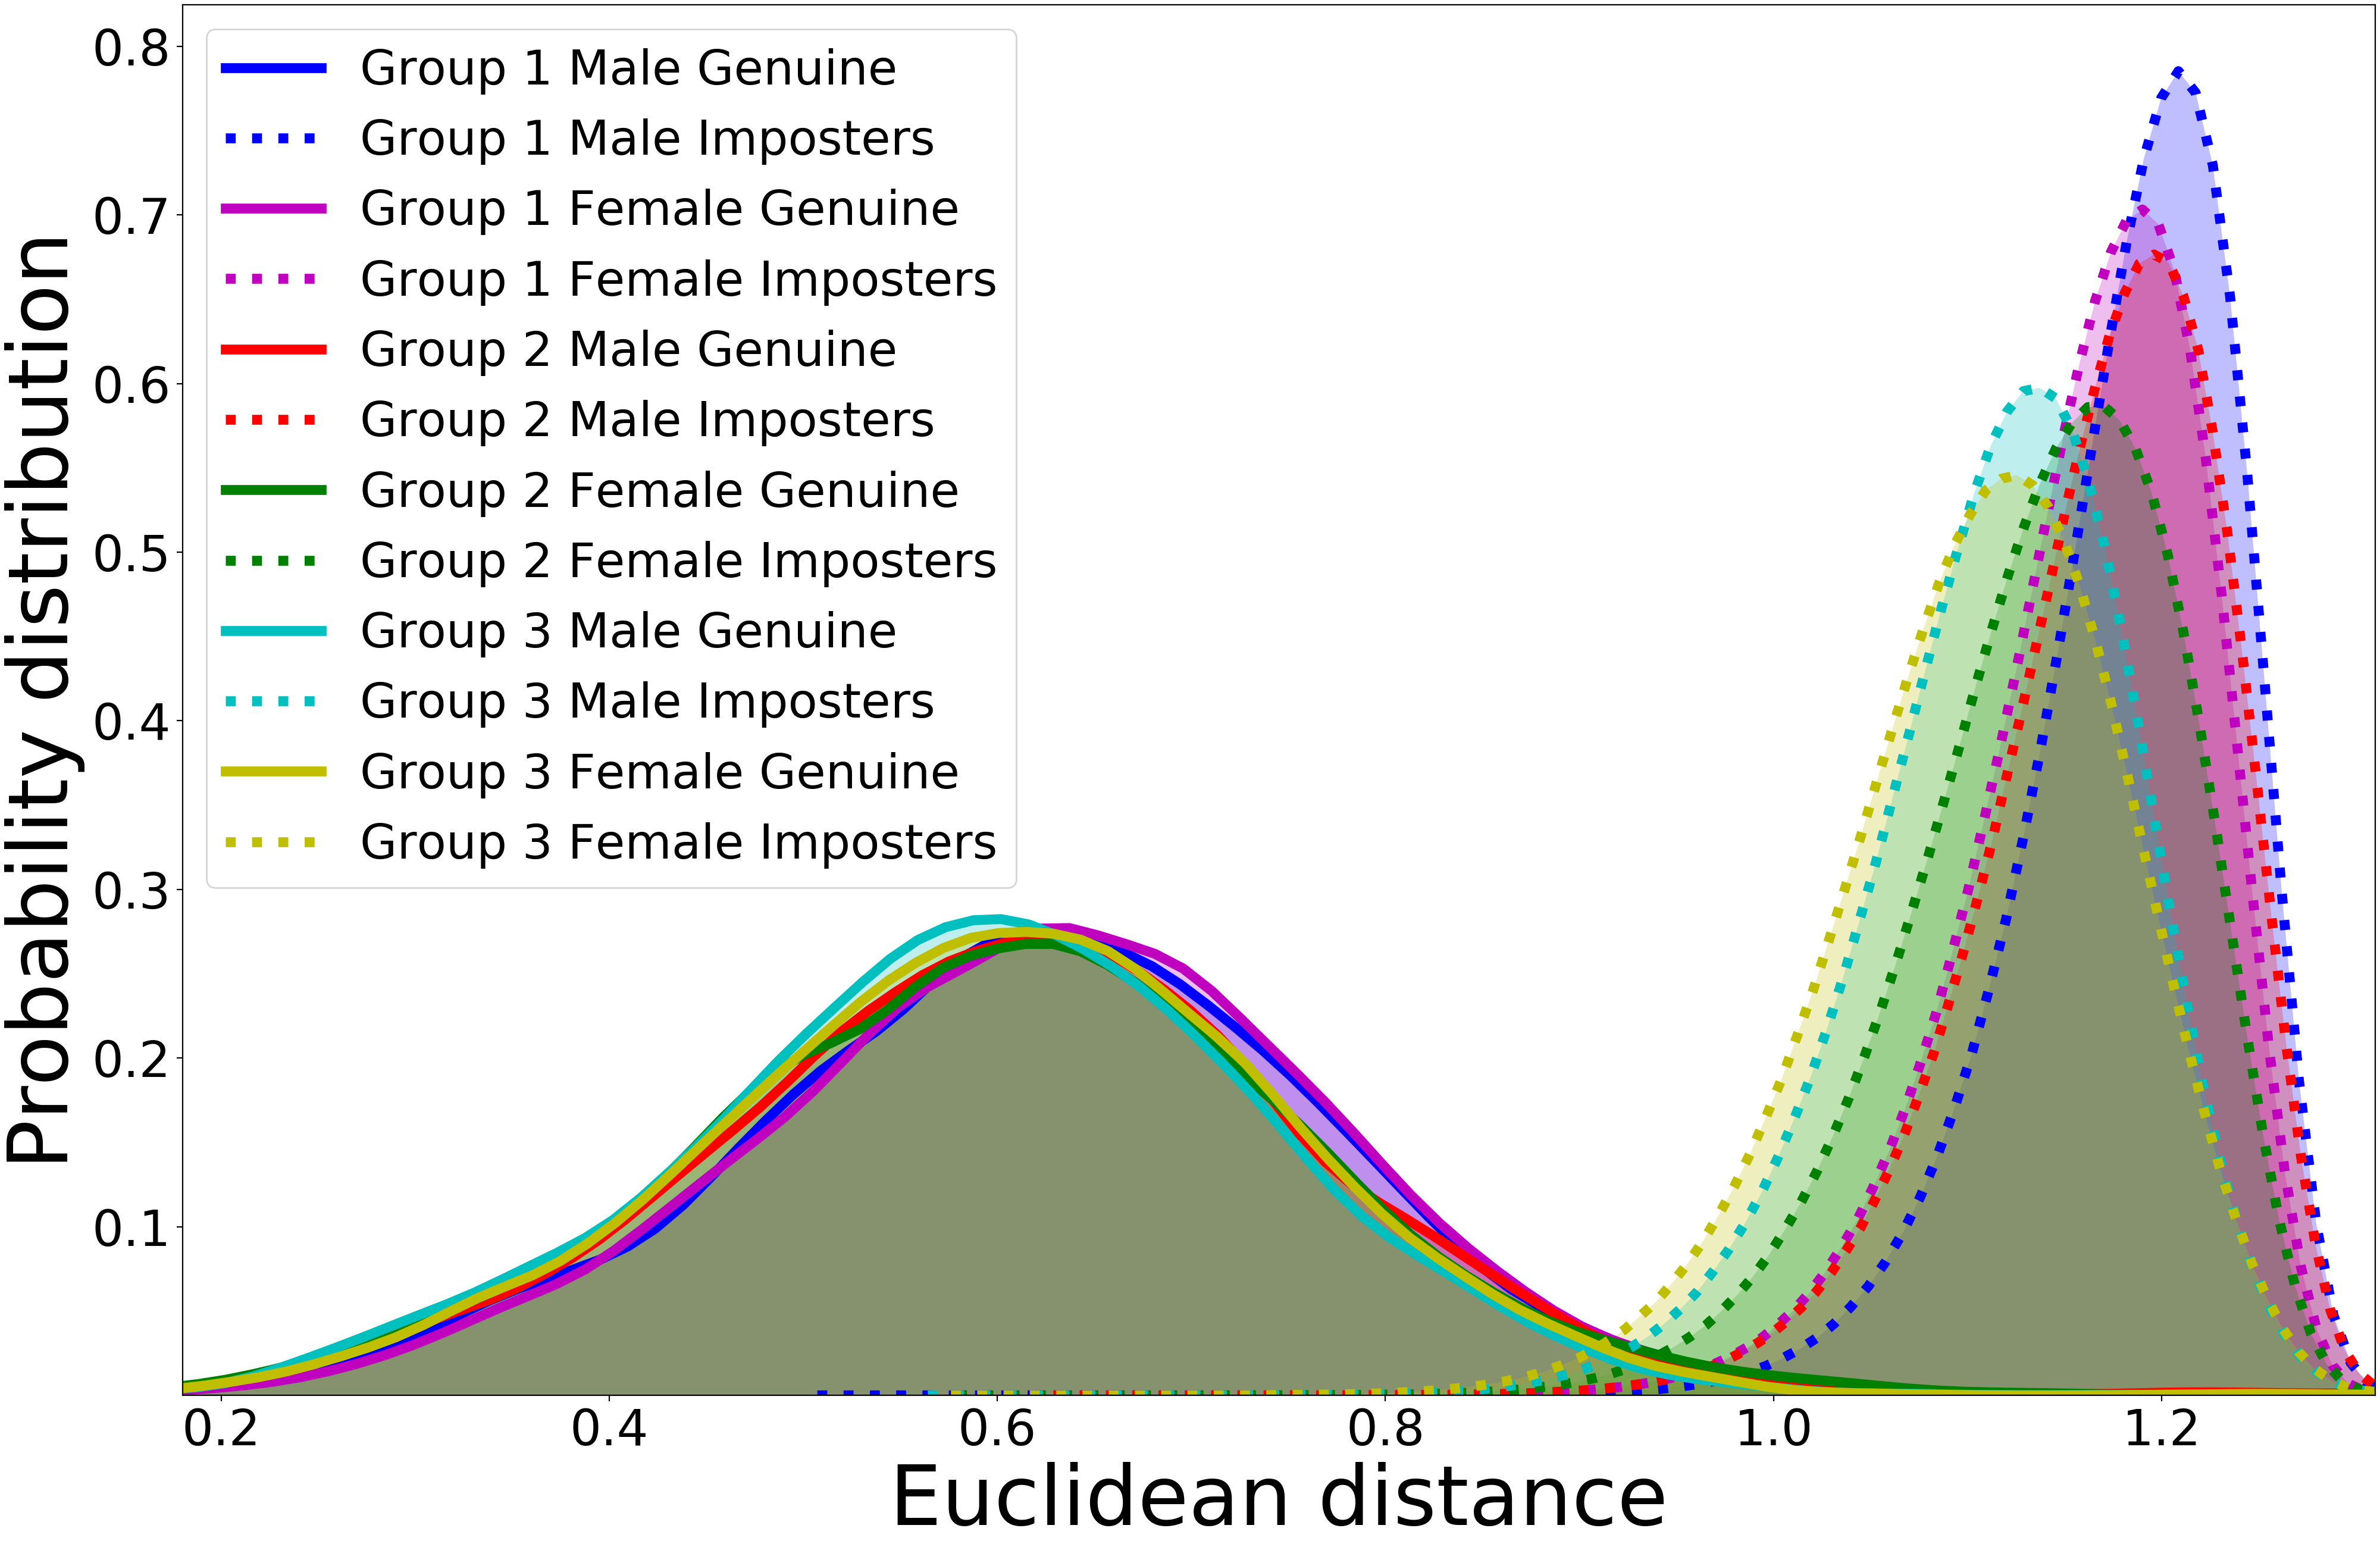
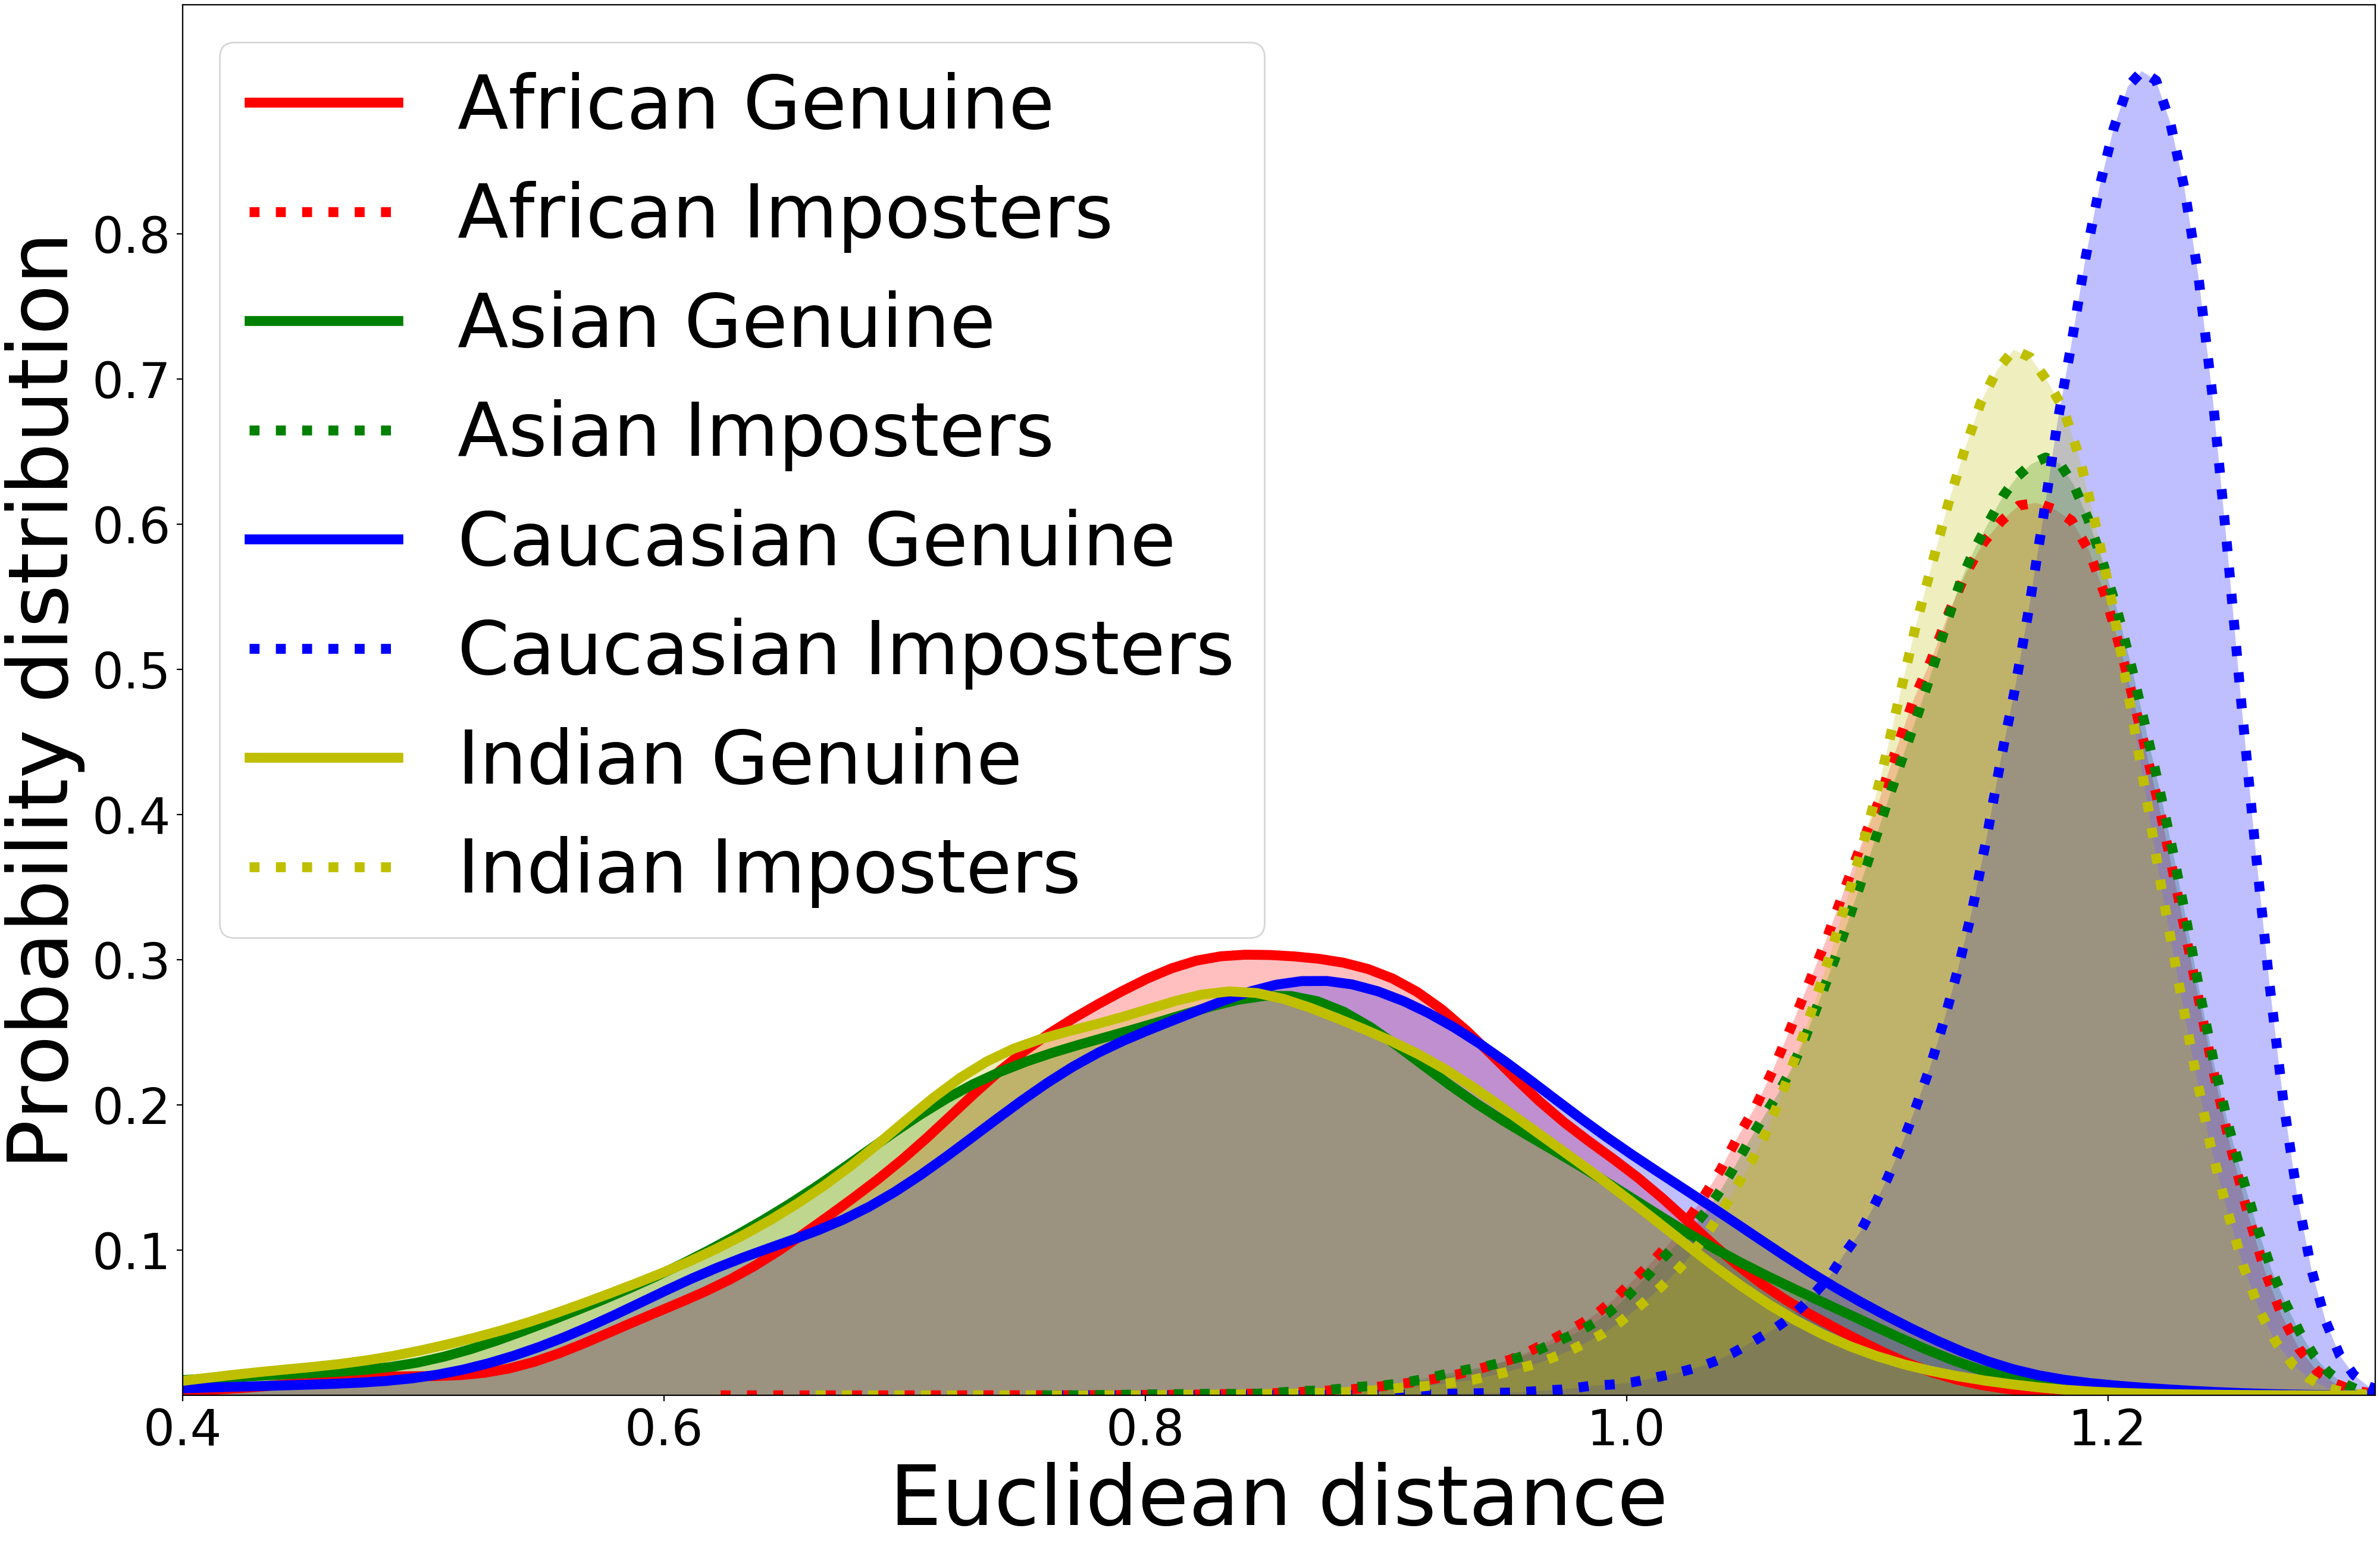
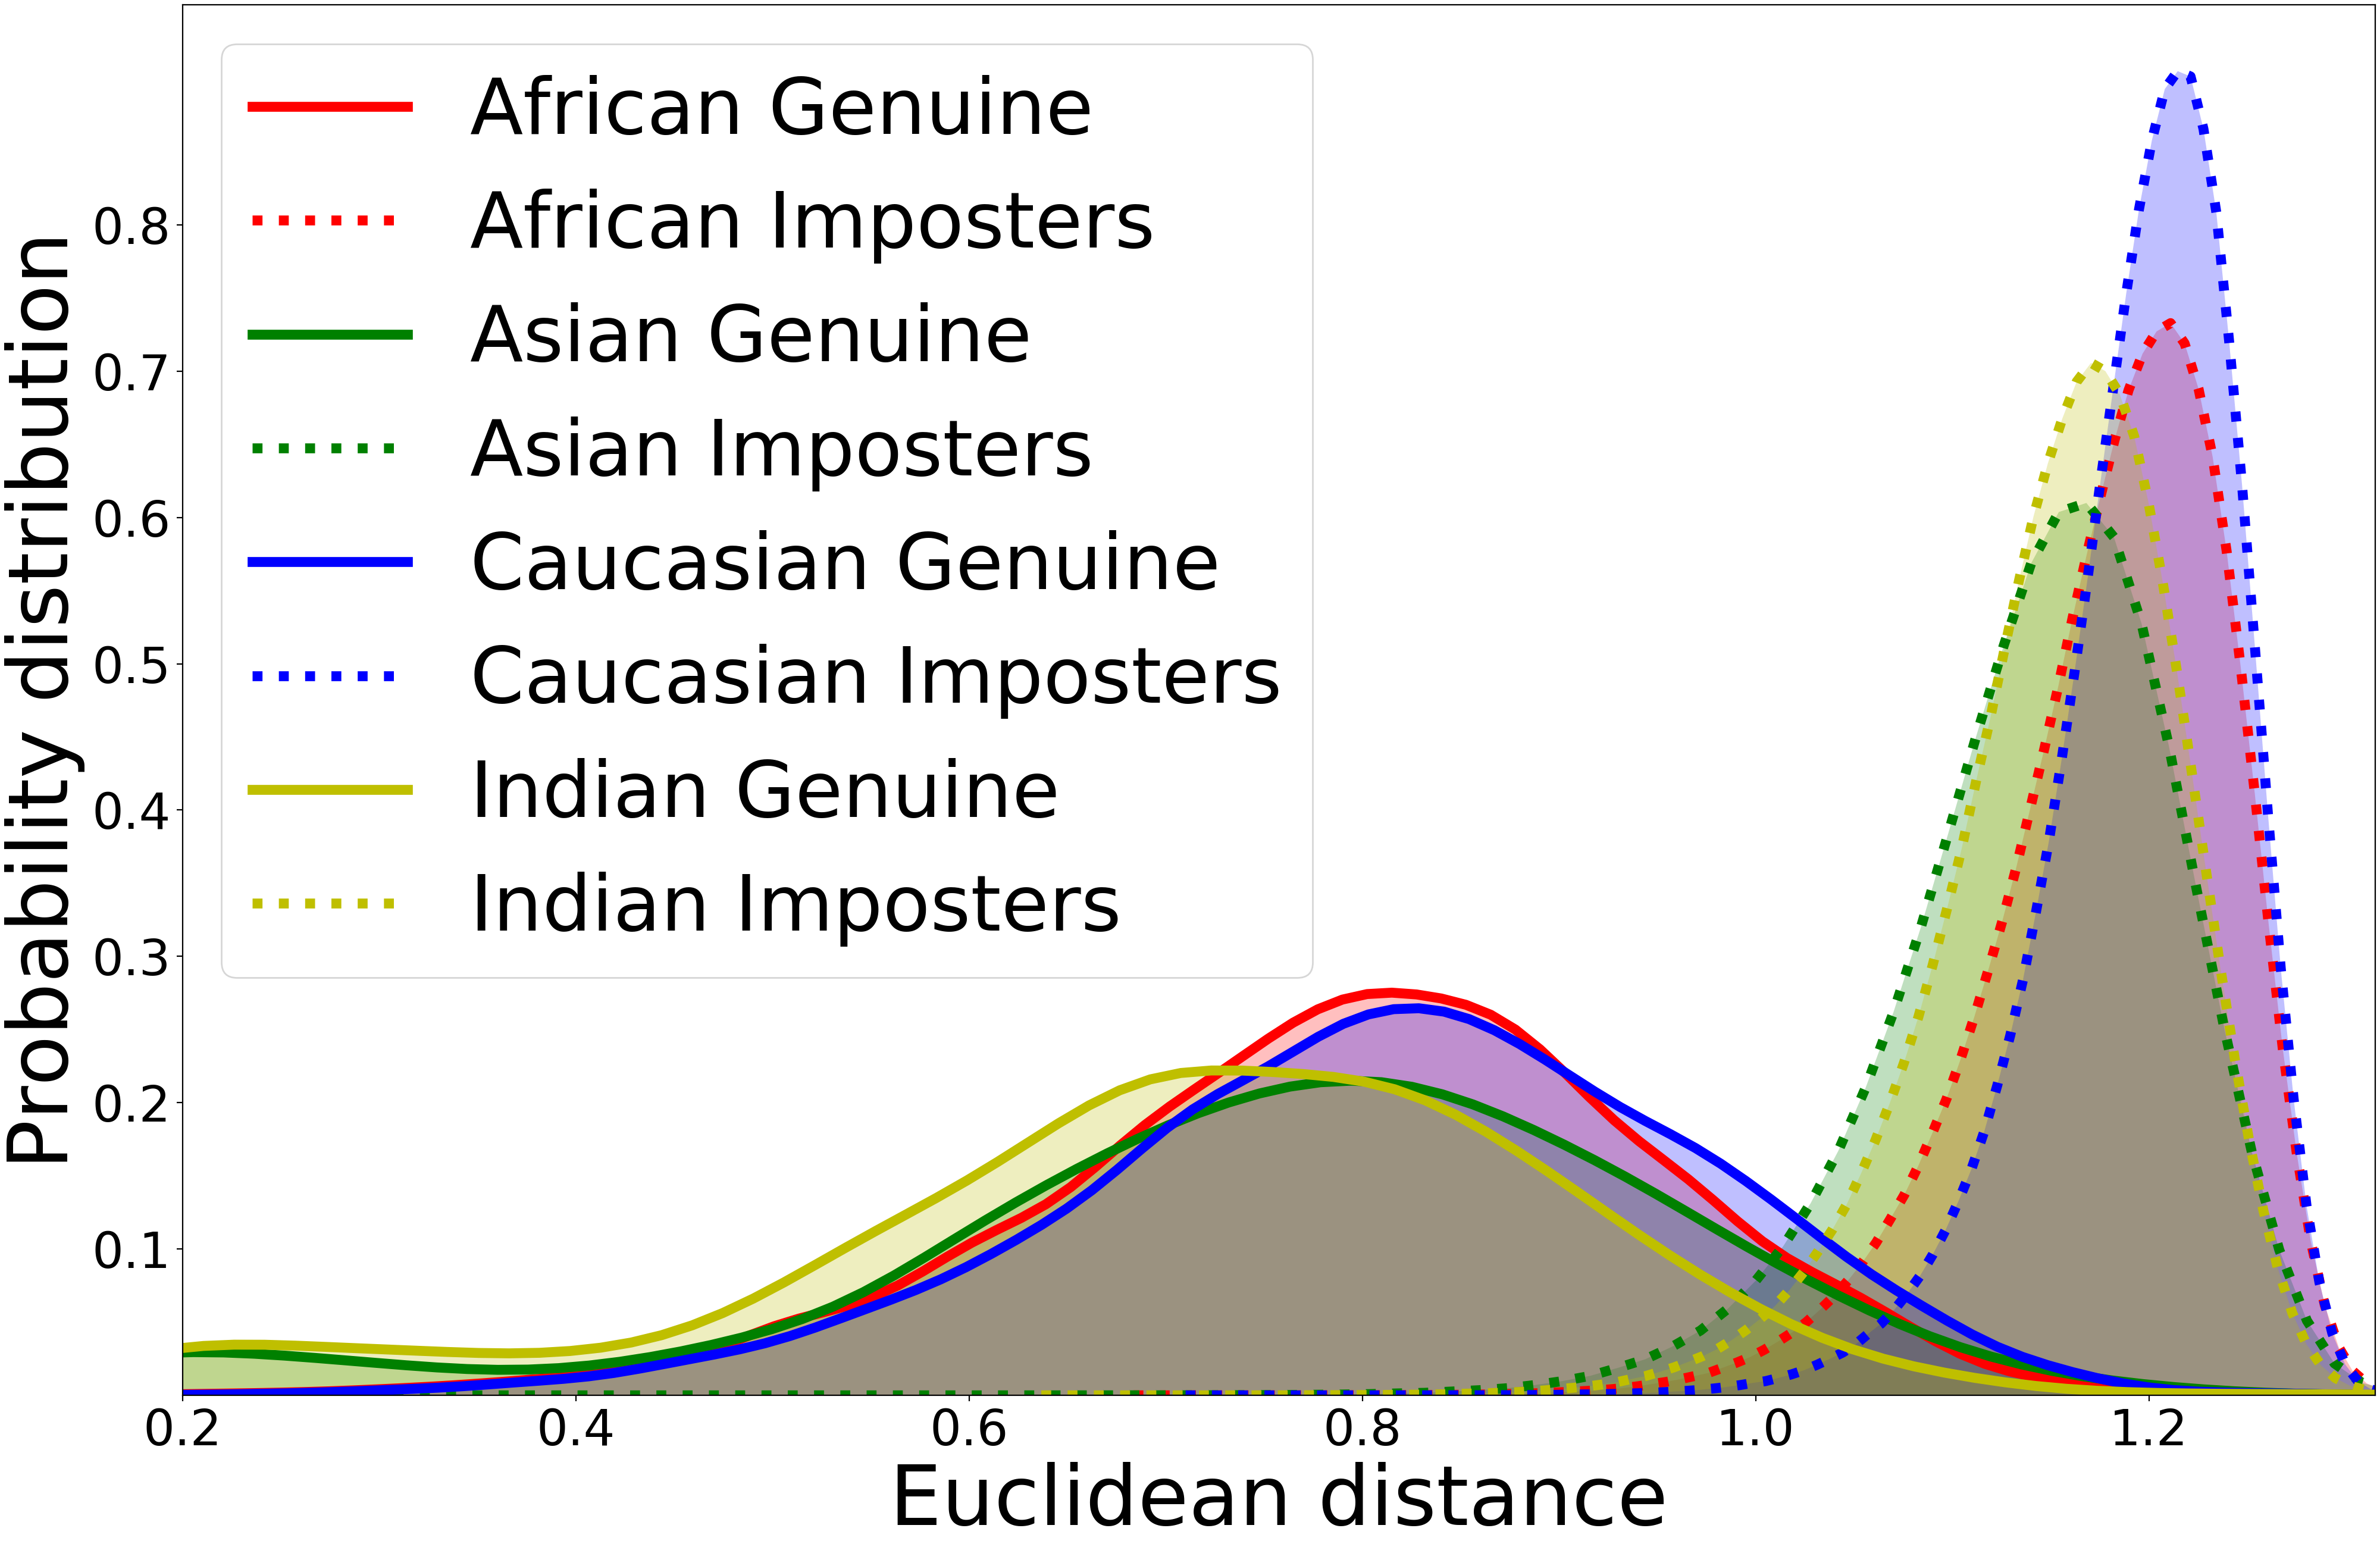
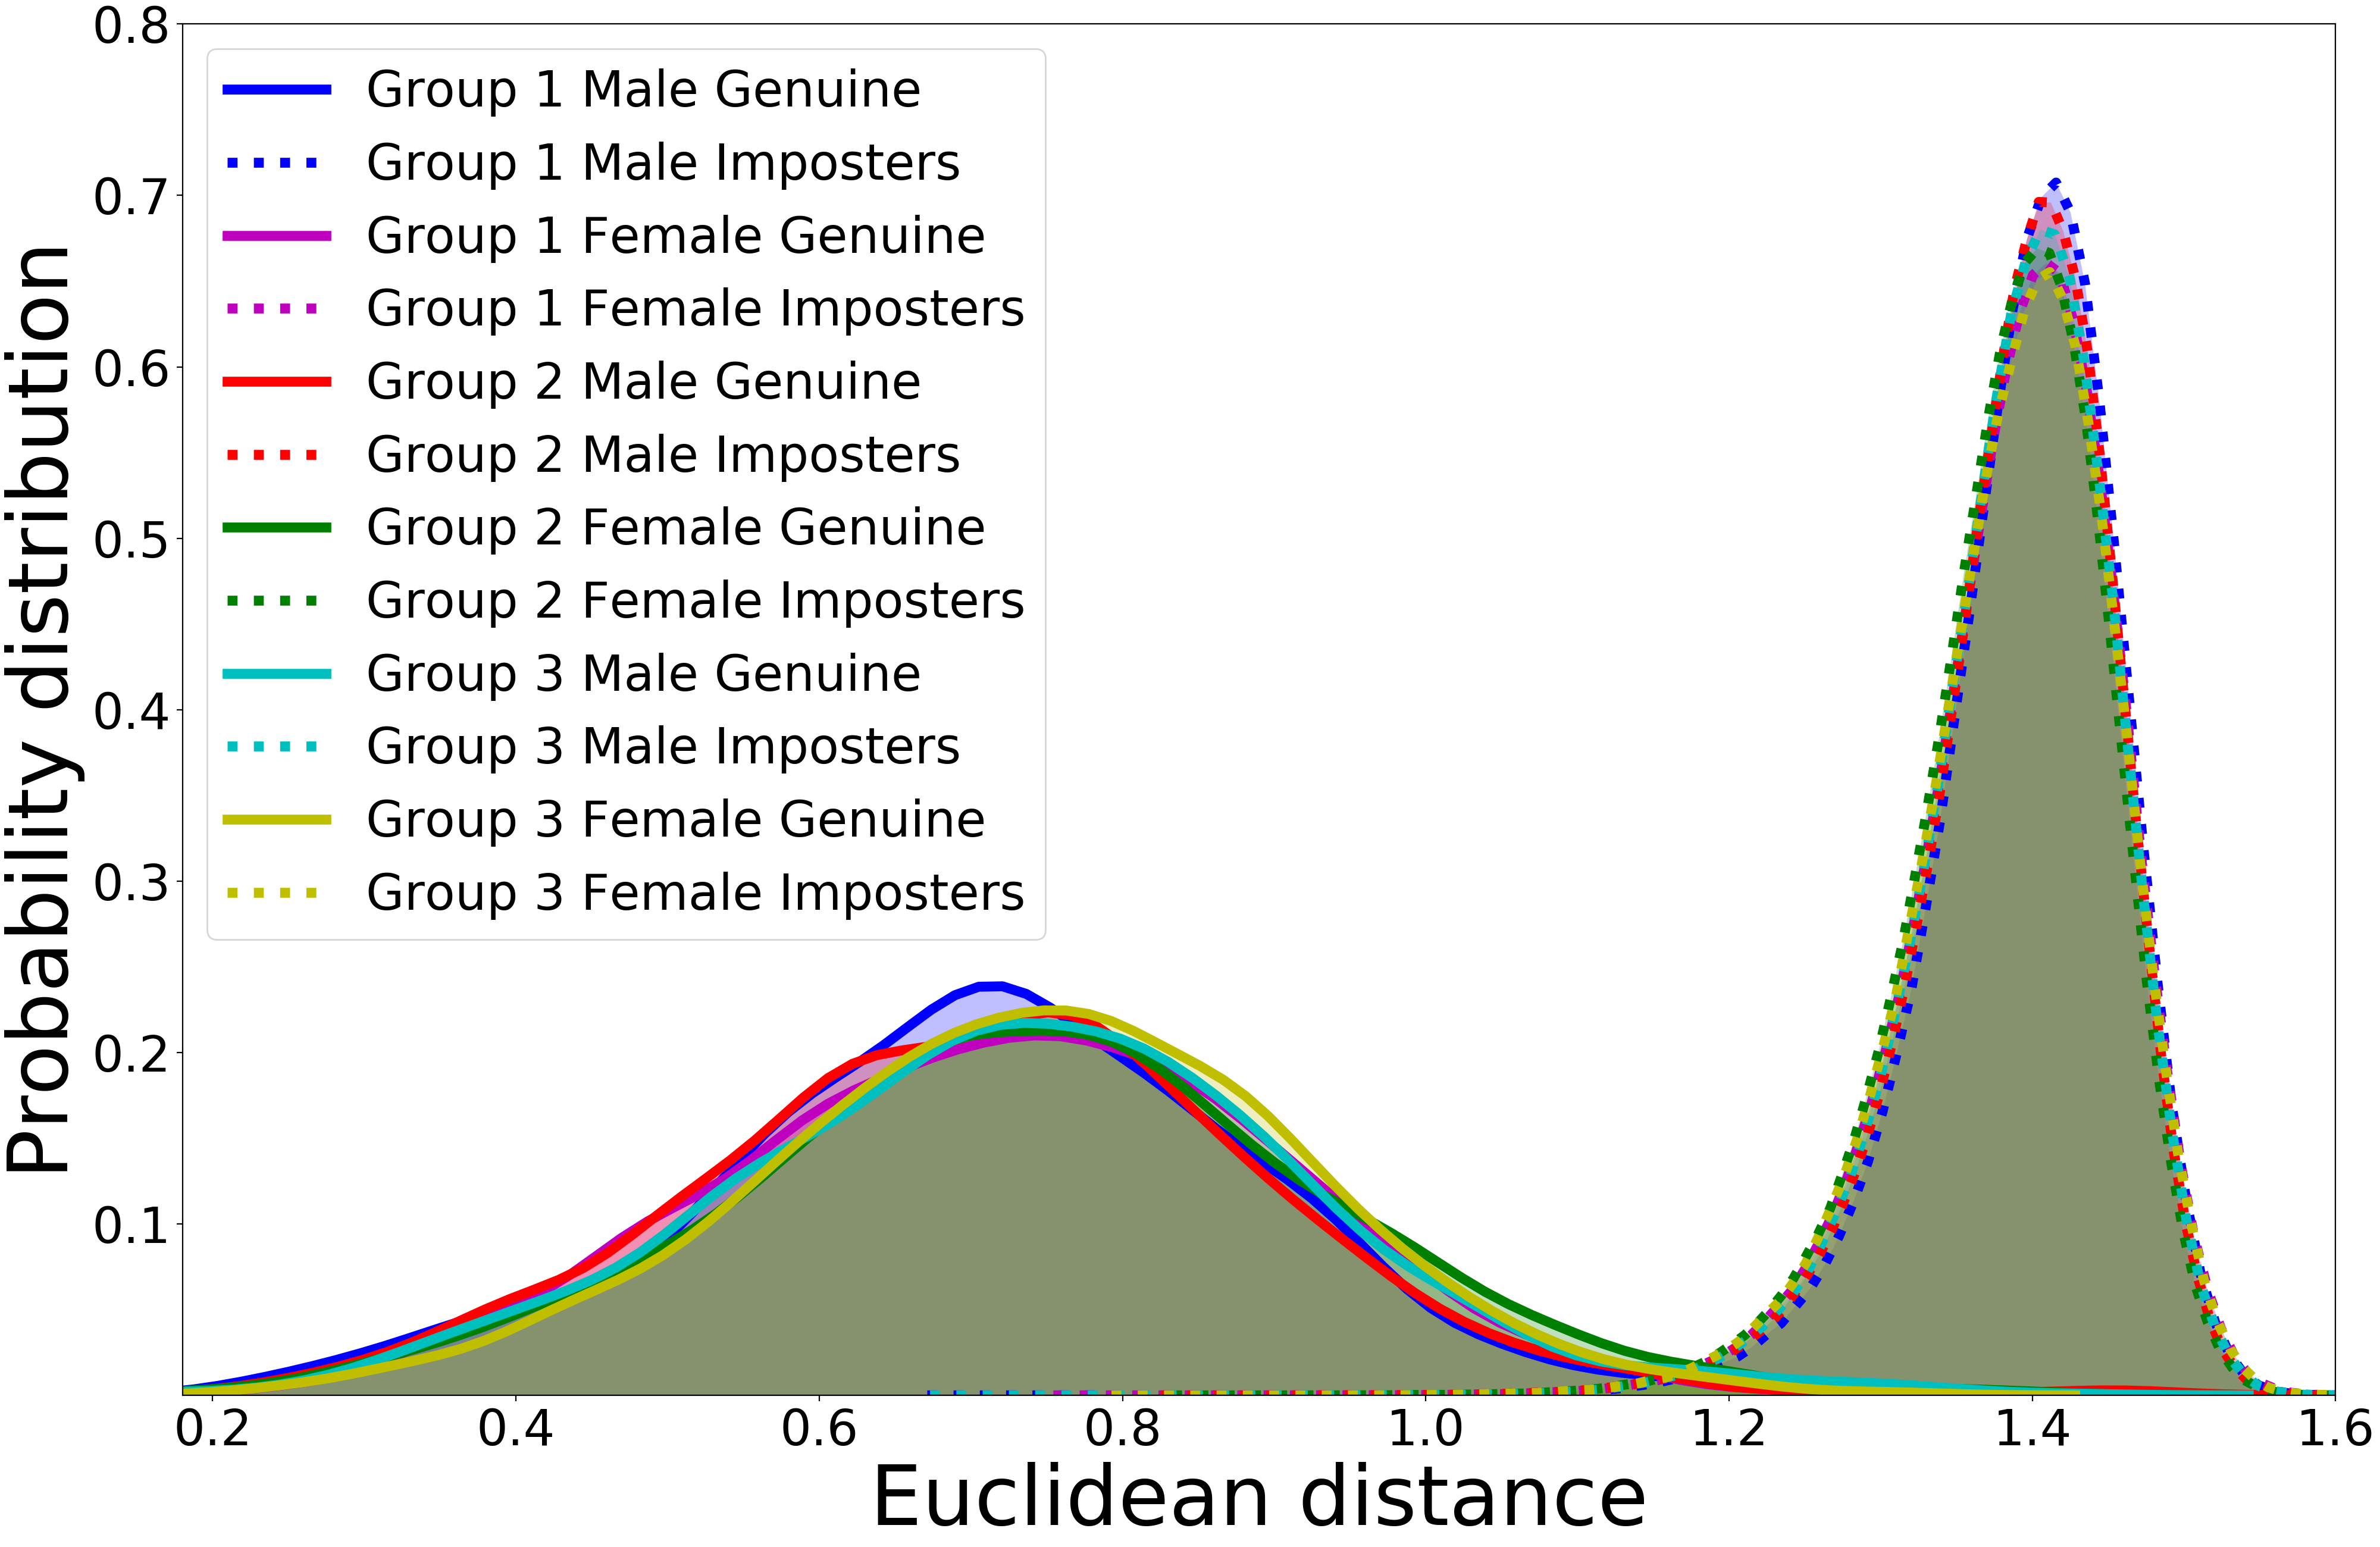
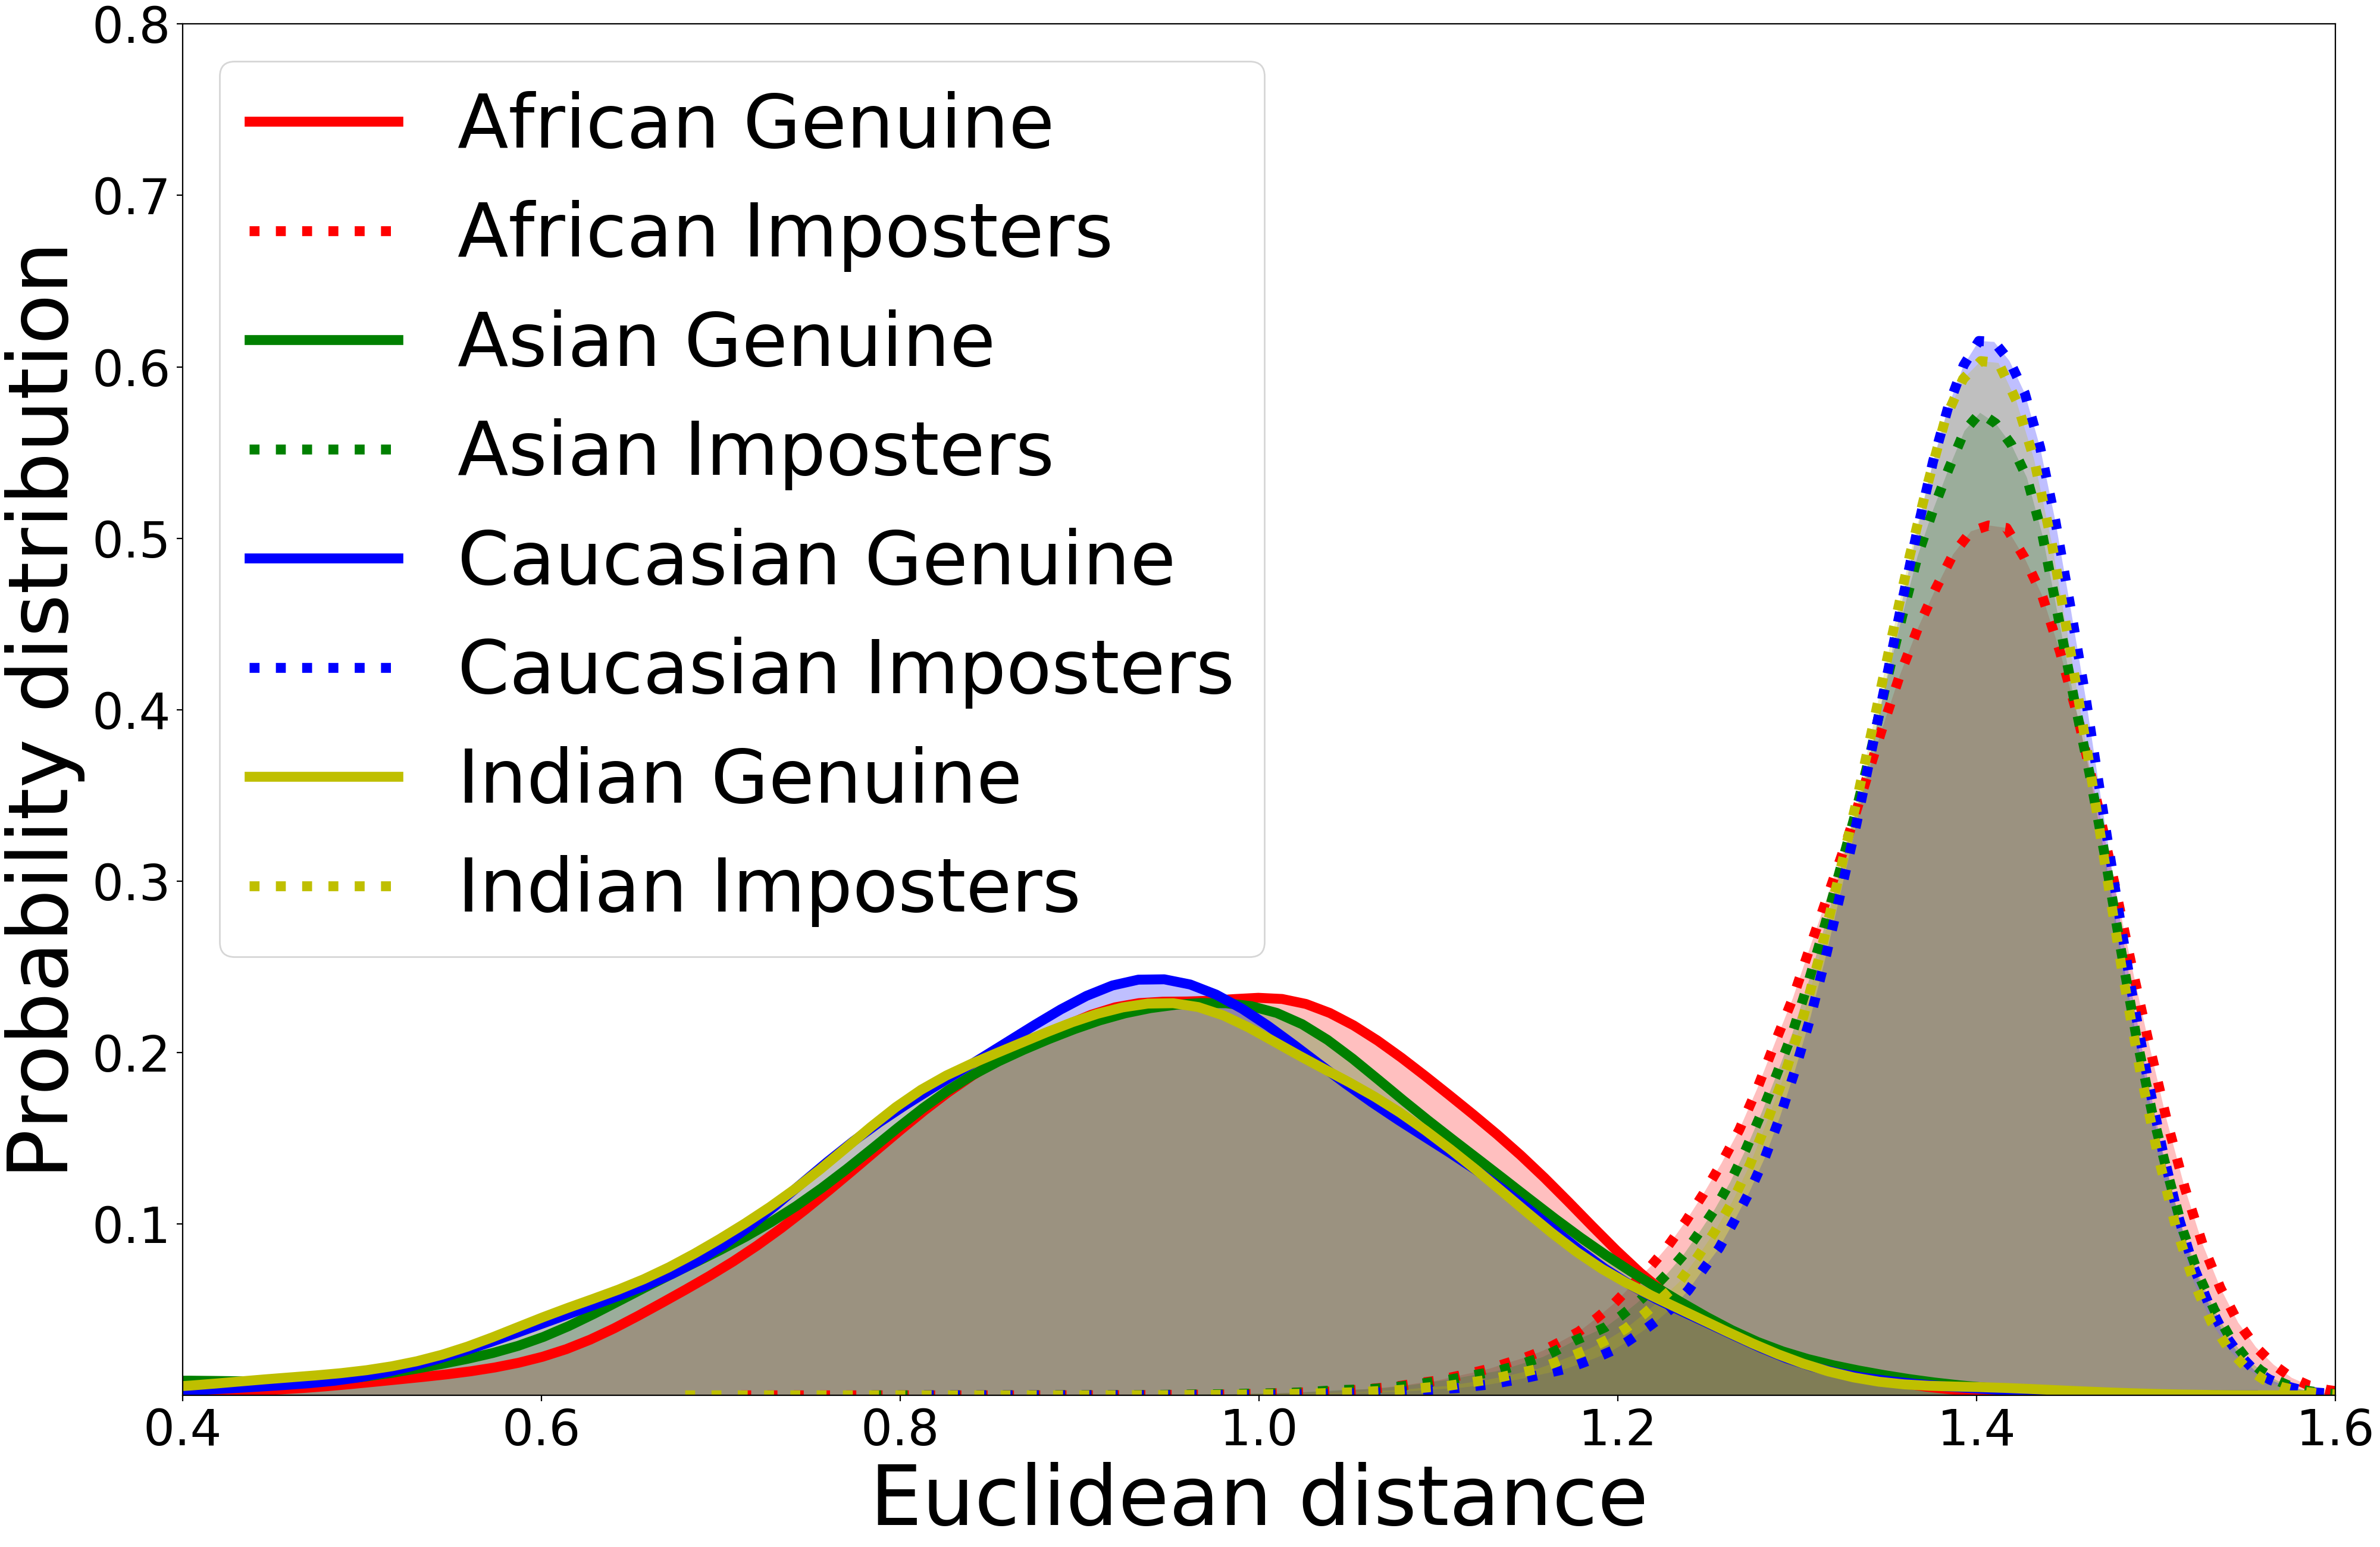
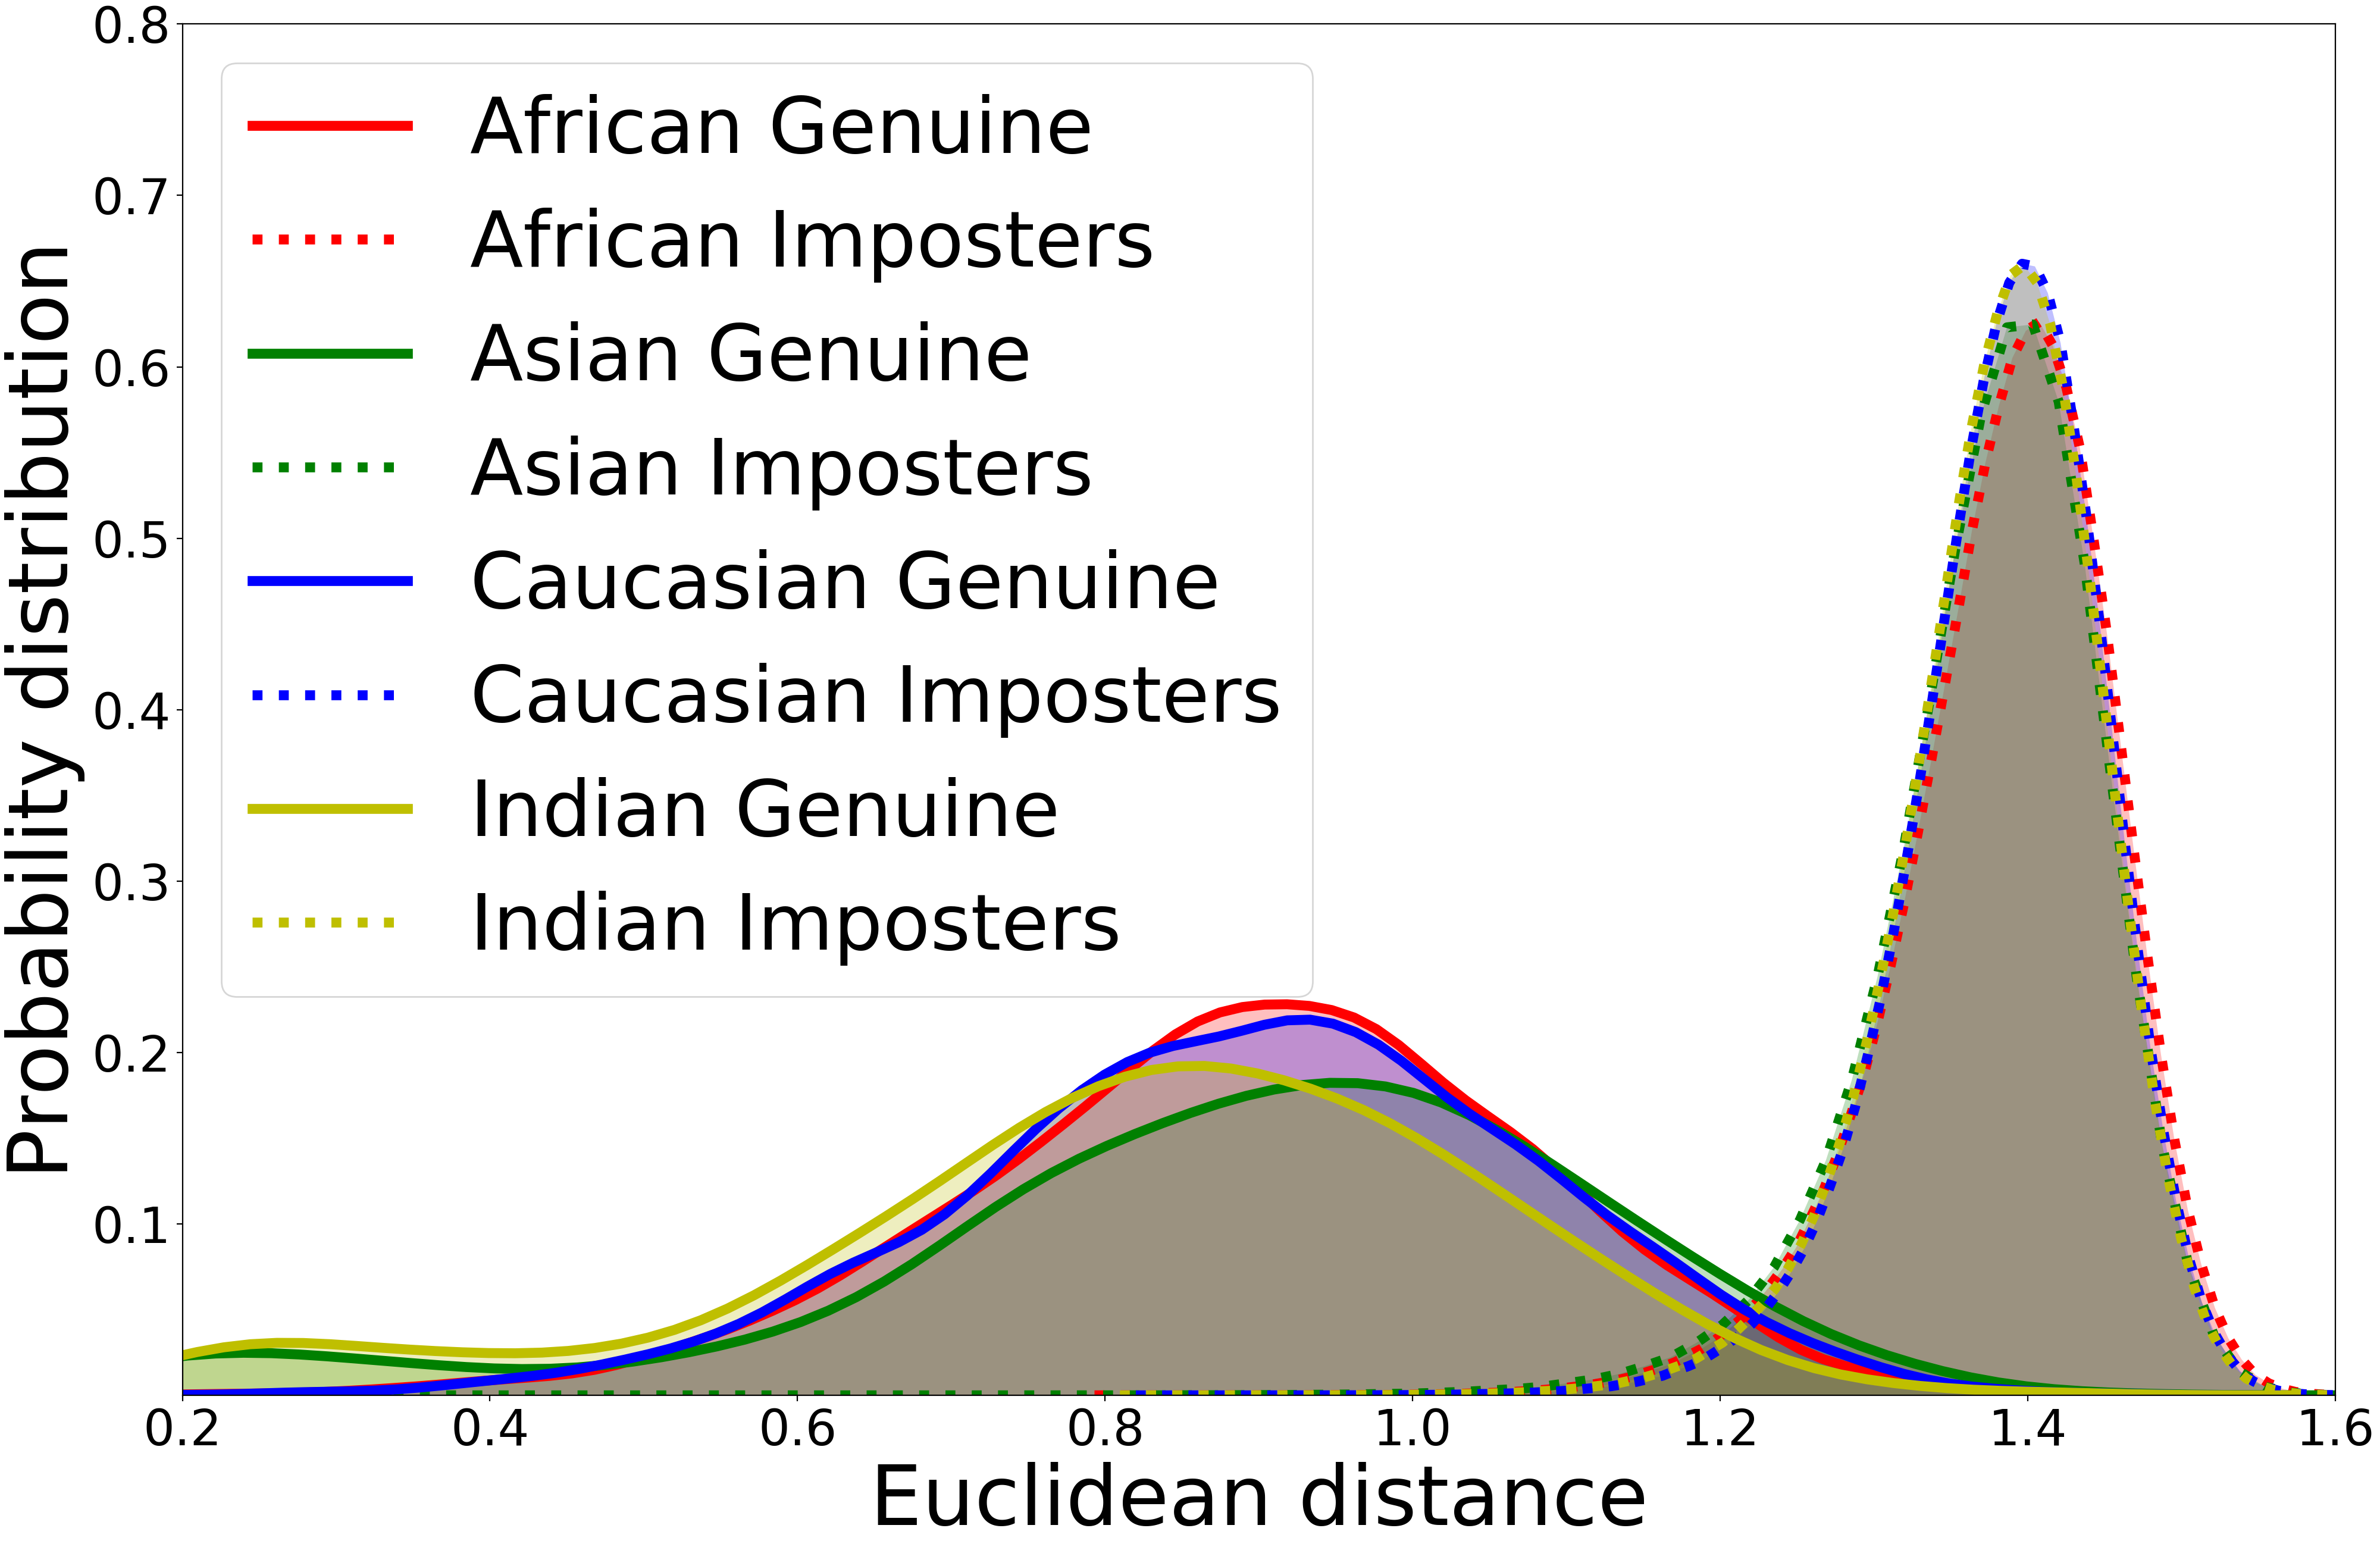
Fig. 6 shows the score distributions obtained for the ResNet-50 model without and with our Sensitive Loss de-biasing method (with Unrestricted sensitive triplet generation). Table II showed performances for specific decision thresholds (at the EER) for face verification. Fig. 6 provides richer information without fixing the decision thresholds. In comparison to the baseline x, we see that the improvements in Accuracy and Fairness caused by our Sensitive Loss discrimination-aware representation mainly come from better alignment of impostor score distributions across demographic groups. These results suggest how the proposed Sensitive Loss learning method was able to correct the biased behavior of the baseline model.
The results obtained by Sensitive Loss outperform the baseline approaches by:
-
i)
Improving the fairness (Std) with lower standard deviation in performance across demographic groups. Fairness improvements in terms of EER Std vary by model and database ranging from to relative improvements with an average improvement of .
-
ii)
Reducing the Average EER in the three databases. The results show that discrimination-aware learning not only helps to train fairer representations but also more accurate ones. Our Sensitive Loss discrimination-aware learning results in better representations for specific demographic groups and collectively for all groups.
-
Algorithmic Discrimination implications: define the performance function as the accuracy of the face recognition model, and the goodness considering all the samples corresponding to class of the demographic criterion , for an algorithm trained on the full set of data (as described in Eq. 2). Results suggest large differences between the goodness for different classes, especially between the classes and Asian.
6.2.1 Comparison with the state of the art
Table III shows the comparison of our approach with two recent state-of-the-art de-biasing techniques [17, 18]. These two methods consist of full networks trained specifically to avoid bias, whereas what we propose here with Sensitive Loss is not an entire network, but rather an add-on method to reduce the biased outcome of a given network.
The results of this comparison should be interpreted with care, because the arrangements are different. Still, the comparison gives us a rough idea of the ranges of bias mitigation in the three methods.
The two approaches we compared ourselves with, have trained the network with only one database: BUPT-BalanceFace. We have instead taken a network already trained with VGGFace2 and added a layer that we have trained with BUPT-BalanceFace. Our network may have an advantage because one part has been trained with VGGFace2 and the other with BUPT-BalanceFace and therefore the average performance is better. However, we are not looking to improve performance, but to reduce discrimination, and with our experiments we want to demonstrate that complex models are not always needed.
DebFace or RL-RBN cannot be compared to our ArcFace-based method because the RFW database is included in MS1M (ArcFace training data set). In fact, both the EER and Std of ArcFace in RFW is up to 10 times lower than that achieved with these. That is why we used the ResNet-50 network for the comparison. We also tested our method using the softmax loss function instead of the triplet loss function. It can be seen that remarkable results are also achieved, although not as good as with triplet loss.
| Method | Caucasian | Indian | African | Asian | Avg | Std |
| RL-RBN (arc) [17] | 3.73 | 5.32 | 5 | 5.18 | () | (34%) |
| DebFace [18] | 4.05 | 5.22 | 6.33 | 5.67 | (NA) | (NA) |
| Sensitive Loss | 2.77 | 3.05 | 4.18 | 3.50 | () | () |
| (Proposed Here) | 3.17 | 3.38 | 4.69 | 3.84 | () | () |
From Table III it can be seen that in terms of fairness (measured as performance differences among demographic groups) our approach is at least comparable to that of dedicated networks trained from scratch to produce unbiased models. Given that similar behavior in terms of fairness improvement, our proposed Sensitive Loss is superior to the compared methods in simplicity and applicability, as it can be directly applied as an add-on to already trained networks without the need for complete retraining.
-
Algorithmic Discrimination implications: the discrimination-aware learning method proposed in this work, Sensitive Loss, is a step forward to prevent discriminatory effects in the usage of automatic face recognition systems. The representation reduces the discriminatory effects of the original representation x as differences between goodness criteria across demographic groups are reduced. However, differences still exist and should be considered in the deployment of these technologies.
7 Conclusions
We have presented a comprehensive analysis of face recognition models based on deep learning according to a new discrimination-aware perspective. We started presenting a new general formulation of Algorithmic Discrimination with application to face recognition. We then showed the high bias introduced when training the deep models with the most popular face databases employed in the literature. We then evaluated three popular pre-trained face models (VGG-Face, ResNet-50 and ArcFace) according to the proposed formulation.
The experiments are carried out on three public databases (DiveFace, RFW, and BUPT-B) comprising 64,000 identities and 1.5M images. The results show that the two tested face models are highly biased across demographic groups. In particular, we observed large performance differences in face recognition across gender and ethnic groups. These performance gaps reached up to 200% of relative error degradation between the best class and the worst. This means that false positives are 200% more likely for some demographic groups than for others when using the popular face models evaluated in this work.
We also looked at the interior of the tested models, revealing different activation patterns of the networks for different demographic groups. This corroborates the biased nature of these popular pre-trained face models.
After the bias analysis, we proposed a novel discrimination-aware training method, Sensitive Loss, based on a triplet loss function and online selection of sensitive triplets. Different to related existing de-biasing methods, Sensitive Loss works as an add-on to pre-trained networks, thereby facilitating its application to problems (like face recognition) where hard-worked models exist with excellent performance, but little attention about fairness aspects were considered in their inception. Experiments with Sensitive Loss demonstrate how simple discrimination-aware rules can guide the learning process towards fairer and more accurate representations. The results of the proposed Sensitive Loss representation outperform the baseline models for the three evaluated databases both in terms of average accuracy and fairness metrics. These results encourage the training of more diverse models and the development of methods capable of dealing with the differences inherent to demographic groups.
The framework analyzed in this work is focused on the analysis of Group-based Algorithmic Discrimination (G-AD). Future work will investigate how to incorporate User-specific Algorithmic Discrimination (U-AD) in the proposed framework. Additionally, the analysis of other covariates such as the age will be included in the study. Discrimination by age is an important concern in applications such as automatic recruitment tools. Other future directions include the study of new methods to detect bias in the training process in an unsupervised way or the application of privacy-preserving techniques at image level [53].
8 Acknowledgments
This work has been supported by projects: PRIMA (MSCA-ITN-2019-860315), TRESPASS-ETN (MSCA-ITN-2019-860813), BIBECA (RTI2018-101248-B-I00 MINECO/FEDER), and Accenture. I. Serna is supported by a research fellowship from the Spanish CAM (PEJD-2018-PRE/TIC-9449).
References
- [1] I. Rahwan, M. Cebrian, N. Obradovich et al., “Machine Behaviour,” Nature, vol. 568, no. 7753, pp. 477–486, 2019.
- [2] S. Russell and P. Norvig, Artificial Intelligence: A Modern Approach. Pearson, 2016.
- [3] R. Ranjan, S. Sankaranarayanan, A. Bansal, N. Bodla, J. Chen, V. M. Patel, C. D. Castillo, and R. Chellappa, “Deep Learning for Understanding Faces: Machines May Be Just as Good, or Better, than Humans,” IEEE Signal Processing Magazine, vol. 35, no. 1, pp. 66–83, 2018.
- [4] X. Akhtar, A. Hadid, M. Nixon, M. Tistarelli, J. Dugelay, and S. Marcel, “Biometrics: In search of identity and security (Q & A),” IEEE MultiMedia, vol. 25, no. 3, pp. 22–35, 2018.
- [5] B. Bhanu and A. Kumar, Deep Learning for Biometrics, ser. Advances in Computer Vision and Pattern Recognition (ACVPR). Springer, 2017.
- [6] L. Shao, P. Hubert, and T. Hospedales, “Special Issue on Machine Vision with Deep Learning,” International Journal of Computer Vision, vol. 128, p. 771–772, 2020.
- [7] P. J. Grother, M. L. Ngan, and K. K. Hanaoka, Ongoing Face Recognition Vendor Test (FRVT) Part 2: Identification, ser. NIST Internal Report. National Institute of Standards and Technology, 2018.
- [8] C. M. Cook, J. J. Howard, Y. B. Sirotin, J. L. Tipton, and A. R. Vemury, “Demographic Effects in Facial Recognition and Their Dependence on Image Acquisition: An Evaluation of Eleven Commercial Systems,” IEEE Transactions on Biometrics, Behavior, and Identity Science, vol. 1, no. 1, pp. 32–41, 2019.
- [9] B. Lu, J.-C. Chen, C. D. Castillo, and R. Chellappa, “An experimental Evaluation of Covariates Effects on Unconstrained Face Verification,” IEEE Transactions on Biometrics, Behavior, and Identity Science, vol. 1, no. 1, pp. 42–55, 2019.
- [10] A. Acien, A. Morales, R. Vera-Rodriguez, I. Bartolome, and J. Fierrez, “Measuring the Gender and Ethnicity Bias in Deep Models for Face Recognition,” in Iberoamerican Congress on Pattern Recognition. Madrid, Spain: Springer, 2018, pp. 584–593.
- [11] K. Krishnapriya, V. Albiero, K. Vangara, M. King, and K. Bowyer, “Issues Related to Face Recognition Accuracy Varying Based on Race and Skin Tone,” IEEE Transactions on Technology and Society, vol. 1, pp. 8–20, 2020.
- [12] B. F. Klare, M. J. Burge, J. C. Klontz, R. W. V. Bruegge, and A. K. Jain, “Face Recognition Performance: Role of Demographic Information,” IEEE Transactions on Information Forensics and Security, vol. 7, no. 6, pp. 1789–1801, 2012.
- [13] J. Buolamwini and T. Gebru, “Gender Shades: Intersectional Accuracy Disparities in Commercial Gender Classification,” in Conference on Fairness, Accountability and Transparency, ser. Proceedings of Machine Learning Research, S. A. Friedler and C. Wilson, Eds., vol. 81, New York, NY, USA, 23–24 Feb 2018, pp. 77–91.
- [14] M. Alvi, A. Zisserman, and C. Nellåker, “Turning a Blind Eye: Explicit Removal of Biases and Variation from Deep Neural Network embeddings,” in European Conference on Computer Vision (ECCV), Munich, Germany, 2018, pp. 556–572.
- [15] I. Hupont and C. Fernandez, “DemogPairs: Quantifying the Impact of Demographic Imbalance in Deep Face Recognition,” in International Conference on Automatic Face & Gesture Recognition (FG), Lille, France, 2019, pp. 1–7.
- [16] P. Drozdowski, C. Rathgeb, A. Dantcheva, N. Damer, and C. Busch, “Demographic Bias in Biometrics: A Survey on an Emerging Challenge,” IEEE Transactions on Technology and Society, vol. 1, no. 2, pp. 89–103, 2020.
- [17] M. Wang and W. Deng, “Mitigate Bias in Face Recognition using Skewness-Aware Reinforcement Learning,” in Conference on Computer Vision and Pattern Recognition (CVPR). Seattle, Washington, USA: IEEE, 2020, pp. 9319–9328.
- [18] S. Gong, X. Liu, and A. Jain, “Jointly De-biasing Face Recognition and Demographic Attribute Estimation,” in European Conference on Computer Vision, Virtual, August 2020.
- [19] I. Serna, A. Morales, J. Fierrez, N. Cebrian, M. Obradovich, and I. Rahwan, “Algorithmic Discrimination: Formulation and Exploration in Deep Learning-based Face Biometrics,” in AAAI Workshop on Artificial Intelligence Safety (SafeAI), New York, NY, USA, 2020.
- [20] J. Kleinberg, J. Ludwig, S. Mullainathan, and C. R. Sunstein, “Discrimination in the Age of Algorithms,” Journal of Legal Analysis, vol. 10, pp. 113–174, 04 2019.
- [21] R. Ranjan, S. Sankaranarayanan et al., “Deep Learning for Understanding Faces: Machines May Be Just as Good, or Better, than Humans,” IEEE Signal Processing Magazine, vol. 35, no. 1, pp. 66–83, 2018.
- [22] K. He, X. Zhang, S. Ren, and J. Sun, “Deep Residual Learning for Image Recognition,” in Conference on Computer Vision and Pattern Recognition (CVPR). Las Vegas, NV, USA: IEEE, 2016, pp. 770–778.
- [23] M. Merler, N. Ratha, R. S. Feris, and J. R. Smith, “Diversity in Faces,” arXiv:1901.10436, pp. 1–29, 2019.
- [24] P. J. Grother, M. L. Ngan, and K. K. Hanaoka, Ongoing Face Recognition Vendor Test (FRVT) Part 3: Demographic Effects, ser. NIST Internal Report. U.S. Department of Commerce, National Institute of Standards and Technology, 2019.
- [25] Y. Guo, L. Zhang, Y. Hu, X. He, and J. Gao, “Ms-celeb-1m: A Dataset and Benchmark for Large-Scale Face Recognition,” in European Conference on Computer Vision (ECCV). Amsterdam, The Netherlands: Springer, 2016, pp. 87–102.
- [26] I. Kemelmacher-Shlizerman, S. M. Seitz, D. Miller, and E. Brossard, “The Megaface Benchmark: 1 Million Faces for Recognition at Scale,” in Conference on Computer Vision and Pattern Recognition (CVPR). Las Vegas, Nevada, USA: IEEE, 2016, pp. 4873–4882.
- [27] Q. Cao, L. Shen, W. Xie, O. M. Parkhi, and A. Zisserman, “Vggface2: A Dataset for Recognising Faces Across Pose and Age,” in International Conference on Automatic Face & Gesture Recognition (FG). Lille, France: IEEE, 2018, pp. 67–74.
- [28] O. M. Parkhi, A. Vedaldi, A. Zisserman et al., “Deep Face Recognition,” in British Machine Vision Conference (BMVC), Swansea, UK, 2015, pp. 41.1–41.12.
- [29] L. Wolf, T. Hassner, and I. Maoz, “Face Recognition in Unconstrained Videos with Matched Background Similarity,” in Computer Vision and Pattern Recognition (CVPR). Colorado Springs, CO, USA: IEEE, June 2011, pp. 529–534.
- [30] D. Yi, Z. Lei, S. Liao, and S. Z. Li, “Learning Face Representation from Scratch,” arXiv:1411.7923, pp. 1–9, 2014.
- [31] S. Yang, P. Luo, C.-C. Loy, and X. Tang, “From Facial Parts Responses to Face Detection: A Deep Learning Approach,” in International Conference on Computer Vision (ICCV), Santiago, Chile, 2015, pp. 3676–3684.
- [32] N. Kumar, A. Berg, P. N. Belhumeur, and S. Nayar, “Describable Visual Attributes for Face Verification and Image Search,” IEEE Transactions on Pattern Analysis and Machine Intelligence, vol. 33, no. 10, pp. 1962–1977, 2011.
- [33] B. Maze, J. Adams, J. A. Duncan, N. Kalka, T. Miller, C. Otto, A. K. Jain, W. T. Niggel, J. Anderson, J. Cheney et al., “IARPA Janus Benchmark-C: Face Dataset and Protocol,” in International Conference on Biometrics (ICB). Gold Coast, Australia: IEEE, 2018, pp. 158–165.
- [34] Z. Zhang, Y. Song, and H. Qi, “Age Progression/Regression by Conditional Adversarial Autoencoder,” in Conference on Computer Vision and Pattern Recognition (CVPR). Honolulu, Hawaii, USA: IEEE, 2017, pp. 5810–5818.
- [35] G. B. Huang, M. Ramesh, T. Berg, and E. Learned-Miller, “Labeled Faces in the Wild: A Database for Studying Face Recognition in Unconstrained Environments,” University of Massachusetts, Amherst, Tech. Rep. 07-49, October 2007.
- [36] J. Ortega-Garcia, J. Fierrez et al., “The Multiscenario Multienvironment Biosecure Multimodal Database (BMDB),” IEEE Transactions on Pattern Analysis and Machine Intelligence, vol. 32, no. 6, pp. 1097–1111, 2009.
- [37] A. Morales, J. Fierrez, R. Vera-Rodriguez, and R. Tolosana, “SensitiveNets: Learning Agnostic Representations with Application to Face Recognition,” IEEE Transactions on Pattern Analysis and Machine Intelligence, pp. 1–8, 2020.
- [38] K. Kärkkäinen and J. Joo, “FairFace: Face Attribute Dataset for Balanced Race, Gender, and Age,” arXiv:1908.04913, pp. 1–11, 2019.
- [39] M. Wang, W. Deng, J. Hu, X. Tao, and Y. Huang, “Racial Faces in the Wild: Reducing Racial Bias by Information Maximization Adaptation Network,” in International Conference on Computer Vision (ICCV). Seoul, Korea: IEEE, October 2019, pp. 692–702.
- [40] A. Das, A. Dantcheva, and F. Bremond, “Mitigating Bias in Gender, Age and Ethnicity Classification: a Multi-Task Convolution Neural Network Approach,” in European Conference on Computer Vision (ECCV), Munich, Germany, 2018, pp. 573–585.
- [41] T. Calders and S. Verwer, “Three Naive Bayes Approaches for Discrimination-Free Classification,” Data Mining and Knowledge Discovery, vol. 21, no. 2, pp. 277–292, 2010.
- [42] I. D. Raji and J. Buolamwini, “Actionable Auditing: Investigating the Impact of Publicly Naming Biased Performance Results of Commercial AI Products,” in Conference on AI Ethics and Society (AIES). New York, NY, USA: AAAI/ACM, 2019, pp. 429–435.
- [43] F. Alonso-Fernandez, J. Fierrez, and J. Ortega-Garcia, “Quality Measures in Biometric Systems,” IEEE Security & Privacy, vol. 10, no. 6, pp. 52–62, 2011.
- [44] M. Bakker, H. R. Valdes, D. P. Tu, K. Gummadi, K. Varshney, A. Weller, and A. Pentland, “Fair Enough: Improving Fairness in Budget-Constrained Decision Making Using Confidence Thresholds,” in AAAI Workshop on Artificial Intelligence Safety (SafeAI), New York, NY, USA, 2020, pp. 41–53.
- [45] Y. Zhang, R. Bellamy, and K. Varshney, “Joint Optimization of AI Fairness and Utility: A Human-Centered Approach,” in Conference on AI, Ethics, and Society (AIES). New York, NY, USA: AAAI/ACM, 2020, pp. 400–406.
- [46] K. Q. Weinberger and L. K. Saul, “Distance Metric Learning for Large Margin Nearest Neighbor Classification,” in Advances in Neural Information Processing Systems (NIPS). MIT Press, 2006, pp. 1473–1480.
- [47] F. Schroff, D. Kalenichenko, and J. Philbin, “FaceNet: A Unified Embedding for Face Recognition and Clustering,” in Conference on Computer Vision and Pattern Recognition (CVPR). IEEE, June 2015, pp. 815–823.
- [48] J. Deng, J. Guo, N. Xue, and S. Zafeiriou, “Arcface: Additive Angular Margin Loss for Deep Face Recognition,” in Conference on Computer Vision and Pattern Recognition (CVPR). Long Beach, California, USA: IEEE, 2019, pp. 4690–4699.
- [49] K. Zhang, Z. Zhang, Z. Li, and Y. Qiao, “Joint Face Detection and Alignment Using Multitask Cascaded Convolutional Networks,” IEEE Signal Processing Letters, vol. 23, no. 10, pp. 1499–1503, 2016.
- [50] J. Deng, J. Guo, E. Ververas, I. Kotsia, and S. Zafeiriou, “RetinaFace: Single-Shot Multi-Level Face Localisation in the Wild,” in Conference on Computer Vision and Pattern Recognition (CVPR). Seattle, Washington, USA: IEEE, June 2020, pp. 5202–5211.
- [51] R. R. Selvaraju, M. Cogswell et al., “Grad-CAM: Visual Explanations from Deep Networks Via Gradient-Based Localization,” in International Conference on Computer Vision (CVPR). Honolulu, Hawaii, USA: IEEE, 2017, pp. 618–626.
- [52] D. Bau, J.-Y. Zhu, H. Strobelt, A. Lapedriza, B. Zhou, and A. Torralba, “Understanding the Role of Individual Units in a Deep Neural Network,” Proceedings of the National Academy of Sciences, pp. 1–8, 2020.
- [53] V. Mirjalili, S. Raschka, and A. Ross, “FlowSAN: Privacy-Enhancing Semi-Adversarial Networks to Confound Arbitrary Face-Based Gender Classifiers,” IEEE Access, vol. 7, pp. 99 735–99 745, 2019.
![[Uncaptioned image]](/html/2004.11246/assets/figures/ignacio_headshot.jpg) |
Ignacio de la Serna recieved the B.S. degree in mathematics and the B.S. degree in computer science from the Autonomous University of Madrid, Spain, in 2018, and the M.S. degree in Artificial Intelligence from the National Distance Education University in 2020. He is currently pursuing a Ph.D. in Computer Science at the Biometrics and Data Pattern Analytics (BiDA) Lab of the School of Engineering, Autonomous University of Madrid, Spain, under the supervision of Prof. A. Morales. His research interests include computer vision, pattern recognition, and explainable AI, with applications to biometrics. |
![[Uncaptioned image]](/html/2004.11246/assets/figures/aythami_headshot.png) |
Aythami Morales Moreno received the M.Sc. (Electronical Engineering) and Ph.D. (Artificial Intelligence) degrees from Universidad de Las Palmas de Gran Canaria in 2006 and 2011 respectively. Since 2017, he is Associate Professor with the Universidad Autonoma de Madrid. He has conducted research stays at Michigan State University, Hong Kong Polytechnic University, University of Bologna, and the Schepens Eye Research Institute. He has authored over 100 scientific articles in topics related to machine learning, trustworthy AI, and biometric signal processing. |
![[Uncaptioned image]](/html/2004.11246/assets/figures/JF_headshot.jpg) |
Julian Fierrez (Member, IEEE) received the M.Sc. and Ph.D. degrees in telecommunications engineering from the Universidad Politecnica de Madrid, Spain, in 2001 and 2006, respectively. Since 2004 he has been at Universidad Autonoma de Madrid, where he is currently an Associate Professor. His research interests include signal and image processing, pattern recognition, and biometrics; with emphasis on evaluation, security, forensics, mobile and behavioral biometrics. He is actively involved in EU projects around biometrics (e.g., BIOSECURE, TABULA RASA and BEAT in the past; now IDEA-FAST, PRIMA, and TRESPASS-ETN). He received the Miguel Catalan Award 2015 to the Best Researcher under 40 in the Community of Madrid in the general area of science and technology, and the 2017 IAPR Young Biometrics Investigator Award. He is an Associate Editor of the IEEE TRANSACTIONS ON INFORMATION FORENSICS AND SECURITY and the IEEE TRANSACTIONS ON IMAGE PROCESSING. |
![[Uncaptioned image]](/html/2004.11246/assets/figures/Manuel_photo.jpeg) |
Manuel Cebrian is a Max Planck Research Group Leader at the Max Planck Institute for Human Development. He was previously a Research Scientist Manager at the MIT Media Lab. Manuel’s research examines computational methods to create incentives that mobilize large groups of people to collaborate. His empirical work uses network science modeling and observational studies. His published papers appear in Science, Nature, the Proceedings of the National Academy of Sciences of the UA, the Journal of the Royal Society Interface, and other peer-reviewed journals and proceedings in computer science and computational social science. |
![[Uncaptioned image]](/html/2004.11246/assets/figures/nick_headshot.jpg) |
Nick Obradovich is Senior Research Scientist and Principal Investigator at the Max Planck Institute for Human Development in the Center for Humans and Machines. He holds a PhD from the University of California, San Diego and completed his postdoctoral training at Harvard University. He then worked for a number of years as a research scientist at the MIT Media Lab. In his work, he combines his interests in artificial intelligence, climate change, and human behavior with his affinity for data science and computational methods. |
![[Uncaptioned image]](/html/2004.11246/assets/figures/iyad_rahwan_photo.jpg) |
Iyad Rahwan is a director at the Max Planck Institute for Human Development, where he founded the Center for Humans & Machines. He is also an Associate Professor of Media Arts & Sciences at the MIT Media Lab. He holds a PhD from the University of Melbourne, Australia. Rahwan’s work lies at the intersection of computer science and human behavior, with a focus on collective intelligence, large-scale cooperation, and the societal impact of Artificial Intelligence and social media. |