High-resolution optical spectroscopic observations of comet 21P/Giacobini-Zinner in its 2018 apparition
Abstract
Comet 21P/Giacobini-Zinner is a peculiar comet from the viewpoints of the chemical and physical properties of its dust grains. We conduct optical high-resolution spectroscopic observations of the comet. The intensity ratios of forbidden oxygen lines (at 557.7, 630.0, and 636.4 nm) and ortho-to-para abundance ratios (OPRs) of water cations (H2O+) and amidogen radicals (NH2) are obtained while only the upper limit for 14N/15N in the amidogen radical is restricted. The OPRs of H2O+ and NH2 are similar to those of other comets, although the real meaning of these OPRs is still debated. Based on the observation of the forbidden emission lines of oxygen atoms, it can be concluded that the comet is depleted in CO2. In consideration with the depletion in other highly volatile species found in the near-infrared region and the presence of complex organics in comet 21P/Giacobini-Zinner, this comet might form in a warmer region in the solar nebula compared with other comets.
1 Introduction
Comet 21P/Giacobini-Zinner (hereinafter, 21P/GZ) is classified as a Jupiter-family comet based on its Tisserand parameter with respect to Jupiter (). According to the previous reports of the observations of comet 21P/GZ, this comet showed unique properties of not only volatiles but also dust grains compared with other comets: (1) depletion of carbon-chain molecules like C2 and C3 as well as NH2 (Fink, 2009), (2) depletion of highly volatile species (C2H6, CH3OH, and CO; DiSanti et al. 2013; Dello Russo et al. 2016), and (3) negative linear polarization gradient for reflected sunlight by cometary grains, indicative of existence of organic matter (Kiselev et al., 2000).
Comet 21P/GZ is also known as the parent comet of the October Draconids meteor shower (historically called as the Giacobinids), based on the similarity in orbital elements between comet 21P/GZ and the meteoroids of the Giacobinids (Jenniskens, 2006). The meteoroids are thought to be porous grain conglomerates. Their derived densities are smaller compared with other meteor showers (0.1 – 0.5 g cm-3), and they have typical chondritic abundance ratios of the major heavy elements (namely Mg, Fe, and Na), and the Giacobinids meteors exhibit fragmentation behaviors (Borovička et al., 2010, 2014) not frequently seen in other meteor showers.
| UT Time in 2018 | (s) | (au) | (au) | (km s-1) | Airmass | Reference stars (Airmass) | |
|---|---|---|---|---|---|---|---|
| Sep 5 | 11:27 | 12,300 | 1.015 | 0.396 | 2.93 | 2.65–1.18 | HD 27026 (1.21), HD 41161 (2.39) |
| Sep 9 | 12:38 | 9,600 | 1.013 | 0.392 | 0.48 | 1.74–1.14 | HD 27026 (1.08), HD 41161 (2.13) |
| Oct 3 | 13:35 | 6,200 | 1.066 | 0.469 | 10.49 | 1.43–1.18 | HD 49643 (3.37), HR 1544 (1.42) |
Note. — The first column indicates the start time of the exposures for comet 21P/GZ. is total integration time in seconds. and are heliocentric and geocentric distances at the observations in au, respectively. is the relative velocity of the comet to the Earth at the time of observations.
In summary, from the observational viewpoints, comet 21P/GZ is peculiar among observed comets. The unique properties of comet 21P/GZ might be explained by the different birth place of the comet (formed under different physical conditions such as temperature, dust-to-gas ratio, and ionization degree). Therefore, to understand the physical conditions where icy/dust materials in comet 21P/GZ formed, we conducted optical high-resolution spectroscopic observations of the comet in its 2018 apparition. We tried to determine those properties of volatiles considered as primordial. We report the results of our observations and discuss the origin of comet 21P/GZ.
2 Observations and data reduction
High-resolution optical spectroscopic observations of comet 21P/GZ were performed on UT 2018 September 5, 9, and October 3 using the High Dispersion Spectrograph (HDS; Noguchi et al. 2002) attached to the Subaru Telescope in Maunakea, Hawaii. The heliocentric and geocentric distances of the comet were 1.01–1.07 au and 0.39–0.47 au, respectively. The optical peak of the coma was centered on the slit. The spectra covered the wavelength region between 551.4 and 827.9 nm with a gap between 684.5 and 693.4 nm. The slit size was 0”.5 8”.5 in the sky. The spectral resolution, , was 72000 over the entire wavelength region. Details of our observations are listed in Table 1. Data taken with the Subaru/HDS were reduced using the IRAF software (distributed by NOAO111IRAF is distributed by the National Optical Astronomy Observatory, which (AURA) under cooperative agreement with the National Science Foundation.) using common reduction procedures of the HDS222 http://www.naoj.org/Observing/Instruments/HDS/hdsql-e.html. We extracted one-dimensional spectra of the comet from the spectral images within the aperture of 0”.5 7”.5 to avoid the slit-edge regions. The wavelength calibration was performed using the Th-Ar lamp spectrum and finally, the spectra of comet 21P/GZ are represented in the comet’s rest frame. The flux calibration was performed using bright early-type stars near the comet during the observation (see Table 1) taking telluric extinction into consideration. The reference stars (and their spectral types) are HD 27026 (B9V) and HD 41161 (O8V) for the observations on UT 2018 September 5 and 9, and are HD 49643 (B8V) and HR 1544 (A1V) on UT 2018 October 3. We assumed the spectrum of each reference star as a black-body spectrum at a given temperature (effective temperatures of the star).
We subtracted the modeled continuum components (represented as the sunlight reflected by cometary dust grains) from the reduced spectra to extract the emission spectra of comet. The modeled continuum spectrum of the comet is computed as a product of the high-resolution solar spectrum (Kurucz, 2005), the reflectance spectrum of the cometary dust grains, and the telluric transmittance spectrum. The reflectance spectrum was obtained by dividing the continuum component of the reduced spectrum by the solar spectrum. The telluric transmittance spectrum was computed using the LBLRTM code (Clough et al., 1992) with weather conditions at the time of the observations. Finally, the modeled continuum spectrum was convolved with the instrumental profile approximated by a Gaussian function corresponding to the spectral resolution.
3 Results and discussion
3.1 Intensity ratios of the three forbidden oxygen lines
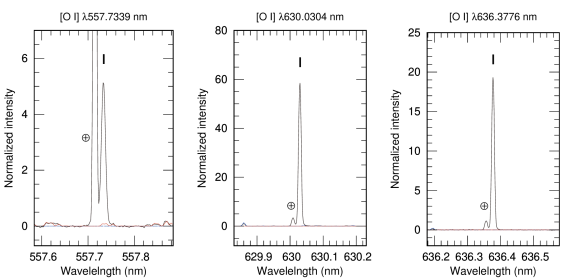
In the cometary coma, oxygen atoms are excited to the electronic metastable states of 1S and 1D, and those states emit photons at 557.7 and 630.0/636.4 nm as forbidden lines of oxygen, respectively. Such excited oxygen atoms can be produced via photodissociation of H2O or other oxygen-bearing molecules like CO2 in the coma by solar UV radiation. We measured both the intensity and the full width at half maximum (FWHM) of the three [O I] lines by fitting them with a Gaussian profile for the spectrum taken on UT 2018 October 3 (Figure 1). Because the relative velocities between the comet and the Earth on UT 2018 September 5 and 9 were too small, the telluric forbidden oxygen emission lines overlapped with cometary lines and could not be separated. The measured line profile of each [O I] emission line in the observed spectrum is a convolution between the intrinsic and instrumental profiles. Therefore, the FWHM of the observed emission line () is expressed by the intrinsic FWHM of the emission line () and the FWHM of the instrumental profile () as follows;
| (1) |
where nm is obtained from the telluric nightglow emission lines recorded simultaneously in the spectrum of comet 21P/GZ ([O I] at 557.7, 630.0, and 636.4 nm, and Na I at 589.0 and 589.6 nm).
The [O I] lines at 557.7 nm and 630.0/636.4 nm could be contaminated with the emission lines of the C2 (1–2) Swan band system and the NH2 (0,8,0) band, respectively. To measure the intensity of these [O I] lines accurately, the contaminations are not negligible and must be removed (Decock et al. 2015; Rousselot et al. 2015, and references therein). We measured the emission flux of the [O I] green line at 557.7 nm after removing the contamination by C2 lines using the C2 fluorescence excitation model (Shinnaka et al., 2010) with a given vibrational excitation temperature of 4000 K, which is a typical temperature found in comets (Rousselot et al., 2012). The contamination of the emission line at 557.7 nm by C2 emission lines is estimated to be 1.7% 0.3%. For the [OI] lines at 630.0/636.4 nm, we used the synthetic spectrum of NH2 based on the fluorescence excitation model of NH2 (Kawakita et al., 2000) with an ortho-to-para abundance ratio (OPR) of 3.31 (see section 3.2) to subtract the contamination by NH2. The contamination of the [OI] lines at 630.0/636.4 nm by NH2 emission is negligible in our spectrum (0.3 0.1 % for [O I] at 630.0 nm and no NH2 emission lines for [O I] at 636.4 nm). Table 2 lists the intrinsic intensity and FWHM of each [O I] line.
The resultant intensity ratio of the [O I] red-doublet at 630.0/636.4 nm was 2.99 0.04. The derived green-to-red line ratio of [O I] (the ratio between the intensity of [O I] at 557.7 nm and the total intensity of [O I] red-doublet at 630.0/636.4 nm) was derived to be 0.074 0.001, consistent with H2O as the dominant source for excited atomic oxygen (Cochran & Cochran, 2001). The intrinsic FWHM of the green line is wider than that of the red-doublet lines. These results are listed in Table 2.
| Intensity [arbit. units] ( [km s-1] a ) | [%] c | ||||
|---|---|---|---|---|---|
| [O I] 557.7 nm | [O I] 630.0 nm | [O I] 636.4 nm | |||
| 0.58 0.01 (2.05) | 5.86 0.06 (0.90) | 1.96 0.02 (0.99) | 2.99 0.04 | 0.0431 0.0008 | (A): 0.9 0.1 |
| (B): 11.0 0.3 | |||||
Note. —
: [nm] is converted to the most probable velocity for the Maxwell-Boltzmann velocity distribution, by using the equation of (9) in Decock et al. (2013).
: Green-to-red line ratio corrected with a collisional quenching factor of 0.58.
: CO2/H2O abundance ratio is computed from the green-to-red line ratio by the equation (2). The values labeled with (A) and (B) are computed with the parameters of cases (A) and (B) in Table 3, respectively (see text).
The intrinsic FWHM of [O I] at 557.7 nm is wider than those of the [O I] 630.0/636.4 nm lines in contrast with the theoretical prediction for the photodissociation of water (as pointed out by Cochran 2008; Decock et al. 2013). Decock et al. (2013) claimed that CO2 is photodissociated with more energetic photons than water (that photodissociated mainly by Ly- photon) and therefore the [O I] emission line at 557.7 nm (expected to be largely contaminated with O(1S) produced from CO2) should be wider than the [O I] emission lines at 630.0/636.4 nm (those are mainly caused from water and less influenced by CO2). However, to discuss the kinetic energies (i.e., velocities) of oxygen atoms produced from water and CO2 by photodissociation, we must consider the photodissociatoin kinematics of the molecules (e.g., Song et al. 2014). An alternative explanation might be possible from the viewpoint of lifetimes of excited oxygen atoms since the lifetimes of excited oxygen atoms (O(1S) and O(1D)) are different by a factor of 100 (0.79 s and 116 s for 1 au from the Sun). Therefore, the probability for collision of O(1D) during its lifetime with other molecules (mainly, water) in the coma is larger than O(1S) by a factor of 100. The meta-stable oxygen atoms (O(1S) and O(1D)) are chemically active and their collisions with water molecules easily produce two OH radicals, or the collisions of meta-stable oxygen atoms with water, CO2, or CO molecules cause non-radiative transitions to lower states (Bhardwaj & Raghuram, 2012). Because these collisions of O(1S) and O(1D) with other molecules prevent the [O I] emission, only O(1D) with smaller velocity differences from the background coma molecules, can emit the [O I] emission lines at 630.0/636.4 nm while the O(1S) atoms with larger velocity differences from the background can emit the [O I] emission at 557.7 nm. This may be the reason why the [O I] emission line at 557.7 nm is wider than the [O I] lines at 630.0/636.4 nm.
The obtained intensity ratio of the [O I] red-doublet (630.0/636.4 nm) is consistent with the ratio of theoretical Einstein’s coefficients for the transitions because those transitions have the same upper state but different lower states (Galavis et al., 1997; Storey & Zeippen, 2000). The green-to-red line ratio of [O I] in comet 21P/GZ is similar to the values previously reported for other comets (Capria et al. 2010; Decock et al. 2013; McKay et al. 2013, 2015, 2016, and references therein), supporting the hypothesis that water is the dominant origin of excited oxygen atoms generating these three [O I] emission lines in the coma when a comet was located closer than 2.5 au from the Sun. This hypothesis is based on the comparison between the observed green-to-red line ratios and the ratios of theoretical emission rates of [O I] lines for different sources (water, CO, and CO2) as claimed by Cochran & Cochran (2001) and Decock et al. (2013). Recent estimates for the [O I] line ratio in the cases of water, CO, and CO2 as the source of excited oxygen atoms, are found in the literature (Raghuram & Bhardwaj, 2013; Decock et al., 2015; Cessateur et al., 2016). We note that no experimentally determined cross-sections for the production of O(1S) in the photodissociation of water are available (Bhardwaj & Raghuram, 2012) and also note that the yield of O(1D) in the photodissociation of CO2 is also not reported in the laboratory (Huestis & Slanger, 2006).
Abundance ratio of CO2/H2O could be derived from the following formula (same as the equation (12) of Decock et al. 2013);
| (2) |
where denotes the column density of molecule X, G/R is the green-to-red line ratio, and denote photodissociation rates of molecule X producing O(1S) (green) and O(1D) (red), and is the branching ratio of the green line at 557.7 nm for O(1S). Here we assume that only H2O and CO2 are the sources of O(1S) and O(1D) atoms in coma. Note that we might have to consider the production of O(1S) and O(1D) by the photodissociation of O2 molecule in coma. In fact, the O2 molecule was detected in comet 67P/Churyumov-Gerasimenko by the Rosetta/ROSINA at the first time, and the mean value of the local abundance relative to water was reported as 1.8% 0.4% (Altwegg et al., 2019), which is similar to the value found by the re-analysis of in situ data taken in comet 1P/Halley (Rubin et al., 2015). However, based on a recent study by Cessateur et al. (2016), the contributions of O2 to production of O(1S) and O(1D) are negligible in comparison with those of water.
We applied two parameter sets, the cases (A) and (B) listed in Table 3. The photodissociation rates at 1 au in case (A) are basically based on laboratory studies and taken from Raghuram & Bhardwaj (2013) while those in case (B) are empirical and taken from ’McKay2015B’ in Table 6 of McKay et al. (2016). The empirical parameter set successfully reproduced the CO2/H2O ratio from [O I] green-to-red line ratio, consistent with the CO2/H2O ratio directly measured in infrared for comet C/2009 P1 (Garradd) and C/2012 K1 (PanSTARRS) although the CO2/H2O ratios derived with the parameter set based on laboratory studies are systematically lower than those derived with the empirical parameters (McKay et al., 2015, 2016). In order to use the equation (2), we corrected the effect by collisional quenching of O(1D) atoms in the inner coma on the measured [O I] line intensity, according to McKay et al. (2015). We estimated the fraction of atoms lost to collisional quenching based on the Haser model including the quenching of O(1D) atoms (Morgenthaler et al., 2001, 2007). Because we used small aperture to extract the spectrum (the aperture size was 170 km 2450 km at the observation), we assume that H2O molecules are the dominant source of O(1D) (Raghuram & Bhardwaj, 2013) and the dominant collision partner (Morgenthaler et al., 2001) in the inner coma. The water production rate of comet 21P/GZ at the observation was assumed to be Q(H2O) 2.5 1028 s-1 (Roth et al., 2020). Furthermore, not only the collisional quenching of O(1D) but also that of O(1S) atoms are considered in our case. The rate coefficients for the collisional quenching of O(1D) and O(1S) by H2O are the same as Decock et al. (2015). The scaling factor for the green-to-red line ratio is 0.58 in 21P/GZ on UT 2018 October 3. The derived CO2/H2O ratios for both parameter sets are listed in Table 2.
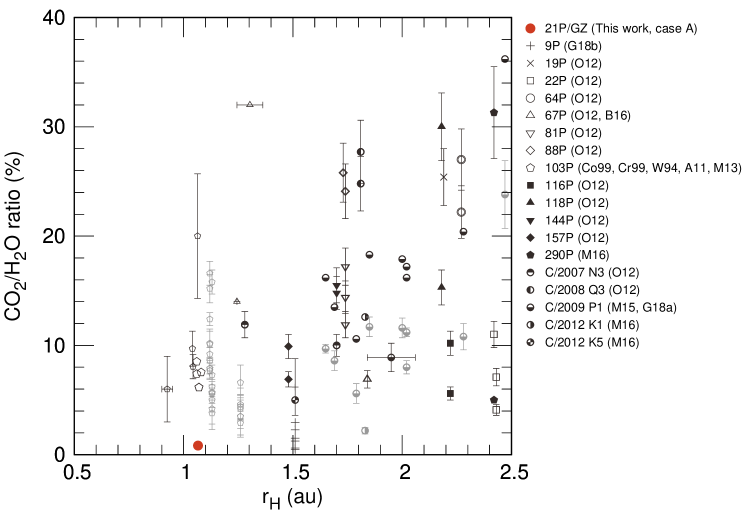
Figure 2 shows the CO2/H2O abundance in comets derived by different ways, in addition to our measurement (in case (A)). The values plotted in Figure 2 are derived from the [O I] green-to-red line ratios in consideration of the collisional quenching of O(1D) atoms (McKay et al., 2013, 2015, 2016), from the CO Cameron-band observations (Weaver et al., 1994), and from the direct measurements of H2O and CO2 by the ISO space observatory (Crovisier et al., 1999; Colangeli et al., 1999), the comet survey program (Ootsubo et al., 2012), the Spitzer space telescope (McKay et al., 2016), the Deep Impact spacecraft (Gersch et al., 2018a, b; A’Hearn et al., 2011), and the Rosetta spacecraft (Bockelée-Morvan et al., 2016). Note that the CO2/H2O ratios derived from the [O I] green-to-red line ratios in Figure 2 are computed with the parameters of the case (A) in Table 3.
The comets in Figure 2 seem to be classified into two groups of comets whose CO2/H2O ratios are 10% and 25%, and the origin for the bimodal distribution is not clear. Although the CO2/H2O ratio might depend on the rotational phase of the cometary nucleus (A’Hearn et al., 2011), comet 21P/GZ is considered to be depleted in CO2 compared to water, as shown in Figure 2. The line width of [O I] at 557.7 nm in comet 21P/GZ (2.1 km s-1) (Table 2) is at the lower end of the range of intrinsic line widths of [O I] at 557.7 nm in other comets (Decock et al., 2013; Cochran, 2008; Cochran & Cochran, 2001), and this fact is also suggestive of the low-CO2 abundance in comet 21P/GZ because CO2 might produce O(1S) atoms with high-ejection velocities than H2O. If we use the empirical parameters taken from McKay et al. (2015) (the case (B) in Table 3), the derived CO2/H2O ratio in comet 21P/GZ is 11.0 0.3%, which is higher than that computed with the parameters of the case (A) as shown above, but still in the low-CO2 group (10%) in Figure 2. Such low-CO2 abundance in comet 21P/GZ could be interpreted as the difference in comet-forming regions of these comets or some evolutional effects in the inner solar system for Jupiter-family comets. Ootsubo et al. (2019) recently proposed that comet 21P/GZ formed in the warmer region than other comets, based on their detection of complex organics in its low-resolution mid-infrared spectra. Our result, low-CO2/H2O in comet 21P/GZ, is consistent their hypothesis.
3.2 Abundance ratio of nuclear spin isomer of the water cation (H2O+) and amidogen (NH2)
| UT Date | Sep 5 | Sep 9 | Oct 3 | average |
|---|---|---|---|---|
| NH2 | ||||
| = 8 | 3.07 0.11 | 3.30 0.09 | 3.26 0.10 | 3.22 0.06 |
| = 9 | 3.34 0.06 | 3.67 0.08 | 3.14 0.09 | 3.39 0.05 |
| = 10 | 3.20 0.19 | 3.14 0.14 | 3.34 0.37 | 3.18 0.11 |
| average | 3.27 0.05 | 3.45 0.06 | 3.20 0.07 | 3.32 0.04 |
| H2O+ | ||||
| = 10 | 2.73 0.30 | 2.64 0.21 | 2.86 0.18 | 2.76 0.13 |
Note. — means (0, , 0) bands of NH2 and H2O+.
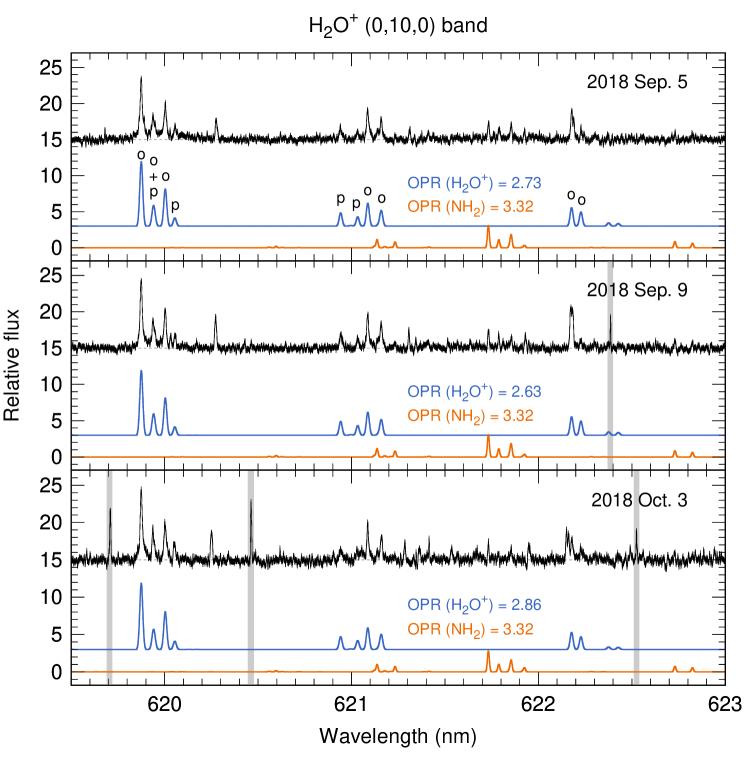
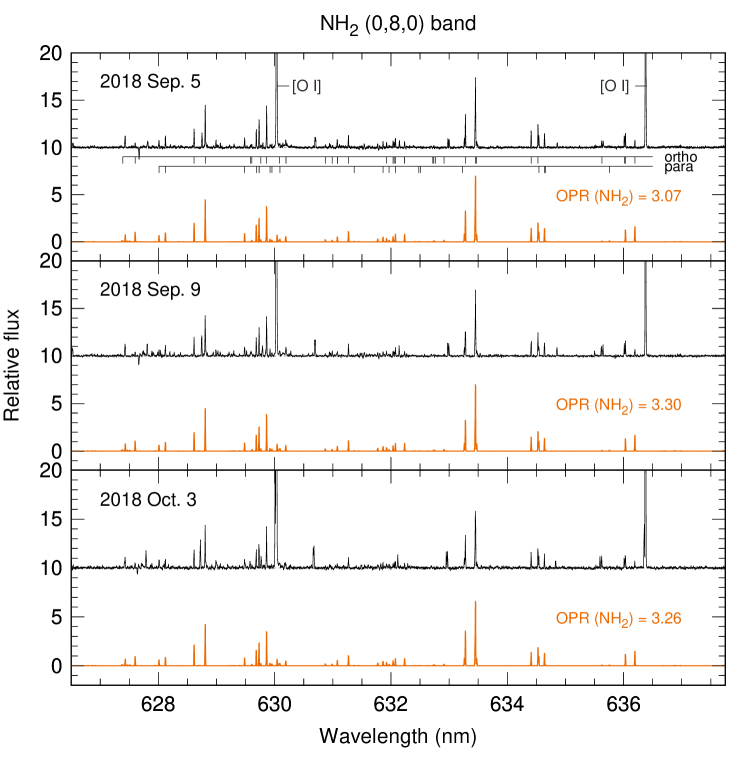
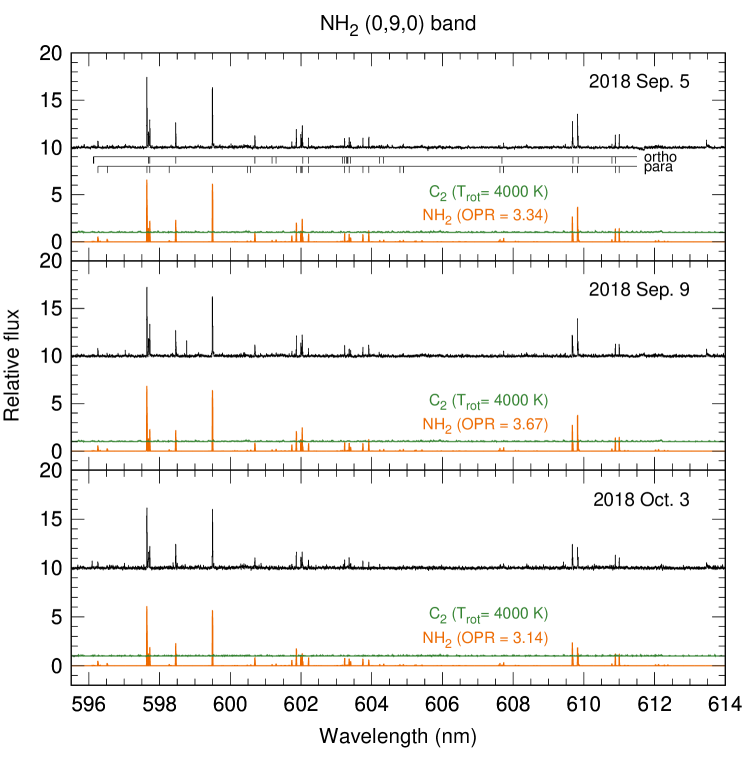
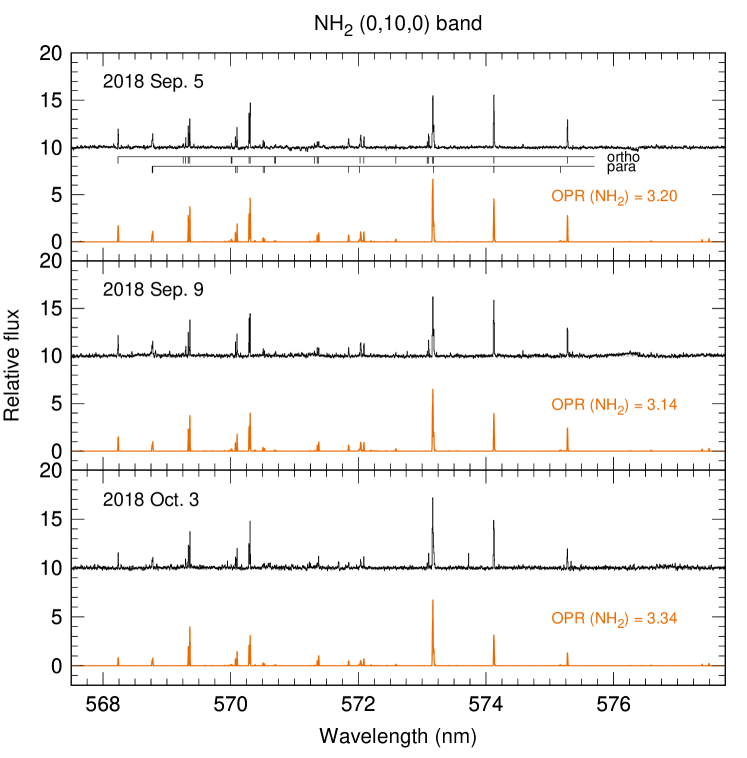
We measured the OPRs of water cations (H2O+) and amidogen (NH2) in comet 21P/GZ from these rovibronic emissions in the high-resolution optical spectrum. Figure 3 plots the observed and modeled spectra of 21P/GZ around the H2O+ (0,10,0) band. The derived OPRs of H2O+ and NH2 are listed in Table 4. Figure 3 shows that the derived OPR of H2O+ is 2.76 0.13. Assuming the conservation of total nuclear spin through the ionization reaction of water as the sole parent of H2O+, the OPR of H2O+ is the same as the OPR of water. Indeed, the OPR of water derived from high-resolution near-infrared spectra of comet 21P/GZ in its 2005 and 2018 apparitions are OPR = 2.99 0.23 (DiSanti et al., 2013) and 3.04 0.12, respectively (Faggi et al., 2019). These values are consistent with the OPR of H2O+ obtained here within 3-error interval. The OPR of ammonia is also derived as 1.16 0.02 based on the OPR of NH2 in the comet (see Figures 4, 5 and 6). Please note that the intensity ratio among bands is not correct because we scaled intensity for each plot independently. Nuclear spin temperatures of water and ammonia are derived as 36 +6/3 K from the OPR of H2O+ and 28 1 K from the OPR of NH2 even though the real meaning of the OPRs of water and ammonia are unclear.
Recent laboratory experiments demonstrate that the OPR of water is not the memory of its molecular formation (Hama et al., 2011, 2012, 2016, 2018; Hama & Watanabe, 2013). It is likely that this is also for the case of ammonia (its OPR is estimated from NH2). These laboratory results suggest that the OPRs of those molecules are initially the statistical weight ratios immediately following the sublimation from nucleus ice. The OPRs of cometary volatiles were probably modified by an ortho-para conversion process in the inner coma (or other catalyst activities of dust crust surfaces of the nucleus) rather than reflected by a temperature in the solar nebula 4.6 Ga at the molecular formation. OPRs may be diagnostic for the physico-chemical conditions in the inner-most coma or beneath the surface.
3.3 Nitrogen isotopic ratio in NH2
We also tried to measure the isotopic ratio of nitrogen in NH2 (14N/15N) in comet 21P/GZ in the same manner as Shinnaka & Kawakita (2016). Despite clear observation of 14NH2 (as shown in Figures 4 and 5), no emission lines of 15NH2 could be detected compared with error levels. The lower limit of 14N/15N in 21P/GZ is 38 (3) and this value is consistent with the range obtained from previous measurements in comets: 135.7 5.9 (Shinnaka et al., 2016).
3.4 Formation conditions of comet 21P/Giacobini-Zinner
Finally, we discuss the origin of comet 21P/GZ. The depletion of simple organic molecules like C2H6, CH3OH, and CO in this comet (DiSanti et al., 2013) is probably consistent with the depletion of carbon-chain molecules such as (C2, C3) and NH2. However, these facts do not mean that the comet is depleted in more complex organics like PAHs and other hydrocarbons, as observed in 67P/Churyumov-Gerasimenko (Altwegg et al., 2019). The observed property of linear polarization produced by cometary dust grains indicates the possible existence of complex organic matter (Kiselev et al., 2000). Furthermore, Ootsubo et al. (2019) recently reported the detection of unidentified IR emission features attributed to complex organic molecules such as PAHs (Polycyclic Aromatic Hydrocarbons) in comet 21P/GZ. Because more complex molecules could form under warmer conditions, comet 21P/GZ might have formed in a warmer region than where other comets formed in the solar nebula. Depletion in highly volatile molecules such as C2H6, CH3OH, and CO supports this hypothesis. The CO2/H2O ratio in 21P/GZ obtained from our observation is also depleted and consistent with the formation under warmer conditions. The fluffy and fragile grains of meteoroids of the October Draconids meteor shower are also indicative of dust aggregation by organic materials acting as glue.
If comet 21P/GZ formed in the inner region of the solar nebula, the
dust grains of the comet may contain more abundant crystalline silicates
(formed in the inner-most coma and transported to the comet-forming region)
compared to other comets.
However, the crystalline-to-amorphous ratio in silicate grains in
comet 21P/GZ is typical among comets (Ootsubo et al., 2019). Therefore,
Ootsubo et al. (2019) proposed the hypothesis that comet 21P/GZ formed in
the circum-planetary disk of giant planets where is warmer than the
surrounding solar nebula.
References
-
A’Hearn et al. (2011)
A’Hearn, M. F., et al., 2011, Science, 332, 1396
(DOI: 10.1126/science.1204054) -
Altwegg et al. (2019)
Altwegg, K., Balsiger, H., Fuselier, F. A., 2019, Ann. Rev. of Astron. & Astrophys., 57, in print.
(DOI: 10.1146/annurev-astro-091918-104409) -
Bhardwaj & Raghuram (2012)
Bhardwaj, A., & Raghuram, S., 2012, Astrophys. J., 748, 13
(DOI: 10.1088/0004-637X/748/1/13) -
Bieler et al. (2015)
Bieler, A., Altwegg, K., Balsiger, H., et al. Nature, 526, 678
(DOI: 10.1038/nature15707) -
Bockelée-Morvan et al. (2016)
Bockelée-Morvan, D., Crovisier, J., Erand, S., et al. 2016, Mon. Not. R. Astron. Soc., 462, S170
(DOI: 10.1093/mnras/stw2428) -
Borovička et al. (2010)
Borovička, J., Kooten, P., Shrbený, L., et al., 2010, IAU Symp., 263, 218
(DOI: 10.1017/S174392131000178X) -
Borovička et al. (2014)
Borovička, J., Kooten, P., Shrbený, L., Rostislav, Š., Hornoch, K., 2014, Earth Moon and Planets, 113, 15
(DOI: 10.1007/s11038-014-9442-x) -
Capria et al. (2010)
Capria, M. T., Gremonese, G., & de Sanctis, M. C. 2010, A&A, 522, A82
(DOI: 10.1051/0004-6361/200913889) -
Cessateur et al. (2016)
Cessateur, G., de Keyser, J., Maggiolo, R., et al. 2016, J. Geophys. Res., 121, 804
(DOI: 10.1002/2015JA022013) -
Clough et al. (1992)
Clough, S.A., Iacono, M.J., & Moncet, J.-L., 1992, J. Geophys. Res., 97, 15761
(DOI: 10.1029/92JD01419) -
Cochran (2008)
Cochran, A. L. 2008, Icarus, 198, 181
(DOI: 10.1016/j.icarus.2008.06.007) -
Cochran (1984)
Cochran, W. D. 1984, Icarus, 58, 440
(DOI: 10.1016/0019-1035(84)90089-7) -
Cochran & Cochran (2001)
Cochran, A. L., Cochran, W. D., 2001, Icarus, 154, 381
(DOI: 10.1006/icar.2001.6718) -
Colangeli et al. (1999)
Colangeli, L., Epifani, E., Brucato, J.R., Bussoletti, E., De Sanctis, C., Fulle, M., Mennella, V., Palomba, E., Palumbo, P., Rotundi, A., 1999, Astron. & Astrophys., 343, L87
- Crovisier et al. (1999) Crovisier, J., Encrenaz, Th., Lellouch, E., Bockelée-Morvan, D., Altieri, B., Leech, K., Salama, A., Griffin, M.J., de Graauw, T., vanDishoeck, E.F., Knacke, R., Brooke, T.Y., 1999, in proc. of the conference “The universe as seen by ISO”, Paris, France, 20–23 October 1998 (ESA Sp-427, March 1999).
-
Decock et al. (2013)
Decock, A., Jehin, E., Hutsemékers, D., & Manfroid, J., 2013, A&A, 555, A34
(DOI: 10.1051/0004-6361/201220414) -
Decock et al. (2015)
Decock, A., Jehin, E., Rousselot, P., et al. 2015, A&A, 573, A1
(DOI: 10.1051/0004-6361/201424403) -
Dello Russo et al. (2016)
Dello Russo, N., Kawakita, H., Vervack, R. J. Jr., Weaver, H. A., 2016, Icarus, 278, 301
(DOI: 10.1016/j.icarus.2016.05.039) -
DiSanti et al. (2013)
DiSanti, M. A., Bonev, B. P., Villanueva, G. L., and Mumma, M. J., 2013, Astrophys. J., 763, 1
(DOI: 10.1088/0004-637X/763/1/1) -
Faggi et al. (2019)
Faggi, S., Mumma, M. J., Villanueva, G. L., Paganini, L., and Lippi, M., 2019, AJ, 158, 254
(DOI: 10.3847/1538-3881/ab4f6e) -
Fink (2009)
Fink, U., 2009, Icarus, 201, 311
(DOI: 10.1016/j.icarus.2008.12.044) -
Galavis et al. (1997)
Galavis, M. E., Mendoza, C., & Zeippen, C. J.,
1997, A&AS, 123, 159
(DOI: 10.1051/aas:1997344) -
Gersch et al. (2018a)
Gersch, A. M., Feaga, L. M., A’Hearn, M. F., 2018, Astrophys. J., 854, 149
(DOI: 10.3847/1538-4357/aa9795) -
Gersch et al. (2018b)
Gersch, A. M., Feaga, L. M., A’Hearn, M. F., 2018, Astrophys. J., 856, 104
(DOI: 10.3847/1538-4357/aaaa25) -
Hama et al. (2011)
Hama. T., Watanabe, N., Kimura, Y., et al., 2011, Astrophys. J., 738, 15
(DOI: 10.1088/2041-8205/738/1/L15) -
Hama et al. (2012)
Hama. T., Kuwabata, K., Watanabe, N., et al., 2012, Astrophys. J., 757, 185
(DOI: 10.1088/0004-637X/757/2/185) -
Hama & Watanabe (2013)
Hama. T., & Watanabe, N., 2013, Chemical Rev., 113, 8783
(DOI: 10.1021/cr4000978) -
Hama et al. (2016)
Hama. T., Kouchi, A., Watanabe, N., 2016, Science, 351, 65
(DOI: 10.1126/science.aad4026) -
Hama et al. (2018)
Hama. T., Kouchi, A., Watanabe, N., 2016, Astrophys. J. Lett., 857, L13
(DOI: 10.3847/2041-8213/aabc0c) -
Huestis & Slanger (2006)
Huestis, D., Slanger, T. G., 2006, Bulletin of the American Astron. Soc., 38, 609
-
Jenniskens (2006)
Jenniskens, P., Meteor Showers and their Parent Comets, Cambridge University Press, pp.110
(ISBN: 0521853494) -
Kawakita et al. (2000)
Kawakita, H., Ayani, K., & Kawabata, T., 2000, Publ. Astron. Soc. Japan, 52, 925
(DOI: 10.1093/pasj/52.5.925) -
Kiselev et al. (2000)
Kiselev, N. N., Jockers, K., Rosenbush, V. K., et al., 2000, Planetary and Space Science, 48, 1005
(DOI: 10.1016/S0032-0633(00)00069-6) -
Kurucz (2005)
Kurucz, R. L., 2005, MSAIS, 8, 189
-
Manfroid et al. (2009)
Manfroid, J., Jehin, E., Hutsemékers, D., et al. 2009, Astron. Astrophys., 503, 613
(DOI: 10.1051/0004-6361/200911859) -
McKay et al. (2016)
McKay, A. J., Kelley, M. S. P., Cochran, A. L., et al. 2016, Icarus, 266, 249
(DOI: 10.1016/j.icarus.2015.11.004) -
McKay et al. (2015)
McKay, A. J., Cochran, A. L., DiSanti, M. A., et al. 2015, Icarus, 250, 504
(DOI: 10.1016/j.icarus.2014.12.023) -
McKay et al. (2013)
McKay, A. J., Chanover, N. J., Jeffrey, P., et al. 2013, Icarus, 222, 684
(DOI: 10.1016/j.icarus.2012.06.020) -
Morgenthaler et al. (2001)
Morgenthaler, J., Harris, W. N., Scherb, F., et al. 2001, ApJ, 563, 451
(DOI: 10.1086/823773) -
Morgenthaler et al. (2007)
Morgenthaler, J., Harris, W. N., Cimbi, M. R., 2007, ApJ, 657, 1162
(DOI: 10.1086/511062) -
Noguchi et al. (2002)
Noguchi, K., Aoki, W., Kawanomoto, S., et al. 2002, PASJ, 54, 855
(DOI: 10.1093/pasj/54.6.855) -
Ootsubo et al. (2019)
Ootsubo, T., Kawakita, H., Shinnaka, Y.,
Watanabe, J., Honda, M., 2019, Icarus, 338, 113450
(DOI: 10.1016/j.icarus.2019.113450) -
Ootsubo et al. (2012)
Ootsubo, T., Kawakita, H., Hamada, S., et al. 2012, ApJ, 752, 15
(DOI: 10.1088/0004-637X/752/1/15) -
Raghuram & Bhardwaj (2013)
Raghuram, S., & Bhardwaj, A., 2013, Icarus, 223, 91
(DOI: 10.1016/j.icarus.2012.11.032) - Roth et al. (2020) Roth, N, X., Gibb, E. L., Bonev, B. P., et al. 2020, AJ, 159, 42 (DOI: 10.3847/1538-3881/ab536b)
-
Rousselot et al. (2015)
Rousselot, P., Decock, A., Korsun, P. P., et al. 2015, A&A, 580, A3
(DOI: 10.1051/0004-6361/201526173) -
Rousselot et al. (2012)
Rousselot, P., Jehin, E., Manfroid, J., Hutsemḱers, D., 2012, A&A, 545, A24
(DOI: 10.1051/0004-6361/201219265) -
Rubin et al. (2015)
Rubin M., Altwegg, K., van Dishoeck, E. F., Schwehm, G., 2015, Astrophys. J. Lett., 815, L11
(DOI: 10.1088/2041-8205/815/1/L11) -
Shinnaka & Kawakita (2016)
Shinnaka, Y., & Kawakita, H., 2016, Astron. J., 152, 145
(DOI: 10.3847/0004-6256/152/5/145) -
Shinnaka et al. (2016)
Shinnaka, Y., Kawaktia, H., Jehin, E., et al., 2016, Mon. Not. R. Royal Soc., 462, S195
(DOI: 10.1093/mnras/stw2410) -
Shinnaka et al. (2010)
Shinnaka, Y., Kawakita, H., Kobayashi, H., & Kanda, Y., 2010, Publ. Astron. Soc. Japan, 62, 263
(DOI: 10.1093/pasj/62.2.263) -
Slanger et al. (2006)
Slanger, T. G., Cosby, P. C., Sharpee, B. D., Minschwaner, K. R., Siskind, D. E., 2006 J. Geophys. Res., 111, A12318
(DOI: 10.1029/2006JA011972, 2006) -
Song et al. (2014)
Song, Y., Gao, H., Chang, Y. C., Lu, Z., Ng C. Y., & Jackson, W. M., 2014, PCCP, 16, 563
(DOI: 10.1039/c3cp53250j) -
Storey & Zeippen (2000)
Storey, P. J., & Zeippen, C. J., 2000, MNRAS, 312, 813
(DOI: 10.1046/j.1365-8711.2000.03184.x) -
Tody (1986)
Tody, D., 1986, SPIE, 627, 733
(DOI: 10.1117/12.968154) -
Tody (1993)
Tody, D., 1993, ASPC, 52, 173
(DOI: 10.1117/12.968154) -
Weaver et al. (1994)
Weaver, H. A., Feldman, P. D., McPhate, J. B., A’Hearn, M. F., Arpigny, C., Smith, T. E., 1994, ApJ, 422, 374
(DOI: 10.1086/173732)