A Significantly Neutral Intergalactic Medium Around the Luminous z = 7 Quasar J0252–0503
Abstract
Luminous quasars provide direct probes of the evolution of supermassive black holes (SMBHs) and the intergalactic medium (IGM) during the epoch of reionization (EoR). The Ly damping wing absorption imprinted by neutral hydrogen in the IGM can be detected in a single EoR quasar spectrum, allowing the measurement of the IGM neutral fraction towards that line of sight. However, damping wing features have only been detected in two quasars in previous studies. In this paper, we present new high quality optical and near-infrared spectroscopy of the quasar DES J025216.64–050331.8 obtained with Keck/NIRES and Gemini/GMOS. , we find that it hosts a SMBH accreting at an Eddington ratio of , consistent with the values seen in other luminous quasars. Furthermore, the Ly region of the spectrum exhibits a strong damping wing absorption feature. The lack of associated metal absorption in the quasar spectrum indicates that this absorption is imprinted by a neutral IGM. Using a state-of-the-art model developed by Davies et al., we measure a volume-averaged neutral hydrogen fraction at of within 68% (95%) confidence intervals when marginalizing over quasar lifetimes of yr. This is the highest IGM neutral fraction yet measured using reionization-era quasar spectra.
1 Introduction
The earliest luminous quasars, powered by billion solar mass supermassive black holes (SMBHs), can be used not only to constrain the physics of SMBH accretion and the assembly of the first generation of massive galaxies in the early Universe, but also to obtain critical information on the physical conditions of the intergalactic medium (IGM) during the epoch of reionization (EoR). Although more than 200 quasars have been found in the past few decades (e.g. Fan et al., 2001; Willott et al., 2010; Wu et al., 2015; Jiang et al., 2016; Bañados et al., 2016; Wang et al., 2016; Matsuoka et al., 2016; Reed et al., 2017), only several tens of them are at (e.g. Venemans et al., 2015; Mazzucchelli et al., 2017; Wang et al., 2017, 2019; Yang et al., 2019; Reed et al., 2019) and just six are currently known at (Mortlock et al., 2011; Bañados et al., 2018; Wang et al., 2018; Matsuoka et al., 2019a, b; Yang et al., 2019). The limited number of known high redshift quasars is due to the combination of a rapid decline of quasar spatial density towards higher redshifts (e.g. Wang et al., 2019), the lack of deep wide-field near-infrared surveys, and the presence of a large number of contaminants from Galactic cool dwarf populations in the photometric quasar selection process. Near-infrared spectroscopic observations of these known quasars indicate that billion or even ten billion solar mass SMBHs are already in place in these luminous quasars (e.g. Wu et al., 2015; Shen et al., 2019). The existence of these SMBHs in such a young Universe challenges our understanding of the formation and the growth mechanisms of SMBHs (e.g. Volonteri & Rees, 2006; Pezzulli et al., 2016; Wise et al., 2019; Davies et al., 2019).
Observations of the Lyman series forests in quasars indicate that the IGM is already highly ionized by (e.g. Fan et al., 2006; Bosman et al., 2018; Eilers et al., 2018, 2019; Yang et al., 2020), although the final completion of reionization might extend down to (e.g. Becker et al., 2015; Davies et al., 2018a; Kulkarni et al., 2019; Keating et al., 2020). However, the Lyman series forests are very sensitive to neutral hydrogen and saturate even at low IGM neutral fraction (i.e. ). On the other hand, if the neutral fraction is of order unity, one would expect to see appreciable absorption redward of the wavelength of the Ly emission line, resulting in a damping wing profile (e.g. Miralda-Escudé, 1998) due to significant optical depth on the Lorentzian wing of the Ly absorption. The first quasar with a damping wing detection is ULAS J1120+0641 (Mortlock et al., 2011) at , although different analyses yielded different constraints on (Mortlock et al., 2011; Bolton et al., 2011; Bosman & Becker, 2015; Greig et al., 2017; Davies et al., 2018b), ranging from to at . Recently, the spectrum of quasar ULAS J1342+0928 (Bañados et al., 2018) at shows a robust detection of the damping wing signal (Bañados et al., 2018; Davies et al., 2018b; Greig et al., 2019; Ďurovčíková et al., 2019), yielding at . Compared to other probes of reionization history, such as CMB polarization (Planck Collaboration et al., 2018) and Ly emission line visibility in high-redshift galaxies (e.g. Ouchi et al., 2010; Mason et al., 2018), a main advantage of IGM damping wing measurement is that it can be applied to individual quasar sight lines, thereby constraining not only the average neutral fraction, but also its scatter in different regions of the IGM. However, the damping wing experiment is only feasible at very high redshifts where the IGM is relatively neutral, and current damping wing analyses have been limited to these two sight-lines due to the lack of bright quasars at . Thus, it is crucial to investigate the damping wing experiment along more quasar sight lines.
In this paper, we present the detection of strong IGM damping wing absorption along the line of sight to a luminous quasar DES J025216.64–050331.8 (hereinafter J0252–0503; Yang et al., 2019), using new high quality optical/near-infrared spectroscopic observations; we also use the new spectrum to measure the mass and Eddington ratio of the central SMBH. In Section 2, we describe our photometric and spectroscopic observations for J0252–0503. In Section 3, we present the luminosity, BH mass and Eddington ratio measurements of J0252–0503. In Section 4, we discuss the reconstructions of the unabsorbed spectrum of the quasar and our constraints on the neutral fraction in the IGM at by modeling IGM Ly absorption. Finally, in Section 5 we summarize our results and briefly discuss the implications for the cosmic reionization history and BH growth constraints with larger quasar samples at in the future. Throughout this paper, we assume a flat CDM cosmology with (Betoule et al., 2014), , , , and . All photometry in this paper is in the AB system.
2 Observations and Data Reduction
J0252–0503 (Yang et al., 2019) was selected as a quasar candidate using photometry from the Dark Energy Survey (DES, Abbott et al., 2018) and the unblurred coadds of WISE (unWISE, Lang, 2014) data. It was spectroscopically identified as a quasar at based on the strong Ly break using observations from Magellan/LDSS-3. However, the lack of a near-infrared spectrum for this quasar precluded detailed analyses in the discovery paper.
We obtained a high quality near-infrared spectrum with the Near-Infrared Echellette Spectrometer (NIRES111https://www2.keck.hawaii.edu/inst/nires/; Wilson et al., 2004) mounted on the Keck-2 telescope. NIRES is a prism cross-dispersed near-infrared spectrograph with a fixed configuration that simultaneously covers the Y, J, H, and K bands in five orders from 0.94 to 2.45 m with a small gap between 1.85 and 1.88 m. The mean spectral resolving power of NIRES is with a fixed narrow slit. We observed J0252–0503 with NIRES for a total of 4.8 hours of on-source integration on three nights: 1.4 hours on 2018 August 12, 1.0 hour on 2018 September 3, and 2.4 hours on 2018 October 1 (UT). The observations were separated into multiple 300 s or 360 s individual exposures with the standard ABBA dither pattern. We also observed the flux standard star Feige 110. We reduced the NIRES data using a newly developed open-source Python-based spectroscopic data reduction pipeline (PypeIt222https://github.com/pypeit/PypeIt; Prochaska et al., 2019). Basic image processing (i.e. flat fielding) followed standard techniques. Wavelength (in vacuum) solutions for individual frames were derived from the night sky emission lines. Sky subtractions were performed on the 2-D images by including both image differencing and a B-spline fitting procedure. We used the optimal spectrum extraction technique (Horne, 1986) to extract 1-D spectra. We flux calibrated the individual 1-D spectra with the sensitivity function derived from the standard star Feige 110. We then stacked the fluxed 1-D spectra from each night and fitted a telluric absorption model directly to the stacked quasar spectra using the telluric model grids produced from the Line-By-Line Radiative Transfer Model (LBLRTM 333http://rtweb.aer.com/lblrtm.html; Clough et al., 2005). Finally, we combined all spectra obtained on different nights to produce the final processed 1-D spectrum.
Gemini GMOS-S (Hook et al., 2004) observations for J0252–0503 (previously described by Yang et al., 2019) were performed in two wavelength setups both with the R400 grating to cover the small wavelength gaps between detectors, with one setup centered at 860 nm and the other centered at 870 nm. These two setups yields a wavelength coverage of 0.6–1.1 m and spectral resolution of . Each setup was exposed for an hour. The GMOS data were also reduced with PypeIt. The spectra were flux calibrated with the sensitivity function derived from flux standard star GD71 and telluric absorption was corrected using the same method as the NIRES data reduction.
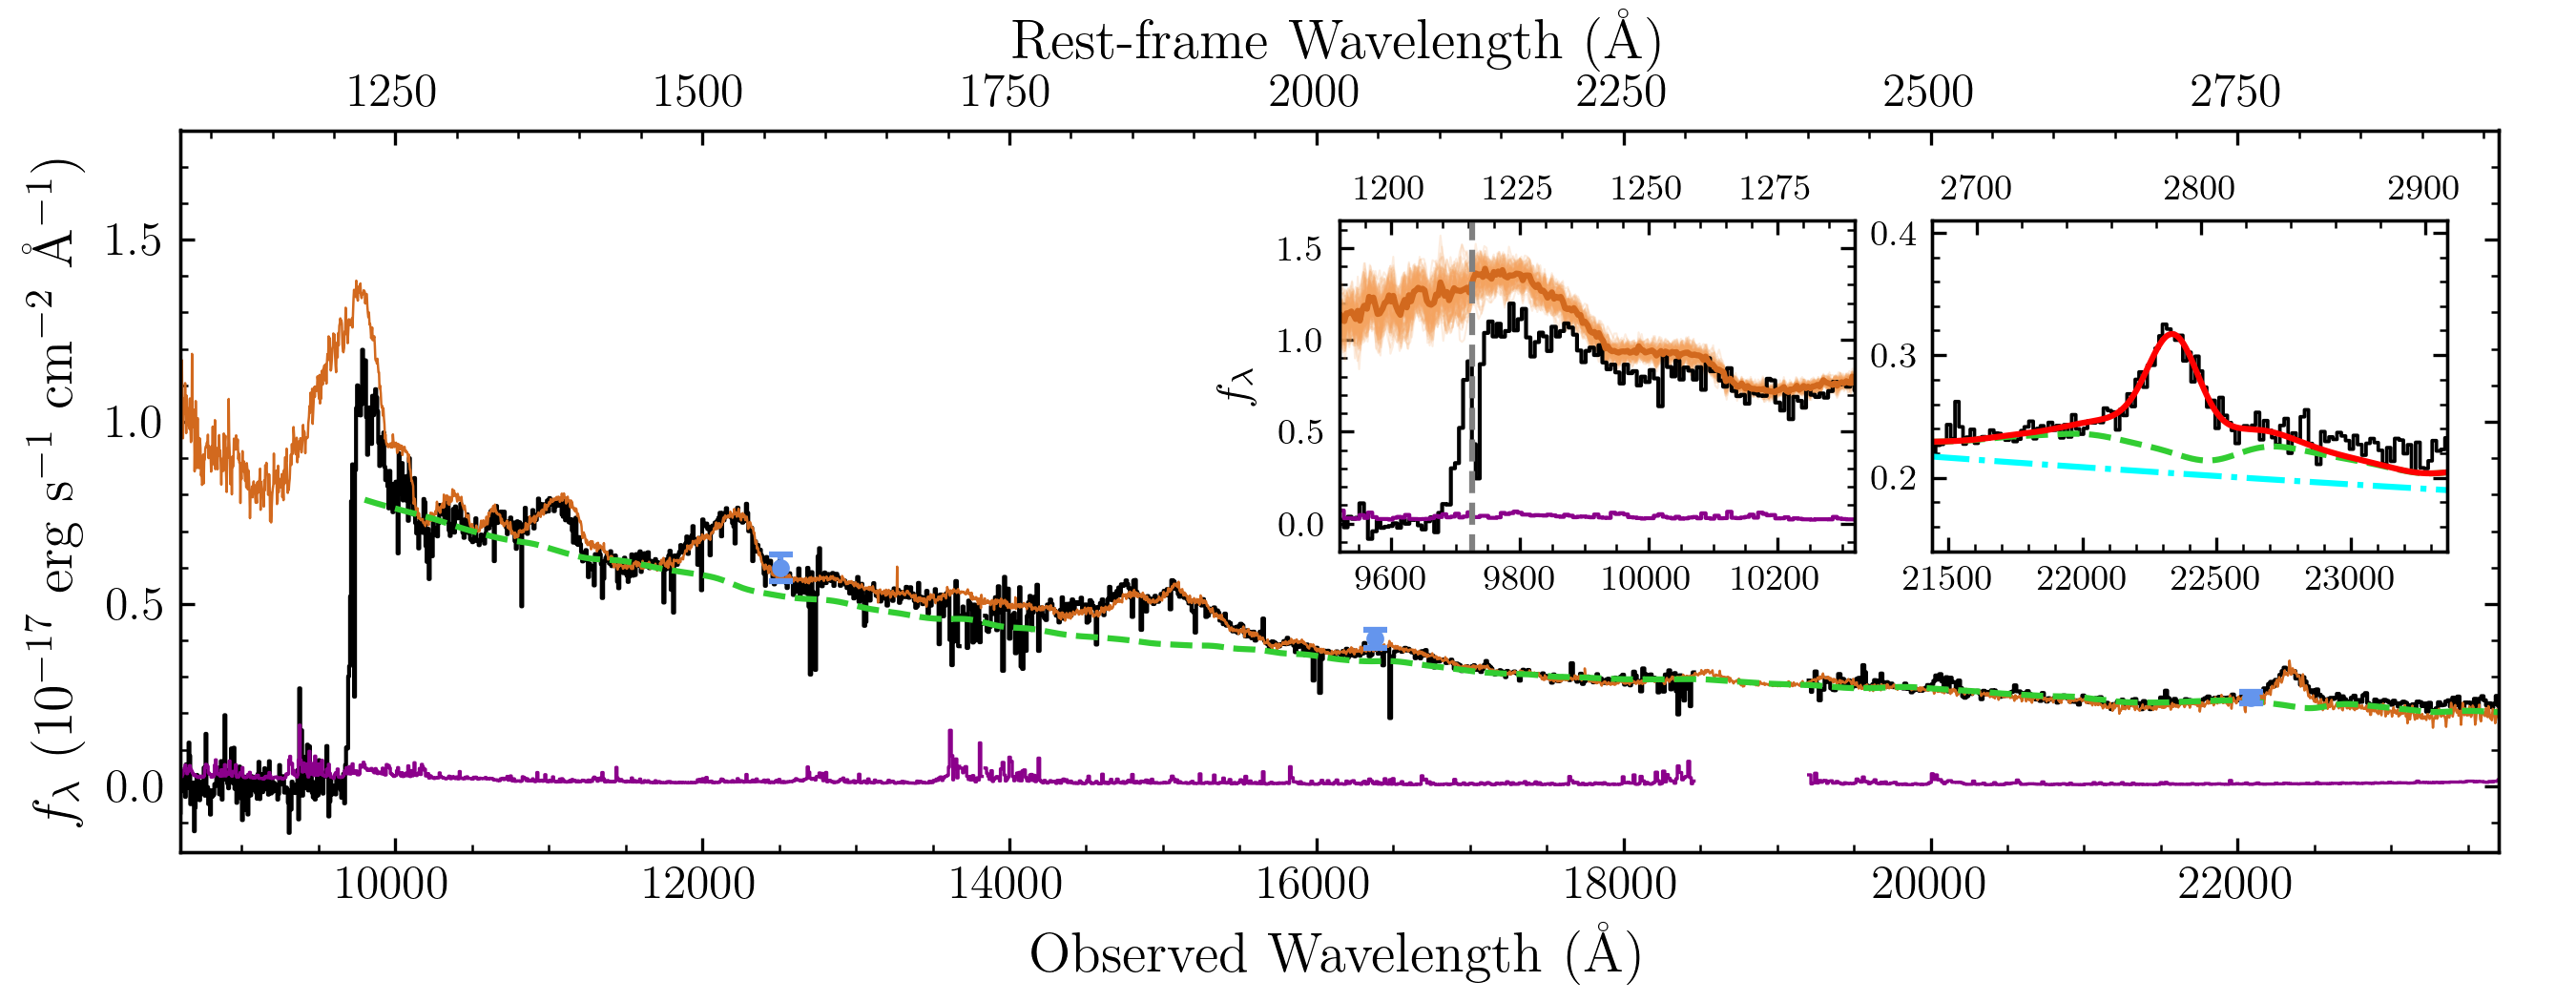
Since the flux calibration is crucial for the damping wing analyses, we also obtained near-infrared Y, J, H, and K-band photometry with UKIRT/WFCam on 2018 November 27. The on-source times were 8 min in each band. The data were processed using the standard VISTA/WFCAM data-flow system by M. Irwin (Irwin et al., 2004). The magnitudes of J0252–0503 were measured to be Y=20.330.07, J=20.190.07, H=20.020.07, and K=19.920.08. We then scaled the combined NIRES and GMOS spectrum by carrying out synthetic photometry on the spectrum using the WFCAM J-band filter response curve to match the J-band photometry for absolute flux calibration. The magnitudes measured from the J-band scaled spectrum in the Y, H, and K bands are 20.36, 20.09, and 19.93 mag, respectively. The consistency of magnitudes derived from the fluxed spectrum and UKIRT observations indicates that the spectrophotometric calibration of the spectrum is accurate to within 10%. Finally, we corrected for Galactic extinction using the dust extinction map derived by Schlegel et al. (1998). The spectrum was then de-redshifted with the systemic redshift , derived from the IRAM NOrthern Extended Millimeter Array (NOEMA) observations of the far-infrared [C ii] emission line444The host galaxy properties of J0252–0503 will be published separately together with [C ii] observations of a sample of quasars.. The final spectrum used for the following analyses is shown in Figure 1. Note that in Figure 1, the spectrum is plotted after being rebinned to 200 pixels.
3 Rest-Frame UV Properties and Black Hole Mass
In order to derive the rest-frame ultraviolet (UV) properties of J0252–0503, we fit a pseudo-continuum model which includes a power-law continuum, iron (Fe ii and Fe iii) emission (Vestergaard & Wilkes, 2001; Tsuzuki et al., 2006), and Balmer continuum (e.g. De Rosa et al., 2014) to the line-free region of the calibrated and deredshifted spectrum. This pseudo-continuum model is then subtracted from the quasar spectrum, leaving a line-only spectrum. We then fit the Mg ii broad emission line in the continuum-subtracted spectrum with two Gaussian profiles. To estimate the uncertainties of our spectral measurements, we use a Monte Carlo approach (e.g. Shen et al., 2019) to create 100 mock spectra by randomly adding Gaussian noise at each pixel with its scale equal to the spectral error at that pixel. We then apply the exact same fitting algorithm to these mock spectra. The uncertainties of measured spectral properties are then estimated based on the 16% and 84% percentile deviation from the median.
The pseudo-continuum model is shown in Figure 1 and an enlargement of the Mg ii region fitting is shown in the right insert panel of Figure 1. The fitting procedure yields a power-law continuum of , from which we measure the rest-frame 3000 Å luminosity to be =(2.50.2) erg s-1, implying a bolometric luminosity of =5.15 = (1.30.1)1047 erg s-1 (Shen et al., 2011). The rest-frame 1450 Å magnitude is measured to be . The full width at half maximum (FWHM) and equivalent width (EW) of the Mg ii line are measured to be FWHM km s-1 and EWMgII= Å, respectively. The Mg ii emission line is blueshifted by relative to the systemic redshift determined from the [C ii] line, similar to other luminous quasars in which Mg ii blueshifts range from a few hundred to km s-1 (e.g. Venemans et al., 2016; Mazzucchelli et al., 2017; Bañados et al., 2018; Decarli et al., 2018).
We adopt the empirical relation obtained by Vestergaard & Osmer (2009) to estimate the black hole mass of J0252–0503, which yields . By comparing the bolometric luminosity estimated above with the Eddington luminosity, which is , we measure the Eddington ratio of J0252–0503 to be . Note that the uncertainty quoted here does not consider the systematic uncertainties introduced by both single epoch BH mass estimators and monochromatic bolometric corrections. The Eddington ratio of J0252–0503 is slightly lower than that of the other three luminous quasars: for J1342+0928 (Bañados et al., 2018) at , for J1120+0641 at (Mortlock et al., 2011), and for J0038–1527 at (Wang et al., 2018). If J0252–0503 has been accreting at such Eddington ratio since with a radiative efficiency of 10%, it would require a seed BH of , which significantly exceeds the predicted mass range from stellar remnant BHs and requires more exotic seed formation mechanisms like direct collapse BHs.
4 A Strong Ly Damping Wing at
Among the six public known quasars, two objects already have had damping wing analyses performed (Mortlock et al., 2011; Bolton et al., 2011; Bosman & Becker, 2015; Greig et al., 2017, 2019; Bañados et al., 2018; Davies et al., 2018b; Ďurovčíková et al., 2019). Two other quasars are too faint () for damping wing analyses with current facilities (Matsuoka et al., 2019a, b), and another is a broad absorption line (BAL) quasar in which strong absorption precludes determination of the intrinsic quasar spectrum (Wang et al., 2018). Thus, J0252–0503 is the only known bright, non-BAL quasar at of which a damping wing analysis has not been performed yet. In order to examine whether the damping wing is present in the spectrum of J0252–0503, we need to know the intrinsic quasar spectrum in the Ly region (i.e. before IGM attenuation). In the past few years, several methods have been proposed for constructing the quasar intrinsic spectra, including stacking of low-redshift quasar spectra with similar emission line properties (e.g. Mortlock et al., 2011; Simcoe et al., 2012; Bañados et al., 2018), using the principal component analysis (PCA) decomposition approach (Davies et al., 2018b, c), constructing the covariant relationships between parameters of Gaussian fits to Ly line and those of Gaussian fits to other broad emission lines (Greig et al., 2017, 2019), and using the neural network method (Ďurovčíková et al., 2019). In this paper, we adopt both the empirical composite method and the PCA method to construct the intrinsic spectrum for J0252–0503 as detailed below.
4.1 Empirical Composite Spectra from Analogs
Since there is a lack of spectral evolution of quasars from low redshifts to high redshifts (e.g. Shen et al., 2019), the large sample of SDSS/BOSS quasars at lower redshifts provides a good training set for constructing a high-redshift quasar intrinsic spectrum. First, we use a composite spectrum constructed from a sample of low-redshift quasar analogs to model the intrinsic spectrum. Because the C iv line properties, and especially the line’s blueshift, appear to be strongly connected with differences in the quasar spectral energy distribution (e.g. Richards et al., 2011), we select quasar analogs from SDSS/BOSS DR14 quasar catalog (Pâris et al., 2018) by matching the C iv blueshifts to J0252–0503. As most SDSS/BOSS quasars do not have [C ii] redshifts, we measure the relative blueshifts between the C iv and Mg ii lines. This limits us to selecting quasars in the redshift range in order to get Ly, C iv, and Mg ii line properties from BOSS spectra. We also excluded quasars marked as BAL and those without Mg ii redshift measurements in the catalog. This yields 85,535 quasars in total.
Before measuring the line properties from these quasars, we first fit a power-law continuum to the quasar spectrum and subtract it from the data. Instead of fitting the C iv and Mg ii lines directly, we use a more robust non-parametric scheme proposed by Coatman et al. (2016) to measure the line centroids of C iv and Mg ii lines from the continuum subtracted spectra. The relative blueshift between these two lines is then defined as
| (1) |
where is the speed of light and () is the rest-frame wavelength that bisects the cumulative total line flux of C iv (Mg ii). We applied this procedure to the spectra of both J0252–0503 and the 85,535 SDSS/BOSS quasars. The blueshift in J0252–0503 is measured to be 4090 km . We then select quasars with blueshifts between 3,000 km and 5,000 km and mean spectral signal-to-noise ratios (SNRs) per pixel in the C iv and Mg ii regions greater than 4 and 2, respectively. These SNR limits were chosen to yield enough sight-lines to compute a composite. After this, we visually inspected the continuum normalized spectra and removed quasars that have BAL features, proximate damped Ly systems (PDLAs) and strong intervening absorbers on top of the emission lines. We also reject objects with Mg ii line measurements that are strongly affected by sky line residuals and remove targets that have strongly different C iv and Mg ii line profiles than J0252–0503 (objects were removed if the line peaks differ by more than three times the spectrum error vector of J0252–0503). In the end, our master quasar analog sample consists of 83 SDSS/BOSS quasars.
Before constructing the composite spectrum, each spectrum was divided by its best fit power-law continuum. Each spectrum was weighted by the average SNR of that spectrum when computing the composite. Then we multiplied the power-law fit from J0252–0503 with the constructed continuum normalized composite, obtaining the composite spectrum shown in Figure 1. In order to understand the uncertainties of the composite spectrum and minimize the bias introduced by visual checks, we resampled our parent sample with bootstrapping to construct another 100 composites which are shown as thin orange lines in the insert panel of Figure 1. Overall, the constructed composite matches the J0252–0503 spectrum very well across the whole spectral range, except for the Ly line region. From the left inset of Figure 1, we can clearly see that these composites have higher fluxes redward of the Ly emission line (from 1216Å to 1250Å in rest-frame) than J0252–0503, indicating strong absorption in the spectrum of J0252–0503.
4.2 Principal Component Analysis
Strong correlations between various broad emission lines of quasars from the rest-frame ultraviolet to the optical are known to exist (e.g. Richards et al., 2011). Taking this into account, in principle one can predict the shape of the Ly line based on the properties of other broad emission lines. Davies et al. (2018c) developed a PCA predictive approach based on a training set of quasar spectra from SDSS/BOSS quasar catalog (Pâris et al., 2017) to predict the “blue-side” (rest-frame 1175–1280 Å) quasar spectrum from the “red-side” (rest-frame 1280–2850 Å) spectrum. In brief, we performed a PCA decomposition of the training set truncated at 10 red-side and 6 blue-side basis spectra for each quasar. Then we derived a projection matrix relating the best-fit coefficients in the red-side and a template redshift to the coefficients in the blue-side (Suzuki et al., 2005; Pâris et al., 2011). With this matrix, we can then predict the blue-side coefficients and thus the blue-side spectrum from a fit to the red-side coefficients and template redshift of a given quasar spectrum.
We quantify the uncertainties of this prediction by testing the full predictive procedure on every quasar in the training set and computing their relative continuum error (See Davies et al., 2018c, for more details). We assume a multivariate Gaussian distribution for the relative continuum error, with the covariance matrix determined from the prediction errors measured for similar quasars, i.e., the 1% nearest neighbors, as the uncertainties of the prediction.
The advantage of this PCA method compared to the composite spectrum discussed in §4.1 is that the PCA approach takes into account the properties of all broad emission lines in the red side rather than just the properties of the C iv line. In addition, we can quantify uncertainties in the blue-side spectrum predictions by testing the method on the input training set.
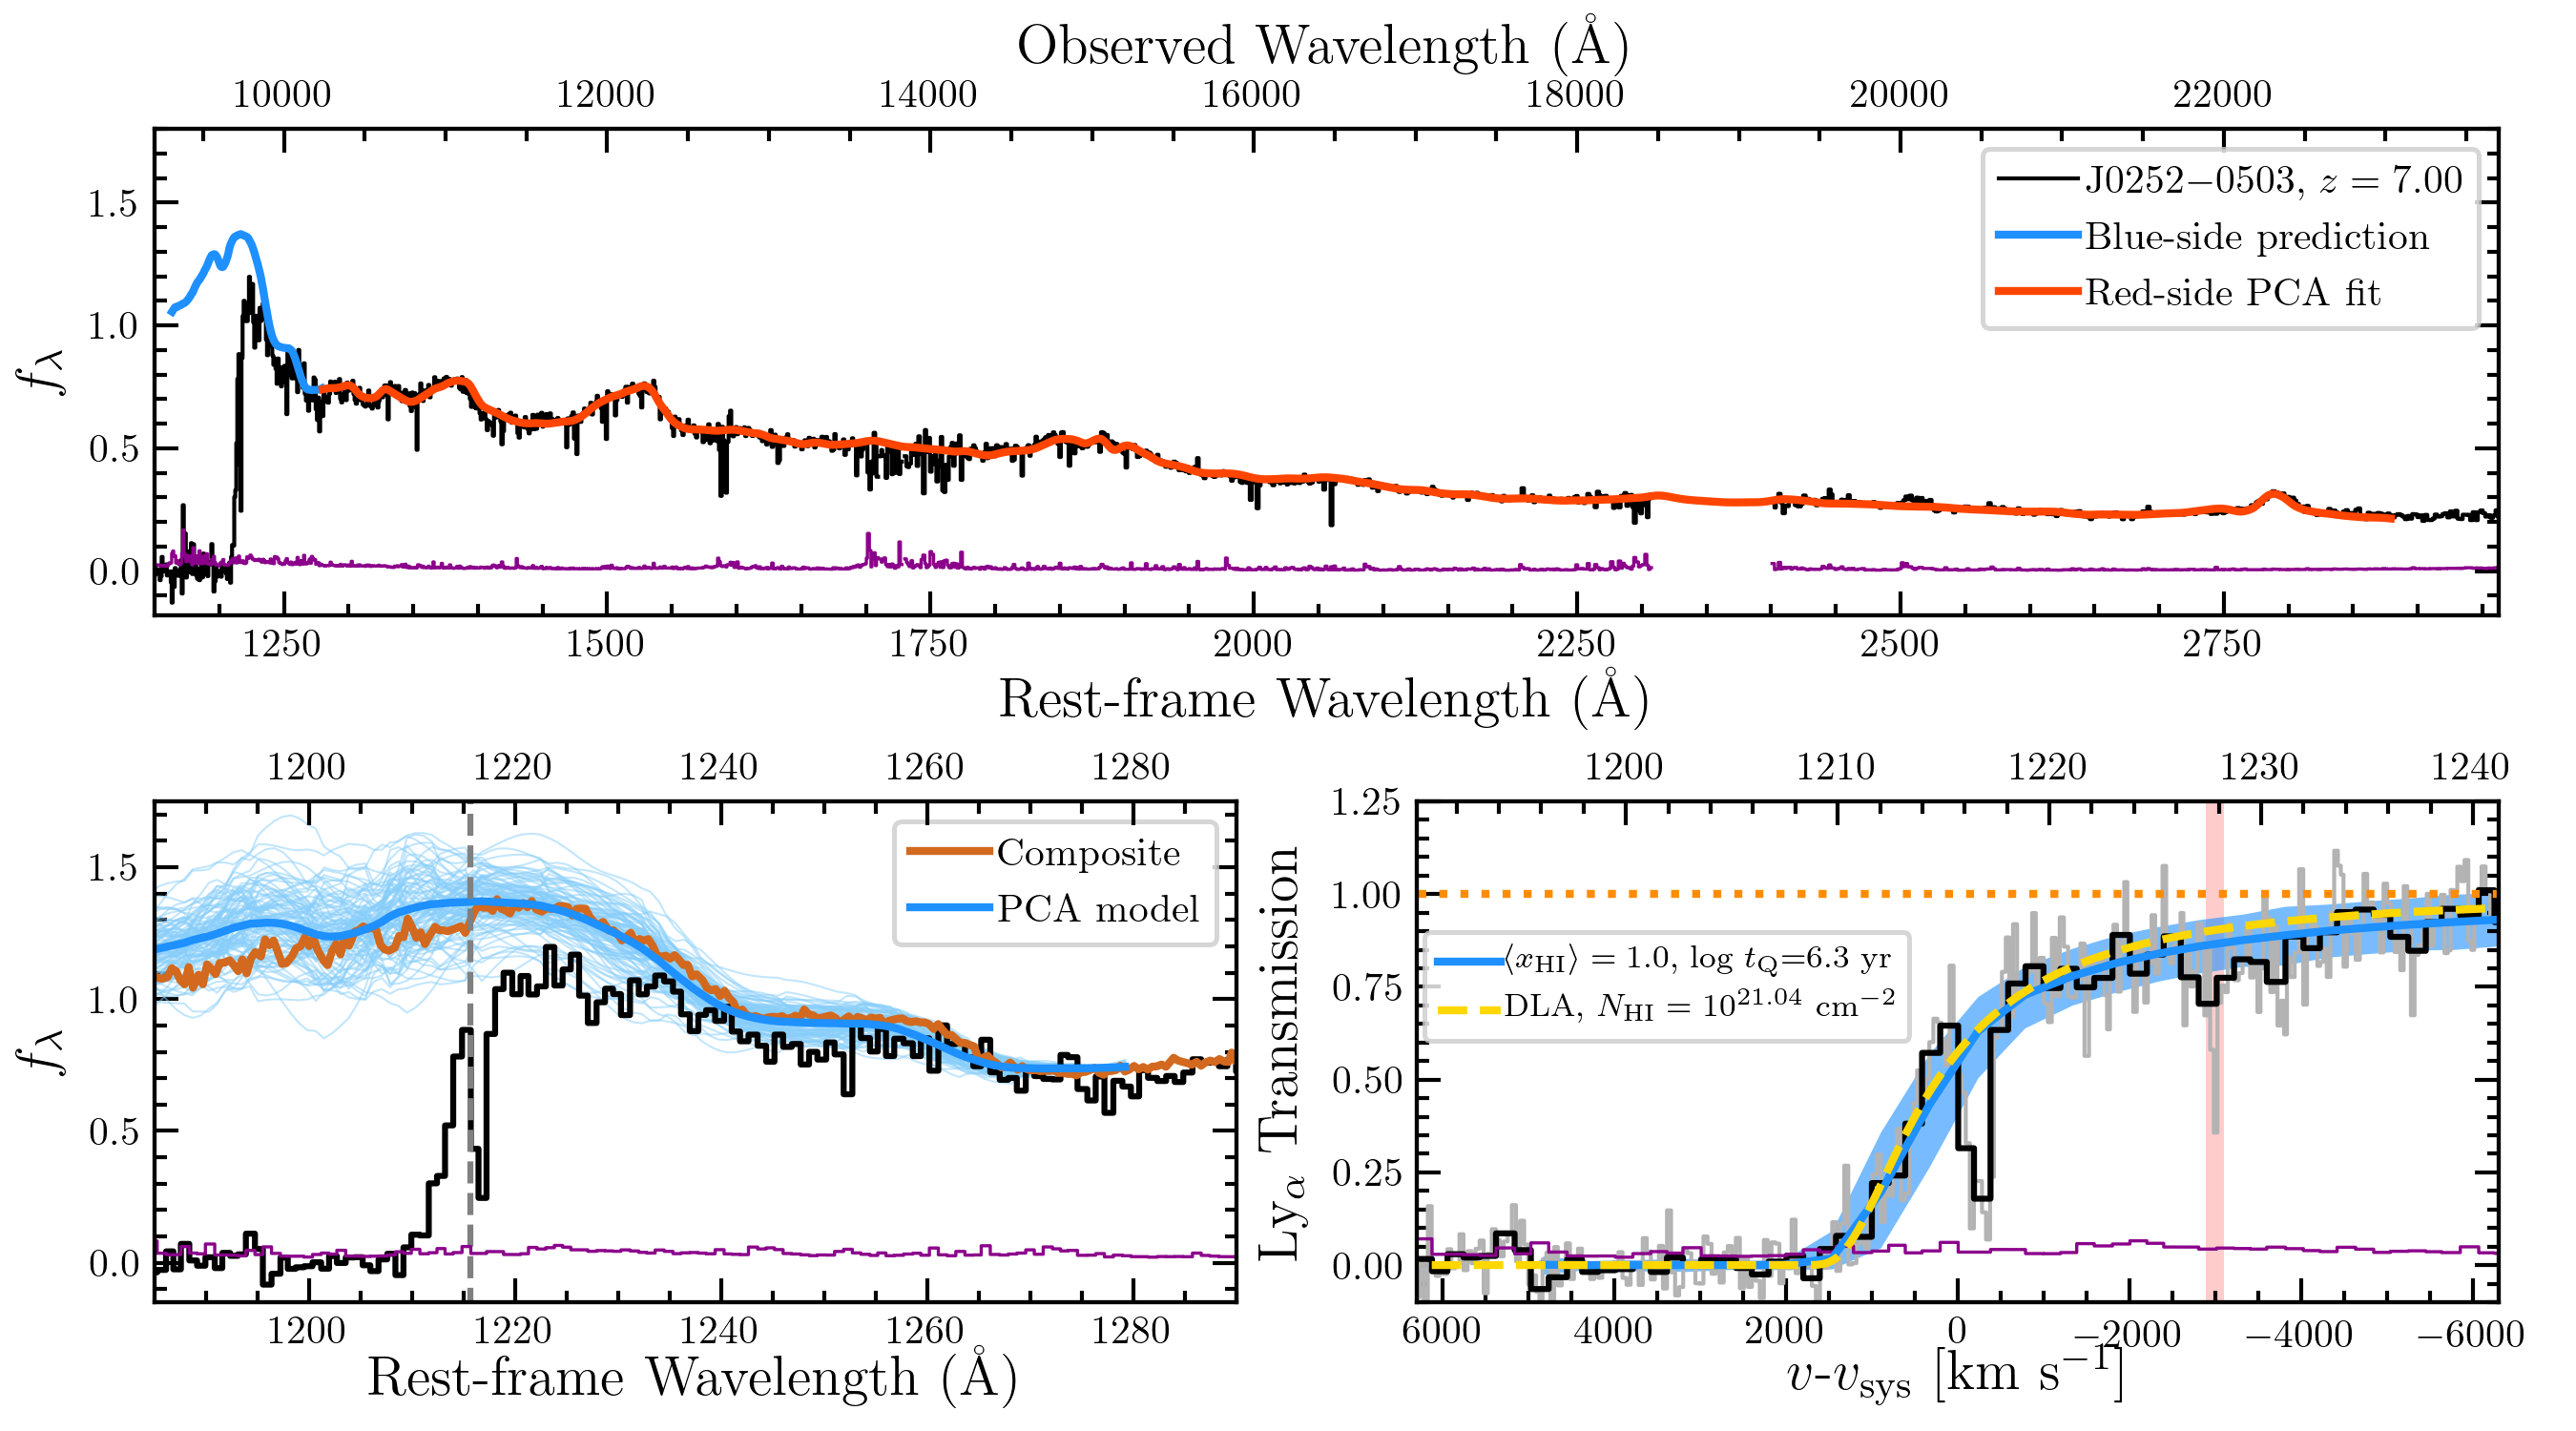
In the upper panel of Figure 2, we show the red-side PCA fit and blue-side prediction for J0252–0503 on top of the GMOS+NIRES quasar spectrum. In the bottom left panel of Figure 2, we show a zoom-in of the Ly region overlaid with both the blue-side PCA model and the composite spectrum constructed in §4.1. From this zoomed-in plot, we can see that the intrinsic quasar spectrum predicted by the PCA model agrees very well with the composite spectrum. Both models suggest that there is a strong damping wing absorption imprinted on the Ly emission line of the quasar. Since these two models are consistent with each other, we will only use the PCA continuum model for the following analyses so that we can make use of its well quantified uncertainties.
4.3 Modeling the Damping Wing as a Single DLA
The smooth damped absorption profile can be imprinted by either an intervening high column density gravitationally bounded DLA system () or substantially neutral gas in the IGM. However, DLA systems in the quasar vicinity are very rare at high redshifts. Among more than 250 known quasars, only a few of them have been identified to be associated with such absorbers close to the quasar redshifts (e.g. D’Odorico et al., 2018; Bañados et al., 2019; Davies, 2020; Farina et al., 2019), suggesting that the probability of the strong redward absorption seen in J0252–0503 being caused by a DLA is low. DLA systems are usually associated with a number of metal lines such as Si ii , O i , C ii , C iv , Mg ii , and a series of Fe ii lines. Thus, one way to distinguish a DLA damping wing from an IGM damping wing is to search for associated metal absorption features.
First, we need to determine the redshift of a potential DLA system. To do so, we fit a Voigt profile to the transmission spectrum which is normalized by the PCA continuum model. Since the Doppler parameter, , does not strongly affect the Ly profile (e.g. Crighton et al., 2015), we fixed the value to be and use the MCMC sampler (emcee; Foreman-Mackey et al., 2013) to jointly fit the redshift and H i column density of a DLA model. During the fit, we masked the narrow absorption at . This absorption could be caused by neutral gas inflow since we did not find any associated metal absorption from the quasar spectrum, and it is located at a slightly higher redshift than the quasar if it is caused by neutral hydrogen. The best fit parameters for the system are determined to be and . In order to qualify the uncertainties of these parameters caused by the continuum model, we then fit DLA models to 100 transmission spectra normalized by the 100 PCA draws shown in the bottom left panel of Figure 2. The median values and the mean deviation of 16% and 84% percentiles from the median for and are measured to be and . To take both the fitting uncertainty and the PCA continuum uncertainty into account, we take and as our fiducial parameters for the DLA model, where the uncertainties are the sum of the uncertainties from the emcee fitting on the transmission spectrum and the distribution of the 100 draws. This potential DLA system (if it exists) is away from the quasar systemic redshift which seems unlikely to be associated with the quasar host galaxy. This best fit DLA model is shown as the yellow dashed line in the bottom right panel of Figure 2. We caution that the resolution of our spectrum is low in the Ly region, so the DLA fitting procedure might overestimate the if there are some narrow Ly transmission spikes in the quasar proximity zone that are unresolved in our spectrum.
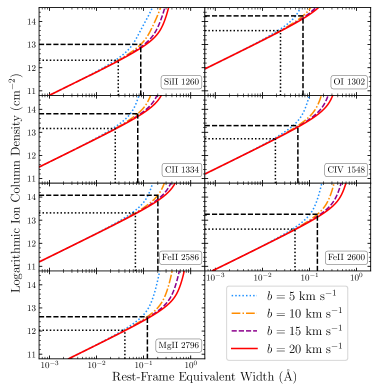
We then searched for metal absorption lines at in the J0252–0503 spectrum. In the end, we did not find any evidence for metal-line absorption at redshifts close to the potential DLA system within , or km s-1, ten times wider than the redshift uncertainty of the potential DLA system. We also did not find any metal absorption features at the quasar systemic redshift (i.e. from the quasar host galaxy). We then calculated rest-frame equivalent width (EW) 1 limits for each expected metal absorption line as follows: , , , , , , . The EW limits were measured by summing over the normalized pixels over an aperture spanning from the center of each line, where was derived from the NIRES instrumental resolution. In order to derive the column densities for the selected iron, we carried out a curve of growth analysis for four different -parameters following Simcoe et al. (2012). The curve of growth analysis is shown in Figure 3. Based on the solar abundance (Lodders, 2003) and the column densities derived by fixing , we find that the metallicity of the potential DLA system is most tightly constrained by C iv. However, whether high redshift DLAs exhibit C iv is still debated (e.g. D’Odorico et al., 2018; Cooper et al., 2019). Thus we use Mg ii which sets the second most stringent constraint on the DLA abundance with (3). The DLA abundance limits are estimated to be , , , and based on Si ii , O i , C ii , and Fe ii , respectively. Since the -parameter could be as low as at high redshifts D’Odorico et al. (2018), we also estimate the [Mg/H] based on and find that (3).
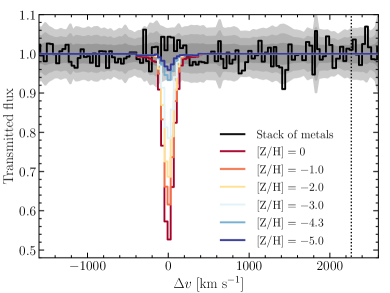
To further investigate the properties of a possible DLA, we compute the composite stack of the heavy-element transitions shown in Figure 3 by assuming that there is a metal-poor DLA at . We stacked the transmitted flux at the expected wavelength using an inverse-variance weighted mean. The composite stack of metal lines is shown in Figure 4 which shows no significant absorption within . Note that the absorption feature at in the stack is caused by the Fe ii 2344 transition from a absorber (see below). The 1 limit for the dimensionless equivalent width, (Draine, 2011), for the stack is measured to be (). This corresponds to a limit of () after scaling it to the cross-section and relative abundance of O i. We also compute a set of DLA models by adapting and solar abundance pattern (Lodders, 2003) with varying metallicities. The DLA transmission spectra are computed in the same wavelength grid and same resolution as the spectrum of J0252–0503. The composite stack of these DLA models for different metallicities is also over-plotted in Figure 4. The composite stack with matches the observed stack at level, consistent with our curve of growth analysis of the observed composite metal transitions within 0.2 dex. From Figure 3, we note that most of the metal transitions are in the linear region of the curve of growth unless . Thus the metallicity constraint does not change too much by varying the -parameter. By varying from to , we can constrain the metallicity of the potential DLA system to be . Our analysis indicates that this potential DLA system would be among the most metal-poor DLA systems known (e.g. Cooke et al., 2011; Bañados et al., 2019). This suggests that the strong damped absorption is very unlikely to be caused by a DLA.
In addition, we also searched for absorbers at lower redshifts to make sure that the damped Ly absorption is not contaminated by lower redshift absorbers. We identify five strong Mg ii absorption systems at , , , , and . These systems also exhibit associated Fe ii lines. The system also has associated Al ii absorption line which falls into the damped absorption region which is masked in the following damping wing analysis. However, this line is very narrow (see the bottom right panel of Figure 2) and thus would not be responsible for the smoothed absorption profile on much larger scales. These analyses indicate that the damping wing absorption in the J0252–0503 spectrum is more likely to be imprinted by the neutral IGM rather than by a DLA system or other intervening absorbers, especially considering the fact that J1120+0641 and J1342+0928 also have similar (though slightly weaker) absorption profiles that are not associated with metals (e.g. Simcoe et al., 2012; Bañados et al., 2018).
4.4 Constraints on the IGM Neutral Fraction from A Strong Damping Wing at
In order to quantitatively assess the damping wing strength and constrain the volume-averaged neutral hydrogen fraction at , we applied the methodology from Davies et al. (2018b) to this quasar sight-line. We refer the reader to Davies et al. (2018b) for a detailed description. In brief, we model the reionization-era quasar transmission spectrum with a multi-scale hybrid model. This model combines large-scale semi-numerical reionization simulations around massive dark matter halos computed in a (400 Mpc)3 volume with a modified version of 21cmFAST (Mesinger et al., 2011, Davies & Furlanetto in prep), density, velocity, and temperature fields of 1200 hydrodynamical simulation skewers from a separate (100 Mpc/)3 Nyx hydrodynamical simulation (Almgren et al., 2013; Lukić et al., 2015), and 1D ionizing radiative transfer which models the ionization and heating of the IGM by the quasar (Davies et al., 2016). We then construct realistic forward modeled representations of quasar transmission spectra after accounting for the covariant intrinsic quasar continuum uncertainty from the PCA training. Finally, we use a Bayesian statistical method to recover the joint posterior probability distribution functions (PDFs) of based on these mock transmission spectra.
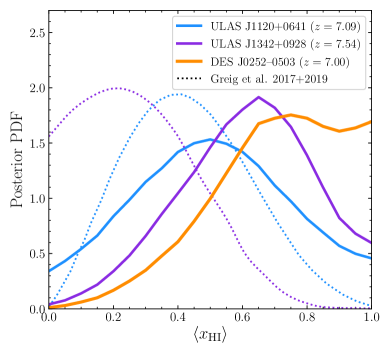
The damping wing strength not only depends on the , but also strongly depends on the quasar lifetime, , due to the ionization of pre-existing neutral hydrogen along the line of sight by the quasar. In order to measure , we conservatively explore a very broad range with a flat log-uniform prior covering . We then compute the posterior PDF for by marginalizing over the entire model grid of , which is shown in Figure 5. The peak of the PDF leans to the high end. This is consistent with what we have seen in Figure 2, where we show a quasar transmission spectrum model within a IGM with a quasar lifetime of yr. The median and the central 68% (95%) confidence interval for are estimated to be from the posterior PDF. As a comparison, we also show the PDFs from the other two quasar sight-lines in Figure 5. Although the redshift of J0252–0503 is lower than the other two quasars, the damping wing in J0252–0503 is the strongest one.
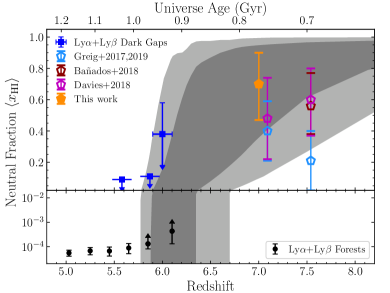
In Figure 6, we plot the constraints from all three quasar damping wings. In this figure, we also show the constraints from the Ly+Ly forest (Fan et al., 2006), as well as Ly+Ly dark gaps (McGreer et al., 2015). All three quasars for which a damping wing analysis can be done with current facilities and methodology show evidence of damping wing absorptions, suggesting that the IGM is substantially neutral at . These constraints are consistent with the integral constraints of measured from the electron scattering optical depth of the CMB (Planck Collaboration et al., 2018) shown as the underlying shaded region in Figure 6. They are also in broad agreement with recent calculations (e.g. Robertson et al., 2015) and simulations (e.g. Kulkarni et al., 2019) of the cosmic reionization history, as well as constrains from gamma-ray burst (GRB) damping wings (Totani et al., 2006, 2016; Greiner et al., 2009), the detections of Ly emissions from high redshift galaxies (e.g. Ouchi et al., 2010; Mason et al., 2018), and Ly luminosity functions (e.g. Kashikawa et al., 2006; Konno et al., 2018).
5 Summary and Discussion
In this paper we present high-quality near-infrared spectroscopic observations of a bright quasar, J0252–0503, to constrain the cosmic reionization with quasar damping wing modeling and the SMBH growth with BH mass and Eddington ratio measurements.
We measure the mass of the central SMBH to be based on the single-epoch virial method. The Eddington ratio of J0252–0503 is measured to be , slightly lower than that of the other three quasars with similar luminosities. If J0252–0503 has been accreting at such Eddington ratio since with a radiative efficiency of 10%, it would require a seed BH of , which significantly exceeds the predicted mass range from stellar remnant BHs and requires more exotic seed formation mechanisms like direct collapse BHs. J0252–0503, along with the other three luminous quasars hosting billion solar-mass SMBHs, places the strongest constraints on early BH assembly mechanisms.
In order to investigate whether a damping wing is present in the spectrum of J0252–0503, we explored two different methods to construct the intrinsic spectrum of J0252–0503. The Ly region of a composite spectrum computed from a sample of C iv blueshift-matched low redshift quasar analogs is consistent with the prediction made by a PCA non-parametric predictive approach. Both methods suggest that a strong damping wing absorption is present in the J0252–0503 spectrum. We modeled the damping wing profile produced by either a single component DLA system or a significantly neutral IGM. However, there is no significant detection of metals at the potential DLA system redshift over a wide range of , suggesting that the strong damping wing in the J0252–0503 spectrum is most likely imprinted by a significantly neutral IGM unless the metallicity of the putative DLA is more than 10,000 times lower than the solar metallicity.
To constrain the IGM neutral hydrogen fraction, , at with the damping wing in J0252–0503, we applied the hybrid model developed by Davies et al. (2018b) to our PCA continuum prediction for J0252–0503. Our analysis shows that the damping wing in J0252–0503 is the strongest one yet seen in quasar spectra. By marginalizing over quasar lifetime with a log-uniform prior in the range of yr, we measure the median and the central 68% (95%) confidence interval for to be at .
Despite the limited precision of quasar continuum reconstructions and the degeneracy of and quasar lifetime, the damping wing is still highly effective in constraining the reionization history. Although the currently available sample of quasar sight-lines at is very small, more luminous quasars are expected to be found in the next few years through ongoing quasar searches (e.g. Bañados et al., 2018; Wang et al., 2018; Yang et al., 2019; Matsuoka et al., 2019a; Reed et al., 2019). Moreover, the Euclid wide survey will be online soon, and will discover more than 100 quasars at (Euclid Collaboration et al., 2019). In addition, the Near-Infrared Spectrograph (NIRSpec) on the James Webb Space Telescope (JWST) will provide much higher quality spectroscopic data for more precise quasar damping wing analyses. Thus, we expect that quasar damping wing analyses will have the capability to place increasingly strong constraints on the cosmic reionization history during the next several years.
References
- Astropy Collaboration et al. (2013) Astropy Collaboration, Robitaille, T. P., Tollerud, E. J., et al. 2013, A&A, 558, A33
- Abbott et al. (2018) Abbott, T. M. C., Abdalla, F. B., Allam, S., et al. 2018, ApJS, 239, 18
- Almgren et al. (2013) Almgren, A. S., Bell, J. B., Lijewski, M. J., Lukić, Z., & Van Andel, E. 2013, ApJ, 765, 39
- Bañados et al. (2019) Bañados, E., Rauch, M., Decarli, R., et al. 2019, ApJ, 885, 59
- Bañados et al. (2018) Bañados, E., Venemans, B. P., Mazzucchelli, C., et al. 2018, Nature, 553, 473
- Bañados et al. (2016) Bañados, E., Venemans, B. P., Decarli, R., et al. 2016, ApJS, 227, 11
- Becker et al. (2015) Becker, G. D., Bolton, J. S., Madau, P., et al. 2015, MNRAS, 447, 3402
- Betoule et al. (2014) Betoule, M., Kessler, R., Guy, J., et al. 2014, A&A, 568, A22
- Bolton et al. (2011) Bolton, J. S., Haehnelt, M. G., Warren, S. J., et al. 2011, MNRAS, 416, L70
- Bosman & Becker (2015) Bosman, S. E. I., & Becker, G. D. 2015, MNRAS, 452, 1105
- Bosman et al. (2018) Bosman, S. E. I., Fan, X., Jiang, L., et al. 2018, MNRAS, 479, 1055
- Clough et al. (2005) Clough, S. A., Shephard, M. W., Mlawer, E. J., et al. 2005, J. Quant. Spec. Radiat. Transf., 91, 233
- Coatman et al. (2016) Coatman, L., Hewett, P. C., Banerji, M., & Richards, G. T. 2016, MNRAS, 461, 647
- Cooke et al. (2011) Cooke, R., Pettini, M., Steidel, C. C., et al. 2011, MNRAS, 417, 1534
- Cooper et al. (2019) Cooper, T. J., Simcoe, R. A., Cooksey, K. L., et al. 2019, ApJ, 882, 77
- Crighton et al. (2015) Crighton, N. H. M., Murphy, M. T., Prochaska, J. X., et al. 2015, MNRAS, 452, 217
- D’Aloisio et al. (2020) D’Aloisio, A., McQuinn, M., Trac, H., et al. 2020, arXiv e-prints, arXiv:2002.02467
- Davies et al. (2018a) Davies, F. B., Becker, G. D., & Furlanetto, S. R. 2018a, ApJ, 860, 155
- Davies et al. (2016) Davies, F. B., Furlanetto, S. R., & McQuinn, M. 2016, MNRAS, 457, 3006
- Davies et al. (2018b) Davies, F. B., Hennawi, J. F., Bañados, E., et al. 2018b, ApJ, 864, 142
- Davies et al. (2018c) Davies, F. B., Hennawi, J. F., Bañados, E., et al. 2018c, ApJ, 864, 143
- Davies (2020) Davies, F. B. 2020, MNRAS, doi:10.1093/mnras/staa528
- Davies et al. (2019) Davies, F. B., Hennawi, J. F., & Eilers, A.-C. 2019, arXiv e-prints, arXiv:1906.10130
- Decarli et al. (2018) Decarli, R., Walter, F., Venemans, B. P., et al. 2018, ApJ, 854, 97
- De Rosa et al. (2014) De Rosa, G., Venemans, B. P., Decarli, R., et al. 2014, ApJ, 790, 145
- D’Odorico et al. (2018) D’Odorico, V., Feruglio, C., Ferrara, A., et al. 2018, ApJ, 863, L29
- Draine (2011) Draine, B. T. 2011, Physics of the Interstellar and Intergalactic Medium by Bruce T. Draine. Princeton University Press
- Ďurovčíková et al. (2019) Ďurovčíková, D., Katz, H., Bosman, S. E. I., et al. 2019, arXiv e-prints, arXiv:1912.01050
- Eilers et al. (2018) Eilers, A.-C., Davies, F. B., & Hennawi, J. F. 2018, ApJ, 864, 53
- Eilers et al. (2019) Eilers, A.-C., Hennawi, J. F., Davies, F. B., et al. 2019, ApJ, 881, 23
- Euclid Collaboration et al. (2019) Euclid Collaboration, Barnett, R., Warren, S. J., et al. 2019, arXiv:1908.04310
- Fan et al. (2001) Fan, X., Narayanan, V. K., Lupton, R. H., et al. 2001, AJ, 122, 2833
- Fan et al. (2006) Fan, X., Strauss, M. A., Becker, R. H., et al. 2006, AJ, 132, 117
- Farina et al. (2019) Farina, E. P., Arrigoni-Battaia, F., Costa, T., et al. 2019, ApJ, 887, 196
- Foreman-Mackey et al. (2013) Foreman-Mackey, D., Hogg, D. W., Lang, D., et al. 2013, PASP, 125, 306
- Greig et al. (2019) Greig, B., Mesinger, A., & Bañados, E. 2019, MNRAS, 484, 5094
- Greig et al. (2017) Greig, B., Mesinger, A., Haiman, Z., & Simcoe, R. A. 2017, MNRAS, 466, 4239
- Greiner et al. (2009) Greiner, J., Krühler, T., Fynbo, J. P. U., et al. 2009, ApJ, 693, 1610
- Hook et al. (2004) Hook, I. M., Jørgensen, I., Allington-Smith, J. R., et al. 2004, PASP, 116, 425
- Horne (1986) Horne, K. 1986, PASP, 98, 609
- Hunter (2007) Hunter, J. D. 2007, Computing in Science and Engineering, 9, 90
- Irwin et al. (2004) Irwin, M. J., Lewis, J., Hodgkin, S., et al. 2004, Proc. SPIE, 5493, 411
- Jiang et al. (2016) Jiang, L., McGreer, I. D., Fan, X., et al. 2016, ApJ, 833, 222
- Kashikawa et al. (2006) Kashikawa, N., Shimasaku, K., Malkan, M. A., et al. 2006, ApJ, 648, 7
- Keating et al. (2020) Keating, L. C., Weinberger, L. H., Kulkarni, G., et al. 2020, MNRAS, 491, 1736
- Konno et al. (2018) Konno, A., Ouchi, M., Shibuya, T., et al. 2018, PASJ, 70, S16
- Kulkarni et al. (2019) Kulkarni, G., Keating, L. C., Haehnelt, M. G., et al. 2019, MNRAS, 485, L24
- Lang (2014) Lang, D. 2014, AJ, 147, 108
- Lodders (2003) Lodders, K. 2003, ApJ, 591, 1220
- Lukić et al. (2015) Lukić, Z., Stark, C. W., Nugent, P., et al. 2015, MNRAS, 446, 3697
- Mason et al. (2018) Mason, C. A., Treu, T., Dijkstra, M., et al. 2018, ApJ, 856, 2
- Matsuoka et al. (2016) Matsuoka, Y., Onoue, M., Kashikawa, N., et al. 2016, ApJ, 828, 26
- Matsuoka et al. (2019a) Matsuoka, Y., Onoue, M., Kashikawa, N., et al. 2019, ApJ, 872, L2
- Matsuoka et al. (2019b) Matsuoka, Y., Iwasawa, K., Onoue, M., et al. 2019, arXiv:1908.07910
- Mazzucchelli et al. (2017) Mazzucchelli, C., Bañados, E., Venemans, B. P., et al. 2017, ApJ, 849, 91
- McGreer et al. (2015) McGreer, I. D., Mesinger, A., & D’Odorico, V. 2015, MNRAS, 447, 499
- McQuinn et al. (2011) McQuinn, M., Hernquist, L., Lidz, A., et al. 2011, MNRAS, 415, 977
- Mesinger et al. (2011) Mesinger, A., Furlanetto, S., & Cen, R. 2011, MNRAS, 411, 955
- Miralda-Escudé (1998) Miralda-Escudé, J. 1998, ApJ, 501, 15
- Mortlock et al. (2011) Mortlock, D. J., Warren, S. J., Venemans, B. P., et al. 2011, Nature, 474, 616
- Ouchi et al. (2010) Ouchi, M., Shimasaku, K., Furusawa, H., et al. 2010, ApJ, 723, 869
- Pâris et al. (2018) Pâris, I., Petitjean, P., Aubourg, É., et al. 2018, A&A, 613, A51
- Pâris et al. (2011) Pâris, I., Petitjean, P., Rollinde, E., et al. 2011, A&A, 530, A50
- Pâris et al. (2017) Pâris, I., Petitjean, P., Ross, N. P., et al. 2017, A&A, 597, A79
- Pezzulli et al. (2016) Pezzulli, E., Valiante, R., & Schneider, R. 2016, MNRAS, 458, 3047
- Planck Collaboration et al. (2018) Planck Collaboration, Aghanim, N., Akrami, Y., et al. 2018, arXiv:1807.06209
- Prochaska et al. (2019) Prochaska, J. X., Hennawi, J., Cooke, R., et al. 2019, pypeit/PypeIt: Releasing for DOI, 0.11.0.1, Zenodo, doi:10.5281/zenodo.3506873
- Reed et al. (2017) Reed, S. L., McMahon, R. G., Martini, P., et al. 2017, MNRAS, 468, 4702
- Reed et al. (2019) Reed, S. L., Banerji, M., Becker, G. D., et al. 2019, MNRAS, 487, 1874
- Richards et al. (2011) Richards, G. T., Kruczek, N. E., Gallagher, S. C., et al. 2011, AJ, 141, 167
- Robertson et al. (2015) Robertson, B. E., Ellis, R. S., Furlanetto, S. R., et al. 2015, ApJ, 802, L19
- Schlegel et al. (1998) Schlegel, D. J., Finkbeiner, D. P., & Davis, M. 1998, ApJ, 500, 525
- Simcoe et al. (2012) Simcoe, R. A., Sullivan, P. W., Cooksey, K. L., et al. 2012, Nature, 492, 79
- Shen (2013) Shen, Y. 2013, Bulletin of the Astronomical Society of India, 41, 61
- Shen et al. (2011) Shen, Y., Richards, G. T., Strauss, M. A., et al. 2011, ApJS, 194, 45
- Shen et al. (2019) Shen, Y., Wu, J., Jiang, L., et al. 2019, ApJ, 873, 35
- Suzuki et al. (2005) Suzuki, N., Tytler, D., Kirkman, D., et al. 2005, ApJ, 618, 592
- Totani et al. (2016) Totani, T., Aoki, K., Hattori, T., & Kawai, N. 2016, PASJ, 68, 15
- Totani et al. (2006) Totani, T., Kawai, N., Kosugi, G., et al. 2006, PASJ, 58, 485
- Tsuzuki et al. (2006) Tsuzuki, Y., Kawara, K., Yoshii, Y., et al. 2006, ApJ, 650, 57
- Venemans et al. (2015) Venemans, B. P., Bañados, E., Decarli, R., et al. 2015, ApJ, 801, L11
- Venemans et al. (2016) Venemans, B. P., Walter, F., Zschaechner, L., et al. 2016, ApJ, 816, 37
- Vestergaard & Osmer (2009) Vestergaard, M., & Osmer, P. S. 2009, ApJ, 699, 800
- Vestergaard & Wilkes (2001) Vestergaard, M., & Wilkes, B. J. 2001, ApJS, 134, 1
- Volonteri & Rees (2006) Volonteri, M., & Rees, M. J. 2006, ApJ, 650, 669
- Wang et al. (2017) Wang, F., Fan, X., Yang, J., et al. 2017, ApJ, 839, 27
- Wang et al. (2016) Wang, F., Wu, X.-B., Fan, X., et al. 2016, ApJ, 819, 24
- Wang et al. (2018) Wang, F., Yang, J., Fan, X., et al. 2018, ApJ, 869, L9
- Wang et al. (2019) Wang, F., Yang, J., Fan, X., et al. 2019, ApJ, 884, 30
- Willott et al. (2010) Willott, C. J., Delorme, P., Reylé, C., et al. 2010, AJ, 139, 906
- Wilson et al. (2004) Wilson, J. C., Henderson, C. P., Herter, T. L., et al. 2004, Proc. SPIE, 5492, 1295
- Wise et al. (2019) Wise, J. H., Regan, J. A., O’Shea, B. W., et al. 2019, Nature, 566, 85
- Wu et al. (2015) Wu, X.-B., Wang, F., Fan, X., et al. 2015, Nature, 518, 512
- Yang et al. (2019) Yang, J., Wang, F., Fan, X., et al. 2019, AJ, 157, 236
- Yang et al. (2020) Yang, J., Wang, F., Fan, X., et al. 2020, to be submitted