Vortex-lattice melting and paramagnetic depairing in the nematic superconductor FeSe
Abstract
The full phase diagram in the nematic superconductor FeSe is mapped out using specific-heat and thermal-expansion measurements down to 0.7 K and up to 30 T for both field directions. A clear thermodynamic signal of an underlying vortex-melting transition is found in both datasets and could be followed down to low temperatures. The existence of significant Gaussian thermal superconducting fluctuations is demonstrated by a scaling analysis, which also yields the mean-field upper critical field (T). For both field orientations, (T) shows Pauli-limiting behavior. Whereas the temperature dependence of the vortex-melting line is well described by the model of Houghton et al., Phys. Rev. B 40, 6763 (1989) down to the lowest temperatures for H FeSe layers, the vortex-melting line exhibits an unusual behavior for fields parallel to the planes, where the Pauli limitation is much stronger. Here, the vortex-melting anomaly is only observed down to T∗ K, and then merges with the (T) line as predicted by Adachi and Ikeda, Phys. Rev. B 68 184510 (2003). Below T∗, Hc2(T) also exhibits a slight upturn possibly related to the occurence of a Fulde-Ferrell-Larkin-Ovchinnikov (FFLO) state.
pacs:
74.25.F, 74.45.+c, 74.70.TxI Introduction
In 1957 Abrikosov Abrikosov (1957) predicted that a magnetic field can penetrate a superconductor as an array of vortices, each carrying a magnetic flux quantum . This occurs in type-II superconductors in which the normal-superconducting surface energy is negative, i.e. when the Ginzburg-Landau parameter , the ratio of the London penetration depth to the coherence length , exceeds the threshold value . de Gennes (1999) Vortices repel each other and typically crystallize into a hexagonal lattice. In the presence of weak and randomly distributed disorder, e.g. point defects, Larkin and Ovchinnikov (1970, 1974, 1979) this long-range periodicity is lost and a new (dislocation-free) state of matter, still displaying well defined diffraction peaks - the so-called ’Bragg glass’ - is formed Giamarchi and Le Doussal (1994, 1997).
In increasing magnetic field, the density of vortices increases until they overlap at the upper critical field (T) where superconductivity disappears at a second-order phase transition de Gennes (1999); Saint-James et al. (1969). However, thermally induced and/or static disorder can lead to a melting of the vortex solid well below the upper critical field (T) (for reviews see Refs Blatter et al., 1994a; Brandt, 1995; Fisher et al., 2007).
This possibility has been first considered by Eilenberger Eilenberger (1967), but attempts to observe it in low-dimension geometries, to enhance thermal fluctuations, remained unsuccessful Huberman and Doniach (1979); Fisher (1980). Unequivocal thermodynamic evidence of a genuine vortex-lattice melting transition finally came out soon after the discovery of the cuprate superconductors, in which thermal fluctuations are greatly enhanced due to their high , very short coherence length and large anisotropy. In a very limited number of exceptionally high-quality single crystals, vortex melting manifests as a tiny discontinuity in the reversible magnetization Zeldov et al. (1995); Welp et al. (1996); Liang et al. (1996); Nishizaki et al. (1996), while specific-heat Schilling et al. (1996, 1997, 1998); Roulin et al. (1995a, 1996, 1998a); Revaz et al. (1998); Bouquet et al. (2001) and thermal-expansion Lortz et al. (2003a) measurements exhibit a peak superimposed on a step indicative of the additional degrees of freedom in the high-temperature vortex-liquid phase. This first-order transition represents the only genuine phase transition for superconductivity in a magnetic field, since becomes a broad crossover. Since then calorimetric features related to melting were also reported for conventional low- superconductors e.g. Nb3Sn, SnMo6S8 and for Fe-based superconductors Lortz et al. (2006); Petrović et al. (2009); Mak et al. (2013); Koshelev et al. (2019). However, the fate of the melting transition for remains unclear since the low-temperature/high-field region is usually inaccessible, as in cuprates due to the high values of Hc2(0), or because residual disorder disrupts the melting transition Bouquet et al. (2001). Theoretically, the melting line for T 0 may i) be suppressed due to quantum fluctuations Blatter and Ivlev (1993); Blatter et al. (1994b); Blatter and Ivlev (1994), or ii) merge with Hc2(T) or iii) even disappear at finite temperature in strongly Pauli-limited superconductors Adachi and Ikeda (2003).
The Zeeman effect represents another mechanism which can affect the high-field superconducting phase transitions, and intense research efforts in low- unconventional superconductors including organics, ruthenates and heavy fermion, have focused on the emergence of high-field phases where this effect is dominant (also referred to as strongly Pauli-limited superconductors). Prominent examples are -(BEDT-TTF)2Cu(NCS)2 Lortz et al. (2007a) and CeCoIn5 Bianchi et al. (2003); Matsuda and Shimahara (2007), which exhibit thermodynamic evidence of a modulated phase having Cooper pairs with nonzero total momentum and a spatially non-uniform order parameter Fulde and Ferrell (1964); Larkin and N. (1965). While for the former the high-field phase appears to be a physical realization of the original Fulde-Ferrell-Larkin-Ovchinnikov state (FFLO) Lortz et al. (2007b); Wosnitza (2018), the modulated phase in CeCoIn5 is believed to result from a particular coupling between d-wave superconductivity and a field-induced incommensurate spin-density wave (SDW) Kenzelmann et al. (2008, 2010); Kumagai et al. (2011).
The recently discovered Fe-based superconductors offer another interesting platform for the study of vortex matter. As anticipated theoretically Murray and Tešanović (2010), thermal fluctuations of intermediate magnitude between cuprates and conventional materials, accompanied by a clear vortex-melting anomaly, were highlighted in the 122 and 1144 families via high-resolution thermodynamic measurements Mak et al. (2013); Hou et al. (2015); Koshelev et al. (2019). In parallel, a first-order superconducting transition detected in the magnetostriction of KFe2As2 stressed the relevance of Zeeman depairing in these materials and raised the possibility of observing a FFLO phase Burger et al. (2013); Zocco et al. (2013); Cho et al. (2017).
Among the Fe-based materials, FeSe has attracted considerable interest as superconductivity emerges deep inside a non-magnetic but electronic nematic phase that breaks 4-fold rotational symmetry below = 90 K Böhmer and Kreisel (2017); Coldea and Watson (2018). Superconductivity is argued to arise from a spin-nematic pairing driven by orbital-selective spin fluctuations Sprau et al. (2017); Rhodes et al. (2018); Kreisel et al. (2017); Kang et al. (2018); Benfatto et al. (2018); Cercellier et al. (2019). Despite its low K, FeSe can be considered as a high-Tc superconductor because of its very low carrier densityTerashima et al. (2014); Yang et al. (2017) and Kasahara et al. Kasahara et al. (2014) have argued that it lies deep inside the Bardeen-Cooper-Schrieffer/Bose-Einstein-Condensate (BCS/BEC) crossover. In this context, the same authors have claimed i) that a field-induced phase transition of the Fermi liquid with strong spin imbalance occurs for within the superconducting state at a field at which the Zeeman energy becomes comparable to Kasahara et al. (2014); Watashige et al. (2017) and ii) that a genuine FFLO phase is observed for Kasahara et al. (2019). Thus, both thermal fluctuations and paramagnetic effects are expected to be large in this high- superconductor. The moderate value of < 30 T offers a unique opportunity to study the phase diagram down to the lowest temperatures in clean single crystals.
In this Article, using thermodynamic probes on high-quality FeSe single crystals, we demonstrate the existence of sizable field-induced Gaussian superconducting fluctuations using a scaling approach and provide compelling thermodynamic evidence of the existence of an underlying vortex-melting transition. Our analysis of these data also clearly reveals that Pauli depairing exerts a large influence on the vortex-melting properties in high magnetic fields, in particular for FeSe layers. Here we find that the vortex-liquid phase disappears for T 3 K, i.e. below which the vortex-melting line merges with the (T) line. Interestingly, such a merging is predicted by mean-field theory Adachi and Ikeda (2003). Here, it occurs near the expected tricritical point from which the FFLO phase could emerge in very clean single crystals Brison et al. (1997). Finally, our results exclude that FeSe lies within the BCS/BEC crossover, and we find no thermodynamic signature of the reported high-field phase for FeSe layers Kasahara et al. (2014); Watashige et al. (2017); Kasahara et al. (2019).
This Article is organized as follows. In Sec. II, the experimental methods (crystal growth and specific-heat and thermal-expansion measurements) are explained in detail. In Sec. III, we present our raw specific-heat and thermal-expansion data, which already provide clear evidence for the existence of both large superconducting fluctuations and a vortex-melting transition. Scaling analysis of our thermodynamic data is presented in Sec. IV and the resulting phase diagram is analyzed thoroughly using existing models of the mixed state. The possible occurence of the FFLO state is discussed and a consistent check of our analysis is provided. Conclusions are given in Sec. V.
II Experimental methods
Stoichiometric single crystals of FeSe were synthesized by chemical vapor transport using a eutectic mixture of KCl and AlCl3 and characterized using single-crystal x-ray diffraction. Samples 1 and 2, used in this work, were taken from batches 2 and 5 of Ref. Hardy et al., 2019, respectively.
Specific-heat measurements were performed on Sample 1 up to 30 T and down to 0.6 K using a home-made miniature AC calorimeter. It consists of a bare Cernox chip from Lakeshore Cryotronics Inc. split in two parts and suspended to a small copper ring with PtW() wires. One part is used as an electrical heater while the other part is employed to record the temperature oscillations (a few % of the average sample temperature in the range 1-10 Hz , see Ref. Michon et al., 2019 for further details). A precise in-situ calibration and corrections for the thermometer magnetoresistance were accounted for in the data analysis. This setup allows to measure the specific heat of minute samples with an accuracy better than , inferred from measurements on 6N copper, with a signal/noise ratio of about . High-resolution thermal-expansion measurements were carried out on Sample 2 using a home-built capacitance dilatometer Meingast et al. (1990) with a typical relative resolution 10-8-10-10 in fields up to 10 T.
III Experimental results
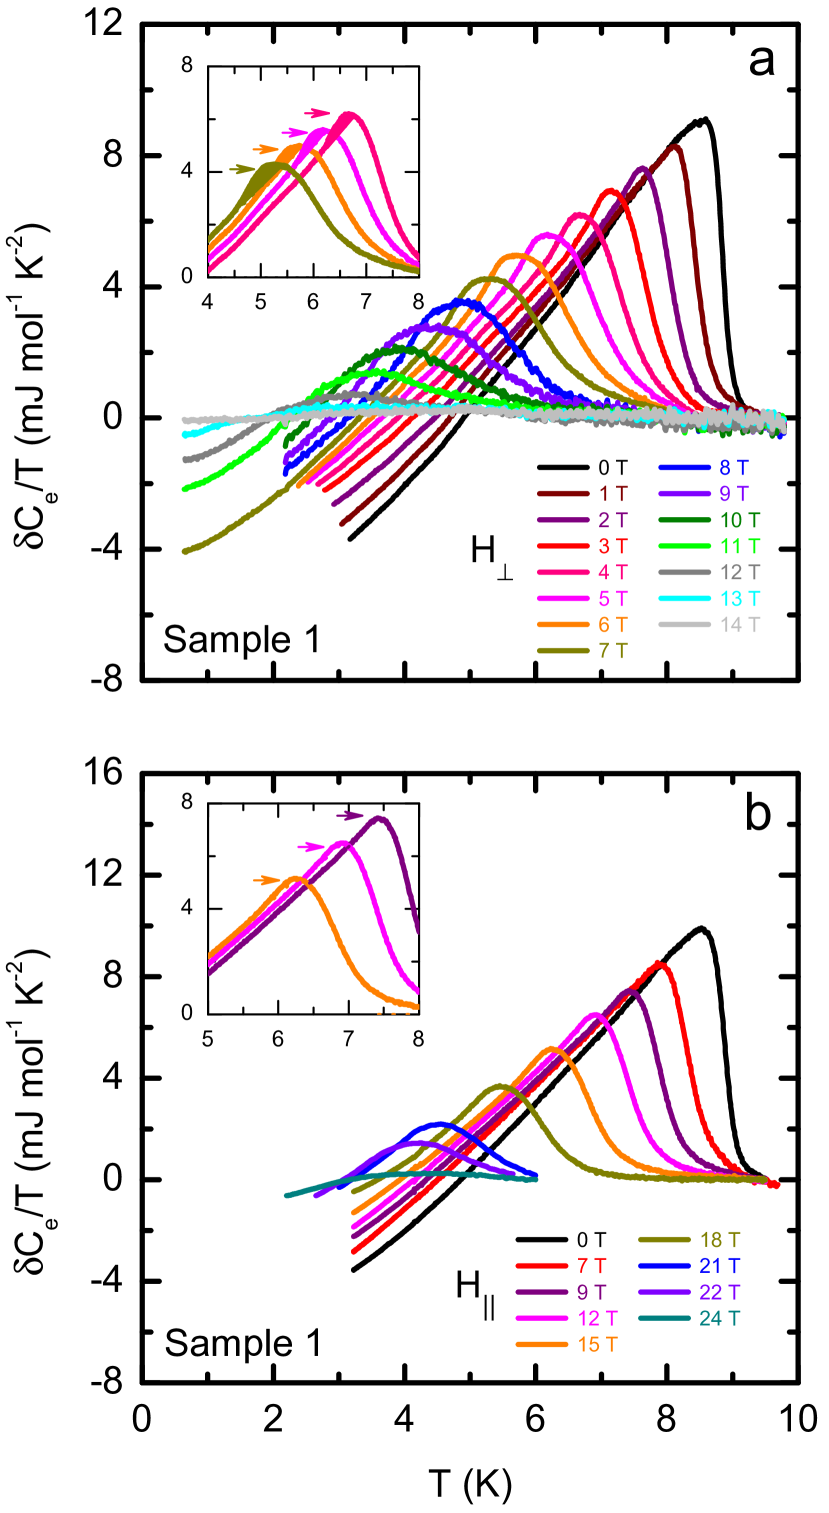
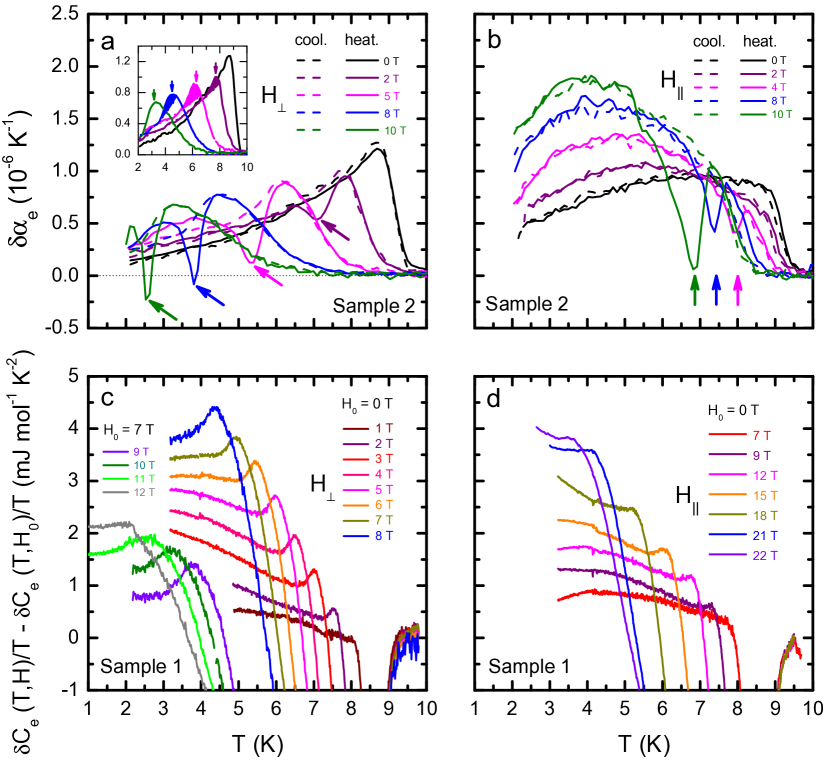
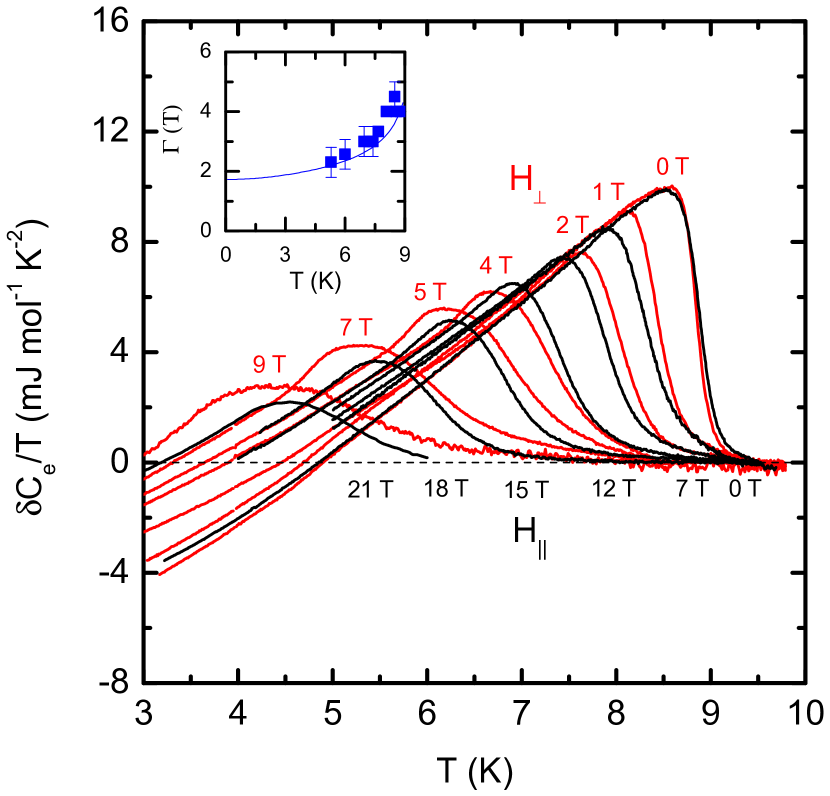
Figs 1(a)-(b) display the temperature dependence of , the difference between the superconducting- and the nematic-state specific heats, for magnetic fields applied perpendicular () and parallel () to the FeSe layers, respectively. Here, was determined by fitting the 18 T-data where superconductivity is fully suppressed down to 0.5 K. The inferred values of the Sommerfeld coefficient and the Debye term amount to = 6.5 mJ mol-1 K-2 and = 0.4 mJ mol-1 K-4, respectively, in good agreement with previous reports Hardy et al. (2019); Sun et al. (2017). Figs 2(a)-(b) display the corresponding in-plane thermal expansion measured upon heating (solid line) after cooling in a magnetic field (dashed line). Here, the normal-state contribution was determined by fitting the 10 T-data for 10 K.
A well-defined discontinuity is observed in the zero-field specific heat at Tc = 8.9 K, with a width of about 1 K related to disorder (twin boundaries and/or a very small number of Fe vacancies Watashige et al. (2015); Jiao et al. (2017)) indicating the transition from the nematic to the superconducting state. A similar anomaly of comparable width, but with a slightly higher = 9.1 K, is found in our thermal-expansion data. We note that the anomaly is very mean-field-like, in the weak coupling limit, i.e. at odds with the transition expected in the 3d-XY universality class for an interacting Bose-Einstein condensate Schneider and Singer (2000), which superfluid 4He belongs to. This rules out that FeSe actually lies deep within the BCS/BEC crossover for which a cusp-like anomaly is expected. For an exhaustive discussion of the BCS/BEC crossover in a two-band model, we refer to Ref. Chubukov et al., 2016, and in the context of high-temperature superconductivity to Ref. Chen et al., 2005; Schneider and Singer, 2000.
III.1 Large superconducting fluctuations
The strength of thermal fluctuations is usually quantified by the Ginzburg number Blatter et al. (1994a); Brandt (1995) given by
| (1) |
where , and are the respective Ginzburg-Landau values of the in-plane coherence length, thermodynamic critical field and anisotropy expressed in SI units. These can all be inferred from our thermodynamic data. Here = 0.21 T and = 3.5 nm are calculated from the zero-field specific heat and the initial slope of (see Sec. IV.2.1), respectively. is inferred from Fig. 6 where we find that the specific-heat curve for T matches that of T. We obtain for FeSe, which is several orders of magnitude larger than in classical superconductors, e.g. Nb ( 10-11), but slightly lower than in cuprate superconductors (10-1 < < 10-3) Koshelev et al. (2019). This large value of strongly suggests that thermal fluctuations cannot be neglected in FeSe.
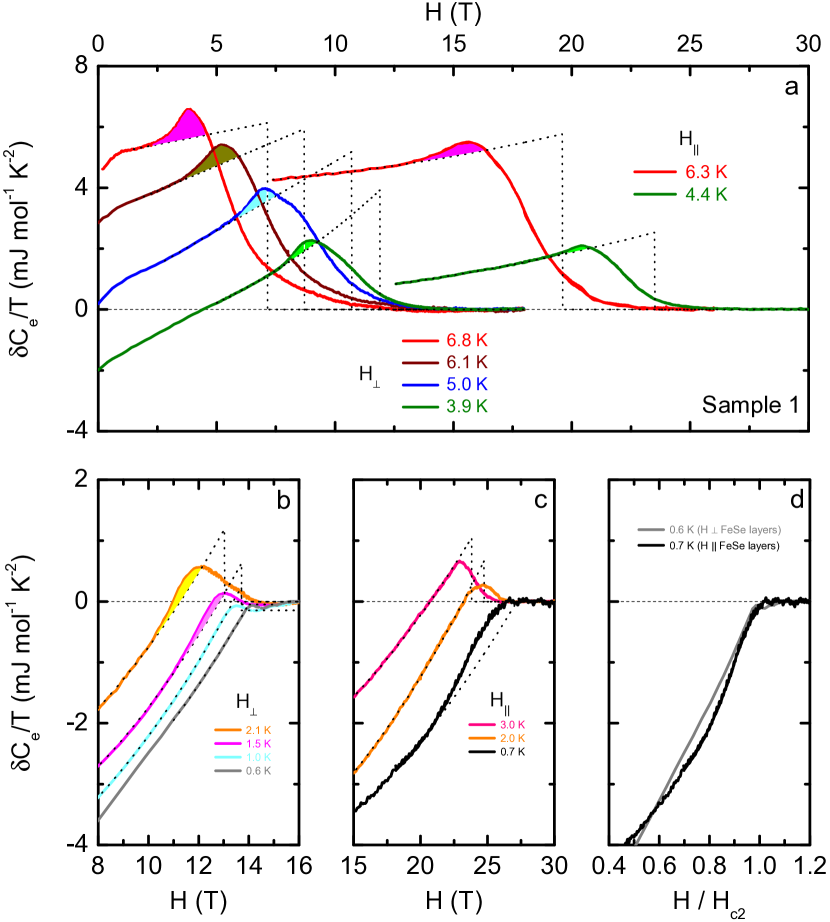
A telltale sign of thermal fluctuations is a broadening of the superconducting transition in magnetic field Farrant and E. (1975); Lortz et al. (2003b, 2006). As shown in Figs 1 and 2(a)-(b), a significant broadening of the superconducting transition for both field directions in both measurements is observed. This becomes particularly evident for 2 T and 7 T, where the broadening clearly exceeds the intrinsic transition width. Evidence for large fluctuations are also quite prominent in the field-sweep measurements displayed in Fig 3(a), e.g. for T 6.8 K where the transition to the normal state extends over several Teslas for both field orientations. A quantitative analysis of this broadening is obtained by the scaling analysis presented in Sec. IV.1. As expected for thermally induced fluctuations, this broadening finally reduces progressively with decreasing temperatures for 3 K (see Figs. 3(b)-(c)).
III.2 Evidence for an underlying vortex-melting transition
Beside this large broadening of the transition, a small anomaly is clearly resolved on the upward side of the heat capacity anomaly, particularly for 2 T and 12 T (see shaded area in the insets of Figs 1 and 2(a)). To make this feature more visible and to facilitate comparison with other superconductors, we have subtracted the = 0 T (resp. = 7 T) data from those obtained for 8 T (resp. 8 T), as illustrated in Figs 2(c)-(d). The broad remaining discontinuity is very reminiscent of the vortex melting transition (H) initially reported by Roulin et al. Roulin et al. (1996) on twinned YBa2Cu3O6.94 single crystals and more recently in Ba0.5K0.5Fe2As2 Mak et al. (2013) and RbEuFe4As4 Koshelev et al. (2019). It was interpreted as a second-order melting transition between a vortex glass and a vortex liquid Roulin et al. (1998b). A clear signature of vortex melting is also visible in the -sweep measurements where specific heat in excess (shaded areas in Fig. 3) is detected for both field orientations. Interestingly, this melting anomaly, which represents the only genuine phase transition in a hard type II superconductor with strong fluctuations, is clearly less pronounced for FeSe layers. Indeed it is only observed in the range 7 21 T (see Figs 2(d) and 3(c) and no melting anomaly could be detected below K (see Fig. 3(c)) where only a broadened mean-field feature persists which in turn vanishes for K.
Additional evidence for the existence of an underlying vortex-melting transition is obtained from thermal-expansion measurements, which have proven to be a very sensitive and complimentary probe of the vortex matter Lortz et al. (2003a); Mak et al. (2013). As shown in the heating curves (after field-cooling) of Figs 2(a)-(b), extra peaks that grow in magnitude with increasing field, are detected slightly below the broadened superconducting transition, at positions which coincide rather well with defined as the mid-point of the broadened discontinuity in specific-heat measurements. Their absence in the cooling curves reveals that they are not electronic in origin, but rather related to irreversible magnetostrictive effects at the melting/irreversibility line due to flux pinning. Similar irreversible peaks were already observed at the melting transition of both YBa2Cu3O7-δ Lortz et al. (2003b) and Ba0.5K0.5Fe2As2 Mak et al. (2013) crystals with weak flux pinning. Lortz et al. Lortz et al. (2007b); Mak et al. (2013) argued that they are caused by flux gradients that yield non-equilibrium screening currents which form during cooling and suddenly vanish at the melting temperature upon heating. The applied field exerts a force on these currents which is transferred to the crystal lattice via the pinning centers. These types of anomaly in the cuprates were found to exhibit a behavior comparable to a kinetic glass transition and are most likely related to some glassy vortex phase Lortz et al. (2007b); Lortz and Meingast (2002), whose phase line however corresponds rather well to the first-order melting line in fully reversible crystals.
IV Discussion
IV.1 Scaling of the specific heat and thermal expansion
A natural way to study thermal fluctuations is to examine the predicted scaling behavior of the specific heat. The same scaling relations apply to the reversible thermal expansion which is closely related to the specific heat through the Ehrenfest or Pippard relations Pippard (1966).
| (nm) | (T) | (T) | |||||
|---|---|---|---|---|---|---|---|
| 3.5 | 4.5 | 94 | 5 10-4 | 20 | 26.5 | 1.0 | |
| 0.8 | 4.5 | 420 | 5 10-4 | 90 | 29 | 4.4 |
In optimally-doped YBCO, thermal-expansion measurements have demonstrated the existence of 3d-XY fluctuations over a 10 K interval around Pasler et al. (1998); Meingast et al. (2001) and their persistence in field up to 11 T without phonon-background subtraction Lortz et al. (2003b).For comparison, analysis of calorimetric data were inconclusive mainly because the fluctuation component represents at most 5 % of the large phonon contribution Inderhees et al. (1991); Schnelle et al. (1993); Overend et al. (1994); Breit et al. (1995); Junod et al. (1994); Roulin et al. (1995b); Pierson et al. (1995, 1996, 1998); Jeandupeux et al. (1996); Junod et al. (2000). In FeSe, the phonon subtraction is straightforward because is low and superconductivity is fully suppressed for 16 T. However, an analysis in zero field is impossible since the intrinsic transition width 1 K clearly exceeds the width of the critical region 4 mK. On the other hand, in this critical XY regime, the field introduces an additional length scale which reduces the effective dimensionality Lortz et al. (2003b); Schneider and Singer (2000) leading to a broadening of the transition. According to Jeandupeux et al. Jeandupeux et al. (1996), the magnetic field breaks the XY symmetry if the correlation length exceeds ( = 0.669 is the XY critical exponent and ). Thus, fluctuations are expected to be observed only for . Using 3 T K-1 in FeSe (see Sec. IV.2.1) we obtain 2 mT clearly indicating that this regime can be neglected. Thus we restrict our analysis to the 3d Lowest Landau Level (3d-LLL) framework Larkin and Varlamov (2005).
In this model, the broadening of the transition is enhanced in field by Larkin and Varlamov (2005). It is applicable if the field is high enough to confine the Cooper pairs in their lowest Landau level, i.e for 10 mT for FeSe layers. In the vicinity of the mean-field transition temperature , Thouless Thouless (1975) has shown that normalized by , i.e. the difference in heat capacities expected from mean-field theory, is a universal function of the single scaling variable
| (2) |
It measures the temperature shift with respect to normalized by the fluctuation broadening Koshelev et al. (2019) and
| (3) |
is a temperature- and field-independent constant.
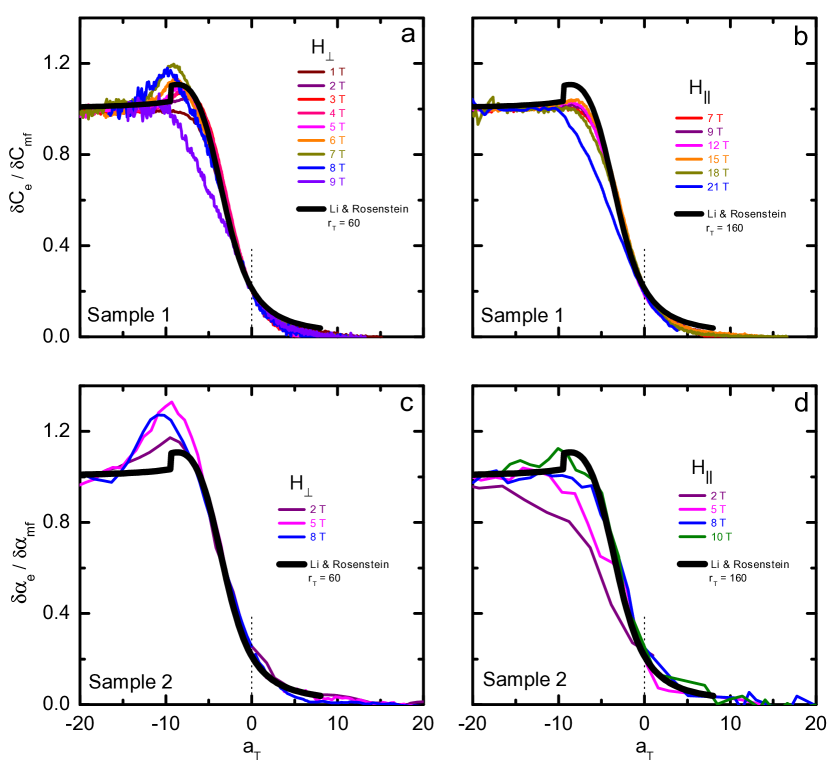
In Ginzburg-Landau theory, is temperature independent. However, similar to Nb Farrant and E. (1975), has a sizable temperature variation in the transition region as illustrated in Fig. 1. Therefore, we have normalized our measurements to rather than the mean-field discontinuity since we are only concerned with that part of the temperature dependence ascribed to fluctuations Farrant and E. (1975). Here, we have determined for each field by fitting the data of Fig. 1 to a second-order polynomials for and have extrapolated it through the transition region. The same procedure is employed to evaluate for the cooling curves of Sample 2.
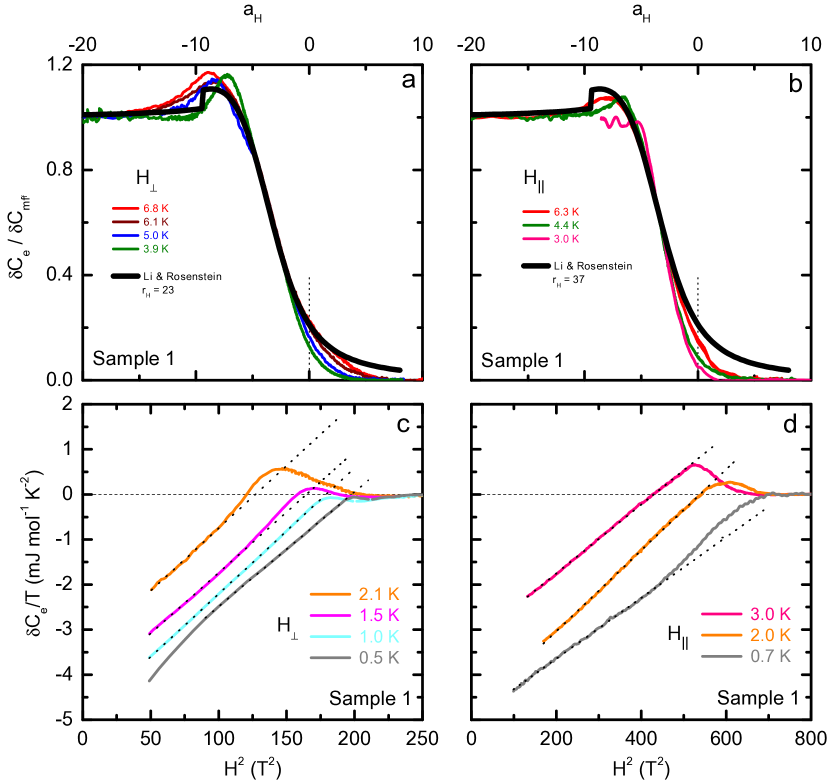
In Fig. 4, we compare our scaled specific-heat data to the calculations of Li and Rosenstein Li and Rosenstein (2001a, b, 2003, 2004); Rosenstein and Li (2010) (thick solid line) who successfully derived an analytical expression of the 3d-LLL scaling function for , which includes the expected contributions from vortex melting. This expression was found to describe the broadening of the calorimetric transitions and the melting discontinuity in RbEuFe4As4 Koshelev et al. (2019) extremely well. An excellent agreement with the Li-Rosenstein calculation is also achieved in both our specific-heat and thermal-expansion data for a large range of field with the constants = 60 K-1/3T2/3 and = 160 K-1/3T2/3 which lead to . These values are in very good agreement with the respective values 68, 185 and 4.5 calculated using Eq.(3) and the values given in Table 1, demonstrating the pertinence of our scaling analysis. We note that the 3d-LLL scaling breaks down for large field values because in Eq.(3) is no longer T-independent at high fields because higher-order gradient terms in the Ginzburg-Landau functional, neglected in the 3d-LLL approximation, become important.
A similar scaling approach should also work at very low temperatures for field curves at constant temperature. We find that a similar scaling function can be employed to analyze the mixed-state specific heat shown in Fig. 3(a). The argument of the scaling function is now
| (4) |
with the constant
| (5) |
Here, we estimated Cmf(T,H) for each temperature by fitting our data to H2 away from Hm(T) (see dotted lines in Figs 5(c)-(d)), which is characteristic of Pauli-limited superconductors. Our scaled specific-heat data are compared to the Li-Rosenstein Li and Rosenstein (2001a, b, 2003, 2004); Rosenstein and Li (2010) calculation in Figs 5(a)-(b). For FeSe layers, we find that our scaled data precisely collapse on the theoretical curve obtained with = 23 K T calculated using Eq.(5) and the values given in Table 1. This agreement confirms the robustness of our scaling analysis and the existence of Gaussian thermal fluctuations in FeSe.
However, for T 6 K, the 3d-LLL scaling breaks down for FeSe layers as illustrated in Fig. 5(b). We show in Sec. IV.2.2 that it is related to strong paramagnetic effects, which are not accounted for in the 3d-LLL scaling approach.
Further, we note that the mid-point of our broad melting discontinuity lies around i.e. below the Li-Rosenstein value Li and Rosenstein (2001a, b, 2003, 2004); Rosenstein and Li (2010) () calculated for an ideal vortex lattice. We ascribe this difference to the weak flux pinning observed in our thermal-expansion measurements.
As explained in Ref. Mikitik and Brandt, 2003, the influence of disorder on the locus of the melting line can be quantified by the parameter with ( and are the zero-field critical-current and depairing-current densities, respectively) and the Lindemann number. Using 3 104 A cm-2 inferred from Ref. Sun et al., 2015, A cm-2 and (see Sec. IV.2.1), we obtain 1 indicating that the observed melting line in FeSe lies very close to the genuine first-order transition line of the defect-free sample Mikitik and Brandt (2003).
.
Hereabove, we have employed expressions derived for a single-band system whereas FeSe is a two-band superconductor. We believe that it is a fair approximation since the -averaged energy gaps on the electron and hole bands are found almost equal, i.e. 1.3 meV. Sprau et al. (2017); Hardy et al. (2019) In the opposite case, e.g. , 3d-LLL scaling breaks down because of the existence of two distinct energy modes Koshelev and Varlamov (2014); Adachi and Ikeda (2016).
IV.2 phase diagram
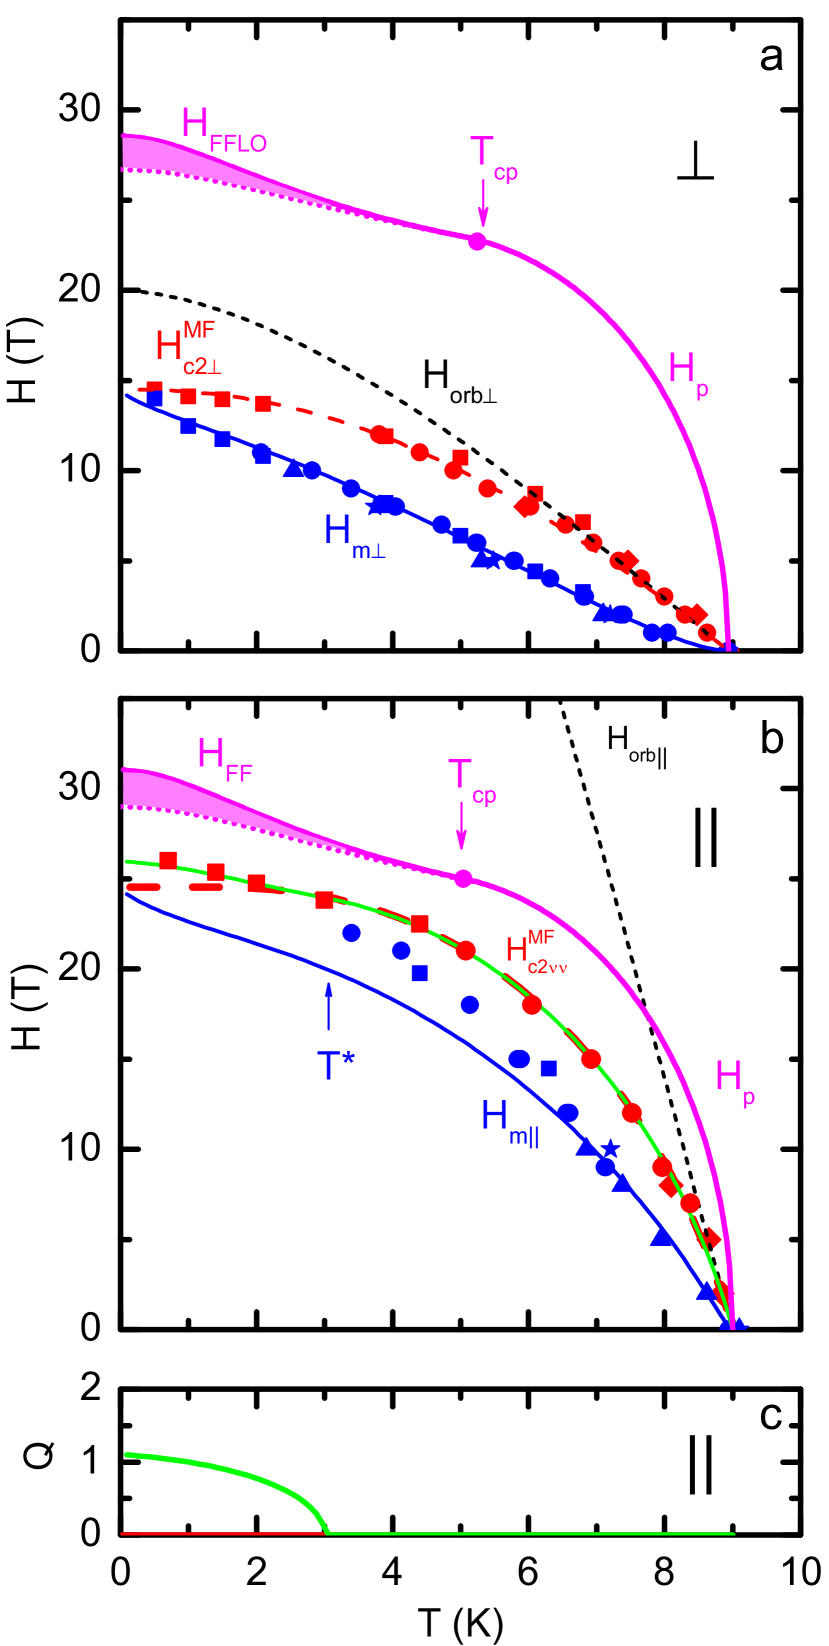
The above scaling approach yields a mean-field Hc2(T) and, together with the position of the melting anomaly, allows us to construct () phase diagrams which are displayed in Figs 7(a)-(b) for H and to the FeSe layers, respectively. The blue symbols correspond to the vortex-melting line obtained from (circle) and sweep (square) specific-heat measurements and triangles are inferred from thermal expansion. The locus of the mean-field , derived from our scaling analysis, is represented by the red symbols and corresponds to aT, aH = 0 as indicated by the dotted lines in Figs 4 and 5. In the following, we critically analyze these thermodynamically-derived phase diagrams, which are more representative of the real phase transitions than transport-derived phase diagrams Ok et al. (2020), since the zero-resistance criteria of the latter only mark the vortex melting line.
IV.2.1 H FeSe layers
The large value of the Ginzburg-Landau parameter clearly indicates that FeSe is a strong type II superconductor and thus represents a good candidate to study the influence of Pauli-depairing effects on the vortex state. The importance of spin paramagnetism is typically quantified by the Maki parameter Maki (1964)
| (6) |
where and are the zero-temperature Pauli and orbital critical fields, Sarma (1963); Helfand and Werthamer (1966) respectively ( is the gyromagnetic factor). In Fig. 7(a), we show the temperature dependence of H computed within the clean-limit Helfand-Werthamer framework Helfand and Werthamer (1966) using the measured initial slope T K-1 (black dotted lines). We obtain T which clearly exceeds the experimental value of H 15 T by a significant amount, strongly suggesting that Pauli depairing is already significant in FeSe for H FeSe layers. To account for this effect, we analyze our data within the Werthamer-Helfand-Hohenberg (WHH) formalism Werthamer et al. (1966); Brison et al. (1995) including Pauli effects. An excellent fit to our data (red dashed line) is obtained for H = 26.5 T (left as a free parameter) which leads to a moderate value of the Maki parameter 1.1. For completeness, we also plot in Fig. 7 the temperature dependence of Hp(T) (magenta curve) Sarma (1963).
The melting line (T) (blue symbols) exhibits a characteristic upward curvature near , similar to that of YBCO, Bouquet et al. (2001) and then crosses over to a quasi-linear dependence at lower temperature, where it finally merges with (T) at T 0. The observation of the vortex-melting transition down to in FeSe allows us to examine the numerous theoretical models put forward to describe this phenomenon. Here, we compare our results to the semiquantitative approach of Houghton et al. Houghton et al. (1989) based on the Lindemann criterion. In this approach, the flux-line lattice melts when the mean-square amplitude of the fluctuations
| (7) |
where is the vortex-lattice spacing, is the Abrikosov parameter, , and . Here, is the Lindemann number and the analytical expression of is given in Ref. I.M. Babich and Mikitik, 1994. We note that, for , Eq.(7) leads to which coincides with Eq.(4) for H = Hm Mikitik and Brandt (2003). Using our WHH calculation for Hc2(T) and from Table 1, we solve Eq.(7) and the resulting curve is depicted in Fig. 7(a) (solid blue line). For cL = 0.15, our calculation fit our data remarkably well down to T = 0. Thus, the melting transition in the presence of weak/moderate paramagnetic depairing remains the only genuine thermodynamic phase transition for H FeSe layers, as emphasized by Adachi and Ikeda Adachi and Ikeda (2003), and the vortex liquid smoothly crosses over to the nematic state near Hc2(T). Finally, we note that we find no thermodynamic evidence of the high-field modulated phase reported by Kasahara et al. Kasahara et al. (2014) and Watashige et al. Watashige et al. (2017) inferred from heat- and electrical-transport and torque measurements.
IV.2.2 H FeSe layers
The situation is very different for H FeSe layers since paramagnetic effects are much stronger in this direction due to the larger value of = 4.5. In such a case, Adachi and Ikeda Adachi and Ikeda (2003) predicted that Hm(T) and Hc2(T) could already merge at finite temperature. This appears to be the case realized in our data, as illustrated in Fig. 7(b) where the two lines merge around T∗ 3 K. Below this temperature, the normal state is recovered before the vortex solid had a chance to melt due to strong paramagnetic pair-breaking, which strongly suppresses Hc2(T). The vortex liquid phase thus no longer exists in this part of the phase diagram, and Hc2(T) again turns into a genuine phase transition for T T∗. This reveals that paramagnetic effects tend to suppress superconducting fluctuations, as can be expected as the transition becomes first-order like. We note that the progressive disappearance of the vortex-melting anomaly nicely correlates with the drastic reduction of the resistive transition width reported by Kasahara et al Kasahara et al. (2019).
In Fig. 7(b), we show our calculation of Hc2(T) (red dashed curve) using the WHH formula with the inferred values of = 4.5 and = - 13.8 T K-1. We find that it accurately reproduces our Hc2(T) data only for T T∗. For T T∗, the Hc2(T) values lie above this line, and the behavior is reminiscent of FFLO-type physics. The vortex melting line (solid blue curve), obtained within the Lindemann approximation with the same value of (see Sec. IV.2.1) and a slightly higher cL = 0.2, describes our experimental data quite well only for T 6.5 K. Below 6.5 K, the real melting (blue symbols) deviates strongly from this line, which is not unexpected, since strong paramagnetic effects are not accounted for in this model. We note that the ’jump’ observed by Kasahara et al Kasahara et al. (2019) in heat-transport measurements appears to coincide with the dashed red line at low T. Theoretically, this line no longer represents a genuine phase transition for T T∗, as explained in Refs Sarma, 1963; Saint-James et al., 1969, and the correlation with our experiments is unclear.
In purely Pauli-limited superconductors, a spatially-modulated phase is predicted to appear at high field for T Tcp = 0.56 Tc, as shown independently by Fulde and Ferrell and Larkin and Ovchinnikov Fulde and Ferrell (1964); Larkin and N. (1965). Two effects are already expected to mark the emergence of the FFLO phase below Tcp: (i) a first-order transition between the uniform BCS and the modulated states (dotted magenta line) and (ii) an enhancement of Hc2(T) which now defines the transition between the FFLO- and the polarized normal-state phases (solid magenta line). However, these lines are expected to lie very close to each other in purely Pauli-limited 3D systems. Here, they are only 2 T apart at T = 0 (see shaded area in Fig. 7(b)). Accounting for the orbital effect, we expect a shift of Tcp towards lower temperature and the two lines to lie even closer to each other Gruenberg and Gunther (1966); Houzet and Buzdin (2001); Houzet and Mineev (2006, 2007). For 4.5, the FFLO state should emerge theoretically below Tcp = 0.33 Tc 3 K in FeSe Brison et al. (1997). Interestingly, this corresponds to T∗ where Hm(T) and Hc2(T) are found to merge. Therefore, we have recalculated Hc2(T) (without additional parameters) allowing for a finite modulation of the order parameter, , assuming a second-order FFLO/N transition A.I. Buzdin (1996). The results for H and the related Q(T) are displayed in Figs 7(b)-(c) (green solid lines), respectively. They reproduce the enhancement of Hc2(T) observed for T < T∗ remarkably well. Unfortunately, we found no experimental evidence for the required BCS/FFLO transition in our specific-heat measurements. However, recent heat-transport data from Kasahara et al. Kasahara et al. (2019) provide some evidence for such a modulated phase for T < 2 K.
It appears that the transition to the normal state possibly changes its character below T*. While it appears second -order like at T = 3 K, the transition exhibits a rather broad specific-heat discontinuity at T = 0.7 K (see Fig. 3(d)). This feature is reminiscent of the broadened discontinuity observed around 27 T in heat-transport measurements Kasahara et al. (2019). Overall our phase diagram is found to be in rough agreement with that of Kasahara et al. Kasahara et al. (2019). However, additional measurements (e.g. magnetocaloric measurements) would be very useful to further establish the firm existence of an FFLO phase in FeSe.
IV.2.3 Consistency check of our analysis
It is worth noting that the analysis presented in Sec. IV.2.1 and IV.2.2, for both field orientations, were carried out with only two free parameters i.e. Hp(0) = 26-29 T and = 0.15-0.20 for determining Hc2(T) and Hm(T), respectively. The other quantities reported in Table 1 are directly inferred from our measurements using standard thermodynamic relations. Similarly, the agreement between the experimental values of and in Sec.IV.1 with these calculated directly from Eqs (3) and (5) is better than 15 %.
Further, the transition at T = 0 in the purely paramagnetic case occurs when the polarization energy equals the condensation energy, i.e. for Saint-James et al. (1969) : where represents the normal-state Pauli susceptibility and = 0 for a singlet superconductor. Using our values of Hp(0), Hc(0) = 0.12 T from our (T,H=0) data and = 1.3 meV from BQPI experiments, we obtain 1.710-5 and 2.21047 J-1 m-3 spin-1. These values lead to a value of the Sommerfeld coefficient mJ mol-1 K-2 in excellent agreement with the value inferred from direct specific-heat measurements. These consistency checks provide us with great confidence concerning the relevance of our scaling analysis, the accuracy of the inferred mean-field Hc2(T), and the validity of the presented phase diagrams.
V Conclusions
We have determined the full phase diagram of the nematic superconductor FeSe for both field orientations. Compelling evidence of an underlying vortex-melting transition is found in both specific-heat and thermal-expansion measurements down to low temperature and high magnetic fields. We demonstrate the existence of significant Gaussian thermal fluctuations via a scaling analysis of our thermodynamic data which yields the temperature dependence of the mean-field upper critical field. The antagonist interplay between superconducting fluctuations and Pauli depairing effects is studied. We argue that the predominance of the paramagnetic limitation at low temperature is responsible for the unusual disappearance of the melting transition at finite temperature, around T∗ 2 K, for H FeSe planes, as anticipated theoretically. A slight upturn of Hc2(T) for T T∗, possibly related to the occurence of the Fulde-Ferrell-Larkin-Ovchinnikov phase, is observed. Additional thermodynamic measurements e.g. of the magnetocaloric effect or magnetostriction, with accurate in-plane field alignment, are necessary to firmly establish the existence of this modulated phase.
Acknowledgements.
We thank B. Rosenstein for providing us with the theoretical scaling function. We acknowledge fruitful discussions with G. P. Mikitik, M. Houzet, A. E. Koshelev, J.-P. Brison and R. Eder. Part of this work was performed at the LNCMI, a member of the European Magnetic Field Laboratory (EMFL). K.W. acknowledges funding from the Alexander von Humboldt Foundation. The contribution from M. M. was supported by the Karlsruhe Nano Micro Facility (KNMF).References
- Abrikosov (1957) A. A. Abrikosov, Soviet Phys. JETP 5, 1174 (1957).
- de Gennes (1999) P.-G. de Gennes, Superconductivity of metals and alloys, Advanced book classics (Westview, Perseus Books, 1999).
- Larkin and Ovchinnikov (1970) A. I. Larkin and Y. N. Ovchinnikov, Soviet Phys. JETP 31, 784 (1970).
- Larkin and Ovchinnikov (1974) A. I. Larkin and Y. N. Ovchinnikov, Soviet Phys. JETP 38, 854 (1974).
- Larkin and Ovchinnikov (1979) A. I. Larkin and Y. N. Ovchinnikov, J. Low Temp. Phys. 34, 409 (1979).
- Giamarchi and Le Doussal (1994) T. Giamarchi and P. Le Doussal, Phys. Rev. Lett. 72, 1530 (1994).
- Giamarchi and Le Doussal (1997) T. Giamarchi and P. Le Doussal, Phys. Rev. B 55, 6577 (1997).
- Saint-James et al. (1969) D. Saint-James, G. Sarma, and E. J. Thomas, eds., Type II superconductivity, International series of monographs in natural philosophy ; 17 (Pergamon Press, 1969).
- Blatter et al. (1994a) G. Blatter, M. V. Feigel’man, V. B. Geshkenbein, A. I. Larkin, and V. M. Vinokur, Rev. Mod. Phys. 66, 1125 (1994a).
- Brandt (1995) E. H. Brandt, Rep. Prog. Phys. 58, 1465 (1995).
- Fisher et al. (2007) R. A. Fisher, J. E. Gordon, and N. E. Phillips, in Handbook of High-Temperature Superconductivity, edited by J. R. Schrieffer and J. S. Brooks (Springer, 2007) pp. 345–397.
- Eilenberger (1967) G. Eilenberger, Phys. Rev. 164, 628 (1967).
- Huberman and Doniach (1979) B. A. Huberman and S. Doniach, Phys. Rev. Lett. 43, 950 (1979).
- Fisher (1980) D. S. Fisher, Phys. Rev. B 22, 1190 (1980).
- Zeldov et al. (1995) E. Zeldov, D. Majer, M. Konczykowski, V. B. Geshkenbein, V. M. Vinokur, and H. Shtrikman, Nature 375, 373 (1995).
- Welp et al. (1996) U. Welp, J. A. Fendrich, W. K. Kwok, G. W. Crabtree, and B. W. Veal, Phys. Rev. Lett. 76, 4809 (1996).
- Liang et al. (1996) R. Liang, D. A. Bonn, and W. N. Hardy, Phys. Rev. Lett. 76, 835 (1996).
- Nishizaki et al. (1996) T. Nishizaki, Y. Onodera, N. Kobayashi, H. Asaoka, and H. Takei, Phys. Rev. B 53, 82 (1996).
- Schilling et al. (1996) A. Schilling, R. A. Fisher, N. E. Phillips, U. Welp, D. Dasgupta, W. K. Kwok, and G. W. Crabtree, Phys. Rev. B 382, 791 (1996).
- Schilling et al. (1997) A. Schilling, R. A. Fisher, N. E. Phillips, U. Welp, W. K. Kwok, and G. W. Crabtree, Phys. Rev. Lett. 78, 4833 (1997).
- Schilling et al. (1998) A. Schilling, R. A. Fisher, N. E. Phillips, U. Welp, W. K. Kwok, and G. W. Crabtree, Phys. Rev. B 58, 11157 (1998).
- Roulin et al. (1995a) M. Roulin, A. Junod, A. Erb, and E. Walker, J. Low Temp. Phys. 105, 1099 (1995a).
- Roulin et al. (1996) M. Roulin, A. Junod, and E. Walker, Science 273, 1210 (1996).
- Roulin et al. (1998a) M. Roulin, A. Junod, and E. Walker, Physica C 296, 137 (1998a).
- Revaz et al. (1998) B. Revaz, A. Junod, and A. Erb, Phys. Rev. B 58, 11153 (1998).
- Bouquet et al. (2001) F. Bouquet, C. Marcenat, E. Steep, R. Calemczuk, W. K. Kwok, U. Welp, G. W. Crabtree, R. A. Fisher, N. E. Phillips, and A. Schilling, Nature 411, 448 (2001).
- Lortz et al. (2003a) R. Lortz, C. Meingast, U. Welp, W. K. Kwok, and G. W. Crabtree, Phys. Rev. Lett. 90, 237002 (2003a).
- Lortz et al. (2006) R. Lortz, F. Lin, N. Musolino, Y. Wang, A. Junod, B. Rosenstein, and N. Toyota, Phys. Rev. B 74, 104502 (2006).
- Petrović et al. (2009) A. P. Petrović, Y. Fasano, R. Lortz, C. Senatore, A. Demuer, A. B. Antunes, A. Paré, D. Salloum, P. Gougeon, M. Potel, and O. Fischer, Phys. Rev. Lett. 103, 257001 (2009).
- Mak et al. (2013) H. K. Mak, P. Burger, L. Cevey, T. Wolf, C. Meingast, and R. Lortz, Phys. Rev. B 87, 214523 (2013).
- Koshelev et al. (2019) A. E. Koshelev, K. Willa, R. Willa, M. P. Smylie, J.-K. Bao, D. Y. Chung, M. G. Kanatzidis, W.-K. Kwok, and U. Welp, Phys. Rev. B 100, 094518 (2019).
- Blatter and Ivlev (1993) G. Blatter and B. Ivlev, Phys. Rev. Lett. 70, 2621 (1993).
- Blatter et al. (1994b) G. Blatter, B. Ivlev, Y. Kagan, M. Theunissen, Y. Volokitin, and P. Kes, Phys. Rev. B 50, 13013 (1994b).
- Blatter and Ivlev (1994) G. Blatter and B. I. Ivlev, Phys. Rev. B 50, 10272 (1994).
- Adachi and Ikeda (2003) H. Adachi and R. Ikeda, Phys. Rev. B 68, 184510 (2003).
- Lortz et al. (2007a) R. Lortz, Y. Wang, A. Demuer, P. H. M. Böttger, B. Bergk, G. Zwicknagl, Y. Nakazawa, and J. Wosnitza, Phys. Rev. Lett. 99, 187002 (2007a).
- Bianchi et al. (2003) A. Bianchi, R. Movshovich, C. Capan, P. G. Pagliuso, and J. L. Sarrao, Phys. Rev. Lett. 91, 187004 (2003).
- Matsuda and Shimahara (2007) Y. Matsuda and H. Shimahara, J. Phys. Soc. Jpn 76, 051005 (2007).
- Fulde and Ferrell (1964) P. Fulde and R. A. Ferrell, Phys. Rev. 135, A550 (1964).
- Larkin and N. (1965) A. I. Larkin and O. Y. N., Sov. Phys. JETP 20, 762 (1965).
- Lortz et al. (2007b) R. Lortz, C. Meingast, A. I. Rykov, and S. Tajima, J. Low Temp. Phys. 147, 365 (2007b).
- Wosnitza (2018) J. Wosnitza, Ann. Phys. (Berlin) 530, 1700282 (2018).
- Kenzelmann et al. (2008) M. Kenzelmann, T. Strässle, C. Niedermayer, M. Sigrist, B. Padmanabhan, M. Zolliker, A. D. Bianchi, R. Movshovich, E. D. Bauer, J. L. Sarrao, and J. D. Thompson, Science 321, 1652 (2008).
- Kenzelmann et al. (2010) M. Kenzelmann, S. Gerber, N. Egetenmeyer, J. L. Gavilano, T. Strässle, A. D. Bianchi, E. Ressouche, R. Movshovich, E. D. Bauer, J. L. Sarrao, and J. D. Thompson, Phys. Rev. Lett. 104, 127001 (2010).
- Kumagai et al. (2011) K. Kumagai, H. Shishido, T. Shibauchi, and Y. Matsuda, Phys. Rev. Lett. 106, 137004 (2011).
- Murray and Tešanović (2010) J. M. Murray and Z. Tešanović, Phys. Rev. Lett. 105, 037006 (2010).
- Hou et al. (2015) J. Hou, P. Burger, H. K. Mak, F. Hardy, T. Wolf, C. Meingast, and R. Lortz, Phys. Rev. B 92, 064502 (2015).
- Burger et al. (2013) P. Burger, F. Hardy, D. Aoki, A. E. Böhmer, R. Eder, R. Heid, T. Wolf, P. Schweiss, R. Fromknecht, M. J. Jackson, C. Paulsen, and C. Meingast, Phys. Rev. B 88, 014517 (2013).
- Zocco et al. (2013) D. A. Zocco, K. Grube, F. Eilers, T. Wolf, and H. v. Löhneysen, Phys. Rev. Lett. 111, 057007 (2013).
- Cho et al. (2017) C.-w. Cho, J. H. Yang, N. F. Q. Yuan, J. Shen, T. Wolf, and R. Lortz, Phys. Rev. Lett. 119, 217002 (2017).
- Böhmer and Kreisel (2017) A. E. Böhmer and A. Kreisel, J. Phys.: Condens. Matter 30, 023001 (2017).
- Coldea and Watson (2018) A. Coldea and M. D. Watson, Annu. Rev. Condens. Matter Phys. 9, 125 (2018).
- Sprau et al. (2017) P. O. Sprau, A. Kostin, A. Kreisel, A. E. Böhmer, V. Taufour, P. C. Canfield, S. Mukherjee, P. J. Hirschfeld, B. M. Andersen, and J. C. S. Davis, Science 357, 75 (2017).
- Rhodes et al. (2018) L. C. Rhodes, M. D. Watson, A. A. Haghighirad, D. V. Evtushinsky, M. Eschrig, and T. K. Kim, Phys. Rev. B 98, 180503 (2018).
- Kreisel et al. (2017) A. Kreisel, B. M. Andersen, P. O. Sprau, A. Kostin, J. C. S. Davis, and P. J. Hirschfeld, Phys. Rev. B 95, 174504 (2017).
- Kang et al. (2018) J. Kang, R. M. Fernandes, and A. Chubukov, Phys. Rev. Lett. 120, 267001 (2018).
- Benfatto et al. (2018) L. Benfatto, B. Valenzuela, and L. Fanfarillo, npj Quantum Mater. 3, 56 (2018).
- Cercellier et al. (2019) H. Cercellier, P. Rodière, P. Toulemonde, C. Marcenat, and T. Klein, Phys. Rev. B 100, 104516 (2019).
- Terashima et al. (2014) T. Terashima, N. Kikugawa, A. Kiswandhi, E.-S. Choi, J. S. Brooks, S. Kasahara, T. Watashige, H. Ikeda, T. Shibauchi, Y. Matsuda, T. Wolf, A. E. Böhmer, F. Hardy, C. Meingast, H. v. Löhneysen, M.-T. Suzuki, R. Arita, and S. Uji, Phys. Rev. B 90, 144517 (2014).
- Yang et al. (2017) H. Yang, G. Chen, X. Zhu, J. Xing, and H.-H. Wen, Phys. Rev. B 96, 064501 (2017).
- Kasahara et al. (2014) S. Kasahara, T. Watashige, T. Hanaguri, Y. Kohsaka, T. Yamashita, Y. Shimoyama, Y. Mizukami, R. Endo, H. Ikeda, K. Aoyama, T. Terashima, S. Uji, T. Wolf, H. von Löhneysen, T. Shibauchi, and Y. Matsuda, Proc. Natl. Acad. Sci. U.S.A. 111, 16309 (2014).
- Watashige et al. (2017) T. Watashige, S. Arsenijević, T. Yamashita, D. Terazawa, T. Onishi, L. Opherden, S. Kasahara, Y. Tokiwa, Y. Kasahara, T. Shibauchi, H. von Löhneysen, J. Wosnitza, and Y. Matsuda, J. Phys. Soc. Jpn 86, 014707 (2017).
- Kasahara et al. (2019) S. Kasahara, Y. Sato, S. Licciardello, M. Čulo, S. Arsenijević, T. Ottenbros, T. Tominaga, J. Böker, I. Eremin, T. Shibauchi, J. Wosnitza, N. E. Hussey, and Y. Matsuda, (2019), arXiv:1911.08237 [cond-mat.supr-con] .
- Brison et al. (1997) J. Brison, A. Buzdin, L. Glémont, F. Thomas, and J. Flouquet, Physica B 230, 406 (1997).
- Hardy et al. (2019) F. Hardy, M. He, L. Wang, T. Wolf, P. Schweiss, M. Merz, M. Barth, P. Adelmann, R. Eder, A.-A. Haghighirad, and C. Meingast, Phys. Rev. B 99, 035157 (2019).
- Michon et al. (2019) B. Michon, C. Girod, S. Badoux, J. Kačmarčík, Q. Ma, M. Dragomir, H. A. Dabkowska, B. D. Gaulin, J. S. Zhou, S. Pyon, T. Takayama, H. Takagi, S. Verret, N. Doiron-Leyraud, C. Marcenat, L. Taillefer, and T. Klein, Nature 567, 218 (2019).
- Meingast et al. (1990) C. Meingast, B. Blank, H. Bürkle, B. Obst, T. Wolf, H. Wühl, V. Selvamanickam, and K. Salama, Phys. Rev. B 41, 11299 (1990).
- Sun et al. (2017) Y. Sun, S. Kittaka, S. Nakamura, T. Sakakibara, K. Irie, T. Nomoto, K. Machida, J. Chen, and T. Tamegai, Phys. Rev. B 96, 220505 (2017).
- Watashige et al. (2015) T. Watashige, Y. Tsutsumi, T. Hanaguri, Y. Kohsaka, S. Kasahara, A. Furusaki, M. Sigrist, C. Meingast, T. Wolf, H. v. Löhneysen, T. Shibauchi, and Y. Matsuda, Phys. Rev. X 5, 031022 (2015).
- Jiao et al. (2017) L. Jiao, S. Rößler, C. Koz, U. Schwarz, D. Kasinathan, U. K. Rößler, and S. Wirth, Phys. Rev. B 96, 094504 (2017).
- Schneider and Singer (2000) T. Schneider and J. M. Singer, Phase Transition Approach to High Temperature Superconductivity (PUBLISHED BY IMPERIAL COLLEGE PRESS AND DISTRIBUTED BY WORLD SCIENTIFIC PUBLISHING CO., 2000).
- Chubukov et al. (2016) A. V. Chubukov, I. Eremin, and D. V. Efremov, Phys. Rev. B 93, 174516 (2016).
- Chen et al. (2005) Q. Chen, J. Stajic, S. Tan, and K. Levin, Physics Reports 412, 1 (2005).
- Farrant and E. (1975) S. P. Farrant and G. C. E., Phys. Rev. Lett. 34, 943 (1975).
- Lortz et al. (2003b) R. Lortz, C. Meingast, A. I. Rykov, and S. Tajima, Phys. Rev. Lett. 91, 207001 (2003b).
- Roulin et al. (1998b) M. Roulin, A. Junod, A. Erb, and E. Walker, Phys. Rev. Lett. 80, 1722 (1998b).
- Lortz and Meingast (2002) R. Lortz and C. Meingast, J. Non-Crystalline Solids 307, 452 (2002).
- Pippard (1966) A. B. Pippard, Elements of classical thermodynamics for advanced students of physics (Cambridge Univ. Pr., Cambridge [u.a.], 1966).
- Pasler et al. (1998) V. Pasler, P. Schweiss, C. Meingast, B. Obst, H. Wühl, A. I. Rykov, and S. Tajima, Phys. Rev. Lett. 81, 1094 (1998).
- Meingast et al. (2001) C. Meingast, V. Pasler, P. Nagel, A. Rykov, S. Tajima, and P. Olsson, Phys. Rev. Lett. 86, 1606 (2001).
- Inderhees et al. (1991) S. E. Inderhees, M. B. Salamon, J. P. Rice, and D. M. Ginsberg, Phys. Rev. Lett. 66, 232 (1991).
- Schnelle et al. (1993) W. Schnelle, P. Ernst, and D. Wohlleben, Ann. Phys. 2, 109 (1993).
- Overend et al. (1994) N. Overend, M. A. Howson, and I. D. Lawrie, Phys. Rev. Lett. 72, 3238 (1994).
- Breit et al. (1995) V. Breit, P. Schweiss, R. Hauff, H. Wühl, H. Claus, H. Rietschel, A. Erb, and G. Müller-Vogt, Phys. Rev. B 52, R15727 (1995).
- Junod et al. (1994) A. Junod, K.-Q. Wang, E. Janod, G. Triscone, and J. Muller, Physica B 194, 1495 (1994).
- Roulin et al. (1995b) M. Roulin, A. Junod, and J. Muller, Phys. Rev. Lett. 75, 1869 (1995b).
- Pierson et al. (1995) S. W. Pierson, J. Buan, B. Zhou, C. C. Huang, and O. T. Valls, Phys. Rev. Lett. 74, 1887 (1995).
- Pierson et al. (1996) S. W. Pierson, T. M. Katona, Z. Tes˘anović, and O. T. Valls, Phys. Rev. B 53, 8638 (1996).
- Pierson et al. (1998) S. W. Pierson, O. T. Valls, Z. Tešanović, and M. A. Lindemann, Phys. Rev. B 57, 8622 (1998).
- Jeandupeux et al. (1996) O. Jeandupeux, A. Schilling, H. R. Ott, and A. van Otterlo, Phys. Rev. B 53, 12475 (1996).
- Junod et al. (2000) A. Junod, M. Roulin, B. Revaz, and A. Erb, Physica B 280, 214 (2000).
- Larkin and Varlamov (2005) A. Larkin and A. A. Varlamov, Theory of fluctuations in superconductors, edited by A. I. Larkin, International series of monographs on physics ; 127Oxford science publications (Clarendon Press, Oxford, 2005).
- Li and Rosenstein (2001a) D. Li and B. Rosenstein, Phys. Rev. B 65, 024514 (2001a).
- Li and Rosenstein (2001b) D. Li and B. Rosenstein, Phys. Rev. Lett. 86, 3618 (2001b).
- Li and Rosenstein (2003) D. Li and B. Rosenstein, Phys. Rev. Lett. 90, 167004 (2003).
- Li and Rosenstein (2004) D. Li and B. Rosenstein, Phys. Rev. B 70, 144521 (2004).
- Rosenstein and Li (2010) B. Rosenstein and D. Li, Rev. Mod. Phys. 82, 109 (2010).
- Thouless (1975) D. J. Thouless, Phys. Rev. Lett. 34, 946 (1975).
- Mikitik and Brandt (2003) G. P. Mikitik and E. H. Brandt, Phys. Rev. B 68, 054509 (2003).
- Sun et al. (2015) Y. Sun, S. Pyon, T. Tamegai, R. Kobayashi, T. Watashige, S. Kasahara, Y. Matsuda, and T. Shibauchi, Phys. Rev. B 92, 144509 (2015).
- Koshelev and Varlamov (2014) A. E. Koshelev and A. A. Varlamov, Supercond. Sci. Technol. 27, 124001 (2014).
- Adachi and Ikeda (2016) K. Adachi and R. Ikeda, Phys. Rev. B 93, 134503 (2016).
- Ok et al. (2020) J. M. Ok, C. I. Kwon, Y. Kohama, J. S. You, S. K. Park, J. hye Kim, Y. J. Jo, E. S. Choi, K. Kindo, W. Kang, K. S. Kim, E. G. Moon, A. Gurevich, and J. S. Kim, (2020), arXiv:2003.12351 [cond-mat.supr-con] .
- Maki (1964) K. Maki, Physics (Long Island City, N.Y.) 1, 127 (1964).
- Sarma (1963) G. Sarma, J. Phys. Chem. Solids 24, 1029 (1963).
- Helfand and Werthamer (1966) E. Helfand and N. R. Werthamer, Phys. Rev. 147, 288 (1966).
- Werthamer et al. (1966) N. R. Werthamer, E. Helfand, and P. C. Hohenberg, Phys. Rev. 147, 295 (1966).
- Brison et al. (1995) J. Brison, N. Keller, A. Vernière, P. Lejay, L. Schmidt, A. Buzdin, J. Flouquet, S. Julian, and G. Lonzarich, Physica C 250, 128 (1995).
- Houghton et al. (1989) A. Houghton, R. A. Pelcovits, and A. Sudbø, Phys. Rev. B 40, 6763 (1989).
- I.M. Babich and Mikitik (1994) Y. S. I.M. Babich and G. Mikitik, Low. Temp. Phys. 20, 221 (1994).
- Gruenberg and Gunther (1966) L. W. Gruenberg and L. Gunther, Phys. Rev. Lett. 16, 996 (1966).
- Houzet and Buzdin (2001) M. Houzet and A. Buzdin, Phys. Rev. B 63, 184521 (2001).
- Houzet and Mineev (2006) M. Houzet and V. P. Mineev, Phys. Rev. B 74, 144522 (2006).
- Houzet and Mineev (2007) M. Houzet and V. P. Mineev, Phys. Rev. B 76, 224508 (2007).
- A.I. Buzdin (1996) J. B. A.I. Buzdin, Phys. Lett. A 218, 359 (1996).