A dark matter profile to model diverse feedback-induced core sizes of CDM haloes
Abstract
We analyze the cold dark matter density profiles of 54 galaxy halos simulated with FIRE-2 galaxy formation physics, each resolved within of the halo virial radius. These halos contain galaxies with masses that range from ultra-faint dwarfs () to the largest spirals () and have density profiles that are both cored and cuspy. We characterize our results using a new, analytic density profile that extends the standard two-parameter Einasto form to allow for a pronounced constant-density core in the resolved innermost radius. With one additional core-radius parameter, , this three-parameter core-Einasto profile is able to characterize our feedback-impacted dark matter halos more accurately than other three-parameter profiles proposed in the literature. In order to enable comparisons with observations, we provide fitting functions for and other profile parameters as a function of both and . In agreement with past studies, we find that dark matter core formation is most efficient at the characteristic stellar-mass to halo-mass ratio , or , with cores that are roughly the size of the galaxy half-light radius, kpc. Furthermore, we find no evidence for core formation at radii in galaxies with or . For Milky Way-size galaxies, baryonic contraction often makes halos significantly more concentrated and dense at the stellar half-light radius than DMO runs. However, even at the Milky Way scale, FIRE-2 galaxy formation still produces small dark matter cores of kpc in size. Recent evidence for a kpc core in the Milky Way’s dark matter halo is consistent with this expectation.
keywords:
galaxies: evolution – galaxies: formation – dark matter1 Introduction
The theory of Cold Dark Matter with the inclusion of the cosmological constant (CDM) has been the benchmark paradigm in cosmological studies, as its framework has been successful in modeling the distribution of large-scale structure of our universe. However, on small scales, there are potential inconsistencies between predictions made by the CDM paradigm and what is observed in real galaxies. One of these inconsistencies concerns the distribution of dark matter in centers of galaxies. This known as the cusp-core problem: dark matter halos simulated without baryons in CDM have cusped dark matter densities at small radii, i.e. with (dubinkski1991; navarro1997universal; navarro2004inner), while observations of some dark matter dominated galaxies appear to suggest profiles are better described by constant-density cores at small radii, i.e. (flores1994observational; moore1994evidence; salucci2000dark; swaters2003central; gentile2004cored; spekkens2005cusp; walter2008things; oh2011central; relatores2019inner). Another potentially related discrepancy is called the Too Big to Fail problem (boylan2011too): Milky Way satellite galaxies are observed to have much smaller inner dark matter densities compared to the surplus of subhalos predicted from (dark matter only) cosmological -body simulations. This problem also persists in other dwarf galaxies of the Local Group and local field (garrison2014too; tollerud2014; papastergis2015too).
Most of the above-mentioned problems were posed from dark matter only simulations, which lack the effects of baryons. One way galaxy formation can affect dark matter is by boosting central dark matter densities as a result of baryons clustering at the center of the halo (blumenthal1986contraction). This denoted as “baryonic contraction” in the literature and it is an effect that is particularly important for Milky Way-mass galaxies (e.g. gnedin2004response; chan2015impact). Alternatively, the inner dark matter density can decrease in response to repetitive energetic outflows from stellar feedback, a process often referred to as “feedback-induced core formation”, and one that is most effective in galaxies that are somewhat smaller than the Milky Way (navarro1996cores; read2005shallow; governato2010bulgeless; governato2012cuspy; pontzen2012supernova; teyssier2013cusp; di2013dependence; chan2015impact; brook2015local; tollet2016nihao). Another possibility is that dynamical friction from small accretion events (elzant2001cusp; tonini2006angular; romano2008erasing; goerdt2010core; cole2011weakening) can flatten the dark matter density profile.
The effects of feedback on core formation depend sensitively on the total amount and precise nature of star formation. For example, penarrubia2012coupling showed that galaxies with too few stars (and therefore, too few supernovae) are unlikely to have feedback-induced cores owing to an insufficient amount energy from supernovae to substantially transform the dark matter profile. mashchenko2006removal showed that concentrated star formation episodes that are spatially displaced from halo centers can drive bulk gas flows, alter dark matter particle orbits, and increase the likelihood for dark matter core formation. Time-repetitive “bursty” star formation also affects core formation, allowing for dark matter particle orbits to be affected significantly over time as gas is expelled and re-accreted in the baryon cycle (pontzen2012supernova). The timing of star formation relative to dark matter halo growth can also affect core formation; in cases where dark matter rich mergers occur after core-producing star formation, cusps can be reborn (onorbe2015forged). Dark matter core formation is seen in many fully self-consistent cosmological simulations that resolve star formation on small spatial scales (e.g. governato2010bulgeless; munshi2013stellar; brooks2014why; madau2014core; onorbe2015forged; el2016breathing; tollet2016nihao; fitts2017fire). One common aspect of these simulations is that they have relatively high gas density thresholds for star formation. Cosmological simulations with lower density thresholds for star formation, e.g. APOSTLE and Auriga (bose2019cores), have been shown to not produce dark matter cores. The dependence of feedback-induced core formation on the star formation density threshold has been studied in more detail by dutton2019impact and benitez2019cores. Both concluded that density thresholds higher than the mean ISM density, which allows for some ISM phase structure and clustered star formation as observed, is necessary in forming feedback-induced cores.
di2013dependence studied the relationship between the inner local density slope of dark matter, , and the stellar mass fraction, , of simulated galaxies from the MUGS (stinson2010galaxy) and MaGICC (brooks2012magicc; stinson2012magicc) simulations for a wide range stellar mass systems, . They found that core formation is a strong function the mass-ratio of stars formed to total halo mass and demonstrated that there is a characteristic mass-ratio for efficient core formation , above and below which galaxy halos approach the cuspy behavior associated with dark matter only simulations. chan2015impact used galaxies of stellar masses, , from the FIRE-1 suite (hopkins2014galaxies) to study feedback-induced core formation and found similar results. tollet2016nihao used the NIHAO suite (wang2015nihao1) for a wide range of halo masses, and further confirmed this qualitative phenomena. Recently, maccio2020nihao extended the work of tollet2016nihao with the inclusion of black hole feedback for galaxies spanning eight orders in magnitude in stellar mass.
The above-mentioned simulation groups agree on a few additional qualitative points. First, feedback typically does not produce significant deviations from cuspy dark matter only predictions in the smallest galaxies: (, typically), as expected on energetic grounds (penarrubia2012coupling; garrison2013). Second, dark matter halos become more cored as increases up until , which is the region of peak core formation. These halos are not well modeled by cuspy density profiles and must be described by an alternative dark matter profile that has a pronounced flattening in slope at small radii. In higher mass halos, , baryonic contraction actually makes halos denser at the stellar half-mass radius than dark matter only simulations would suggest. However, chan2015impact found that within this radius, small cores are often present even within baryonically-contracted halos.
The analysis done in di2014mass explored a general five-parameter density profile to characterize halos with either cuspy or cored inner density profiles. In addition to a characteristic radius and density, this profile had three shape parameters: (zhao1996models). They found that the values of the three shape parameters varied regularly as a function of the and provided fitting functions that captured these trends. Therefore, given , the di2014mass profile reduces to a two free-parameter function that may be used to compare predictions with observations in a fairly straightforward manner.
The -profile can be regarded as a generalization of the navarro1997universal profile, which provides a good fit to dark matter only simulations. Since dark matter only simulations have traditionally been characterized by the NFW profile, there have been attempts to modify the NFW form by allowing for a constant density core radius parameter . For example, penarrubia2012coupling suggested a three-parameter core profile: the classic NFW profile with a core radius in the inner radial regions of the halo. read2016cNFW derives a core profile starting with an NFW form by connecting core formation to features of star-formation efficiency and the stellar half-mass radius. More recently, freundlich2020dekel used NIHAO to explore a constrained version of the profile that has three-parameters, the “Dekel+” profile (dekel2017profile), with a variable inner slope and concentration parameter.
In what follows, we revisit the question of dark matter halo density profiles in cosmological galaxy formation simulations using the FIRE-2 feedback model (hopkins2018fire). The simulations we consider herein allow us to resolve to within of the halo virial radius in halos that produce galaxies spanning six orders of magnitude in stellar mass. We introduce a new analytic density profile, the “core-Einasto”, that extends the einasto1965influence form by adding one free parameter, a physical core radius, . It is well known that the two-parameter Einasto profile provides a better fit to dark matter only simulations than the two-parameter NFW (navarro2004inner; wang2019zoom). Similarly we find that the three-parameter core-Einasto profile provides a better fit to FIRE-2 halos than two popular three-parameter versions of generalized double-power law profiles: the Dekel+ profile (dekel2017profile; freundlich2020dekel) and a cored extension of the NFW (penarrubia2012coupling). We also find that the two-parameter di2014mass profile is not a good fit to our feedback-affected halos.
In addition to providing a better fit to our FIRE-2 halos than other three-parameter profiles, the core-Einasto profile utilizes a physically-meaningful core-radius parameter, . The numerical value of matches well to the radius where a visual profile begins to flatten towards a constant density. The combination of accuracy, intuitive parameters, and ease-of-use will hopefully allow our three-parameter core-Einasto profile to become a useful tool for comparing predictions to observations.
This article is structured as follows: Section 2 discusses our sample of high resolution galaxies simulated with FIRE-2 physics along with their relevant properties. We also discuss the numerical intricacies considered for our galaxies. Section 3 revisits the analysis of correlations between and for our sample of galaxies and dark matter halos. In Section 4, we introduce the cored version of the classic Einasto profile used to model CDM halos. We use the properties of these profiles to provide constraints on dark matter cores as a function and of . We summarize our results and discuss potential uses for observational and cosmological studies in Section LABEL:sec:conclude. The appendix includes five sections: LABEL:sec:cEinasto.Mstar has expressions for fitting parameters as a function of stellar mass; LABEL:sec:analytic.cEinasto derives analytical expressions for the mass and gravitational potential implied by the core-Einasto profile; LABEL:sec:cEinasto.BC has a four-parameter core-Einasto extension that better accounts for adiabatic contraction in Milky Way size halos; LABEL:sec:cNFW presents comparisons to fits with alternative three-parameter profiles and also presents fits for the five-parameter form; and LABEL:sec:sim.sample provides tables that list all halo properties and best-fit profile parameters for each halo in our sample.
2 Numerical Methodology
In this section, we briefly describe the suite of high-resolution simulations used in our analysis. We discuss the FIRE-2 model for full galaxy formation physics in Section 2.1, the numerical parameters used in our high resolution simulations in Sections 2.2 and 2.5, and present the halo sample used in this analysis in Section 2.3. The numerical simulations presented here are all part of the Feedback In Realistic Environments (FIRE) project111The FIRE project website: http://fire.northwestern.edu and are listed in Table LABEL:tab:halo.sample at the end of this article.
2.1 The FIRE-2 model
Our simulations were run using the multi-method code GIZMO (hopkins2015new), with the second-order mesh-free Lagrangian-Godunov finite mass (MFM) method for hydrodynamics. GIZMO utilizes an updated version of the PM+Tree algorithm from GADGET-3 (springel2005cosmological) to calculate gravity and adopts fully conservative adaptive gravitational softening for gas (price2007energy). The FIRE-2 model (hopkins2018fire), which is an updated version of the FIRE-1 feedback scheme from hopkins2014galaxies, is used to implement star formation and stellar feedback physics. Gas and gravitational physics implemented are discussed in complete detail in hopkins2018fire. Here we discuss in brief detail the feedback physics relevant to core formation.
The simulations presented here tabulate the relevant ionization states and cooling rates from a compilation of CLOUDY runs (ferland1998cloudy), accounting for gas self-shielding. The gas cooling mechanisms follow the cooling rates of K; these include metallicity-dependent fine-structure atomic cooling, low temperature molecular cooling, and high temperature metal-line cooling that followed 11 separately tracked species. Gas is heated and ionized throughout cosmic time using the redshift dependent UV background model from faucher2009new that ionizes and heats gas in an optically thin approximation and uses an approximate prescription to account for self-shielding of dense gas using a Sobolev/Jeans-length approximation. Stars are formed in Jeans-unstable, molecular gas regions at densities , with instantaneous efficiency per local free-fall time in dense gas. Each star particle is an assumed stellar population with a kroupa2001variation IMF that inherits its metallicity from its parent gas particle and has an age determined by its formation time. The stellar feedback implemented includes stellar winds, radiation pressure from young stars, Type II and Type Ia supernovae, photoelectric heating, and photo-heating from ionizing radiation. Feedback event rates, luminosities, energies, mass-loss rates, and other quantities are tabulated directly from stellar evolution models (STARBURST99 ; leitherer1999starburst99).
2.2 Numerical simulations
All simulations in this analysis use a zoom-in technique (onorbe2013zoom) to reach high resolutions in a cosmological environment by constructing a convex-hull region and refining it in progressively higher-resolution shells until the desired resolution is reached in the inner-most region. All initial conditions are generated with MUSIC (hahn2013music) and then the simulations are evolved from redshifts to assuming a flat CDM cosmology. We note that the cosmological parameters in each of the simulations vary to some degree, but remain consistent with ade2016planck. Across our entire simulation sample: , , , , . In post-processing, halos are identified using the phase-space halo finder ROCKSTAR (behroozi2012rockstar), which uses adaptive, hierarchical refinement of the friends-of-friends groups in 6-dimensional phase-space and one time dimension. This results in robust tracking of halos and subhalos (srisawat2013merger).
2.3 Halo sample & nomenclature
Throughout this paper, dark matter halos are defined as spherical systems with virial radius, , inside of which the average density is equal to . Here, is the critical density of the universe and is the redshift evolving virial overdensity defined in bryan1998statistical. The virial mass of a dark matter halo, denoted by , is then defined as the dark matter mass within . The stellar mass of the galaxy, , is then taken to be the total sum of the stellar particles inside . It follows that the three-dimensional stellar-half-mass radius, , is the radius that encloses half of the defined stellar mass. Finally we refer to the “stellar fraction” of the halo as the ratio between the quantified stellar mass and the halo mass: .
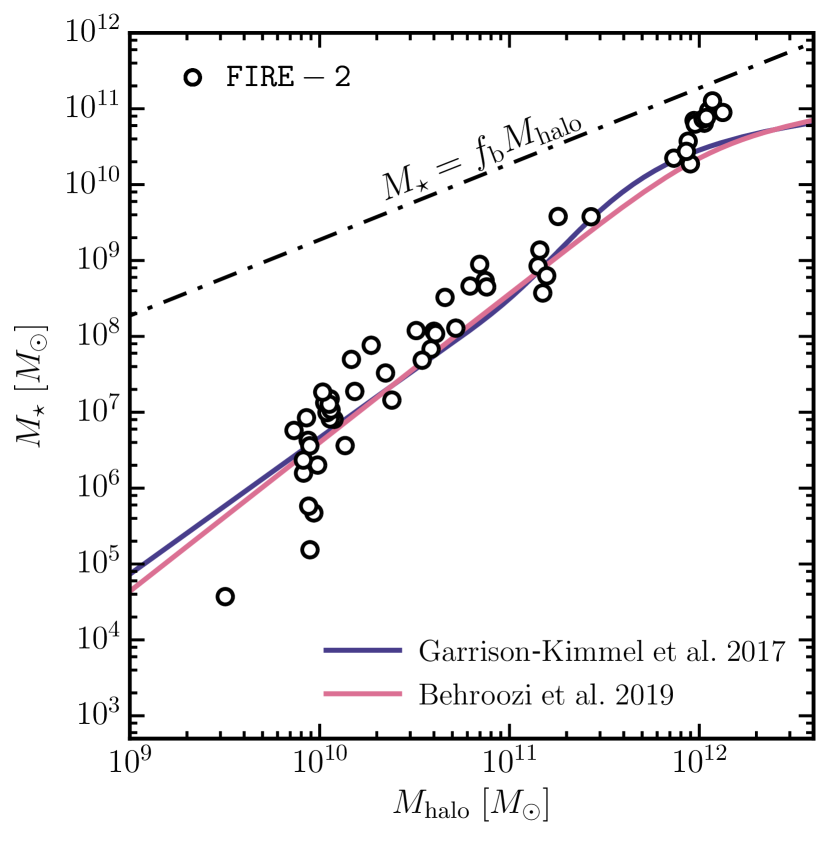
Fig. 1 outlines our sample of galaxies, where just the dark matter halo masses (from the FIRE-2 runs) are plotted against . We compare our sample with the the abundance matching relations presented in (sgk2017chaos, zero scatter) and behroozi2019um as the blue and pink curves, respectively, showing the best fit median abundance matching relations. Table LABEL:tab:halo.sample lists all of the halos galaxies in this paper, including their properties from the FIRE-2 runs. Given our large sample, we chose to divide our galaxy sample into four convenient classifications of objects using the convention from bullock2017small:222Note that these classifications are based on galaxies that span specific stellar mass ranges.
-
Ultra-Faint Dwarfs: Defined to have stellar masses of at . These are analogs of galaxies to be detected within limited local volumes around M31 and the Milky Way.
-
Classical Dwarfs: Defined to have stellar masses of at . These are analogs of the faintest galaxies known prior to SDSS.
-
Bright Dwarfs: Defined to have stellar masses of at . These are analogs of the faintest galaxies that can be seen in wide-field galaxy surveys.
-
Milky Way-Mass Halos: Defined to host spiral galaxies with stellar mass of at . At the peak of abundance-matching relation, this maps to the generally accepted range in Milky Way-mass halos of . Hereafter, we abbreviate Milky Way as “MW”.
Lastly, each zoomed-in halo run with full FIRE-2 physics has an analogous dark matter only (DMO) version. The individual dark matter particle masses in the DMO versions are larger by a factor of in these runs, where is the cosmic baryon fraction, but the initial conditions are otherwise identical. The density profiles quoted from the DMO simulations have been scaled in order to roughly account for the exclusion of the baryons. Other quantities are also adjusted accordingly: , and , for all of the results analyzed in the DMO runs. This provides a simple comparison set to understand the additional effects of energetic feedback seen in our FIRE-2 runs.
2.4 Radial profiles
For each main halo identified by ROCKSTAR, the center of the halo is quantified through a “shrinking spheres” iteration scheme (power2003inner; navarro2004inner): the center of mass of particles is computed in a sphere and then has its radius reduced by half and re-centered on the new center of mass. This is done successively until the sphere contains one thousand particles. The final center of mass position is determined at this last iteration. For our galaxies, this is done for the combined star and dark matter particles found inside the virial radius while the center of mass for the DMO analogs are done with only dark matter inside the halo.333We also compared our results with centers defined as the most bound dark matter particle in the halo determined by ROCKSTAR. We find no qualitative differences in our final results. The spherically averaged local density profile, , is constructed in 35 logarithmically spaced bins over . We expected systematic uncertainties in the binned density estimates to be extremely minimal due to large number of particles in each simulation sample. Throughout the entirety of this paper, we refer to these local density profiles as the density profiles for the dark matter halo.
2.5 Region of numerical convergence
We expect the innermost regions of our simulated halos to be affected by numerical relaxation. With a variety of galaxies simulated at different resolutions, we must account for resolution differently in each simulation. We do so using the method specified in power2003inner, where the effective resolution of cosmological simulations is related to the radius where the two-body relaxation timescale, , becomes shorter than the age of the universe, . Precisely, the radius at which numerical convergence is achieved, , is dependent on the number of enclosed particles, , as well as the mean density enclosed at the associated radius, , where is the total mass contained within radius . Therefore, is governed by the following equation:
| (1) |
A rigorous study of the numerical convergence for DMO halos and the FIRE-2 galaxies (dark matter with baryons) has been discussed in detail in hopkins2018fire. There, the convergence has been gauged as a function of mass resolution, force resolution, time resolution, and so on.
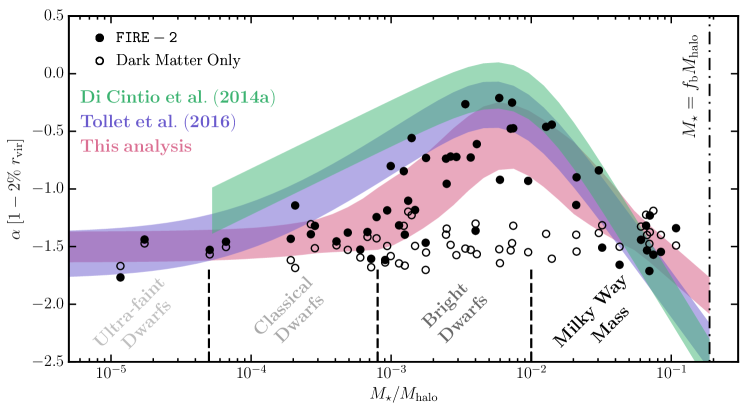
. The dispersion in increases from the stellar mass fraction from , the regime of classical dwarfs and the brightest dwarfs, to the MW-mass halos with . Feedback-induced core formation peaks at , the regime of the brightest dwarfs. At , the regime of classical dwarfs and ultra-faints, the impact of stellar feedback is negligible.
For the DMO simulations, convergence was shown to be well resolved to the radius at which the criterion satisfies with resolution level deviations. This typically equates to particles and is more conservative for the ranges of resolution levels analyzed in our halo sample. However, even at particles (resulting in a factor smaller radius of convergence), the convergence is good to in the density profile. Hereafter, we adopt as our resolution criterion to maintain consistency across all of our simulations. We define to be the radius at which the resolution criterion is fulfilled for the dark matter only analogs of each sample halo, meaning that is our best estimate of the numerically converged region. In hopkins2018fire, convergence for simulations ran with baryons can be much better or worse in comparison to their DMO analogs, but convergence is entirely dominated by the convergence from the baryons. So in the context of our galaxies, the criterion of convergence has much more to do with the star-formation dynamics and converging baryonic physics rather than having to do with the number of particles enclosing a specific region. With this, from the DMO analogs are applied to the galaxies of the FIRE-2 halos throughout this paper as a conservative estimate. For more details regarding the numerical convergence study of FIRE-2 halos, we refer to hopkins2018fire.
3 Stellar Fraction Relation with the Inner-Density Slope
We begin by comparing our catalog of galaxies with previous results in the literature. The stellar mass fraction, which we define as the ratio between the stellar mass and halo mass, , has a relationship with the slope of the dark matter density profile found at the innermost radii (di2013dependence; chan2015impact; tollet2016nihao). Following the convention of di2013dependence, the effect of feedback on the inner dark matter halo density can be captured by exploring the best-fitting power law for the dark matter density profile over a specific radial range, . di2013dependence suggested using fitted over the radial range since the lower limit of satisfied the power2003inner radius criterion of convergence for the majority of their halo sample.
Fig. 2 summarizes the relation between and the stellar mass fraction at for our simulations and compares to results from (di2013dependence, green band) and (tollet2016nihao, blue band). The analysis performed in (di2013dependence, green) included only stellar mass fractions down to , so we restrict their curve to that limit. The differences between the two curves included differences in cosmological models used, as noted in (tollet2016nihao). The black filled circles are our simulated FIRE-2 galaxies and the black open circles are the results for the DMO simulations (for which we use the stellar mass of their galaxy analogs). For all values of , the DMO analogs are cuspy, with , which is expected when assuming the behavior of an analytic NFW profile along with scatter induced by the mass-concentration relation (see bullock2017small).
The pink band captures our results using the fitting-formula shape suggested by tollet2016nihao:
| (2) |
where . We find that , , , , , and matches our results in the median. The general purpose of this fit is to guide the eye. We also binned by to compute a rough estimate of the standard deviation found at each stellar fraction. The width of the pink band roughly corresponds to the dispersion about the median. The width of the green and blue bands are set at a constant .
Ultra-faint and classical dwarf galaxies, with low stellar mass fractions of , have inner densities slopes of , the same as their DMO analogs. From there and increasing to , the inner dark matter densities of the bright dwarf galaxies transition to more cored profiles. At , our galaxies reach efficient core formation (shown more directly below), with . The diversity in core strength, as quantified by , is largest from to , with a variance of about the median. Note that one bright dwarf (m11q) at has what appears to be a cuspy central density. We checked the assembly history of this galaxy and verified that it is not particularly unusual, with its last major merger at . This galaxy does in fact have a constant density core (see Table LABEL:tab:halo.fits in the appendix), but at a radius pc, which is smaller than pc, meaning that it is not detected using this slope measurement. From the region of efficient core formation to MW masses, decreases. The scatter in remains large () until , which is in the range of the majority of the MW-mass halos. The scatter is minimized at for these galaxy masses.
Our findings agree with previous results in the literature for the region of efficiently peaked core formation: (di2013dependence; chan2015impact; tollet2016nihao). While we do not have a significant sample of ultra-faint dwarfs, we find negligible core formation for . The most significant difference we see with past results are (i) core formation that is less pronounced than previously reported for ( ) and (ii) more scatter in within the regime of the brightest dwarfs, with ranging from quite cuspy () to very cored () over the small range .
While results on at have proven useful for characterizing the effectiveness of core formation as a function of stellar mass fraction in dark matter halos in the past, more recent simulations have allowed predictions at even smaller radii. This can potentially lead to small cores being unaccounted for (see chan2015impact; wheeler2019resolved). For example, while Fig. 2 gives the impression that MW-mass halos will have density structure similar to the DMO (NFW-like) expectation, this is only because the log-slope at does not provide a complete picture. That is, while the log-slope at this radius is similar to that expected in the absence of galaxy formation, the overall density amplitude at of the virial radius is higher. In fact, as we will see in the upcoming section, at even smaller radii, our MW-mass halos have cored density profiles.444Also seen from the implementation of FIRE-1 physics for MW-mass halos in chan2015impact. This motivates a more complete examination into the shapes of profiles of simulated galaxy halos.
4 A Density Profile for Feedback-affected Halos
In this section, we present a new dark matter density profile that allows for constant-density cores of the type seen in our simulated galaxy halos. The new profile generalizes the einasto1965influence profile, which has proven to be an excellent fit for halos formed in DMO simulations. Our “core-Einasto” (cEinasto) profile extends its behaviour with one free parameter — a core radius, . After demonstrating that this profile does sufficiently well of capturing the density structure for a majority of the FIRE-2 halos, we follow the methodology employed in di2014mass, and provide fits for halo fitting parameters as functions of at . In Appendix LABEL:sec:cEinasto.Mstar we provide profile parametrization as a function of galaxy stellar mass, . We note that in the course of this analysis, we explored several different options for analytic cored profiles and found that the core-Einasto form was the best of these fits. In Appendix LABEL:sec:cNFW we show an example comparison between the core-Einasto profile and the penarrubia2012coupling (core-NFW) profile and demonstrate that core-Einasto provides a superior fit with the same number of free parameters.
4.1 Profiles for dark matter only halos
Dark matter halos in CDM are fairly well-described by the Navarro-Frank-White (navarro1997universal, NFW) double-power law profile. While power laws are robust for understanding and are analytically friendly to work with, it has been made apparent that dark matter density profiles are not perfectly captured by the power-law construction. navarro2004inner; navarro2010diversity demonstrated that higher resolution dark matter density profiles have log-slopes555We refer “log-slope” as the logarithmic derivative of the local density profile: . that decrease monotonically as approaches the center, which is not captured by the NFW at small . This indicates that the innermost regions of CDM halos are shallower than an NFW. Their study suggested a different radial profile for DMO halos, starting with the log-slope relation:
| (3) |
This results in the three-parameter Einasto profile
| (4) |
where is the so-called shape parameter that tunes how slow or fast the slope changes with radius, and (as well as ) is the radius (density) at which the logarithmic slope of the density profile is equal to , i.e. .
The shape parameter, , is a key component of Eq. (4). When obtained from Einasto profile fits to dark matter halos of cosmological simulations, it has been shown to correlate with the overdensity peak height of the dark matter halo and is calibrated based on the cosmology (e.g. gao2008redshift; dutton2014cold; klypin2016multidark). Fixing has been shown to provide a good fit for DMO halos throughout the literature (prada2006far; merritt2006empirical; gao2008redshift). With this choice, becomes a two-parameter function, one that still provides a better fit to DMO simulations than the two-parameter NFW profile.666Of course, one can acquire even better density profile fits to as good as for halos in our mass range when leaving as a free parameter, as this value tailors to each shape to the dark matter halo. This however, leaves ambiguity in the value of , as this is now dependent on . Recently, wang2019zoom have shown that the two-parameter version of provides a adequate fit for DMO halos over 30 orders of magnitude in halo mass. We fix in what follows.
4.2 Cored profile for feedback-affected CDM halos
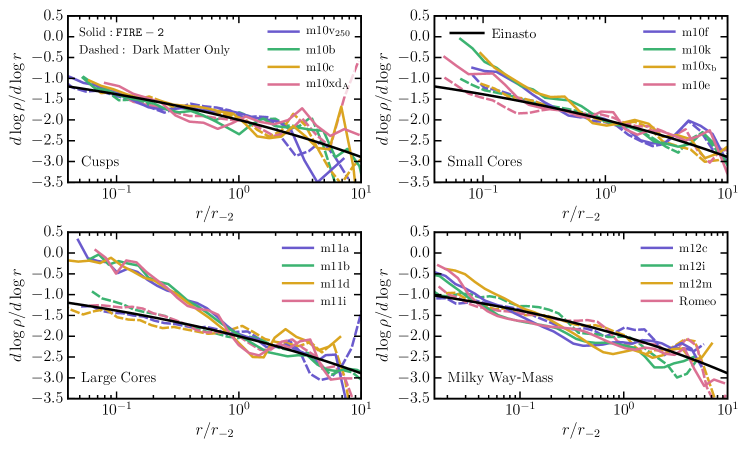
We follow navarro2004inner and consider the behaviour of the log-slope of the density profiles for our galaxy halos as a function of radius. Fig. 3 shows log-slope profiles for four classifications of halos in our full-physics runs: “cusps”, “small cores”, “large cores”, and “Milky Way-mass halos”. The halos simulated with FIRE-2 physics are plotted as colored solid curves while their respective DMO analogs are shown as dashed lines with the same color. Starting with the upper-left panel, low-mass dwarfs tend to be hosted by cuspy dark matter halos. Similarly, halos with small cores tend to host higher-mass classical dwarfs. Halos with the largest cores correspond the brightest dwarf galaxies, which we have seen previously in Fig 2, while MW-mass galaxies have dark matter halo profiles that are more complicated (and are discussed further below). For reference, the solid black line shows the log-slope of the Einasto profile, Eq. (3). The galaxies and DMO analogs have their radii normalized by from the DMO runs.
As expected, Eq. (3) captures the log-slope trend of the DMO halos. The same is true for FIRE-2 runs with low stellar mass fraction (“cusps” in this case). Halos labeled “small cores” tend to slightly deviate from Eq. (3), with upturns in the log-slope trend for . The lower left panel contains galaxy halos (solid lines) that approach at small radii – that is, a true core. This behavior never occurs beyond of the analogous DMO profiles, and cores are only see at . MW-mass halos have more complicated profiles. Their log-slopes tend to lie below the log-slope of DMO analogs from ; this is a consequence of baryonic contraction. However, we see that at , the log-slopes begin to rise towards 0, indicating that small cores can form in our MW sample.
In order to capture the behavior illustrated in Fig. 3, we start by writing a more general form of Eq. (3) that allows the log-slope to increase more sharply within a physical core radius, :
| (5) |
Implemented here is a radially-dependent damping function, , which is designed to control the rate of which the profile dampens within . The variable plays a similar role as in Eq. (3), but will no longer be the radius where the log-slope is equal to owing to the presence of . We demand that the behavior of the damping function satisfies the limiting cases of and as in order to (i) capture the qualitative expectations of cores that can substantially vary in size and (ii) revert back to the form of in the absence of a core.
We adopt the following form:
| (6) |
such that
| (7) |
In particular, the log-slope of the density profile approaches zero more quickly for larger values of . Integrating out Eq. (7) gives us a cored counterpart of , the core-Einasto profile:
| (8) |
Here, is a density free parameter in the fit. In what follows we set , which reduces the expression to a three-parameter profile. In the limiting case of , we re-acquire , where now . Note that the central density with the presence of a core, , is parametrized as
| (9) |
Alternatively, we can reparameterize by mapping to , the density (and radius) where the log-slope is equal to . This allows us to re-express Eq. (8) as
| (10) |
which certainly work in our zero core limit to re-acquire Eq. (4). However, this expression now introduces an additional free parameter, , that can likely lead to degenerate results in acquiring and . With that, we prefer to adopt the form of Eq. (8) for our analysis hereinafter. Analytic expressions for the mass profile, gravitational potential, and energy for the core-Einasto profile are presented in Appendix LABEL:sec:analytic.cEinasto.
4.3 Resulting profile fits
All functional fits are performed using the Levenberg-Marquart minimization algorithm. We restrict our radial density profile fits to the radial range of to . Best-fit models are obtained by simultaneously adjusting the parameters of the analytical density profiles in order to minimize a figure-of-merit function, defined by
| (11) |
which weights all the logarithmic radial bins equally and, for a given radial range, is fairly independent of the number of bins used (navarro2010diversity). That is, the minimum figure-of-merit, denoted as , quantifies the residuals of the true profile from the model caused by shape differences induced in the fitting routine.
4.3.1 Local dark matter density
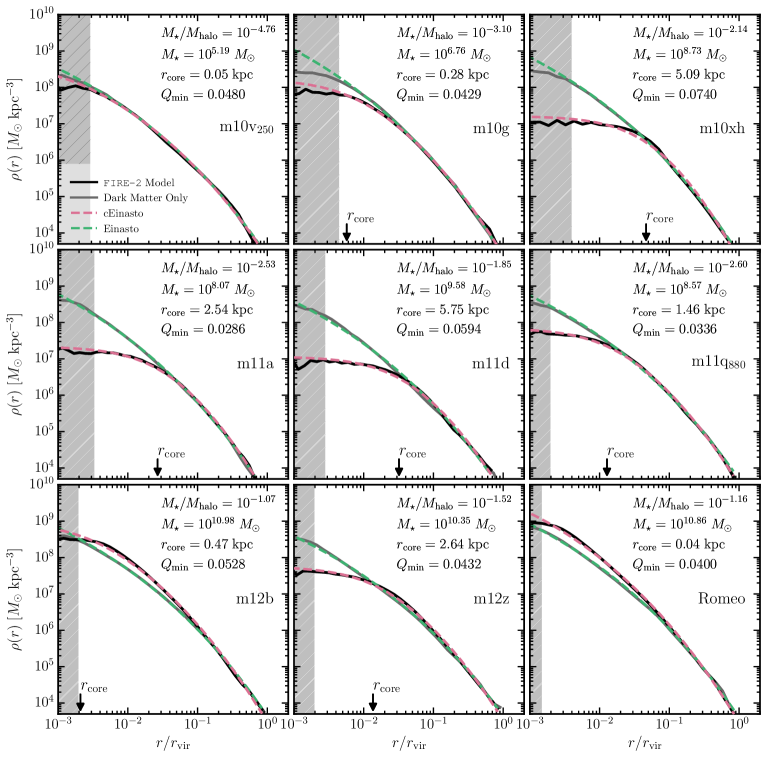
Fig. 4 provides example fits for a sample of dark matter density profiles. Dark matter halos simulated using FIRE-2 (black curves) are fitted with (pink dashed) while the DMO analogs (grey line) are fitted with (dashed green). In each panel, we list the galaxy’s stellar mass fraction (), stellar mass (), dark matter core radius () given by fitting , and the goodness-of-fit () from fitting . The location of the best-fit dark matter core radius, scaled by the virial radius, is indicated by the black arrow in each panel. Table LABEL:tab:halo.fits lists the fit results for all of our galaxies, including the fit parameters and the values. We can see that the value is effectively determined for a wide range of galaxy sizes. For even the worst profile fits (e.g. m10xh with ; top-right panel), the value of is still identified at the location where one’s eye might pick out a dark matter core in the local density profile.
As a way of examining the robustness of Eq. (8), we fit core-Einasto to the DMO analogs and found that in every case the best-fit core-radii were either zero or smaller than the radius of convergence. This provides confidence that this profile does not force or impose cores that do not exist in the resolved regions of the halo. However, it does suggest that values smaller than the convergence limit should not be taken as robust indications for the existence of real cores. For example, the upper left panel of Fig. 4 shows an fit to m10v250 (baryon simulated), a profile that is unaltered by feedback in the resolved region owing to its small stellar mass. The best-fit core radius () is much smaller than the radius of convergence () in this case.
While we find success in characterizing dwarf galaxies with , almost all of the MW-mass halos have cored regions that are more sharply pronounced than enabled by the profile. As one can see (e.g. m12b and Romeo), the values of from the fits do not coincide with the locations of the bend seen in the simulated profiles.777The core radius of Romeo from the fit does not appear in Fig. 4 (bottom right panel) since the fitted value of is located inside the region of numerical convergence (). Based on our entire sample of MW-mass halos, we find that the profile performs less well for MW-mass halos that have both a small central dark matter core and baryonic contraction in the inner densities. On the other hand, MW-mass halos with little evidence of either baryonic contraction (e.g. m12z) or a core are successfully characterized by . MW-mass halos with no core, but with only baryonic contraction, are also well-modeled by . In Appendix LABEL:sec:cEinasto.BC, we formulate a more general core profile with one additional free parameter that captures the behavior for baryonic contracted halos with cores. This allows us to accurately quantify the core radii for the rest of our MW-mass halos.
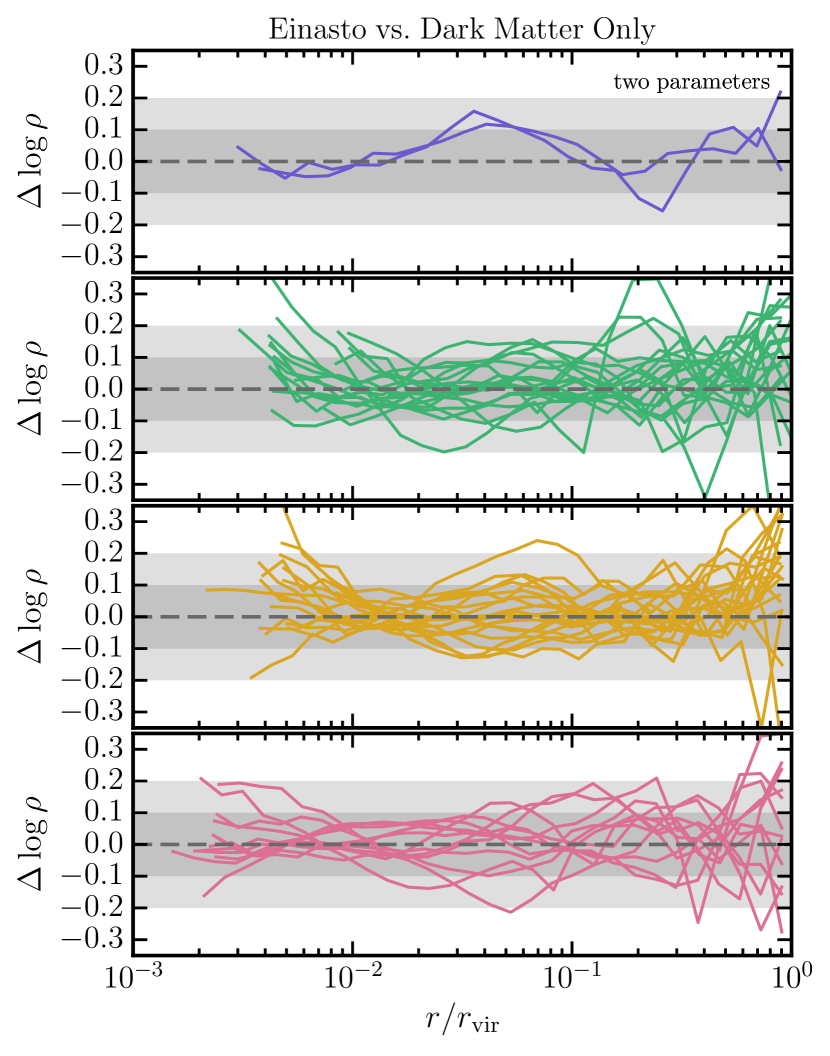
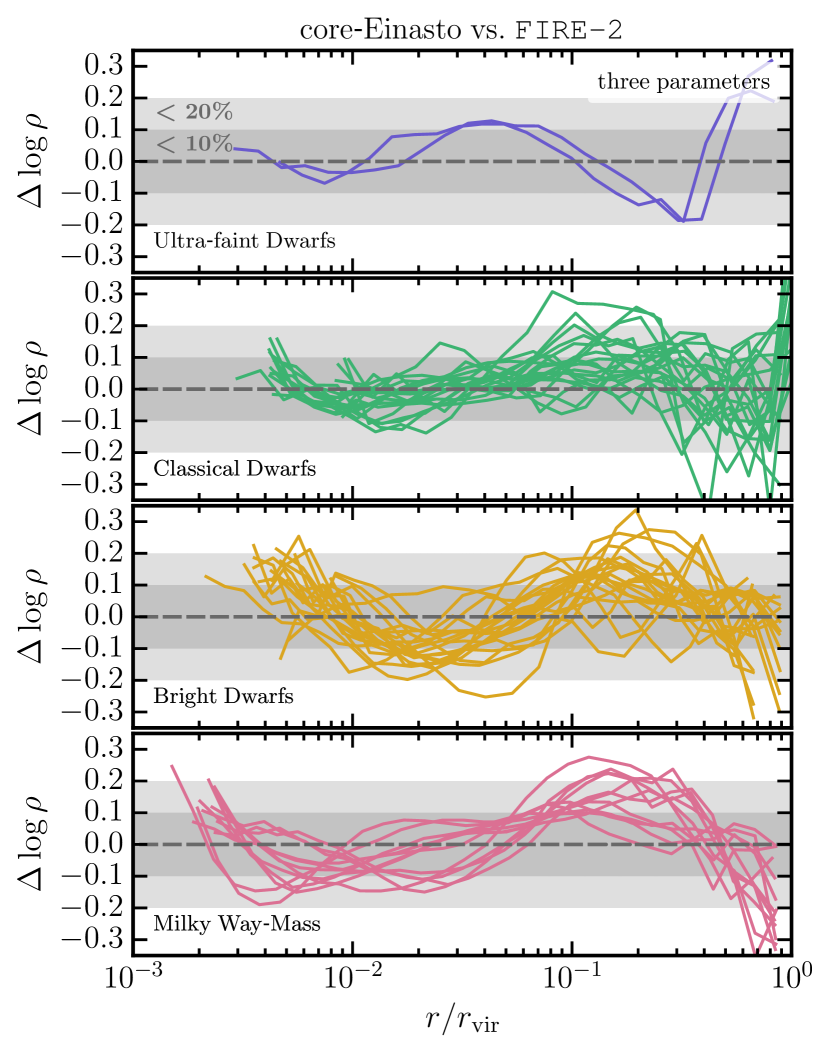
4.3.2 Density profile residuals
Profile residuals of the local dark matter density are presented in Fig. 5 for DMO analog fitted with the Einasto profile (left) and to the dark matter halos of the FIRE-2 physics runs fit to core-Einasto (right). Results are split into the four galaxy classifications defined in Section 2. The residuals for the left and right columns are comparable, which is remarkable given that the right-hand fits have only one additional free parameter to account for the full impact of complex galaxy formation physics. Notice that the largest deviations are present large radii (). This behavior has been seen in the past for DMO halos, where the outer regions may not be fully relaxed (e.g. ludlow2010pseudo; ludlow2016relations), and may contain large substructures.
While we have only two ultra-faint galaxies (blue curves) in our sample, both galaxies are well described to for a majority of the radii. This is unsurprising, as these halos lack the requisite star formation to induce cores; the core-Einasto fit is therefore effectively the same as a standard Einasto fit, with values that are smaller than the convergence radius. Almost all of the classical dwarf galaxies (green curves) have excellent core-Einasto fits, with deviations in the range at worst. At small radii , core-Einasto is shown to be sufficient in fitting the FIRE-2 halos compared to their DMO analogs in the same radial regions. For a majority of the brightest dwarfs in our sample, deviations are constrained within . For MW-mass halos, the quality of the fit can range from quite good to as bad as . As mentioned previously, the worst fits are for the MW-mass halos impacted by both baryonic contraction and feedback-induced core formation at small radii. We find deviations of in the inner-most regions for profiles of MWs with just cores (e.g. m12z in Fig. 4) or just having baryonic contraction with no cores.
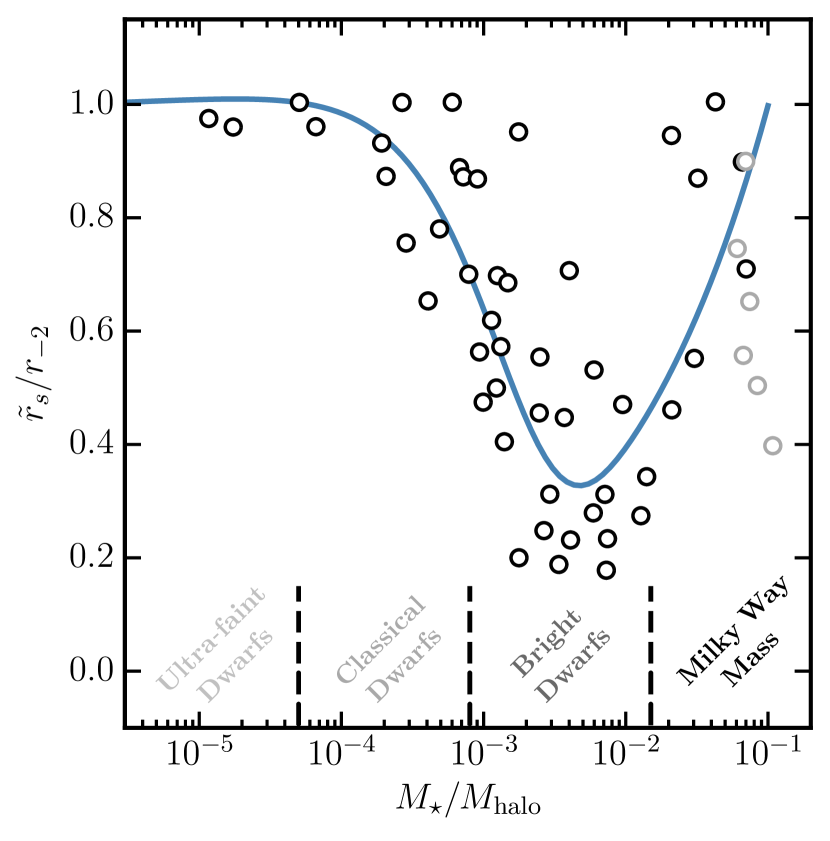
In both columns, there are are hints of a sinusoidal feature in the residuals. This behavior is not unusual when simplified fits are compared to detailed dark matter halo profiles (e.g griffen2016caterpillar). Reducing the residual behavior even more would require more free parameters in the form of in Eq. (5) and/or allowing the value of to vary from halo-to-halo. However, given that the gross residuals for our core-Einasto fits to the FIRE-2 runs are close to those of Einasto fits to DMO runs, we are satisfied that the given parameterization provides a useful balance between simplicity and accuracy. In Appendix LABEL:sec:cNFW we do find that our halos are modeled better by the three-parameter core-Einasto profile than two alternative three-parameter profiles: the core extension for the NFW from penarrubia2012coupling and Dekel+ from dekel2017profile and freundlich2020dekel.
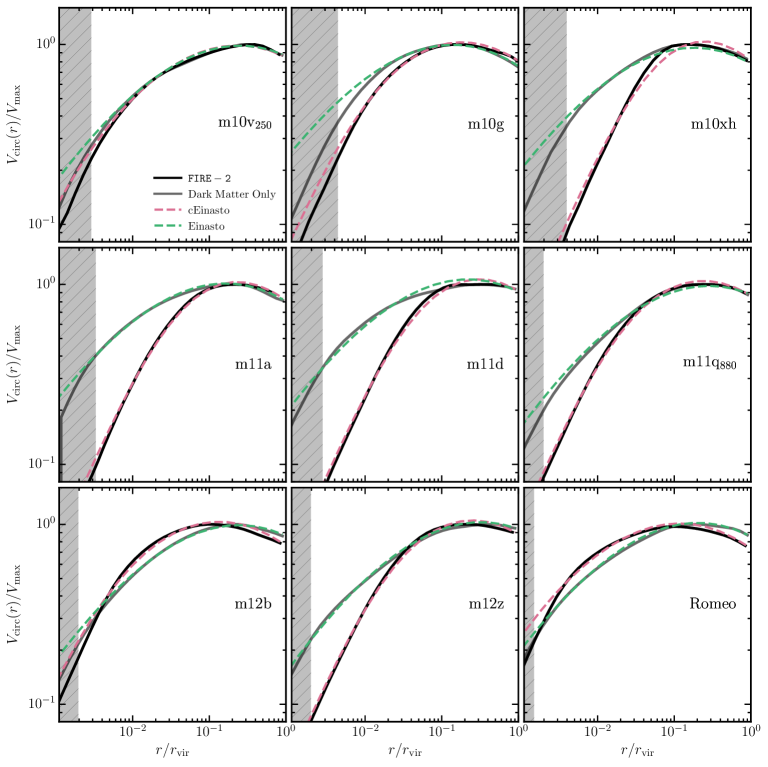
4.3.3 Dark matter circular velocity
Fig. 6 provides an alternative view of the results shown in Fig. 4: it shows the circular velocity curves of the dark matter component,888For the analysis of observed galaxies, spherically averaged rotation curves are typically presented using their total mass, i.e., their combined baryonic and dark matter components. We chose to show just the dark matter components here to compare with our core-Einasto model. , for the same halos presented in Fig. 4, each normalized by of the dark matter curve. The analytical profiles for and are plotted using Eqs. (LABEL:eq:cored.einasto.integrated.mass) and (LABEL:eq:einasto.integrated.mass), respectively, for the values obtained from the fits shown in Fig. 4. These analytical curves are normalized by the values of the simulated halos to which they are fitted. For profile fits over-estimating (or under-estimating) the mass found in the simulated profiles by (e.g., m10xh and m11d), the most substantial effects can seen at the outer radii, near where is attained. However, even for the worst profile fits in our sample, the central density normalization is well-captured for dwarf galaxies of varying stellar mass fractions.
4.4 Parametrization of the physical core radius
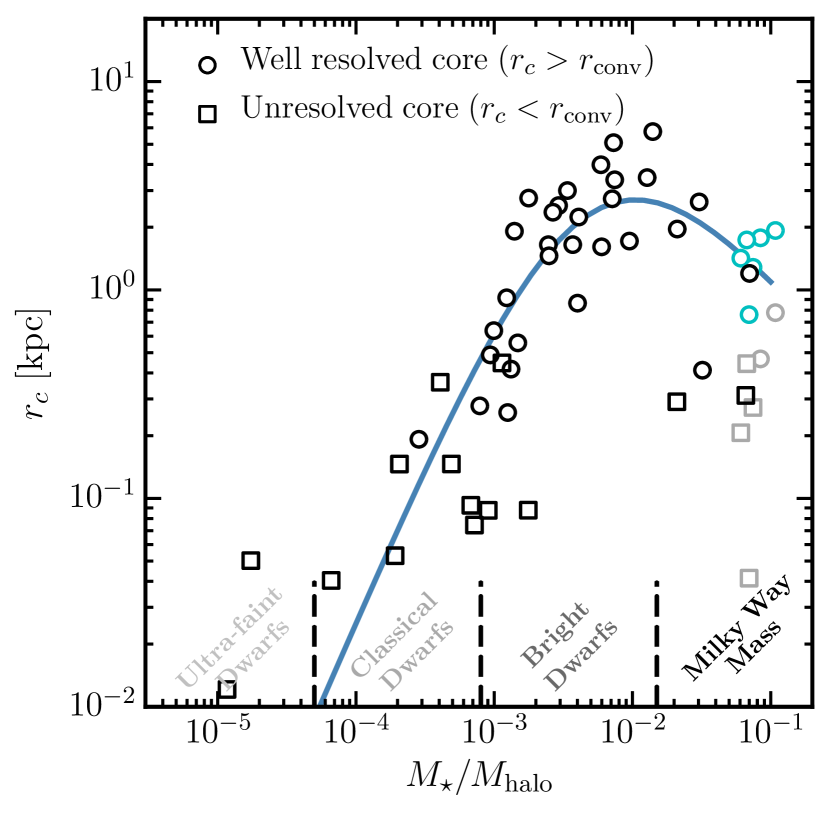
For the left plot in Fig. 7, we show the relationship between and the fitted values of . Circular points denote the values of that we verify as resolved cores (with for the local dark matter density profiles). This sample includes the MW-mass core radii fit using using the four parameter function (cyan highlights) described in Appendix LABEL:sec:cEinasto.BC instead of their values from (shown by gray points for reference). Squares denote best-fit core radii that have values smaller the numerical convergence region (). It is important to note that in some cases, we obtain fit values of that are formally smaller than yet large enough that the halo is not well-described by the standard form. This comes about because dark matter halos impacted by stellar feedback produce dark matter profiles that are no longer self-similar in nature, meaning the core-Einasto fit balances and to accommodate the shape of the density profile.
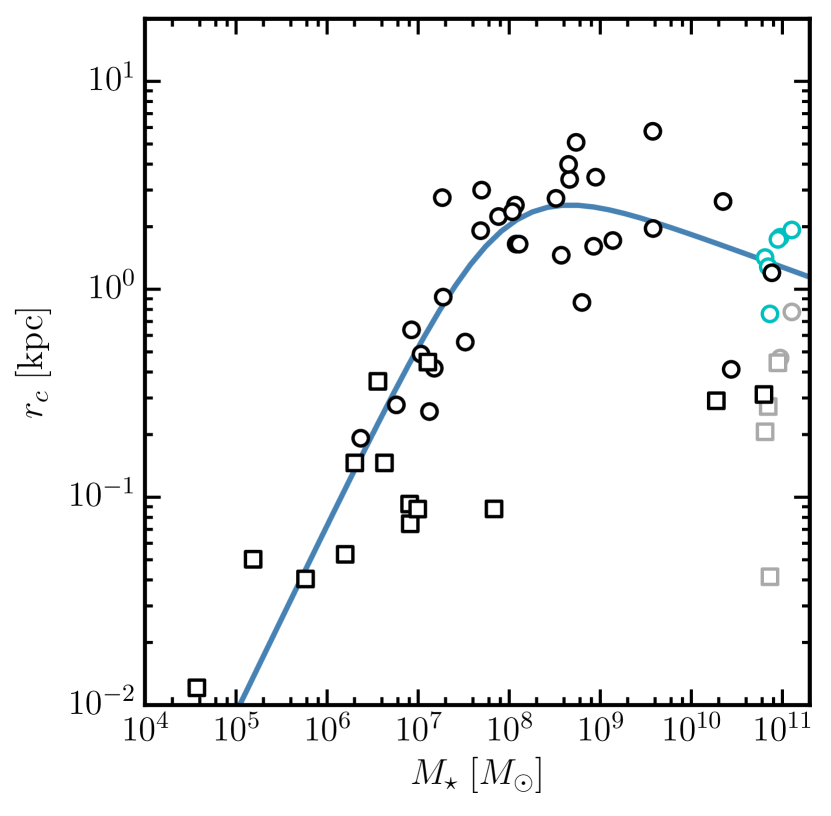
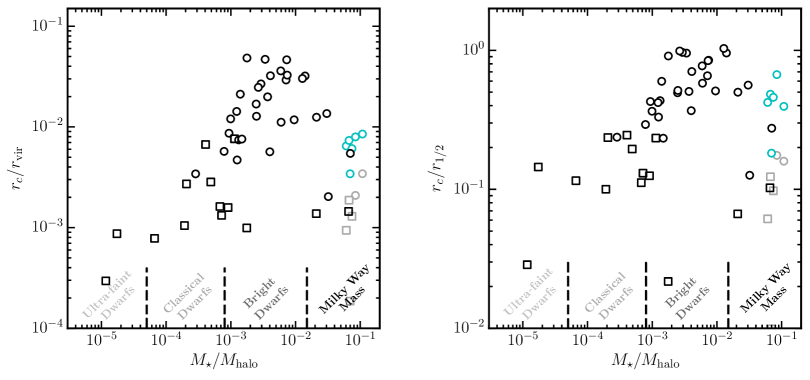
We see that our robustly-determined values (), begin to appear at the higher mass end for the classical dwarf galaxy regime, , with values that are physically quite small, . As the stellar mass fraction increases toward the region of bright dwarf galaxies, , the sizes of the core radii, , increase with . Importantly, the largest dark matter cores, , coincide with the stellar mass fraction at the peak core formation that we have seen previously (). A majority of the galaxies at the MW-mass scale have dark matter cores as , though two remain fairly cuspy (m12r and m12w). To provide further insight into observations of real galaxies comparable to the simulations analyzed here, the right plot in Fig. 7 shows the trend of with . The largest cores tend to form in galaxies with . Notably, a significant amount of scatter is seen for fixed value of kpc, which tends to be apparent for galaxies with .
The formation of small cores for MW-mass halos using FIRE-1 was discussed in chan2015impact, where they found that small cores for MW-size galaxies tend form in the low-mass galaxy progenitors at , which have stellar-to-halo mass ratios suitable for core formation. These progenitors have their resulting innermost dark matter profile amplified at due to baryonic contraction. This phenomena also drives out old stars formed in situ in MW-like galaxies (el2018ancient). Other simulation groups have not reported the existence of small cores at the MW-mass regime. This could however be due to differences in numerical resolution. For example, the NIHAO simulations presented in tollet2016nihao and maccio2020nihao study MW-mass halos at a lower resolution than ours, with convergence down to kpc compared 330-500 pc in our runs (see Table LABEL:tab:halo.sample). The MW cores in our simulations are kpc in size. Such cores would be difficult to form without having a convergence radius smaller than this limit.
| Parameter | ||||||
| 1.21 | 0.71 | 0.011 | 2.31 | 1.55 | ||
| 1.33 | 1.93 | 0.55 | 1.06 | 0.90 | ||
| Note. Use Eq. (LABEL:eq:rcore.fit) for either or . | ||||||