A supernova candidate at in \xmm archival data
Abstract
During a search for X-ray transients in the XMM–Newton archive within the EXTraS project, we discovered a new X-ray source that is detected only during a 5 min interval of a 21 h-long observation performed on 2011 June 21 (EXMM 023135.0–603743 (catalog ), probability of a random Poissonian fluctuation: ). With dedicated follow-up observations, we found that its position is consistent with a star-forming galaxy (– yr-1) at redshift ( Mpc). At this redshift, the energy released during the transient event was erg in the 0.3–10 keV energy band (in the source rest frame). The luminosity of the transient, together with its spectral and timing properties, make EXMM 023135.0–603743 a gripping analog to the X-ray transient associated to SN 2008D, which was discovered during a Swift/XRT observation of the nearby ( Mpc) supernova-rich galaxy NGC 2770. We interpret the XMM–Newton event as a supernova shock break-out or an early cocoon, and show that our serendipitous discovery is broadly compatible with the rate of core-collapse supernovae derived from optical observations and much higher than that of tidal disruption events.
1 Introduction
High energy transients for the most part are discovered in the hard-X/gamma-ray band by instruments monitoring a large fraction of the sky. In the soft X-ray band ( keV), instead, the most sensitive instruments have small fields of view (less than a few tenths of a squared degree). However, some missions carrying narrow-field X-ray instruments have spent a long time in orbit, accumulating many years of exposure time, which makes it possible the serendipitous discovery of rare transient events during observations of unrelated targets. In particular, XMM–Newton has been in orbit since December 1999 and has the largest effective area among current imaging X-ray telescopes. It is therefore the ideal mission to search for faint transients in the soft X-ray band.
One of the objectives of EXTraS,111Exploring the X-ray Transient and variable Sky; see http://www.extras-fp7.eu. an European-Union-funded project aimed at mining the XMM–Newton archival data in the time domain (De Luca et al., 2016), was the identification of short-lived transient X-ray sources. In particular, we developed an algorithm to search for new point sources that were sufficiently bright only for a small fraction of the observation and could not be detected by a standard analysis of the full exposure. Such X-ray sources are therefore not included in the XMM–Newton serendipitous source catalogues released by the XMM–Newton Survey Science Centre222See http://xmmssc.irap.omp.eu/. (Rosen et al., 2016).
We performed a systematic analysis of all the observations used for the 3XMM-DR5 catalogue (Rosen et al., 2016) and, after the careful screening of the results, we derived a catalogue of 136 new transients with a duration 5 000 s, which is publicly available through the EXTraS online archive.333See the EXTraS Transient Catalogue at http://www88.lamp.le.ac.uk/extras/query/extras_transients. Among these transients, EXMM 023135.0–603743 is the one with the shortest duration (315 s) and is the subject of this work. In Section 2, we describe the procedures that allowed us to discover this transient. In Section 3, we report on the results of the timing and spectral analysis of the X-ray data, while Section 4 is devoted to the follow-up optical observations we carried out. The discussion of the nature of the transient follows in Section 5, together with some considerations on the rate of such events and the perspectives for future missions.
2 EXTraS pipeline to search for X-ray transients
2.1 Data preparation
The European Photon Imaging Camera (EPIC) on board XMM–Newton consists of one pn (Strüder et al., 2001) and two MOS (Turner et al., 2001) CCD cameras sensitive to photons with energy between 0.2 and 12 keV. Each camera is installed behind an X-ray telescope with 58 nested grazing-incidence mirrors and focal length of 7.5 m.
The EPIC data were processed with version 14.0.0 of the Scientific Analysis Software (SAS). The analysis was performed only on events with valid pattern (0–4 for the pn and 0–12 for the MOS) and FLAG=0 (to avoid pixels close to CCD boundaries and dead columns). In contrast to standard analysis, the search for new X-ray sources was performed without the exclusion of the time periods in which the particle background was particularly high.
2.2 The EXTraS procedure
The EXTraS process aimed at the discovery of new transients consists of the division of each EPIC observation into sub-exposures and in the search for new point sources that might have been bright only for short time intervals. In order to search over a broad range of time scales, the time-resolved source detection is applied to time intervals of variable duration, determined through a preliminary search for an excess of counts in limited time periods in small regions of the detector.
This step of the analysis is performed using the Bayesian Blocks (BB) algorithm (Scargle, 1998; Scargle et al., 2013) in the 0.2–12 keV; 0.5–2 keV; 2–10 keV energy bands. This adaptive-binning algorithm finds statistically-significant changes in the count rate by maximizing the fitness function for a piecewise-constant representation of the data, starting from an event list.
To reduce the number of spurious detections and to sample a broad range of time intervals, we modified the BB algorithm to account for changes in the background rate. The new algorithm can deal with highly-variable background such as that found in XMM–Newton data during soft-proton flares. For each observation, the field of view is divided in partially-overlapping box regions and the BB algorithm is run on each of them. Regions with no significant variability with respect to the local background light curve return only one block (a time bin) covering the whole observation, while regions containing candidate transients return more blocks.
To evaluate properly the background light curve and minimize the contribution from the possible variability of known sources, the BB algorithm excludes regions of source-intensity-dependent size around the point sources detected in the full observation. To examine also these regions, where interesting transients might appear (especially in crowded X-ray fields, such as star-forming regions and nearby galaxies), we developed a specific algorithm. For each observation, it creates images integrated over a fixed time interval (1000 s) of regions with side of around the sources excluded by the BB algorithm and tests for the presence of excesses in addition to known sources on a grid of fixed positions by a sliding-cell search. After performing this analysis on each time bin, all intervals where the same source was active are merged. Among the time segments identified either in this way or by the BB analysis, we selected only those with duration shorter than 5 ks (the minimum duration of standard EPIC exposures) and coming from regions with a spatial distribution of the events that is better fit (at 5 confidence level) with the addition of a point source rather than by a simple isotropic background.
In the time interval obtained from the merged segments, a source detection based on the SAS task emldetect is performed on the combined EPIC MOS and pn images accumulated in the five standard 3XMM energy bands (0.2–0.5, 0.5–1, 1–2, 2–4.5, and 4.5–12 keV). The sources detected with in the cumulative 0.2–12 keV band444This is the standard detection threshold adopted for the XMM–Newton source catalogues; , where is the probability that the count excess was due to a random Poissonian fluctuation (see Cash, 1979, and http://xmm-tools.cosmos.esa.int/external/sas/current/doc/emldetect/node3.html for an extensive description of the parameter). are compared with the reference source list for the whole observation, looking for new point-like X-ray sources.
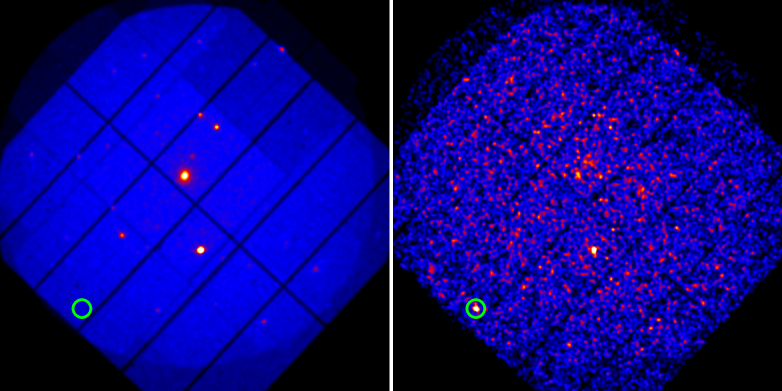
After the exclusion of bright pixels and particle tracks, we obtained about one thousand transient candidates from 7800 3XMM-DR5 observations. The candidates with the largest likelihood of detection (we set the threshold at , leading to 596 sources) were visually screened to exclude spurious detections or persistent sources erroneously classified as transients. The result of this screening process is the publicly available EXTraS transient catalogue, which contains 136 new transient X-ray sources. Among them, EXMM 023135.0–603743 was detected in the shortest time interval (315 s; see Fig. 1).
3 EXMM 023135.0–603743: XMM–Newton data analysis and results
3.1 Detection parameters and astrometry
In the observation where EXMM 023135.0–603743 was discovered (obs.ID: 0675010401, started on 2011 June 21, exposure time of approximatively 77 ks, see Table 1), the two MOS and the pn cameras were set in Full Frame mode (time resolution of 2.6 s and 73.4 ms, respectively); all detectors were operated with the thin optical-blocking filter.
The main parameters characterizing the detection of EXMM 023135.0–603743 are reported in Table 1. To refine its position, we performed an astrometric correction by cross-matching the brightest sources detected in the XMM–Newton observation with the USNO B1 optical catalogue (Monet et al., 2003). The IRAF tasks geomap and geoxytran were used to estimate the roto-translation between the X-ray and USNO B1 optical coordinates of the reference sources and calculate the corrected X-ray coordinates of EXMM 023135.0–603743: , (J2000). The 1 error radius, which was calculated as the sum in quadrature of the systematic astrometric error ( rms) and the statistical error on the coordinates measured for the source, is . Within this uncertainty, the position of EXMM 023135.0–603743 is consistent with a blue galaxy visible in the 2nd Digitized Sky Survey images and with no redshift reported in literature.
| Parameter | EPIC | pn | MOS1 | MOS2 |
|---|---|---|---|---|
| DET_MLaaIn the 0.2–12 keV energy range and only in the 315 s time interval in which EXMM 023135.0–603743 was detected. | 61.8 | 30.3 | 13.8 | 20.1 |
| SCTSaaIn the 0.2–12 keV energy range and only in the 315 s time interval in which EXMM 023135.0–603743 was detected. | 54.7 | 27.3 | 11.1 | 16.3 |
| Exposure time (ks) | – | 60.2 | 75.8 | 76.9 |
3.2 Light curve and spectrum
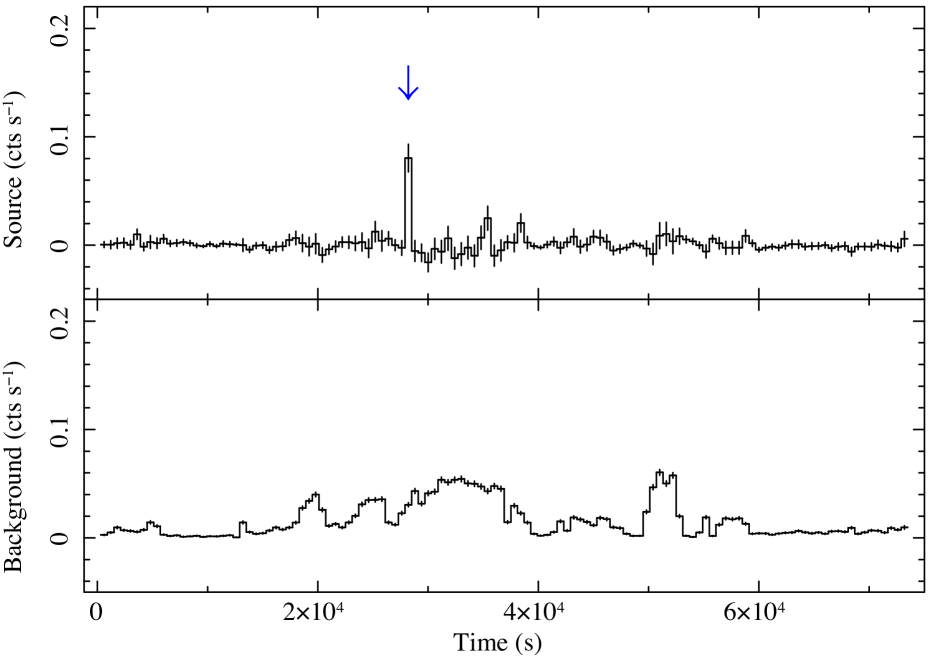
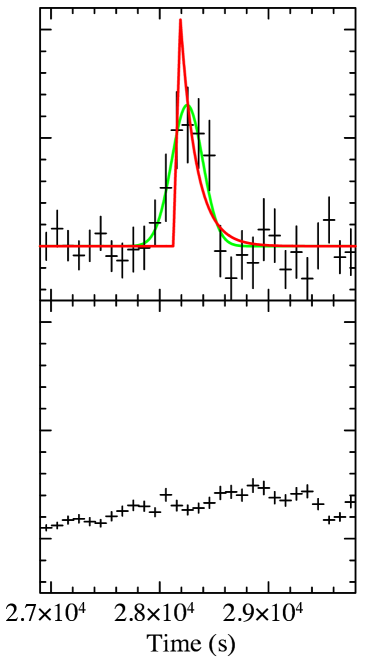
The EPIC background-subtracted light curve of the source and the background (extracted from circles with radii of 20 and 60 arcsec, respectively) in the 0.5–5 keV energy band (the band in which the signal-to-noise ratio is maximized) are shown in Fig. 2. Although the background is very strong and variable, a significant count-rate excess is visible 28 ks after the start of the observation. As shown in Fig. 2, this flare can be fit with a Gaussian centered at 2011 June 21 18:50: s UT and with s. Integrating the Gaussian, we derive that the flare is formed by 47 cts in the 0.5–5 keV band. The addition of a constant component to the model is not required, with a 3 upper limit of cts s-1, which means that the emission outside the flare is perfectly consistent with the background level. More complicate, asymmetric models are not required to describe the flare (see also the discussion in Sect. 5.1).
The X-ray spectrum of the transient was extracted from a circle with 40 arcsec radius in the 315 s interval during which it was detected and the corresponding background spectrum from a nearby source-free region. The spectral analysis was carried out with the fitting package XSPEC and adopting the abundances by Wilms et al. (2000). Using a power-law model absorbed both in our Galaxy (we fixed the column value in the XSPEC model component tbabs to cm-2; Dickey & Lockman 1990, Kalberla et al. 2005) and in the host galaxy (ztbabs with , see Sect. 4.1), we derive a photon index and a 95% evidence for higher-than-Galactic absorption, indicating a local component in the host galaxy, cm-2. The goodness of the fit, evaluated as the percentage of Monte Carlo realizations that had Cash statistics (C-stat) lower than the best-fitting C-stat, is 86% (we performed simulations). The average luminosity (for Mpc, see Sect. 4.1) was erg s-1 in the 0.3–10 keV band (in the source rest frame). Therefore, the total energy of the flare was erg. The peak luminosity was erg s-1 and the 3 upper limit on the persistent X-ray luminosity outside the flare interval is erg s-1. A somewhat better fit (76% of the realizations with C-stat lower than the best-fit one) is obtained with a blackbody model. The temperature is equivalent to keV and for the local absorption we obtain cm-2, but the value is loosely constrained and consistent with zero. Assuming this model, the total energy emitted was erg.
4 Follow-up optical observations of EXMM 023135.0–603743
4.1 CTIO/Blanco telescope observations
We observed the field of EXMM 023135.0–603743 with the 4-m CTIO/Blanco telescope equipped with the COSMOS spectrograph. A series of three consecutive spectra, each one lasting 900 s, was obtained on 2016 July 12 starting at 09:20 UT. The spectroscopic observations were executed using a 1.3 arcsec slit, the r2K grism (GG455 filter), covering the 4955–9023 Å wavelength range with a dispersion of 1 Å/pixel. The spectral reduction and extraction were carried out using standard procedures under the ESO-MIDAS555See http://www.eso.org/projects/esomidas/. package. The wavelength calibration has been checked against sky emission lines. From the detection of several emission (H, [O iii], H, [N ii]) and absorption lines, we derived a redshift (Fig. 3). With the cosmological parameters in Planck Collaboration et al. (2016, assumed throughout the paper), this redshift corresponds to a luminosity distance Mpc (Wright, 2006).

4.2 La Silla (MPG/ESO 2.2m GROND)
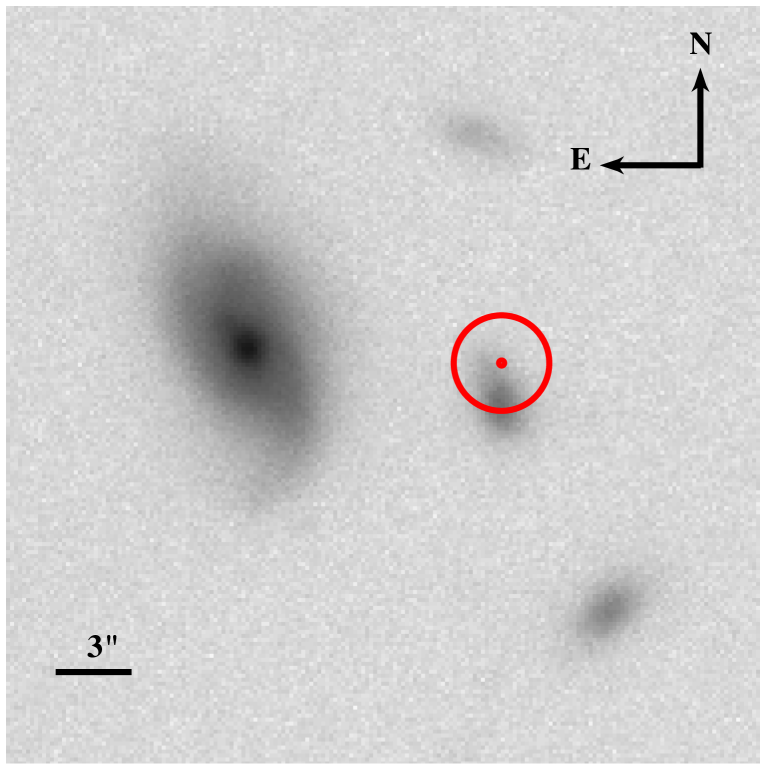
The transient field was observed with the seven-channel imager GROND (Greiner et al., 2008) on 2016 July 30 starting at 08:30 UT at 1″ seeing (Fig. 4). The effective exposure was 36 minutes in , and 30 minutes in . The GROND data were reduced in the standard manner (Krühler et al., 2008) using pyraf/IRAF (Tody, 1993; Yoldaş et al., 2008). The optical/NIR imaging was calibrated against the Gaia SkyMapper Southern Sky Survey666See http://skymapper.anu.edu.au. (Gaia Collaboration et al., 2018; Wolf et al., 2018a) catalogs for , and the 2MASS catalog (Skrutskie et al., 2006) for the bands. This results in typical absolute accuracies of 0.03 mag in and 0.05 mag in .
| Photometric band | Magnitude |
|---|---|
From the available optical and near-infrared photometry (Table 2), and the optical spectrum, it is possible to derive some basic physical properties of the host galaxy. We have used the GOSSIP spectral energy distribution (SED) fitting package (Franzetti et al., 2008) to model the SED of the galaxy, starting from the multiband photometric information, and using the PEGASE2 population synthesis models (Fioc & Rocca-Volmerange, 1997) coupled with a family of delayed star formation histories (Gavazzi et al., 2002) to derive the spectral templates. From the properties of the best fitting SED model, we estimate a galaxy stellar mass of (2– , an absolute -band magnitude of 18.49, and a star formation rate yr-1. For and independent check, we also used the Le PHARE (Arnouts et al., 1999; Ilbert et al., 2006) package with 70 templates from both the PEGASE2 and BC03 (Bruzual & Charlot, 2003) and we found that predictions of the best-fitting individual templates fall within the ranges (1.5– for the mass and 0.1– yr-1 for the SFR.
A direct measurement of the galaxy SFR can be obtained also from the H line luminosity, as measured from the galaxy optical spectrum. To have a reliable absolute flux calibration for the spectrum, we scaled the spectroscopic fluxes so that the magnitude one can derive by integrating the spectroscopic flux over the -band photometric passband matches the -band magnitude from the GROND photometry. After this rescaling, the observed flux of the H line, as derived by fitting a combination of a Gaussian profile for the emission line and a second order polynomial for the underlying background, is of erg cm-2 s-1, corresponding to a luminosity of erg s-1. From this luminosity, following the recipe by Kennicutt (1998), we can derive an estimate of the current star formation rate of yr-1.
5 Discussion
5.1 An X-ray flare associated to a supernova
The energy released in the flare, its duration and spectrum, as well as the properties of the host galaxy, recall the characteristics of the X-ray transient associated to SN 2008D in NGC 2770, which was observed with Neil Gehrels Swift Observatory’s XRT and interpreted as the X-ray emission from the shock break-out of a core-collapse supernova (Soderberg et al., 2008, see also Modjaz et al. 2009). To explore further this analogy, we fit to the light curve of the transient a fast-rise-and-exponential-decay (FRED) model with the rise time ( s) and -folding decay time ( s) fixed to the values reported in Soderberg et al. (2008), obtaining a marginally acceptable fit (see Fig. 2). Even though the shape of the light curve is not necessarily a fingerprint of the event, to test the compatibility of the time evolution of these two supernova shock break-out candidates, we applied the two sample Kolmogorov–Smirnov (KS) test to the arrival times of their X-ray events, for a time interval of 600 s starting from the beginning of the flares. Selecting the EPIC events in the energy band 0.5–5 keV, from a 20′′ circular region and applying the same selections to Swift/XRT observation (00031081002) of SN 2008D, we obtain a probability of 35% that the arrival times of the events collected during the transient EXMM 023135.0–603743 and the X-ray flare associated to SN 2008D are drawn from the same distribution. We also note that the luminosity of the X-ray emission detected in the decaying part of the Swift/XRT light curve of SN 2008D (Soderberg et al., 2008) is well below the 3 upper limit we set on the persistent X-ray emission of EXMM 023135.0–603743. This means that, if present, a tail similar to that of SN 2008D would have escaped detection in the XMM–Newton data.
Since we discovered the X-ray transient several years after the event, we had no chance to perform follow-up optical observations to search for possible supernova light. No simultaneous optical data from the Optical Monitor (OM) on board XMM–Newton are available, since the position of the transient was outside its field of view, which is smaller than that of the EPIC cameras. However, we found archival optical data for the host galaxy from a monitoring with the Catalina Real-time Transient Survey (more specifically, the Siding Spring Survey; Drake et al., 2009), including observations performed about two months after the burst. These data are consistent with a steady source, but they are not sensitive enough to exclude the presence of a supernova, since a supernova as bright as SN 2008D (Soderberg et al., 2008) at would have peaked at –21 mag, which could have been detected only in much deeper exposures.
We searched for possible counterparts in other surveys of SNe and transients in the southern sky. Unfortunately, several major SN surveys started a few months or years after our event (for example, La Silla-QUEST, Baltay et al. (2013); DES,777See the Dark Energy Survey at http://darkenergysurvey.org.; SkyMapper Southern Sky Survey, Wolf et al. (2018b); ESO VST SUDARE888See the ESO Messenger article at http://www.eso.org/sci/publications/messenger/archive/no.151-mar13/messenger-no151-29-32.pdf.). We also checked that the field of EXMM 023135.0–603743 was not covered by the OGLE999See http://ogle.astrouw.edu.pl/. project (Udalski et al., 2015). The Transient Name Server101010See the Transient Name Server at https://wis-tns.weizmann.ac.il. (TNS) reports four transients in a neighbourhood of EXMM 023135.0–603743, all of which occurred at least 5 years after our event. Among the optical SNe in a time window compatible with EXMM 023135.0–603743, the closest in sky distance is SN 2011eb (found in NGC 782, at , (J2000); Parrent et al. 2011), which is, however, more than away from the XMM–Newton event, and therefore incompatible.
5.2 Other interpretations
The similarities with the X-ray transient associated to SN 2008D suggest that also in the case of EXMM 023135.0–603743 the X-ray emission from the shock break-out of a core-collapse supernova was detected, but we examined other possible interpretations of the event. Considering that in the full EXTraS analysis we discovered only a few transients with a duration in the 100–500 s range, the possibility of chance alignment of a Galactic transient (e.g., an optically-faint flaring star) with a star-forming galaxy at seems remote. Following Bloom et al. (2002), we estimate that the probability to find by chance a galaxy as bright as the proposed host or brighter within 2′′ from the EXTraS transient is . Moreover, the evidence for an absorption in excess to the total Galactic in that direction derived from the spectral analysis (in particular, for the power-law model) is an additional indication that the X-ray transient is located outside our Galaxy.
Although the X-ray transient position coincides with a peripheral region of the galaxy (possibly the arm of a tidally disturbed spiral galaxy), it is consistent at 1 with the center of the galaxy. However, we can rule out the possibility of a flare from an active galactic nucleus (AGN) since there is no evidence for AGN activity either in optical or at X-rays ( erg s-1). A 5-minutes flare from a quiescent supermassive black hole cannot be excluded, but it would be an unprecedented phenomenon, since the maximum energy released in this kind of X-ray flares by Sagittarius A⋆ is several orders of magnitude smaller (e.g. Ponti et al., 2017).
The luminosity of the event is consistent with a tidal disruption event (TDE; e.g. Burrows et al. 2011; Komossa 2015). However, the fast rise of the emission would require a rather exotic scenario: a white dwarf tidally disrupted by an intermediate-mass black hole ( ; eq. 23 of Stone & Metzger 2016, see also Jonker et al. 2013; Glennie et al. 2015; Bauer et al. 2017). Another possibility is that the flare is associated to a shock break-out of a star in the course of a ‘standard’ tidal disruption event, before the onset of the accretion (e.g. Guillochon et al. 2009). However, both possibilities are disfavoured against a supernova shock break-out by the rate of tidal disruption events, which is much lower than that of core-collapse supernovae (see Fig. 6).
Another X-ray bright event with a timescale of 5 minutes is the pulsating tail of a giant flare from a magnetar (e.g. Kaspi & Beloborodov, 2017; Esposito et al., 2018). However, we do not detect any bright initial spike and the tail energy is typically 1044 erg, about two orders of magnitude smaller than that emitted by EXMM 023135.0–603743.
5.3 Event rate
To determine the event rate of X-ray flares as the one detected in EXMM 023135.0–603743, we have to evaluate the sensitivity of our search to this kind of events at different distances. Many instrumental effects and observation properties can strongly affect the sensitivity of our search: the intensity of the time-variable particle background, chip gaps and defects, instrument settings (operating mode and filter), the presence of bright and extended sources, Galactic interstellar absorption, and the transient spectrum, light curve and off-axis angle. We therefore decided to evaluate the detection efficiency of our search algorithm by simulating the X-ray flare at different flux levels and detector positions and, after the addition of the simulated events to real EPIC data, applying the EXTraS pipeline to see how many of them are recovered as function of the distance.
Since the count statistics of the X-ray flare of EXMM 023135.0–603743 is rather poor, but the transient seems to us to be an analogous of the SN 2008D X-ray flare, which is much better characterized (Soderberg et al., 2008), we adopted the spectrum and the light-curve shape of the latter as a template for simulating the flares. In the spectral model of each simulated X-ray flare, we assumed the Galactic absorption expected at its sky coordinates from the survey by Kalberla et al. (2005). The positions of the simulated transients were randomly distributed in a square region with an area of 0.324 square degrees, containing the full EPIC field of view. All the relevant instrumental properties (including the point-spread function, as well as vignetting, filter transmission, and detector efficiency effects) were taken into account.
We simulated 100,000 transients with 0.3–10 keV fluence ranging from 10-10 to 5 erg cm-2 and added the simulated photons to the pn and MOS data of 2,900 randomly-selected XMM–Newton observations, corresponding to 40% of the 3XMM-DR5 observations. We then used the EXTraS transient pipeline (Sect. 2.2) to detect the simulated flares, adopting the same detection threshold ().
After filtering out the events simulated outside the field of view and in time intervals during which the instruments were not operating, 48,166 simulated sources had at least 1 valid count. We detected significantly 71% of them. In Fig. 5, we show the success rate () as a function of the luminosity distance, derived from the fluence of the simulated sources assuming a flare energy of 21046 erg (Soderberg et al., 2008).
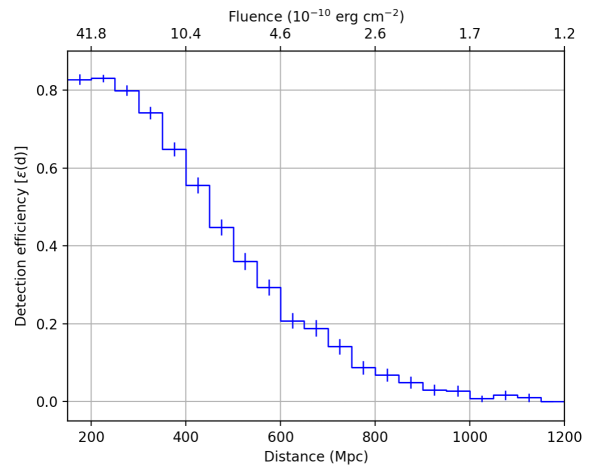
This detection efficiency can be used to compute the effective volume () covered by our survey as:
| (1) |
where is the comoving volume in the redshift interval corresponding to the distance bin in Fig. 5.
The survey coverage of the EXTraS search for transients can be derived from the sum of the exposure maps111111The exposure maps were not corrected for the vignetting effect and in case of simultaneous observations by more EPIC cameras, the one with the largest value was selected. of all the observations included in the search. The total survey coverage is 1.1 deg2 yr, corresponding to a coverage of the full sky for minutes.
The event rate for detection is therefore:
| (2) |
where the 1 statistical uncertainty was computed according to Gehrels (1986). This rate is consistent (albeit within large uncertainties) with the core-collapse supernova rate by Cappellaro et al. (2015) in the range sampled by our survey (see Fig. 6).
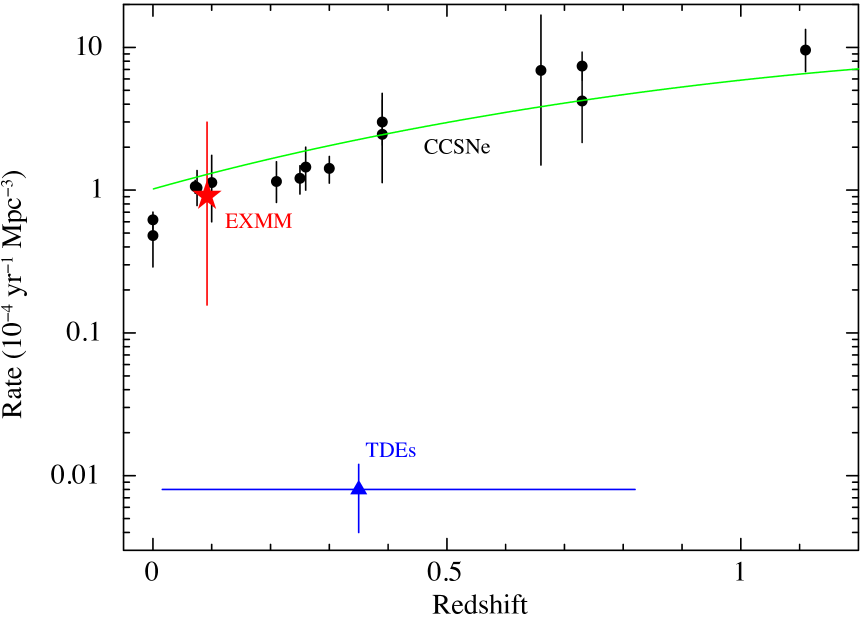
It is worth noting that the host galaxy of EXMM 023135.0–603743 has a small mass and a high specific star formation rate, as expected for the majority of galaxies hosting core-collapse supernovae (Botticella et al., 2017). Also the distance of 400 Mpc is consistent with expectations, as a combination of volume increase and detection efficiency decrease (Fig. 5) at larger distances. Soderberg et al. (2008) observed that the X-ray detection of SN 2008D was compatible with the possibility that core-collapse supernovae emit this kind of X-ray flares. Subsequent observations and studies (e.g. Mazzali et al., 2008; Modjaz et al., 2009), associated the X-ray flare of SN 2008D to an early cocoon from a massive helium star. In any case, regardless of the exact nature of the transient X-ray emission, the serendipitous discovery of EXMM 023135.0–603743 in a field galaxy rather than in the target of an observation, as it was the case of SN 2008D in the supernova-rich galaxy NGC 2770, allows us to derive a more straightforward and unbiased estimate of the rate of such events.
Transients alike EXMM 023135.0–603743 will become detectable up to significantly larger distances with the Athena X-ray Observatory (Barret et al., 2019). Thanks to its 10 times larger effective area with respect to XMM–Newton, we expect Athena will push the 50% detection efficiency for this kind of events from to , increasing by a factor 20 the accessible volume. In particular, the Wide Field Instrument (WFI) will have a field of view 2.5 times larger than EPIC and, therefore, Athena will be able to detect similar X-ray flares 50 times more frequently than XMM–Newton, which corresponds to more than 2 events per year considering equal observing time shares between the WFI and the X-IFU instruments.
A large number of events in the local Universe could be detected by soft X-ray detectors with very large fields of view. For example, the THESEUS mission (Amati et al., 2018) should be able to detect 4 supernova shock break-outs per year within 50 Mpc in its 1 sr field of view. The accumulation of a significant number of events at different distances will soon allow us to measure the supernova rate in the X-ray band and its evolution with redshift up to with a precision comparable to present measurements in optical and infrared, and with the advantage of a much smaller bias against supernovae in dusty environment.
References
- Amati et al. (2018) Amati, L., O’Brien, P., Götz, D., et al. 2018, Advances in Space Research, 62, 191
- Arnaud (1996) Arnaud, K. A. 1996, in Astronomical Data Analysis Software and Systems V, Vol. 101, XSPEC: The First Ten Years, ed. G. H. Jacoby & J. Barnes (ASP, San Francisco), 17–20
- Arnouts et al. (1999) Arnouts, S., Cristiani, S., Moscardini, L., et al. 1999, MNRAS, 310, 540
- Baltay et al. (2013) Baltay, C., Rabinowitz, D., Hadjiyska, E., et al. 2013, PASP, 125, 683
- Barret et al. (2019) Barret, D., Decourchelle, A., Fabian, A., et al. 2019, Astronomische Nachrichten, in press (preprint: astro-ph/1912.04615)
- Bauer et al. (2017) Bauer, F. E., Treister, E., Schawinski, K., et al. 2017, MNRAS, 467, 4841
- Blackburn (1995) Blackburn, J. K. 1995, in Astronomical Data Analysis Software and Systems IV., Vol. 77, FTOOLS: A FITS Data Processing and Analysis Software Package, ed. R. A. Shaw, H. E. Payne, & J. J. E. Hayes (ASP Conf. Ser., San Francisco, CA), 367
- Bloom et al. (2002) Bloom, J. S., Kulkarni, S. R., & Djorgovski, S. G. 2002, AJ, 123, 1111
- Botticella et al. (2017) Botticella, M. T., Cappellaro, E., Greggio, L., et al. 2017, A&A, 598, A50
- Bruzual & Charlot (2003) Bruzual, G., & Charlot, S. 2003, MNRAS, 344, 1000
- Burrows et al. (2011) Burrows, D. N., Kennea, J. A., Ghisellini, G., et al. 2011, Nature, 476, 421
- Cappellaro et al. (2015) Cappellaro, E., Botticella, M. T., Pignata, G., et al. 2015, A&A, 584, A62
- Cash (1979) Cash, W. 1979, ApJ, 228, 939
- De Luca et al. (2016) De Luca, A., Salvaterra, R., Tiengo, A., et al. 2016, in Astrophysics and Space Science Proceedings: The Universe of Digital Sky Surveys, Vol. 42, Science with the EXTraS Project: Exploring the X-Ray Transient and Variable Sky, ed. N. Napolitano, G. Longo, M. Marconi, M. Paolillo, & E. Iodice (Springer International Publishing, Cham), 291
- Dickey & Lockman (1990) Dickey, J. M., & Lockman, F. J. 1990, ARA&A, 28, 215
- Drake et al. (2009) Drake, A. J., Djorgovski, S. G., Mahabal, A., et al. 2009, ApJ, 696, 870
- Esposito et al. (2018) Esposito, P., Rea, N., & Israel, G. L. 2018, in Timing Neutron Stars: Pulsations, Oscillations and Explosions, ed. T. Belloni, M. Mendez, & C. Zhang, ASSL, Springer, in press (preprint: astro-ph/1803.05716)
- Fioc & Rocca-Volmerange (1997) Fioc, M., & Rocca-Volmerange, B. 1997, A&A, 326, 950
- Franzetti et al. (2008) Franzetti, P., Scodeggio, M., Garilli, B., Fumana, M., & Paioro, L. 2008, in Astronomical Society of the Pacific Conference Series: Astronomical Data Analysis Software and Systems XVII, Vol. 394, GOSSIP, a New VO Compliant Tool for SED Fitting, ed. R. W. Argyle, P. S. Bunclark, & J. R. Lewis, 642
- Gabriel et al. (2004) Gabriel, C., Denby, M., Fyfe, D. J., et al. 2004, in Astronomical Data Analysis Software and Systems (ADASS) XIII, Vol. 314, The XMM-Newton SAS - Distributed Development and Maintenance of a Large Science Analysis System: A Critical Analysis, ed. F. Ochsenbein, M. G. Allen, & D. Egret (San Francisco, CA: ASP), 759
- Gaia Collaboration et al. (2018) Gaia Collaboration, Brown, A. G. A., Vallenari, A., et al. 2018, A&A, 616, A1
- Gavazzi et al. (2002) Gavazzi, G., Bonfanti, C., Sanvito, G., Boselli, A., & Scodeggio, M. 2002, ApJ, 576, 135
- Gehrels (1986) Gehrels, N. 1986, ApJ, 303, 336
- Glennie et al. (2015) Glennie, A., Jonker, P. G., Fender, R. P., Nagayama, T., & Pretorius, M. L. 2015, MNRAS, 450, 3765
- Greiner et al. (2008) Greiner, J., Bornemann, W., Clemens, C., et al. 2008, PASP, 120, 405
- Guillochon et al. (2009) Guillochon, J., Ramirez-Ruiz, E., Rosswog, S., & Kasen, D. 2009, ApJ, 705, 844
- Ilbert et al. (2006) Ilbert, O., Arnouts, S., McCracken, H. J., et al. 2006, A&A, 457, 841
- Jonker et al. (2013) Jonker, P. G., Glennie, A., Heida, M., et al. 2013, ApJ, 779, 14
- Kalberla et al. (2005) Kalberla, P. M. W., Burton, W. B., Hartmann, D., et al. 2005, A&A, 440, 775
- Kaspi & Beloborodov (2017) Kaspi, V. M., & Beloborodov, A. M. 2017, ARA&A, 55, 261
- Kennicutt (1998) Kennicutt, Jr., R. C. 1998, ARA&A, 36, 189
- Komossa (2015) Komossa, S. 2015, Journal of High Energy Astrophysics, 7, 148
- Krühler et al. (2008) Krühler, T., Küpcü Yoldaş, A., Greiner, J., et al. 2008, ApJ, 685, 376
- Madau & Dickinson (2014) Madau, P., & Dickinson, M. 2014, ARA&A, 52, 415
- Makarov et al. (2014) Makarov, D., Prugniel, P., Terekhova, N., Courtois, H., & Vauglin, I. 2014, A&A, 570, A13
- Mazzali et al. (2008) Mazzali, P. A., Valenti, S., Della Valle, M., et al. 2008, Science, 321, 1185
- Modjaz et al. (2009) Modjaz, M., Li, W., Butler, N., et al. 2009, ApJ, 702, 226
- Monet et al. (2003) Monet, D. G., Levine, S. E., Canzian, B., et al. 2003, AJ, 125, 984
- Parrent et al. (2011) Parrent, J., Howell, D. A., Thomas, R. C., Nugent, P. E., & Sullivan, M. 2011, Central Bureau Electronic Telegrams, 2764, 3
- Planck Collaboration et al. (2016) Planck Collaboration, Ade, P. A. R., Aghanim, N., et al. 2016, A&A, 594, A13
- Ponti et al. (2017) Ponti, G., George, E., Scaringi, S., et al. 2017, MNRAS, 468, 2447
- Rosen et al. (2016) Rosen, S. R., Webb, N. A., Watson, M. G., et al. 2016, A&A, 590, A1
- Scargle (1998) Scargle, J. D. 1998, ApJ, 504, 405
- Scargle et al. (2013) Scargle, J. D., Norris, J. P., Jackson, B., & Chiang, J. 2013, ApJ, 764, 167
- Skrutskie et al. (2006) Skrutskie, M. F., Cutri, R. M., Stiening, R., et al. 2006, AJ, 131, 1163
- Soderberg et al. (2008) Soderberg, A. M., Berger, E., Page, K. L., et al. 2008, Nature, 453, 469
- Stone & Metzger (2016) Stone, N. C., & Metzger, B. D. 2016, MNRAS, 455, 859
- Strüder et al. (2001) Strüder, L., Briel, U., Dennerl, K., et al. 2001, A&A, 365, L18
- Tody (1993) Tody, D. 1993, in Astronomical Society of the Pacific Conference Series, Vol. 52, IRAF in the Nineties, ed. R. J. Hanisch, R. J. V. Brissenden, & J. Barnes (ASP, San Francisco), 173–183
- Turner et al. (2001) Turner, M. J. L., Abbey, A., Arnaud, M., et al. 2001, A&A, 365, L27
- Udalski et al. (2015) Udalski, A., Szymański, M. K., & Szymański, G. 2015, Acta Astron., 65, 1
- van Velzen (2018) van Velzen, S. 2018, ApJ, 852, 72
- Wilms et al. (2000) Wilms, J., Allen, A., & McCray, R. 2000, ApJ, 542, 914
- Wolf et al. (2018a) Wolf, C., Bian, F., Onken, C. A., et al. 2018a, PASA, 35, e024
- Wolf et al. (2018b) Wolf, C., Onken, C. A., Luvaul, L. C., et al. 2018b, PASA, 35, e010
- Wright (2006) Wright, E. L. 2006, PASP, 118, 1711
- Yoldaş et al. (2008) Yoldaş, A. K., Krühler, T., Greiner, J., et al. 2008, in American Institute of Physics Conference Series, Vol. 1000, First Results of GROND, ed. M. Galassi, D. Palmer, & E. Fenimore, 227–231