Optical spectroscopy and ultrafast pump-probe study on Bi2Rh3Se2: evidence for charge-density-wave order formation
Abstract
The parkerite-type ternary chalcogenide Bi2Rh3Se2 was discovered to be a charge density wave (CDW) superconductor. However, there was a debate on whether the observed phase transition at 240 K could be attributed to the formation of CDW order. To address the issue, we performed optical spectroscopy and ultrafast pump-probe measurements on single crystal samples of Bi2Rh3Se2. Our optical conductivity measurement reveals clearly the formation of an energy gap with associated spectral change only at low energies, yielding strong evidence for a CDW phase transition at 240 K. Time resolved pump-probe measurement provides further support for the CDW phase transition. The amplitude and relaxation time of quasiparticles extracted from the photoinduced reflectivity show strong enhancement near transition temperature, yielding further evidence for the CDW energy gap formation. Additionally, a collective mode is identified from the oscillations in the pump-probe time delay at low temperature. This mode, whose frequency decreases gradually at elevated temperature, could be naturally attributed to the amplitude mode of CDW state.
I introduction
Charge-density wave (CDW) and superconductivity are two important and closely linked broken symmetry states in solids. There has been tremendous interest in the interplay between these two states in condensed matter physics. The topic has motivated extensive exploration of new materials showing coexistence or competition between the two different instabilities. The discovery of a coexistence of superconductivity and a structural phase transition in Bi2Rh3Se2 represents a new progress Sakamoto et al. (2007) on this subject and offers new opportunity to study the CDW instability and its interplay with superconductivity.
Bi2Rh3Se2 belongs to a quasi-two dimensional parkerite-type ternary chalcogenides A2M3X2 (A = Sn, Pb, In, Tl, and Bi; M = Co, Ni, Rh, and Pd; X = S and Se) composed of sheets containing one-dimensional M-M chains Sakamoto et al. (2007); Natarajan et al. (1988); Weihrich et al. (2007). Sakamoto et al. reported that Bi2Rh3Se2 was a new superconducting compound with a transition temperature T 0.7 K. Intriguingly, the compound exhibits a phase transition at about 240 K. Based on resistivity, magnetic susceptibility, specific heat measurement, thermoelectric power, thermal expansion, and low-temperature x-ray measurements, they identified the phase transition at 240 K as a CDW order Sakamoto et al. (2007). Following this work, Kaluarachchi et al. Kaluarachchi et al. (2015) found that the isostructural compound Bi2Rh3.5S2 has a higher superconducting transition temperature T 1.7 K, though the stoichiometric Bi2Rh3S2 is not superconducting. A first order phase transition at 165 K was also found for Bi2Rh3S2. The simultaneous observation of superconductivity and CDW order has brought a new perspective to the research in this field. However, the subsequent pressure and selected-area electron diffraction studies on Bi2Rh3Se2 by Chen et al.Chen et al. (2014a) indicated that the resistivity anomaly at 240 K shifted to higher temperature with increasing pressure, which is unusual for a conventional CDW transition. They argued that the phase transition at 240 K is not a CDW transition, but a purely structural phase transition with a symmetry reduction from a high-symmetry C-centered monoclinic lattice to a low-symmetry primitive one below the transition temperature Chen et al. (2014a).
It is crucial to understand the nature of the phase transition in those compounds because it is an essential step towards understanding the properties of compounds and the possible connection to the superconductivity. Up to now, there is no spectroscopic experiment on those compounds. It is well known that most of the CDW states are driven by the nesting topology of Fermi surfaces, i.e. the matching of sections of FS to others by a wave vector q = 2kF, where the electronic susceptibility has a divergence. A single-particle energy gap opens in the nested regions of the Fermi surfaces at the transition, which leads to the lowering of the electronic energies of the system. Simultaneously, the phonon mode of acoustic branch becomes softened to zero frequency at q = 2kF as a result of electron-phonon interaction, leading to structural distortion Grüner (1994). The formation of an energy gap below the transition has been generally taken as a characteristic feature of CDW order. On the contrary, a purely structural phase transition, if irrelevant to a CDW order, would lead to an entirely different band structure, resulting in a spectral change over broad energy scale rather than only in the low energies. Such broad-energy spectral change across the phase transition was demonstrated in a number of materials such as BiNi2As2 Chen et al. (2009), IrTe2 Fang et al. (2013), RuP Chen et al. (2015). Additionally, CDW also has collective excitations, being referred to as an amplitude mode (AM) and a phase mode. The amplitude mode involves the ionic displacement and has a finite energy even at q=0 limit, which could be identified by the ultrafast pump-probe experiment Demsar et al. (1999a, 2002); Yusupov et al. (2008); Lavagnini et al. (2008); Onozaki et al. (2007). Furthermore, the formation of a CDW energy gap would also impede the relaxation time of photoexcited quasiparticles which could be also probed from the pump-probe measurement.
In this work, we performed optical spectroscopy and ultrafast pump-probe measurements on single crystal samples of Bi2Rh3Se2. Our measurement reveals clearly the formation of an energy gap with associated spectral change only at low energy, yielding strong evidence for a CDW phase transition at 240 K. The opening of the energy gap removes most of the free carrier spectral weight and causes a dramatic reduction in the carrier scattering rate. Ultrafast pump-probe measurement reveals a significant change of the photoinduced reflectivity near the phase transition temperature. A strong enhancement of the amplitude and relaxation time of photoinduced carriers is extracted at the phase transition temperature, also yielding evidence for the CDW energy gap opening. Moreover, the time resolved measurement demonstrates presence of a strong oscillation at low temperature, which becomes damped gradually at elevated temperature. The temperature dependence of the oscillation suggests that it comes from the amplitude mode of CDW collective excitations.
II Results and discussion
The single crystal samples of Bi2Rh3Se2 were synthesized by self flux method. High-purity Bi, Rh, and Se elements with a molar ratio of Bi:Rh:Se=2:3:2 were mixed, placed in an alumina crucible, and sealed in a silica ampule filled with argon gas. The sealed ampule was heated to 1050 0C and held for 5 h, then slowly cooled with the rate of 2 0C/h to 750 0C. At the final temperature, the mixture was decanted using a centrifuge.
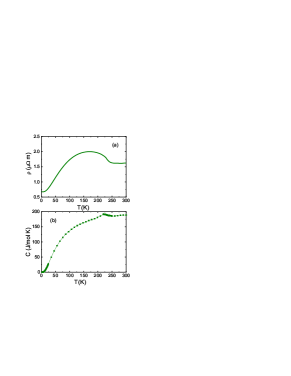
The temperature dependent resistivity was measured by a standard four-probe method. The specific heat was measured by using the relaxation method. Both were performed in a Quantum Design physical property measurement system (PPMS). Figure 1 (a) and (b) show the temperature dependence of resistivity and specific heat between 1.8-300 K, respectively. Similar to previous reports Sakamoto et al. (2007); Chen et al. (2014a), a phase transition is clearly observed starting from 240 K.
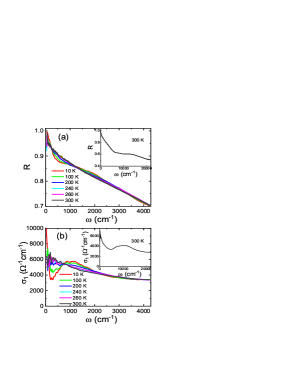
The in-plane reflectivity was measured by the Fourier transform infrared spectrometer Bruker 80V in the frequency range from 40 to 25 000 cm-1 . The room temperature over a broad frequency range is displayed in the inset of Fig.2 (a). The spectrum shows typically metallic frequency response: has high values at low frequencies and approaches unit at zero frequency limit. A roughly linear-frequency dependent reflectivity is seen below 6000 cm-1 . The behavior is similar to high-Tc cuprate superconductors, reflecting an overdamped behavior of carrier scattering. The main panel of Fig.2 (a) shows the reflectivity below 4300 cm-1 at several selected temperatures. Above 240 K, increases monotonically as frequency deceases and the low energy part increases slightly upon cooling, both of which belong to simple metallic behaviors. With temperature further decreasing, a pronounced dip structure appears roughly near 600 cm-1 , which yields strong evidence for the formation of a charge gap in the vicinity of Fermi level due to the development of the CDW order. This dip feature grows more dramatic as temperature decreases, indicating the continuous enhancement of the CDW gap. In the meantime, the low energy reflectivity gets even higher than the values in the high temperature phase.
The real part of optical conductivity was derived from through Kramers-Kronig transformation, as shown in Fig.2 (b). The Hagen-Rubens relation was used for the low energy extrapolation of . For the high frequency extrapolation we have employed the x-ray atomic scattering functions Tanner (2015). The main panel of Fig.2 (b) shows below 4300 cm-1 at different temperatures, the inset shows over broad energy scale at room temperature. Above the transition temperature, the optical conductivity exhibits clearly a Drude peak at low frequency. Its broad width indicates a large scattering rate of the free carriers. Upon entering the low temperature phase, the spectral weight of the Drude peak was substantially removed and transferred to higher energies to form a broad peak centered around 1000 cm-1 . The feature becomes more prominent as temperature decreases. In fact, those are expected spectroscopic features for the density wave condensate, because either charge or spin density wave condensate has a so-called "case-I" coherence factor which would cause a sharp rise in the optical conductivity spectrum just above the energy gapGrüner (1994). Here, we can take the central position of the peak as the upper limit energy scale of the CDW gap. Then, we get the value of 6, a value being larger than the weak-coupling BCS theory but not uncommon for a density wave phase transition. We emphasize that those features are dramatically different from a purely structural phase transition. For a structural phase transition irrelevant to CDW order, the band structure at low temperature phase could be entirely different from the high temperature phase. That would result in a sudden spectral change over broad energy scale, which has been observed in a number of materials such as BiNi2As2 Chen et al. (2009), IrTe2 Fang et al. (2013), RuP Chen et al. (2015) across the structural phase transitions.
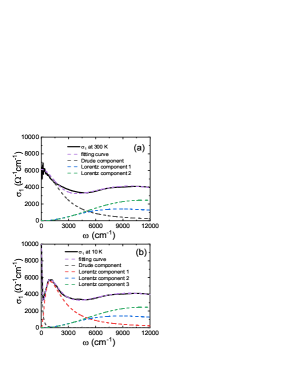
To estimate the gapped spectral weight, we employ a Drude-Lorentz model to fit the optical conductivity,
| (1) |
The Drude term describes the response of itinerant carriers, while the Lorentz terms stand for interband transitions and excitations across energy gaps. Here, for simplicity, we use only one Drude component to estimate the spectral weight of itinerant carriers. Figure 3 shows the fitting results at two representative temperatures, 300 K and 10 K. We find that the low frequency spectrum at 300 K can be approximately reproduced by one Drude component. At 10 K, the removed spectral weight forms a peak at about 1000 cm-1 ( 120 meV), an indication of energy gap formation. Since the fitting parameters of high frequency Lorentz components are kept unchanged, the spectral weight transfer occurs only in the low energy scale. It is worthy noting that a sharp and narrow Drude peak remains in the low temperature state, which agrees well with the high reflectivity near zero frequency, indicating that the Fermi surfaces are partially gapped by the CDW phase transition. The number of lost free carriers could be estimated by the variation of plasma frequency , where and represent the number and effective mass of free carriers respectively. From the above decomposition, we find that the plasma frequency varies roughly from 2.8 cm-1 at room temperature to 8 cm-1 at 10 K, which indicates that over 90 % of free carriers are removed by the opening of CDW energy gap. Meanwhile, the scattering rate decreases violently from 2540 cm-1 to 93 cm-1 , as been evidenced by the narrowing of Drude peak, which makes the compound to have even lower dc resistivity at low temperature despite of the substantial carrier density loss. Actually, the plasma frequency associated with the Drude component spectral weight could also be estimated by , where is the cut-off frequency of the Drude component. Taking the location of the conductivity minimum as the cutoff frequency, being about 4800 cm-1 for 300 K and 290 cm-1 for 10 K, where the balance between the tails of Drude and Lorentz components are roughly taken into account, we obtained the same values of plasma frequencies as that from the above decomposition of the spectral weight.
Further support for the formation of CDW order can be obtained from our ultrafast pump probe measurement, which has been proven to be particularly useful in detecting both of the single particle excitations across small energy gapsDemsar et al. (1999b); Chia et al. (2010, 2011); Chen et al. (2014b); Shimatake et al. (2007) and collective modes relevant to lang range ordering Yusupov et al. (2008); Albrecht et al. (1992); Qi et al. (2013). We used a Ti:sapphire oscillator as the light source for both pump and probe beams, which can produce 800 nm pulsed laser at 80 MHz repetition. The 100 femtosecond time duration of the laser pulses enables ultrashort time resolved measurement. The fluence of the pump beam is about 6.4 , and the fluence of the probe beam is ten times lower. In order to reduce the noise caused by stray light, the pump and probe pulses were set to be cross polarized and an extra polarizer was mounted just before the detector.
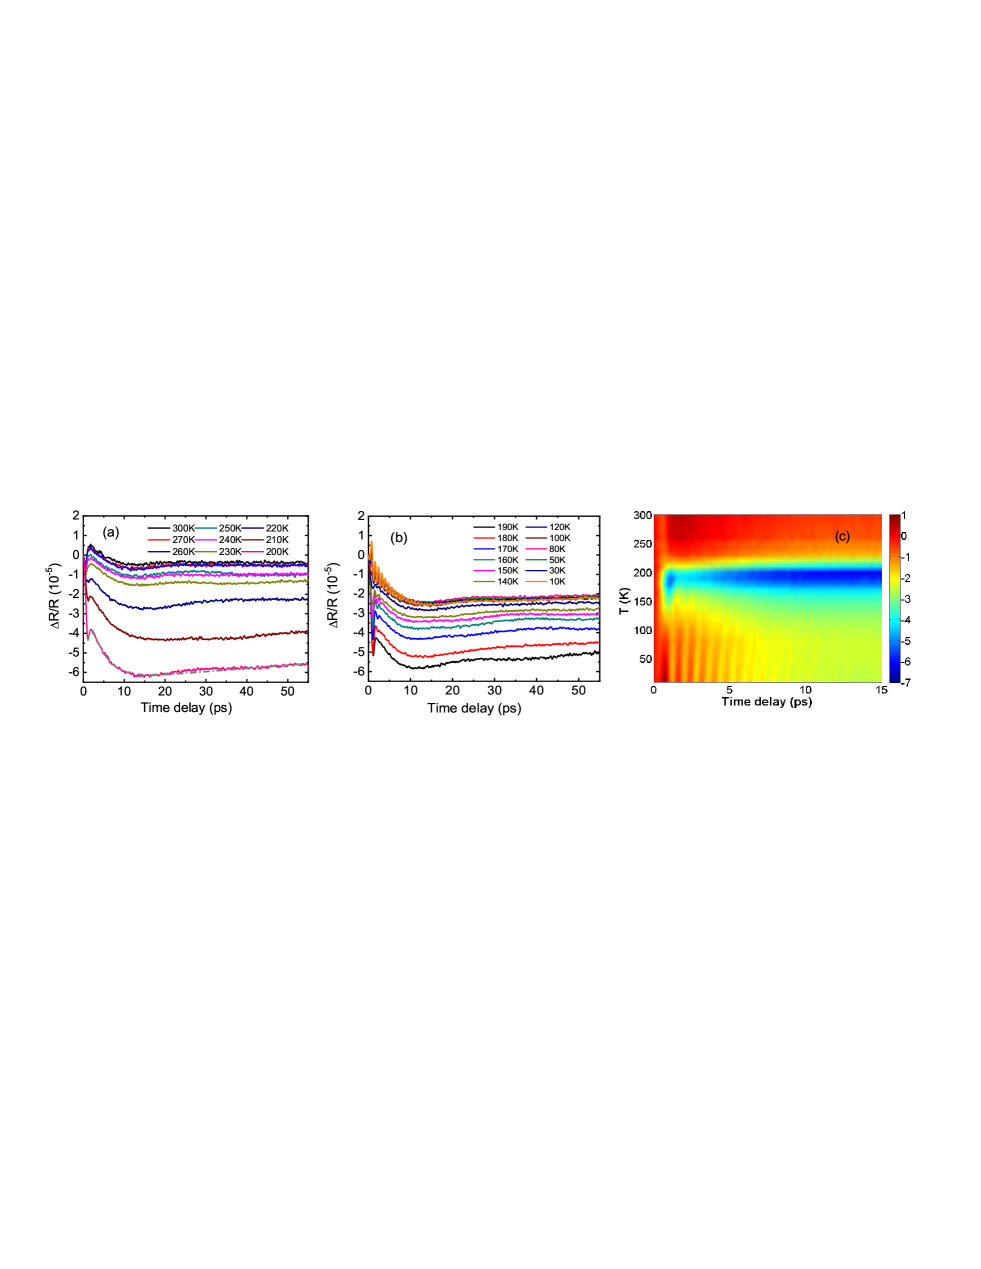
The photoinduced reflectivity change as a function of time delay at different temperatures are displayed in Fig.4 (a) and (b), respectively. Overall, the signal levels change quickly below 240 K. With temperature decreasing, the absolute value of increases and reaches the maximum near 200 K (Fig.4 (a)), then the amplitude drops with further decreasing temperature (Fig.4 (b)). The intensity plot for the time delay below 15 ps for different temperatures is shown in Fig.4 (c). We observe three distinct decay processes: a fast relaxation time with negative amplitude value, a longer relaxation time with positive amplitude and another very long relaxation time with negative amplitude. Indeed, the reflectivity change could be well reproduced by three exponential decays,
| (2) |
where (i=1,2,3) represents the amplitude of the photoinduced reflectivity change and stands for the relaxation time of the decay channel. As an example, we show the fitting curve for the data at 200 K (the bottom curve in Fig.4 (a)) by this formula. The amplitudes , and have the same order of magnitude, whereas the relaxation times of the three decay processes are dramatically different: is sub-picosecond, is a few picoseconds, and are several hundred picoseconds. At 200 K, for example, =-1.70 and =0.6 ps, =3.82 and =3.8 ps, and =-6.47 and =350 ps, respectively.
Presence of rapid and slow decay dynamics after excitation has been observed in many systems Kumar et al. (2013); Luo et al. (2012); Tomeljak et al. (2009). In general, the number of photoexcited hot electrons (or quasiparticles) at zero time delay is related to the amplitude of . Those excited high-energy hot electrons release and transfer their energy to lattice through the emission of longitudinal optical phonons, and those optical phonons further decay into longitudinal acoustic phonons via anharmonic interactions. The sub-picosecond decay would be mainly attributed to quasiparticle relaxation via the electron-phonon thermalization, the several to several hundred picosecond decay processes would be related to the lattice energy loss via phonon population decay (inelastic scattering) or dephasing (elastic scattering) Luo et al. (2012); Hase et al. (2005). The energy loss from the excited hot spot to the ambient environment would take even longer time.
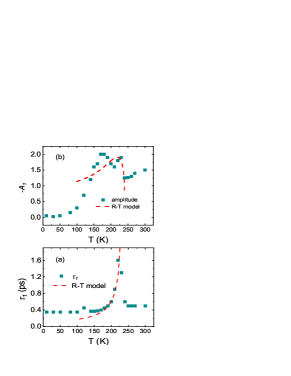
The substantial change of below 230240 K reflects the phase transition. From the fitting of equation (2) to , we find that the and (i=1,2,3) parameters for all three decay processes change with temperatures, particularly near the phase transition temperature. Such situation was observed in other materials before, for example, in spin density wave compound CaFe2As2 Kumar et al. (2013). As our focus here is on the issue of whether the structural phase transition near 240 K is related to the CDW order, we shall limit our attention to the quasiparticle relaxation in sub-picosecond decay channel. Figure 5 shows A1 and extracted from the fitting of equation (2) to as a function of temperature. An abrupt increase of A1 is observed at the transition temperature with a broad peak-like structure at lower temperature, and simultaneously, a divergence in is seen near the transition temperature. Those features represent ultrafast spectroscopy evidence for an energy gap opening, as we shall explain below.
It is well known that the energy gap formation has a significant effect on the decay dynamics the photoexcited quasiparticles, which was described by the phenomenological Rothwarf-Taylor (R-T) model Rothwarf and Taylor (1967). This model was initially established to explain the ultrafast relaxation dynamics of superconductors, but was proved to be applicable for a wide range of metallic systems with gap opening in the density of states. It proposes that the high energy phonons emitted by the recombination of photoinduced quasiparticles across an energy gap will introduce a bottleneck effect to the relaxation. That is, the depletion of states near the Fermi level would significantly impede the relaxation of the photoinduced quasiparticle. In the small photo excitation limit, the R-T model relates the density of thermally activated quasiparticles, , to the measured transient reflectivity amplitudes as, , where . Assuming standard form of thermally activated quasiparticle density and a BCS-like gap of the form , the amplitude of photoinduced reflectivity signal is given by Kabanov et al. (1999)
| (3) |
where is the pump fluence and is a fitting parameter. The equation describes an increase in the photoexcited quasiparticle density due to the decreasing gap value and corresponding enhanced phonon emission during the relaxation. As the gap closes at transition temperature, more and more low-energy phonons become available for reabsorption, a quasi-divergence in the relaxation time is resultedKabanov et al. (1999),
| (4) |
where g is a fitting parameter. Indeed, the sudden change of and near the phase transition temperature could be captured by equations (3) and (4) of R-T model, as shown in Fig. 5. There exists some deviation at lower temperatures. It might be linked to the simultaneous change in , and and , which was ignored in the above analysis. Additionally, we expect that the R-T model, which is appropriate near the phase transition, would become less applicable at temperature far below the phase transition. Nevertheless, the sudden increase in and quasi-divergence in illustrate unambiguously the appearance of an energy gap, yielding further evidence for the CDW phase transition.
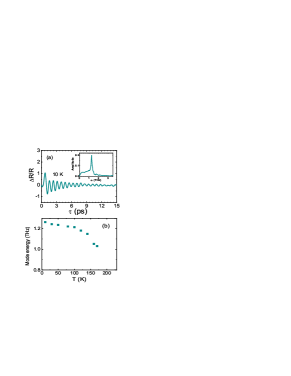
On the other hand, CDW also has collective excitations, being referred to as amplitude mode and phase mode. The amplitude mode involves the ionic displacement and has a finite energy even at q=0 limit, usually at the energy level of terahertz frequency, which could be identified by the ultrafast pump-probe experiment Demsar et al. (1999a, 2002); Yusupov et al. (2008); Lavagnini et al. (2008); Onozaki et al. (2007). Indeed, the pump-probe signals exhibit pronounced oscillations at low temperature, as seen clearly in Fig. 4 (b) and intensity plot of Fig. 4 (c). It is easy to find that the periodic time of the oscillation increases upon temperature increasing, suggesting a decrease of mode frequency. In order to analyze the oscillatory component quantitatively, we subtract the exponential fitting part, then perform fast Fourier transformation of the residual part to get the mode frequency. As an example, Fig. 6 (a) shows the data at 10 K as a function of time delay within 15 ps with the decay background subtracted. The inset shows the mode in frequency domain after the Fourier transformation. The result for different temperature is plotted in Fig. 6 (b). The mode frequency of the oscillation drops as temperature increases. In CDW compound, the collective amplitude mode of CDW condensate usually has higher signal strength than phonon modes and behaves as an order parameter as a function of temperature. In some CDW materials, one indeed observes the disappearance of CDW amplitude mode precisely at the CDW transition temperature Chen et al. (2017). But quite often, the oscillations are heavily damped at elevated temperature and could not be resolved before reaching the transition temperature. This is also the case for the present compound. Thus, judging from the signal level and the temperature dependent trend, we can attribute the observed mode to the CDW amplitude mode. The mode frequency is about =1.25 THz at T=0 K, which is among the commonly observed energy scales for CDW order. In fact, the CDW amplitude mode frequency at the Brillouin zone center is known to be related to the phonon frequency of acoustic branch at wave vector q = 2kF above and the electron-phonon coupling constant by Grüner (1994). Unusual CDW mode frequency was observed only for certain compound with peculiar CDW wave vector q = 2kF, for example, in LaAgSb2 with extremely small CDW wave vector 2kF or unusual long lattice modulation period in real space Chen et al. (2017).
III Summary
To summarize, we have utilized infrared spectroscopy and ultrafast pump-probe measurement to investigate the charge and coherent dynamics of the Bi2Rh3Se2 single crystals, in an effort to address whether the phase transition at 240 K is a CDW order or a purely structural transition. Our optical spectroscopy measurement reveals clearly the formation of an energy gap with associated spectral change only at low energies, yielding strong evidence for a CDW phase transition at 240 K. The formation of the energy gap removes most part of the free carrier spectral weight. Time resolved pump-probe measurement provides further support for the CDW phase transition. The amplitude and relaxation time of quasiparticles extracted from the photoinduced reflectivity show strong enhancement near transition temperature, yielding further evidence for the CDW energy gap formation. Additionally, a collective mode is identified from the oscillations in the pump-probe time delay at low temperature. This mode, whose frequency decreases gradually at elevated temperature, is suggested to be the amplitude mode of CDW condensate state.
ACKNOWLEDGMENTS
This work was supported by National Natural Science Foundation of China (No. 11888101), the National Key Research and Development Program of China (No. 2017YFA0302904, 2016YFA0300902).
References
- Sakamoto et al. (2007) T. Sakamoto, M. Wakeshima, Y. Hinatsu, and K. Matsuhira, Phys. Rev. B 75, 060503(R) (2007).
- Natarajan et al. (1988) S. Natarajan, G. Rao, R. Baskaran, and T. Radhakrishnan, Journal of the Less Common Metals 138, 215 (1988).
- Weihrich et al. (2007) R. Weihrich, S. F. Matar, V. Eyert, F. Rau, M. Zabel, M. Andratschke, I. Anusca, and T. Bernert, Progress in Solid State Chemistry 35, 309 (2007).
- Kaluarachchi et al. (2015) U. S. Kaluarachchi, W. Xie, Q. Lin, V. Taufour, S. L. Bud'Ko, G. J. Miller, and P. C. Canfield, Phys. Rev. B 91, 2 (2015).
- Chen et al. (2014a) C. Y. Chen, C. L. Chan, S. Mukherjee, C. C. Chou, C. M. Tseng, S. L. Hsu, M. W. Chu, J. Y. Lin, and H. D. Yang, Solid State Communications 177, 42 (2014a).
- Grüner (1994) G. Grüner, Density waves in solids (Perseus, Cambridge, MA, 1994).
- Chen et al. (2009) Z. G. Chen, G. Xu, W. Z. Hu, X. D. Zhang, P. Zheng, G. F. Chen, J. L. Luo, Z. Fang, and N. L. Wang, Phys. Rev. B 80, 094506 (2009).
- Fang et al. (2013) A. Fang, G. Xu, T. Dong, P. Zheng, and N. Wang, Scientific Reports 3 (2013), 10.1038/srep01153.
- Chen et al. (2015) R. Y. Chen, Y. G. Shi, P. Zheng, L. Wang, T. Dong, and N. L. Wang, Phys. Rev. B 91, 125101 (2015).
- Demsar et al. (1999a) J. Demsar, K. Biljaković, and D. Mihailovic, Phys. Rev. Lett. 83, 800 (1999a).
- Demsar et al. (2002) J. Demsar, L. Forró, H. Berger, and D. Mihailovic, Phys. Rev. B 66, 041101 (2002).
- Yusupov et al. (2008) R. V. Yusupov, T. Mertelj, J.-H. Chu, I. R. Fisher, and D. Mihailovic, Phys. Rev. Lett. 101, 246402 (2008).
- Lavagnini et al. (2008) M. Lavagnini, M. Baldini, A. Sacchetti, D. Di Castro, B. Delley, R. Monnier, J.-H. Chu, N. Ru, I. R. Fisher, P. Postorino, and L. Degiorgi, Phys. Rev. B 78, 201101 (2008).
- Onozaki et al. (2007) T. Onozaki, Y. Toda, S. Tanda, and R. Morita, Japanese Journal of Applied Physics 46, 870 (2007).
- Tanner (2015) D. B. Tanner, Phys. Rev. B 91, 035123 (2015).
- Demsar et al. (1999b) J. Demsar, B. Podobnik, V. V. Kabanov, T. Wolf, and D. Mihailovic, Phys. Rev. Lett. 82, 4918 (1999b).
- Chia et al. (2010) E. E. M. Chia, D. Talbayev, J.-X. Zhu, H. Q. Yuan, T. Park, J. D. Thompson, C. Panagopoulos, G. F. Chen, J. L. Luo, N. L. Wang, and A. J. Taylor, Phys. Rev. Lett. 104, 027003 (2010).
- Chia et al. (2011) E. E. M. Chia, J.-X. Zhu, D. Talbayev, H. J. Lee, N. Hur, N. O. Moreno, R. D. Averitt, J. L. Sarrao, and A. J. Taylor, Phys. Rev. B 84, 174412 (2011).
- Chen et al. (2014b) R. Y. Chen, B. F. Hu, T. Dong, and N. L. Wang, Phys. Rev. B 89, 075114 (2014b).
- Shimatake et al. (2007) K. Shimatake, Y. Toda, and S. Tanda, Phys. Rev. B 75, 115120 (2007).
- Albrecht et al. (1992) W. Albrecht, T. Kruse, and H. Kurz, Phys. Rev. Lett. 69, 1451 (1992).
- Qi et al. (2013) J. Qi, T. Durakiewicz, S. A. Trugman, J.-X. Zhu, P. S. Riseborough, R. Baumbach, E. D. Bauer, K. Gofryk, J.-Q. Meng, J. J. Joyce, A. J. Taylor, and R. P. Prasankumar, Phys. Rev. Lett. 111, 057402 (2013).
- Kumar et al. (2013) S. Kumar, L. Harnagea, S. Wurmehl, B. Buchner, and A. K. Sood, Journal of the Physical Society of Japan 82, 1 (2013).
- Luo et al. (2012) C. W. Luo, I. H. Wu, P. C. Cheng, J. Y. Lin, K. H. Wu, T. M. Uen, J. Y. Juang, T. Kobayashi, Y. C. Wen, T. W. Huang, K. W. Yeh, M. K. Wu, D. A. Chareev, O. S. Volkova, and A. N. Vasiliev, New Journal of Physics 14 (2012), 10.1088/1367-2630/14/10/103053.
- Tomeljak et al. (2009) A. Tomeljak, B. Kavcic, H. Schäfer, V. V. Kabanov, D. Mihailovic, D. Staresinic, K. Biljakovic, and J. Demsar, Physica B: Condensed Matter 404, 548 (2009).
- Hase et al. (2005) M. Hase, K. Ishioka, J. Demsar, K. Ushida, and M. Kitajima, Phys. Rev. B 71, 1 (2005), arXiv:0504540 [cond-mat] .
- Rothwarf and Taylor (1967) A. Rothwarf and B. N. Taylor, Phys. Rev. Lett. 19, 27 (1967).
- Kabanov et al. (1999) V. V. Kabanov, J. Demsar, B. Podobnik, and D. Mihailovic, Phys. Rev. B 59, 1497 (1999).
- Chen et al. (2017) R. Y. Chen, S. J. Zhang, M. Y. Zhang, T. Dong, and N. L. Wang, Phys. Rev. Lett. 118, 107402 (2017).