The Star Formation in Radio Survey: 3 – 33 GHz Imaging of Nearby Galaxy Nuclei and Extranuclear Star-forming Regions
Abstract
We present 3, 15, and 33 GHz imaging towards galaxy nuclei and extranuclear star-forming regions using the Karl G. Jansky Very Large Array as part of the Star Formation in Radio Survey. With GHz radio spectra, we measured the spectral indices and corresponding thermal (free-free) emission fractions for a sample of 335 discrete regions having significant detections in at least two radio bands. After removing 14 likely background galaxies, we find that the median thermal fraction at 33 GHz is with a median absolute deviation of , when a two-component power-law model is adopted to fit the radio spectrum. Limiting the sample to 238 sources that are confidently identified as star-forming regions, and not affected by potential AGN contamination (i.e., having galactocentric radii pc), results in a median thermal fraction of % with a median absolute deviation of . We further measure the thermal fraction at 33 GHz for 163 regions identified at 7″ resolution to be % with a median absolute deviation of . Together, these results confirm that free-free emission dominates the radio spectra of star-forming regions on scales up to 500 pc in normal star-forming galaxies. We additionally find a factor of 1.6 increase in the scatter of the measured spectral index and thermal fraction distributions as a function of decreasing galactocentric radius. This trend is likely reflective of the continuous star-formation activity occurring in the galaxy centers, resulting a larger contribution of diffuse nonthermal emission relative to star-forming regions in the disk.
1 Introduction
The radio spectra of star-forming galaxies, typically characterized as a power law (), encode information about the thermal and non-thermal energetic processes which power them. Both thermal (Bremsstrahlung) and non-thermal (synchrotron) emission are associated with massive () star formation, underlying the basis for the well-known far-infrared (FIR: 42-122m)-radio correlation (de Jong et al., 1985; Helou et al., 1985; Condon, 1992; Bell, 2003). FIR emission arises from the absorption and re-radiation of UV and optical photons that heat dust grains surrounding massive star-forming regions. The O and B stars in such regions, with lifetimes of Myr, produce ionizing (Lyman continuum) radiation whose strength is directly proportional to the amount of free-free emission. These same massive stars end their lives as core-collapse supernovae, whose remnants accelerate cosmic ray (CR) electrons/positrons that produce the diffuse non-thermal synchrotron emission observed in star-forming galaxies (Condon, 1992; Koyama et al., 1995; Murphy et al., 2006; Lacki & Thompson, 2010; Lacki et al., 2010).
However, the connection between the non-thermal synchrotron emission and the current star-formation rate (SFR) of a galaxy is far less direct relative to thermal free-free emission. Variations in the generation and propagation of CRs through the interstellar medium (ISM) can affect the observed low-frequency emission surrounding star-forming regions. Despite the complexity in interpreting this non-thermal emission from galaxies, several empirical (Bell, 2003; Koyama et al., 1995; Murphy et al., 2006; Heesen et al., 2014; Tabatabaei et al., 2017) and theoretical (Condon, 1992; Murphy et al., 2011) calibrations for the star-formation rate (SFR) exist in the literature. These studies demonstrate that at frequencies low enough (typically GHz) the emission is dominated by the non-thermal, steep spectrum component (), and at frequencies high enough ( GHz) the emission becomes dominated by thermal emission (). Hence, radio observations can serve as an excellent, extinction-free, diagnostic for the current SFR within nearby galaxies.
This was the motivation for initiating the Star Formation in Radio Survey (SFRS), which began as a 33 GHz imaging campaign with the Green Bank Telescope (GBT) to study 103 galaxy nuclei and extranuclear star-forming complexes at a matched resolution of . In the initial investigation, Murphy et al. (2012) used the Westerbork Synthesis Radio Telescope (WSRT) in combination with the GBT to construct 1.7-to-33 GHz radio spectra for 53 galaxy nuclei and extranuclear star-forming regions on kpc scales. They found evidence that the measured thermal fraction at 33 GHz varied significantly for star-forming regions observed at different physical resolution due to the range in galaxy distance. Photometric apertures larger than kpc were observed to have thermal fractions as low as , whereas regions measured with apertures 1kpc appeared to be heavily dominated by free-free emission, with thermal fractions as high as . However, without high-resolution maps of both free-free and non-thermal emission from individual Hii regions within these larger complexes, it is difficult to determine the physical nature of these trends within nearby galaxies.
This study served as the foundation for extending the SFRS into a multi-frequency Karl G. Jansky Very Large Array (VLA) campaign to image hundreds of star-forming regions in 50 galaxies taken from the Spitzer Infrared Nearby Galaxies Survey (SINGS: Kennicutt et al., 2003) and the Key Insights on Nearby Galaxies: a Far-Infrared Survey (KINGFISH: Kennicutt et al., 2011). The results from our 33 GHz observations, along with corresponding H and Spitzer/MIPS 24m photometry were recently presented in Murphy et al. (2018a), hereafter M18a, and explored the H-to-33 GHz and 24m-to-33 GHz flux density ratios of star-forming regions as a function of galactocentric radius and physical resolution. An outlier of these distributions, NGC 4725 B, was later followed up with higher-frequency observations (Q-band: 44 GHz) in order to confirm this region as the second known source of extragalactic anomalous microwave emission (AME: Murphy et al., 2018b). Building on this analysis, we have also obtained 3 and 15 GHz imaging for the SFRS, allowing us to map the full radio spectrum of each star-forming region at a matched-resolution of . In this paper, we focus our presentation on the results associated with the radio spectral indices and corresponding free-free emission fractions for the entire sample.
The paper is organized as follows: In §2 we describe our sample selection, data reduction, and imaging procedure for the 3 - 33 GHz VLA data. In §3 we describe the ancillary data products included in this study as well as the analysis procedures used. Our results are presented in §4, and discussed in §5. Our main conclusions are summarized in §6. In the Appendix we additionally provide ancillary photometry from the Galaxy Evolution Explorer (GALEX), Spitzer, and ground-based H observations at a matched resolution of 7″ that are not used in the present analysis. Throughout the paper we report the median absolute deviations rather than standard deviations, as this statistic is more resilient against outliers in a data set.
2 Sample and Data Analysis
In this section we describe the sample selection, and present the VLA observations along with the data reduction and imaging procedures.
| Galaxy | TypeaaMorphological types, diameters, and position angles were taken from the Third Reference Catalog of Bright Galaxies (RC3: de Vaucouleurs et al., 1991). | Dist.bbRedshift-independent distance taken from the list compiled by Kennicutt et al. (2011), except for the two non-KINGFISH galaxies NGC 5194 (Ciardullo et al., 2002) and NGC 2403 (Freedman et al., 2001). | Nuc. TypeccNuclear type based on optical spectroscopy: SF Star-Forming; AGN Non-thermal emission as given in Table 5 of Moustakas et al. (2010) or (*) Table 4 of Lonsdale Persson & Helou (1987). | aaMorphological types, diameters, and position angles were taken from the Third Reference Catalog of Bright Galaxies (RC3: de Vaucouleurs et al., 1991). | P.A.aaMorphological types, diameters, and position angles were taken from the Third Reference Catalog of Bright Galaxies (RC3: de Vaucouleurs et al., 1991). | |
|---|---|---|---|---|---|---|
| (Mpc) | (arcmin) | () | () | |||
| NGC 0337 | SBd | 19.3 | SF | 52 | 130 | |
| NGC 0628 | SAc | 7.2 | 25 | 25 | ||
| NGC 0855 | E | 9.73 | SF | 70 | 67d | |
| NGC 0925 | SABd | 9.12 | SF | 57 | 102 | |
| NGC 1097 | SBb | 14.2 | AGN | 48 | 130 | |
| NGC 1266 | SB0 | 30.6 | AGN | 49 | 108d | |
| NGC 1377 | S0 | 24.6 | 61 | 92 | ||
| IC 0342 | SABcd | 3.28 | SF(*) | 21 | 153d | |
| NGC 1482 | SA0 | 22.6 | SF | 57 | 103 | |
| NGC 2146 | Sbab | 17.2 | SF(*) | 56 | 57 | |
| NGC 2403 | SABcd | 3.22 | SF(*) | 57 | 128 | |
| Holmberg II | Im | 3.05 | 37 | 16 | ||
| NGC 2798 | SBa | 25.8 | SF/AGN | 70 | 160 | |
| NGC 2841 | SAb | 14.1 | AGN | 66 | 147 | |
| NGC 2976 | SAc | 3.55 | SF | 64 | 143 | |
| NGC 3049 | SBab | 19.2 | SF | 51 | 25 | |
| NGC 3077 | I0pec | 3.83 | SF(*) | 34 | 45 | |
| NGC 3190 | SAap | 19.3 | AGN(*) | 73 | 125 | |
| NGC 3184 | SABcd | 11.7 | SF | 21 | 135 | |
| NGC 3198 | SBc | 14.1 | SF | 68 | 35 | |
| IC 2574 | SABm | 3.79 | SF(*) | 67 | 50 | |
| NGC 3265 | E | 19.6 | SF | 39 | 73 | |
| NGC 3351 | SBb | 9.33 | SF | 48 | 13 | |
| NGC 3521 | SABbc | 11.2 | SF/AGN(*) | 63 | 163 | |
| NGC 3621 | SAd | 6.55 | AGN | 55 | 159 | |
| NGC 3627 | SABb | 9.38 | AGN | 64 | 173 | |
| NGC 3773 | SA0 | 12.4 | SF | 33 | 165 | |
| NGC 3938 | SAc | 17.9 | SF(*) | 25 | 29d | |
| NGC 4254 | SAc | 14.4 | SF/AGN | 30 | 24d | |
| NGC 4321 | SABbc | 14.3 | AGN | 32 | 30 | |
| NGC 4536 | SABbc | 14.5 | SF/AGN | 66 | 130 | |
| NGC 4559 | SABcd | 6.98 | SF | 67 | 150 | |
| NGC 4569 | SABab | 9.86 | AGN | 64 | 23 | |
| NGC 4579 | SABb | 16.4 | AGN | 37 | 95 | |
| NGC 4594 | SAa | 9.08 | AGN | 69 | 90 | |
| NGC 4625 | SABmp | 9.3 | SF | 31 | 28d | |
| NGC 4631 | SBd | 7.62 | SF(*) | 83 | 86 | |
| NGC 4725 | SABab | 11.9 | AGN | 45 | 35 | |
| NGC 4736 | SAab | 4.66 | AGN(*) | 35 | 105 | |
| NGC 4826 | SAab | 5.27 | AGN | 59 | 115 | |
| NGC 5055 | SAbc | 7.94 | AGN | 56 | 105 | |
| NGC 5194 | SABbcp | 7.62 | AGN | 53 | 163 | |
| NGC 5398 | SBdm | 7.66 | 53 | 172 | ||
| NGC 5457 | SABcd | 6.7 | SF(*) | 26 | 29d | |
| NGC 5474 | SAcd | 6.8 | SF(*) | 27 | 98d | |
| NGC 5713 | SABbcp | 21.4 | SF | 27 | 10 | |
| NGC 5866 | S0 | 15.3 | AGN | 69 | 128 | |
| NGC 6946 | SABcd | 6.8 | SF | 32 | 53d | |
| NGC 7331 | SAb | 14.5 | AGN | 72 | 171 | |
| NGC 7793 | SAd | 3.91 | SF | 48 | 98 |
2.1 Sample Selection
The SFRS sample includes targeted observations from 56 nearby galaxies ( Mpc) in the SINGS and KINGFISH legacy programs (Table 1). All nuclear and extranuclear star-forming regions were chosen to have mid-infrared spectral mappings carried out by the IRS instrument on board Spitzer, and Herschel/PACS far-infrared spectral mappings, for a combination of the principal atomic ISM cooling lines ([OI] 63m, [OIII] 88m, [NII] 122, 205m, and [CII] 158m). NGC 5194 and NGC 2403 are exceptions; these galaxies were part of the SINGS sample, but are not formally included in KINGFISH. They were observed with Herschel as part of the Very Nearby Galaxy Survey (VNGS; PI: C. Wilson). Similarly, there are additional KINGFISH galaxies that were not part of SINGS, but have existing Spitzer data: NGC 5457 (M101), IC 342, NGC 3077, and NGC 2146.
The SINGS and KINGFISH galaxies are fully representative of the integrated properties and ISM conditions found in the local Universe, spanning the full range in morphological types, as well as a factor of 100 in IR luminosity (: 8-1000m), global IR/optical flux ratio, and the star formation rate. Similarly, the spectroscopically targeted star-forming regions included in the SFRS cover the full range of physical conditions found in nearby galaxies, including the extinction-corrected production rate of ionizing photons , metallicity, visual extinction, radiation field intensity, and ionizing stellar temperature.
The full sample over the entire sky consists of 118 star-forming complexes (56 nuclei and 62 extranuclear regions), 112 of which (50 nuclei and 62 extranuclear regions; see Tables 2 and 3, respectively) are observable with the VLA (i.e., having ). The coordinates given in both tables list the pointing center for the VLA observations (see Section 2.2), which correspond to the centers of the Spitzer mid-infrared and Herschel far-infrared spectral line maps. Morphologies, adopted distances, optically-defined nuclear types, diameters (), inclinations (i), and position angles (P.A.) for each source are given in Table 1 and described in detail in M18a.
2.2 VLA Observations and Data Reduction
The observational set-up and reduction procedure for the Ka-band ( GHz) data (11B-032,13A-129) is described in detail in M18a. Observations in the S-band ( GHz) were taken during the 2013 VLA B-configuration cycle (13B-215), and utilized the 8-bit sampler. Observations in the Ku-band ( GHz) were taken November 2014 in the C-configuration (13B-215) using the 3-bit samplers. Both sets of observations utilized the full available bandwidth of the respective receivers. Given the large range in brightness among our targeted regions, we varied the time spent on-source by estimating the expected GHz flux density using the Spitzer/MIPS 24 m maps. The median integration time for regions in our sample was 10 minutes at both frequencies. The choice of array configurations were made to match the angular resolution (i.e., FWHM of the synthesized beam ) of the observations at each band. This allows us to probe the same spatial scales across the full GHz frequency range, and ensures that any differences in the measured spectral index of individual star-forming regions is due to physical variation in the region being measured, and not due to resolving out more emission at higher frequencies.
The standard VLA flux density calibrators 3C48, 3C286, and 3C147 were used, and the data reduction procedures presented in M18a are repeated for our present analysis, and briefly described here. To reduce the VLA data, we used the Common Astronomy Software Applications (CASA; McMullin et al., 2007) versions 4.6.0 and 4.7.0, and followed standard calibration and flagging procedures, including the utilization of the VLA calibration pipeline. We further inspected the visibilities and calibration tables for evidence of bad antennas, frequency ranges, and time ranges, flagging correspondingly. We also flagged any instances of radio frequency interference (RFI). Importantly, the fractional bandwidth of our observations lost to RFI flagging is negligible relative to the full bandwidth of the receivers. After flagging, we re-ran the pipeline, and repeated this process until all poorly-calibrated data were removed. For all delay and bandpass tables applied on-the-fly, we used the default nearest-neighbor interpolation. For complex gain and flux density scale tables, we used a linear interpolation.
| 3 GHz | 15 GHz | |||||||
|---|---|---|---|---|---|---|---|---|
| Galaxy | R.A. | Decl. | Synthesized | Synthesized | ||||
| (J2000) | (J2000) | Beam | (Jy bm-1) | (mK) | Beam | (Jy bm-1) | (mK) | |
| NGC 0337 | 18.7 | 597.32 | 9.1 | 21.71 | ||||
| NGC 0628 | 14.0 | 543.15 | 9.6 | 28.14 | ||||
| NGC 0855 | 13.2 | 613.61 | 8.6 | 24.93 | ||||
| NGC 0925 | 13.0 | 611.30 | 9.1 | 27.04 | ||||
| NGC 1097 | 44.9 | 586.45 | 16.9 | 24.11 | ||||
| NGC 1266 | 14.0 | 485.33 | 11.3 | 28.86 | ||||
| NGC 1377 | 17.4 | 385.40 | 11.6 | 21.93 | ||||
| IC 0342 | 41.6 | 1430.61 | 11.4 | 31.44 | ||||
| NGC 1482 | 16.8 | 419.18 | 14.1 | 23.56 | ||||
| NGC 2146 | 35.5 | 1214.57 | 14.9 | 44.68 | ||||
| NGC 2403 | 13.8 | 551.32 | 9.8 | 24.41 | ||||
| Holmberg II | 14.9 | 465.55 | 9.4 | 22.41 | ||||
| NGC 2798 | 14.6 | 520.66 | 11.3 | 27.83 | ||||
| NGC 2841 | 13.3 | 526.88 | 18.1 | 50.13 | ||||
| NGC 2976 | 14.4 | 413.49 | 9.7 | 23.08 | ||||
| NGC 3049 | 14.9 | 510.77 | 12.2 | 27.98 | ||||
| NGC 3077 | 14.4 | 402.59 | 10.2 | 24.82 | ||||
| NGC 3190 | 13.5 | 475.29 | 8.5 | 22.63 | ||||
| NGC 3184 | 14.0 | 444.09 | 8.5 | 30.49 | ||||
| NGC 3198 | 14.4 | 521.10 | 8.5 | 29.06 | ||||
| IC 2574 | 14.2 | 393.53 | 8.8 | 20.73 | ||||
| NGC 3265 | 14.9 | 505.30 | 7.8 | 23.42 | ||||
| NGC 3351 | 18.4 | 708.89 | 15.3 | 25.34 | ||||
| NGC 3521 | 19.9 | 448.93 | 16.4 | 39.79 | ||||
| NGC 3621 | 15.7 | 291.11 | 8.5 | 10.16 | ||||
| NGC 3627 | 15.7 | 616.48 | 14.0 | 16.23 | ||||
| NGC 3773 | 13.1 | 518.26 | 9.8 | 30.21 | ||||
| NGC 3938 | 15.1 | 376.61 | 7.9 | 31.23 | ||||
| NGC 4254 | 15.3 | 577.12 | 9.0 | 28.58 | ||||
| NGC 4321 | 15.0 | 622.65 | 9.8 | 29.55 | ||||
| NGC 4536 | 15.5 | 524.37 | 10.2 | 15.58 | ||||
| NGC 4559 | 13.6 | 646.04 | 9.0 | 29.13 | ||||
| NGC 4569 | 15.4 | 572.68 | 10.7 | 29.15 | ||||
| NGC 4579 | 23.4 | 807.73 | 50.9 | 132.87 | ||||
| NGC 4594 | 19.7 | 554.75 | 13.4 | 32.88 | ||||
| NGC 4625 | 13.5 | 677.51 | 9.7 | 29.19 | ||||
| NGC 4631 | 14.3 | 597.52 | 12.9 | 16.71 | ||||
| NGC 4725 | 13.5 | 561.64 | 9.0 | 29.20 | ||||
| NGC 4736 | 13.9 | 706.09 | 13.4 | 15.67 | ||||
| NGC 4826 | 14.3 | 559.38 | 10.1 | 28.20 | ||||
| NGC 5055 | 12.8 | 619.07 | 9.7 | 29.58 | ||||
| NGC 5194 | 17.0 | 820.75 | 9.3 | 28.43 | ||||
| NGC 5398 | 20.6 | 239.46 | 8.4 | 11.09 | ||||
| NGC 5457 | 13.9 | 619.05 | 8.6 | 27.29 | ||||
| NGC 5474 | 14.3 | 616.05 | 11.9 | 40.40 | ||||
| NGC 5713 | 17.6 | 526.76 | 15.4 | 19.67 | ||||
| NGC 5866 | 13.8 | 595.03 | 15.4 | 42.92 | ||||
| NGC 6946 | 16.1 | 655.75 | 9.5 | 21.44 | ||||
| NGC 7331 | 15.1 | 672.97 | 10.0 | 29.80 | ||||
| NGC 7793 | 14.0 | 245.06 | 9.4 | 10.50 | ||||
Note. — See Murphy et al. (2018a) for the 33 GHz imaging characteristics.
| 3 GHz | 15 GHz | |||||||
|---|---|---|---|---|---|---|---|---|
| Enuc. ID | R.A. | Decl. | Synthesized | Synthesized | ||||
| (J2000) | (J2000) | Beam | (Jy bm-1) | (mK) | Beam | (Jy bm-1) | (mK) | |
| NGC 0628 Enuc. 1 | 14.0 | 542.77 | 9.8 | 28.16 | ||||
| NGC 0628 Enuc. 2 | 14.0 | 544.62 | 9.6 | 27.27 | ||||
| NGC 0628 Enuc. 3 | 14.0 | 542.12 | 9.6 | 26.82 | ||||
| NGC 0628 Enuc. 4 | 13.8 | 537.98 | 8.0 | 23.07 | ||||
| NGC 1097 Enuc. 1 | 41.2 | 537.94 | 11.8 | 17.84 | ||||
| NGC 1097 Enuc. 2 | 38.3 | 500.07 | 11.4 | 16.42 | ||||
| NGC 2403 Enuc. 1 | 13.7 | 548.00 | 9.4 | 23.61 | ||||
| NGC 2403 Enuc. 2 | 13.7 | 547.71 | 9.5 | 23.96 | ||||
| NGC 2403 Enuc. 3 | 13.7 | 548.41 | 9.7 | 24.51 | ||||
| NGC 2403 Enuc. 4 | 13.7 | 546.14 | 9.5 | 24.86 | ||||
| NGC 2403 Enuc. 5 | 13.5 | 541.72 | 9.5 | 24.84 | ||||
| NGC 2403 Enuc. 6 | 13.5 | 541.23 | 9.7 | 26.15 | ||||
| NGC 2976 Enuc. 1 | 14.5 | 415.03 | 9.8 | 23.62 | ||||
| NGC 2976 Enuc. 2 | 14.4 | 412.17 | 10.0 | 24.19 | ||||
| NGC 3521 Enuc. 1 | 19.4 | 436.89 | 14.0 | 32.41 | ||||
| NGC 3521 Enuc. 2 | 19.8 | 445.88 | 11.7 | 27.66 | ||||
| NGC 3521 Enuc. 3 | 18.9 | 425.62 | 11.6 | 25.02 | ||||
| NGC 3627 Enuc. 1 | 15.4 | 604.26 | 9.0 | 26.70 | ||||
| NGC 3627 Enuc. 2 | 15.7 | 614.25 | 15.7 | 31.48 | ||||
| NGC 3627 Enuc. 3 | 15.7 | 616.15 | 13.4 | 40.92 | ||||
| NGC 3938 Enuc. 1 | 15.0 | 374.91 | 8.3 | 31.38 | ||||
| NGC 3938 Enuc. 2 | 14.8 | 368.03 | 8.3 | 31.40 | ||||
| NGC 4254 Enuc. 1 | 15.1 | 567.30 | 8.5 | 26.05 | ||||
| NGC 4254 Enuc. 2 | 15.3 | 575.22 | 9.6 | 29.55 | ||||
| NGC 4321 Enuc. 1 | 14.9 | 620.02 | 9.8 | 29.30 | ||||
| NGC 4321 Enuc. 2 | 14.9 | 618.78 | 9.9 | 29.98 | ||||
| NGC 4631 Enuc. 1 | 14.0 | 577.02 | 9.1 | 23.44 | ||||
| NGC 4631 Enuc. 2 | 13.9 | 578.32 | 9.0 | 23.48 | ||||
| NGC 4736 Enuc. 1 | 13.9 | 705.86 | 12.9 | 38.89 | ||||
| NGC 5055 Enuc. 1 | 13.1 | 630.58 | 9.9 | 30.50 | ||||
| NGC 5194 Enuc. 1 | 16.8 | 810.49 | 9.1 | 28.20 | ||||
| NGC 5194 Enuc. 2 | 17.0 | 863.15 | 8.9 | 27.62 | ||||
| NGC 5194 Enuc. 3 | 16.9 | 858.25 | 9.1 | 28.37 | ||||
| NGC 5194 Enuc. 4 | 16.0 | 768.85 | 9.5 | 29.61 | ||||
| NGC 5194 Enuc. 5 | 16.1 | 773.77 | 9.7 | 30.21 | ||||
| NGC 5194 Enuc. 6 | 15.8 | 805.61 | 8.7 | 27.81 | ||||
| NGC 5194 Enuc. 7 | 17.8 | 904.22 | 9.3 | 29.80 | ||||
| NGC 5194 Enuc. 8 | 16.7 | 803.48 | 9.7 | 28.04 | ||||
| NGC 5194 Enuc. 9 | 17.0 | 819.52 | 10.7 | 31.20 | ||||
| NGC 5194 Enuc. 10 | 18.1 | 921.23 | 10.8 | 31.55 | ||||
| NGC 5194 Enuc. 11 | 16.3 | 783.23 | 12.8 | 36.27 | ||||
| NGC 5457 Enuc. 1 | 13.8 | 615.51 | 8.4 | 26.65 | ||||
| NGC 5457 Enuc. 2 | 14.1 | 643.39 | 8.5 | 27.14 | ||||
| NGC 5457 Enuc. 3 | 14.1 | 627.94 | 25.0 | 13.13 | ||||
| NGC 5457 Enuc. 4 | 13.8 | 590.56 | 9.5 | 30.71 | ||||
| NGC 5457 Enuc. 5 | 13.8 | 629.72 | 10.8 | 36.48 | ||||
| NGC 5457 Enuc. 6 | 13.7 | 596.38 | 11.9 | 39.68 | ||||
| NGC 5457 Enuc. 7 | 13.7 | 589.02 | 13.0 | 44.82 | ||||
| NGC 5713 Enuc. 1 | 17.6 | 525.60 | 15.9 | 20.36 | ||||
| NGC 5713 Enuc. 2 | 17.6 | 527.29 | 15.9 | 20.36 | ||||
| NGC 6946 Enuc. 1 | 15.2 | 616.55 | 8.3 | 19.75 | ||||
| NGC 6946 Enuc. 2 | 15.0 | 609.01 | 9.8 | 24.32 | ||||
| NGC 6946 Enuc. 3 | 15.0 | 608.66 | 8.7 | 20.65 | ||||
| NGC 6946 Enuc. 4 | 14.8 | 603.01 | 10.1 | 11.78 | ||||
| NGC 6946 Enuc. 5 | 15.1 | 604.38 | 8.8 | 22.34 | ||||
| NGC 6946 Enuc. 6 | 15.7 | 636.59 | 8.6 | 21.28 | ||||
| NGC 6946 Enuc. 7 | 15.7 | 636.59 | 8.8 | 19.64 | ||||
| NGC 6946 Enuc. 8 | 15.8 | 639.98 | 8.7 | 21.20 | ||||
| NGC 6946 Enuc. 9 | 15.7 | 636.59 | 8.8 | 19.64 | ||||
| NGC 7793 Enuc. 1 | 13.9 | 243.82 | 9.6 | 10.26 | ||||
| NGC 7793 Enuc. 2 | 14.0 | 244.33 | 9.8 | 10.09 | ||||
| NGC 7793 Enuc. 3 | 14.0 | 245.29 | 8.8 | 9.84 | ||||
Note. — See Murphy et al. (2018a) for the 33 GHz imaging characteristics.
2.3 Interferometric Imaging
Calibrated VLA measurement sets for each source were imaged using the task tclean in CASA version 4.6.0. For some cases, the Ka-band images contain data from observations taken during both the 11B and 13A semesters, but are heavily weighted by the 13A semester observations, as those include significantly more data. The mode of tclean was set to multi-frequency synthesis (mfs; Conway et al., 1990; Sault & Wieringa, 1994). We chose a pixel scale of for all three bands, and adopted Briggs weighting with robust and nterms . This allows the cleaning procedure to also model the spectral index variations on the sky. Although this procedure utilizes the large fractional bandwidths of each observation to generate in-band spectral index maps, we do not use them in our analysis given that the signal-to-noise ratio () of our sources is typically too low for them to be reliable. To help deconvolve extended low-intensity emission, we took advantage of the multiscale clean option (Cornwell, 2008; Rau & Cornwell, 2011) in CASA, searching for structures with scales 1 and 3 times the FWHM of the synthesized beam. The choice of our final imaging parameters was the result of extensive experimentation to identify values that yielded the best combination of brightness-temperature sensitivity and reduction of artifacts resulting from strong sidelobes in the naturally weighted beam for these snapshot-like observations.
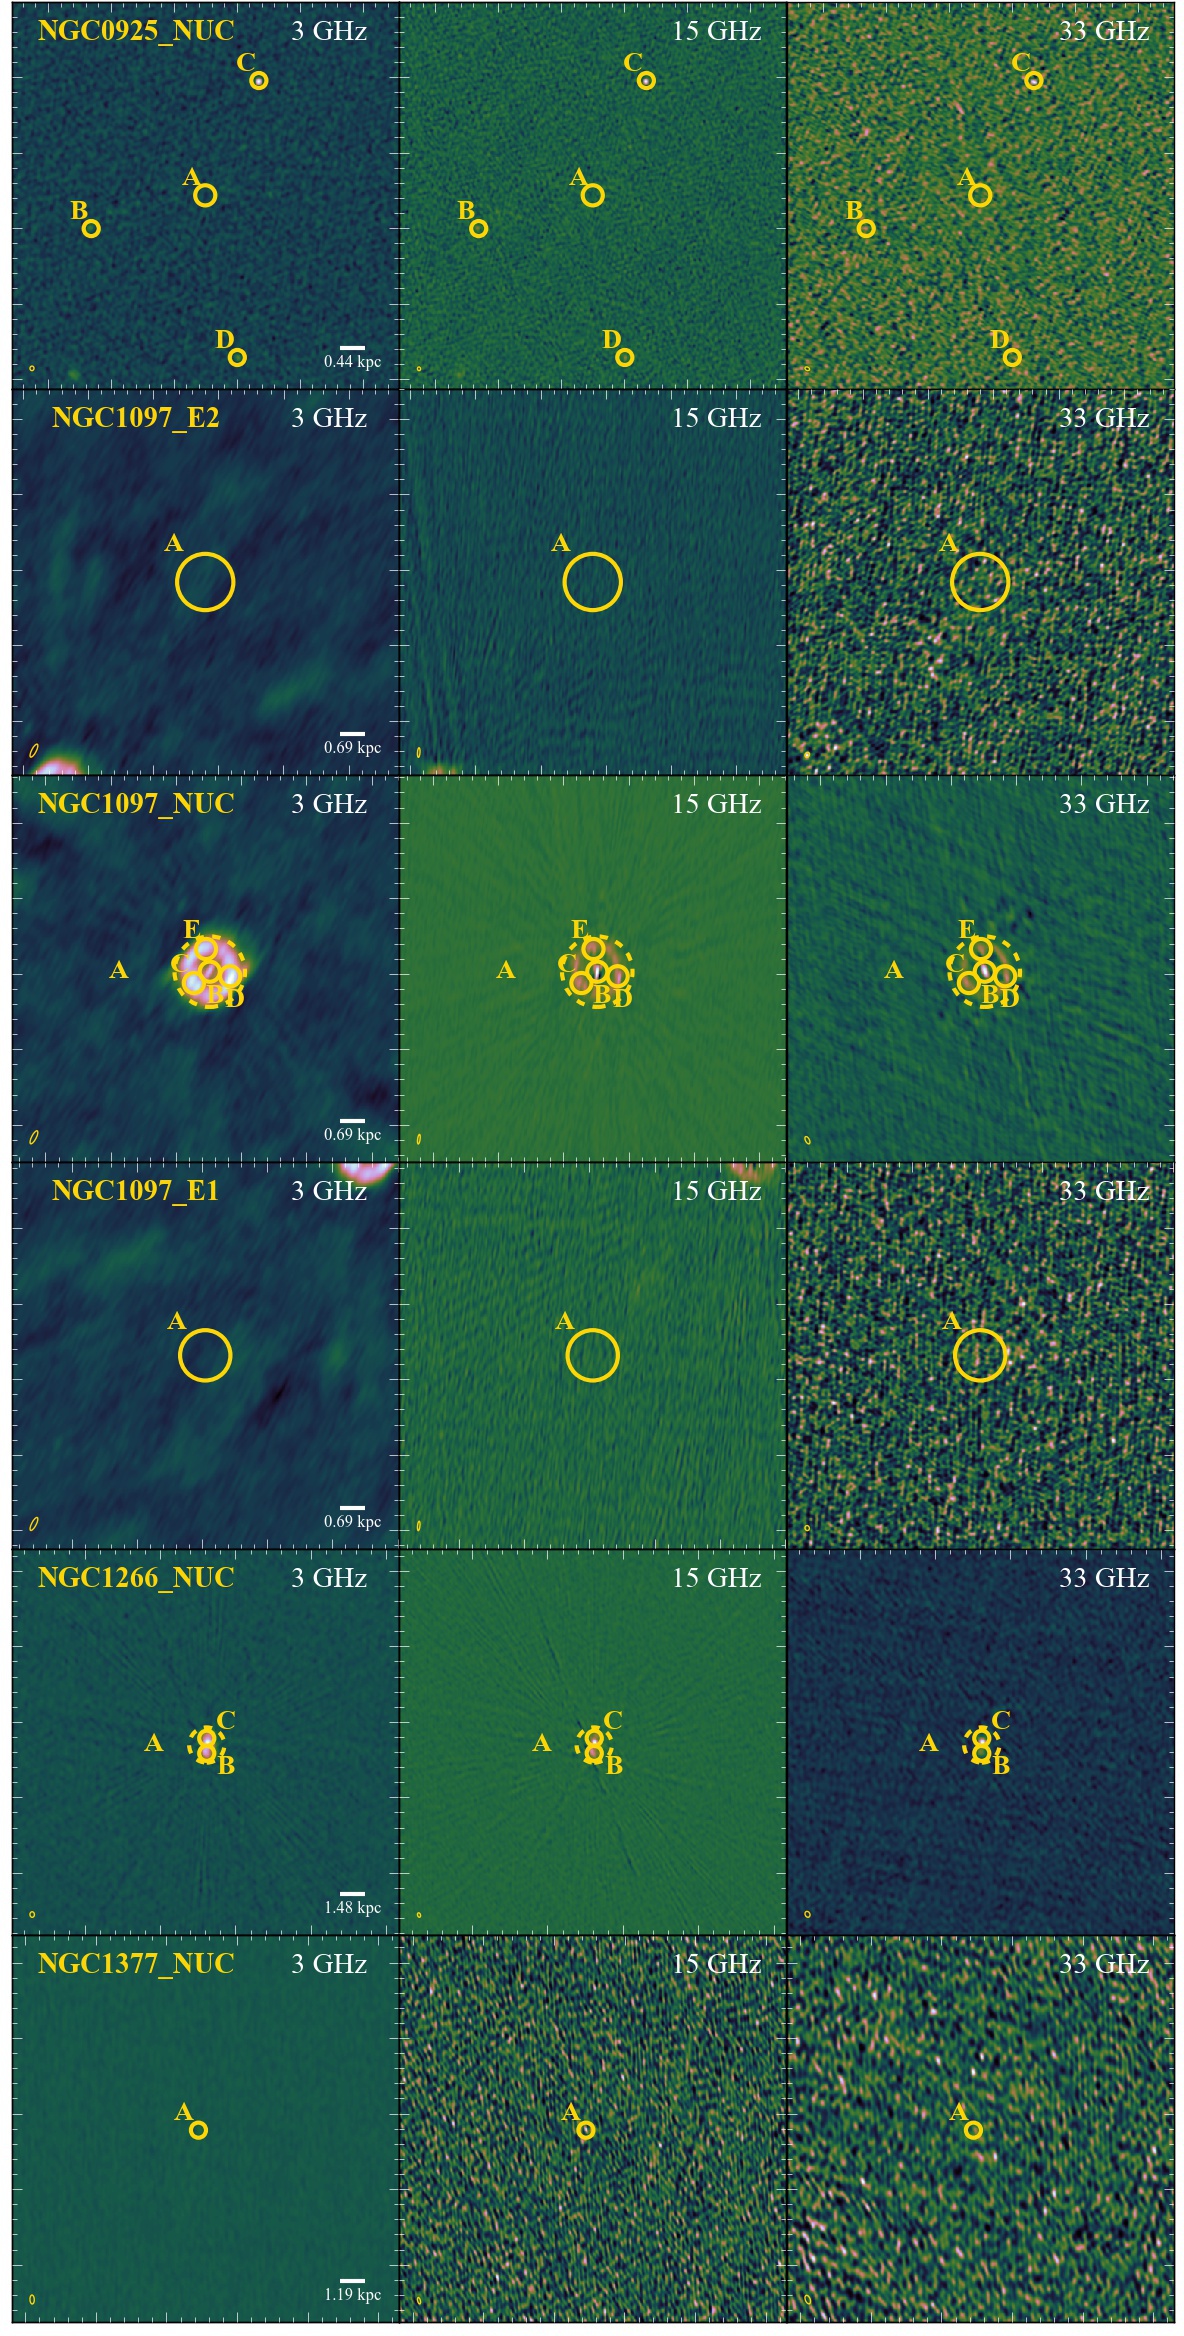
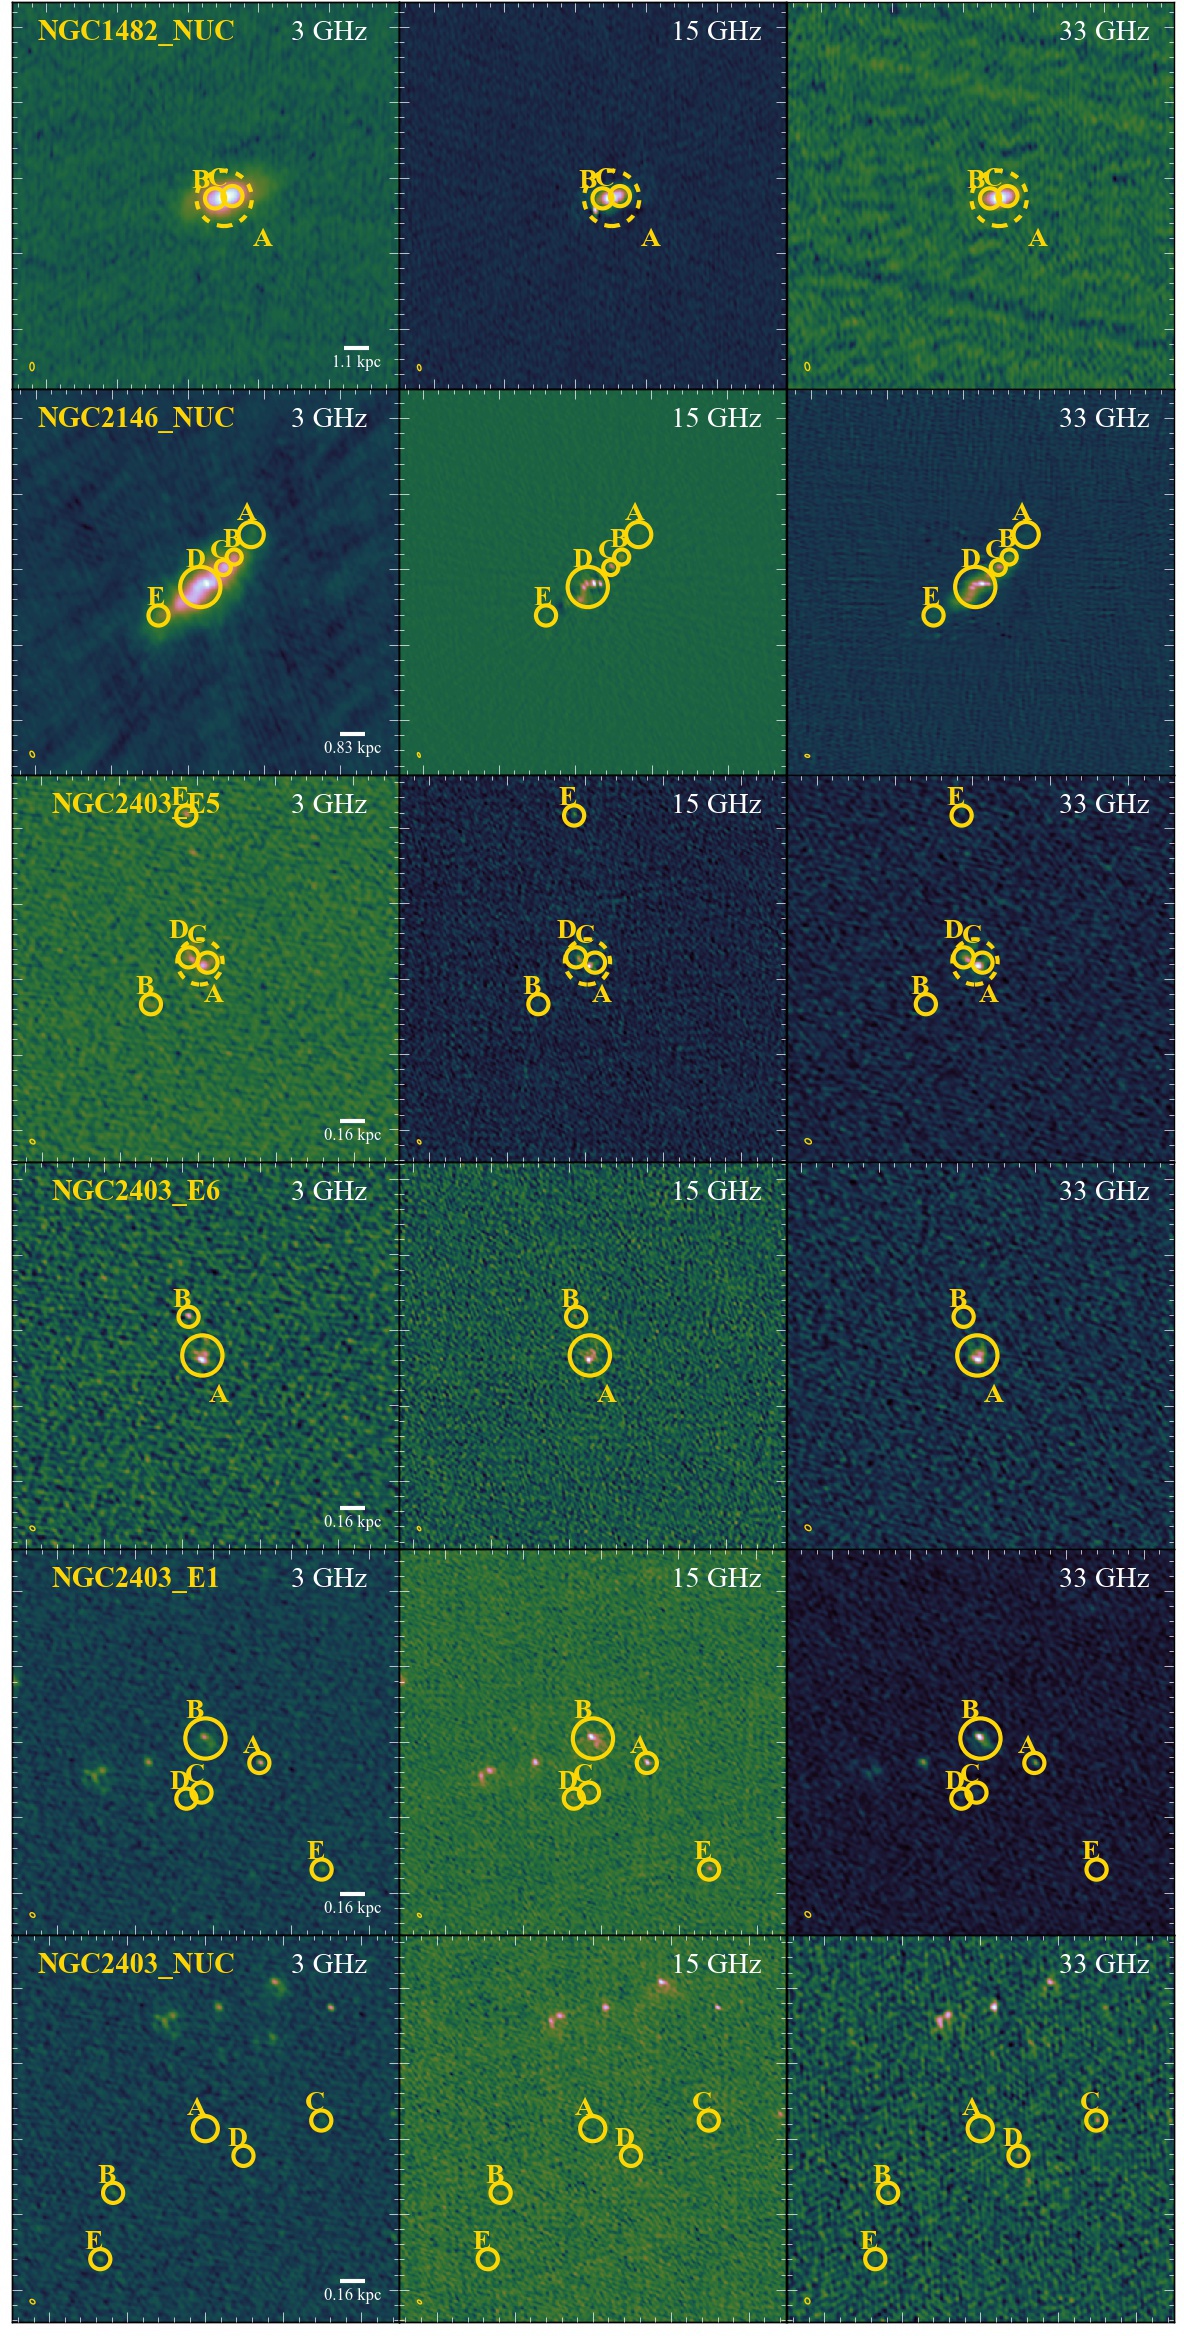
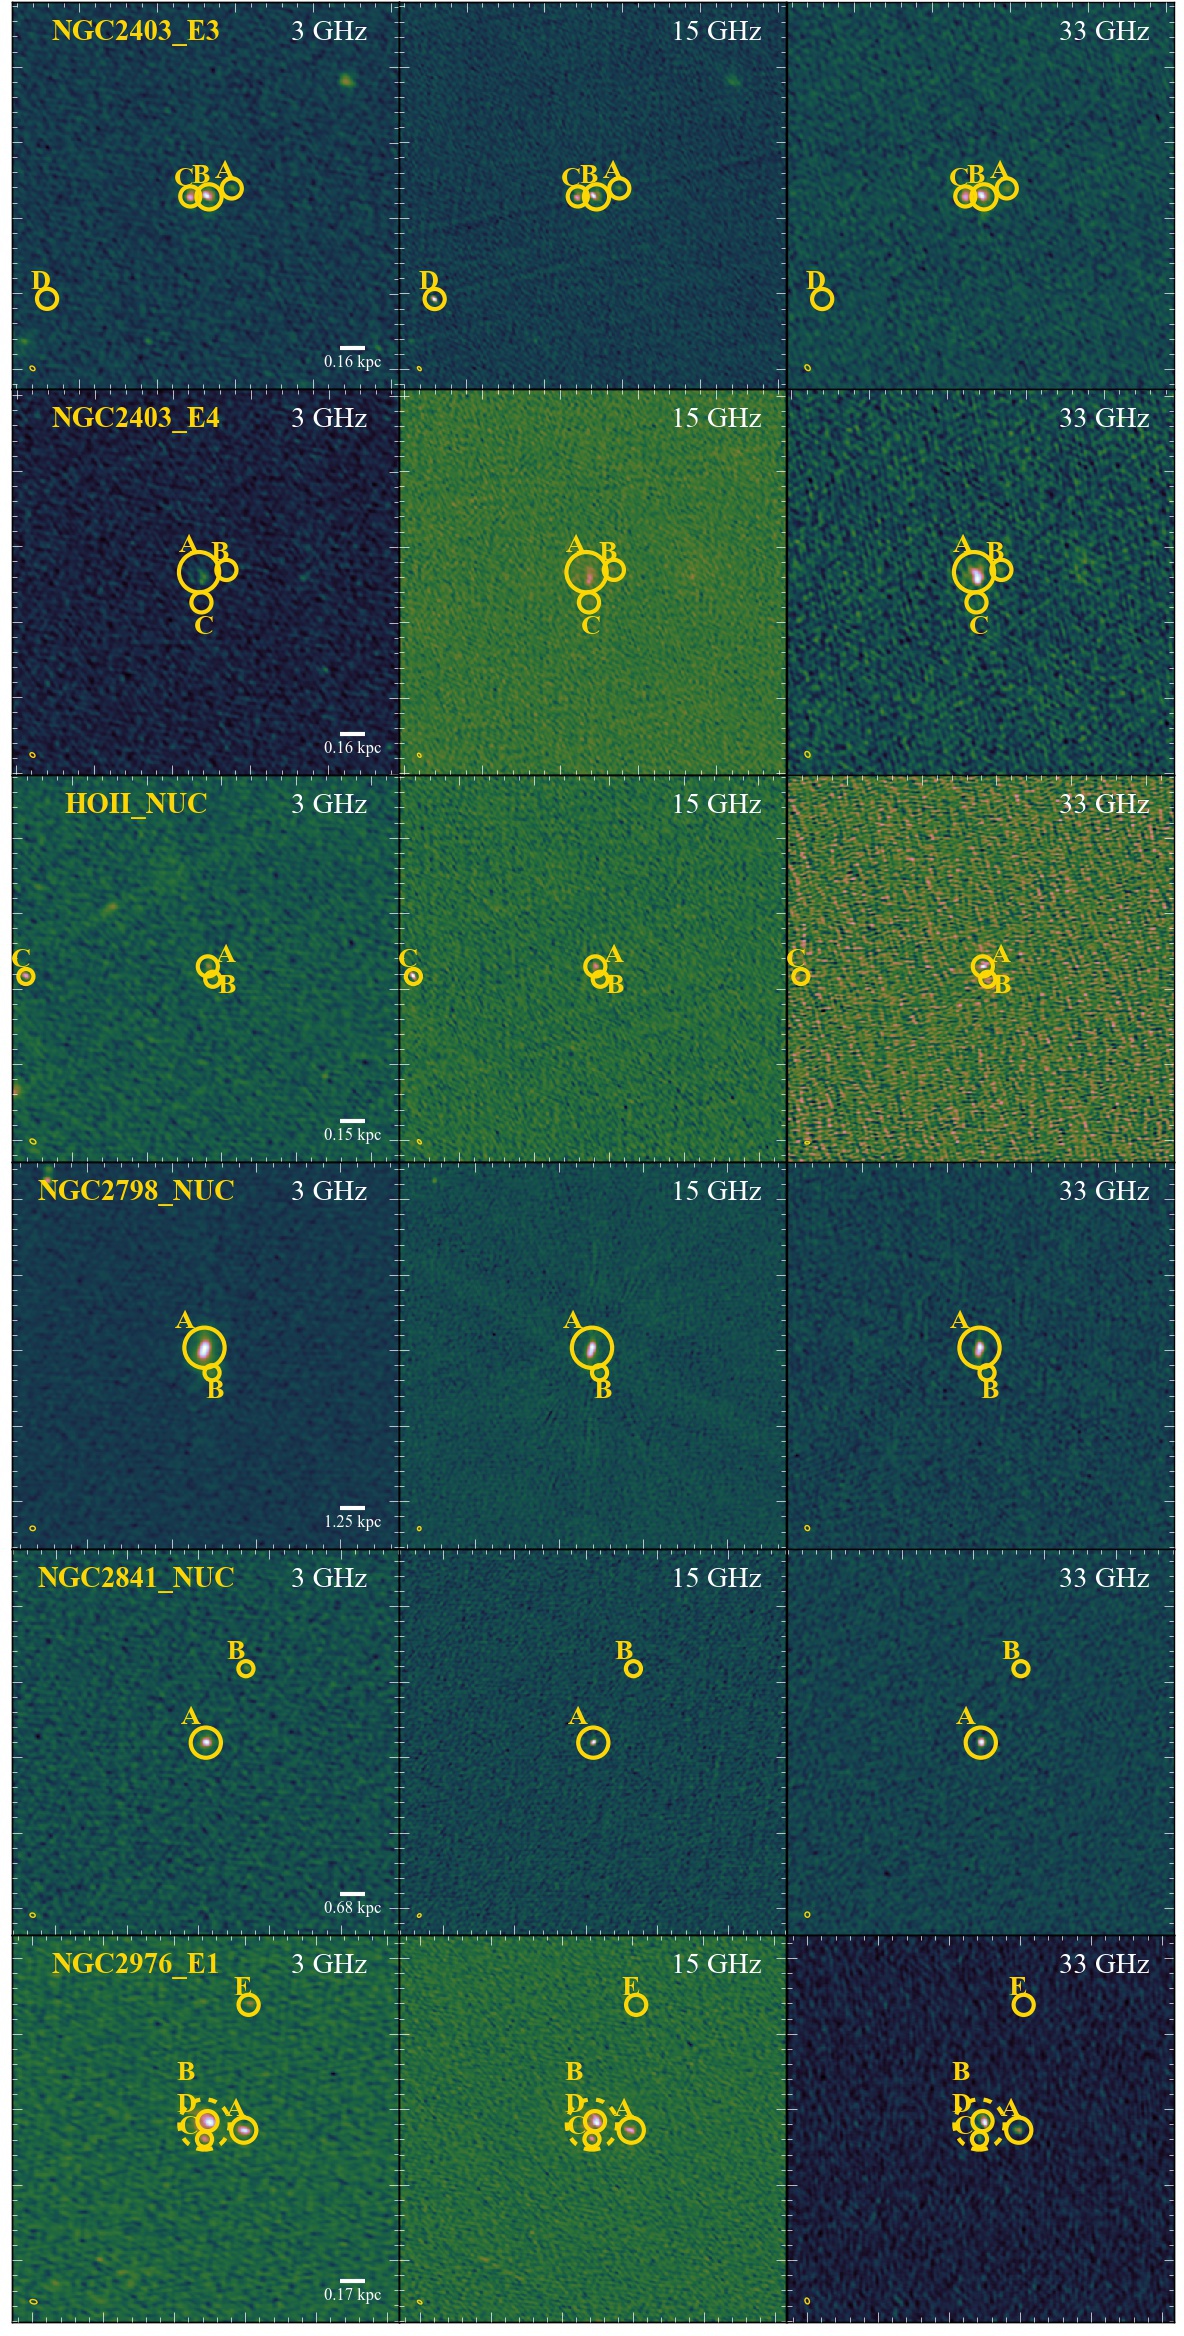
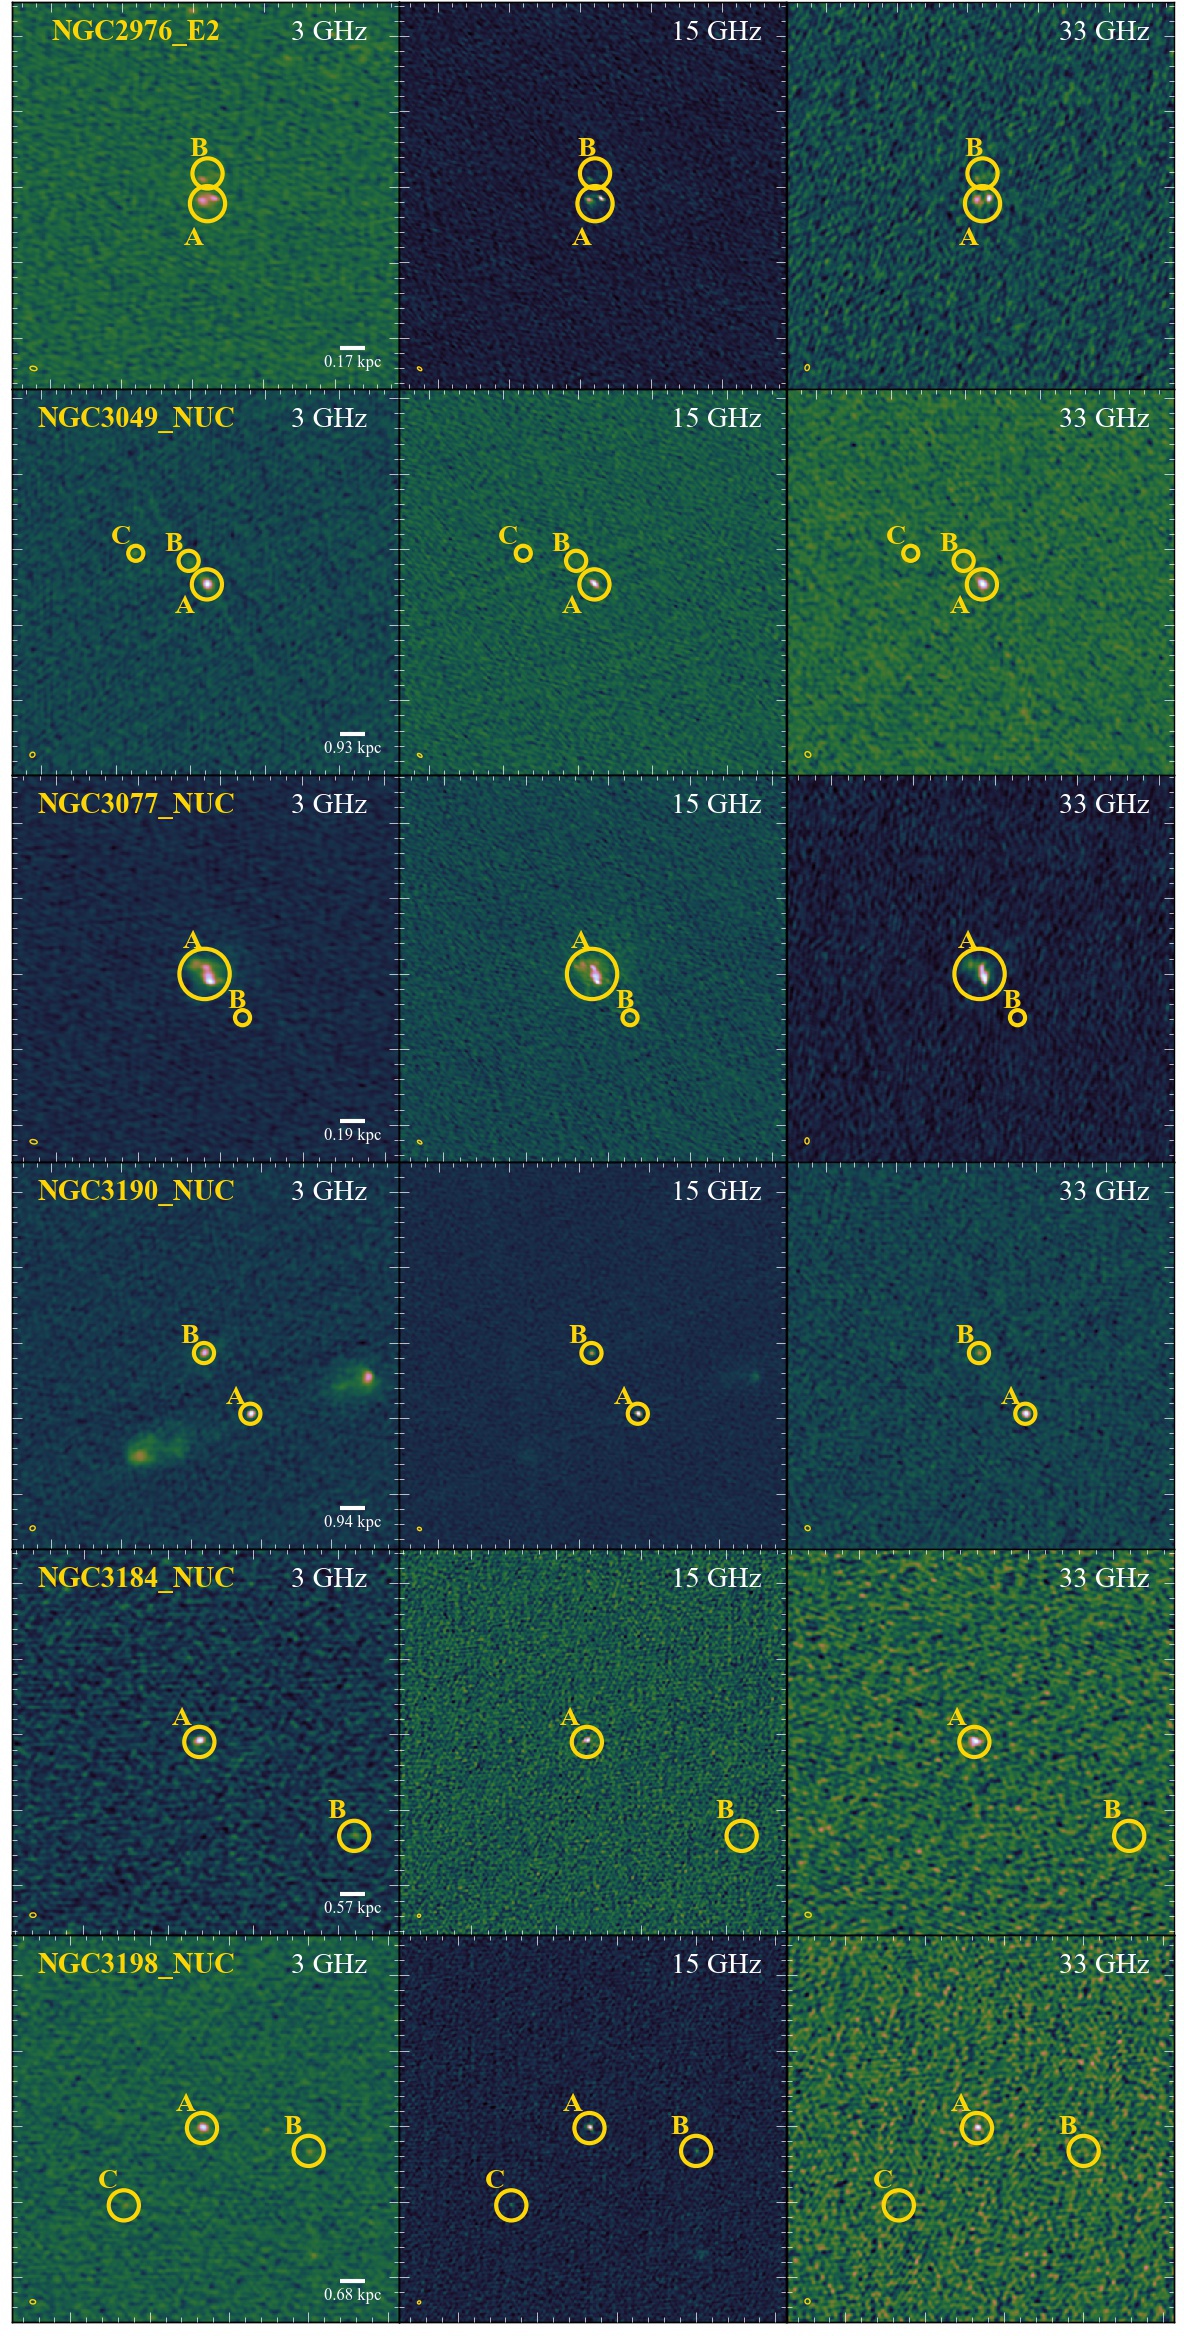
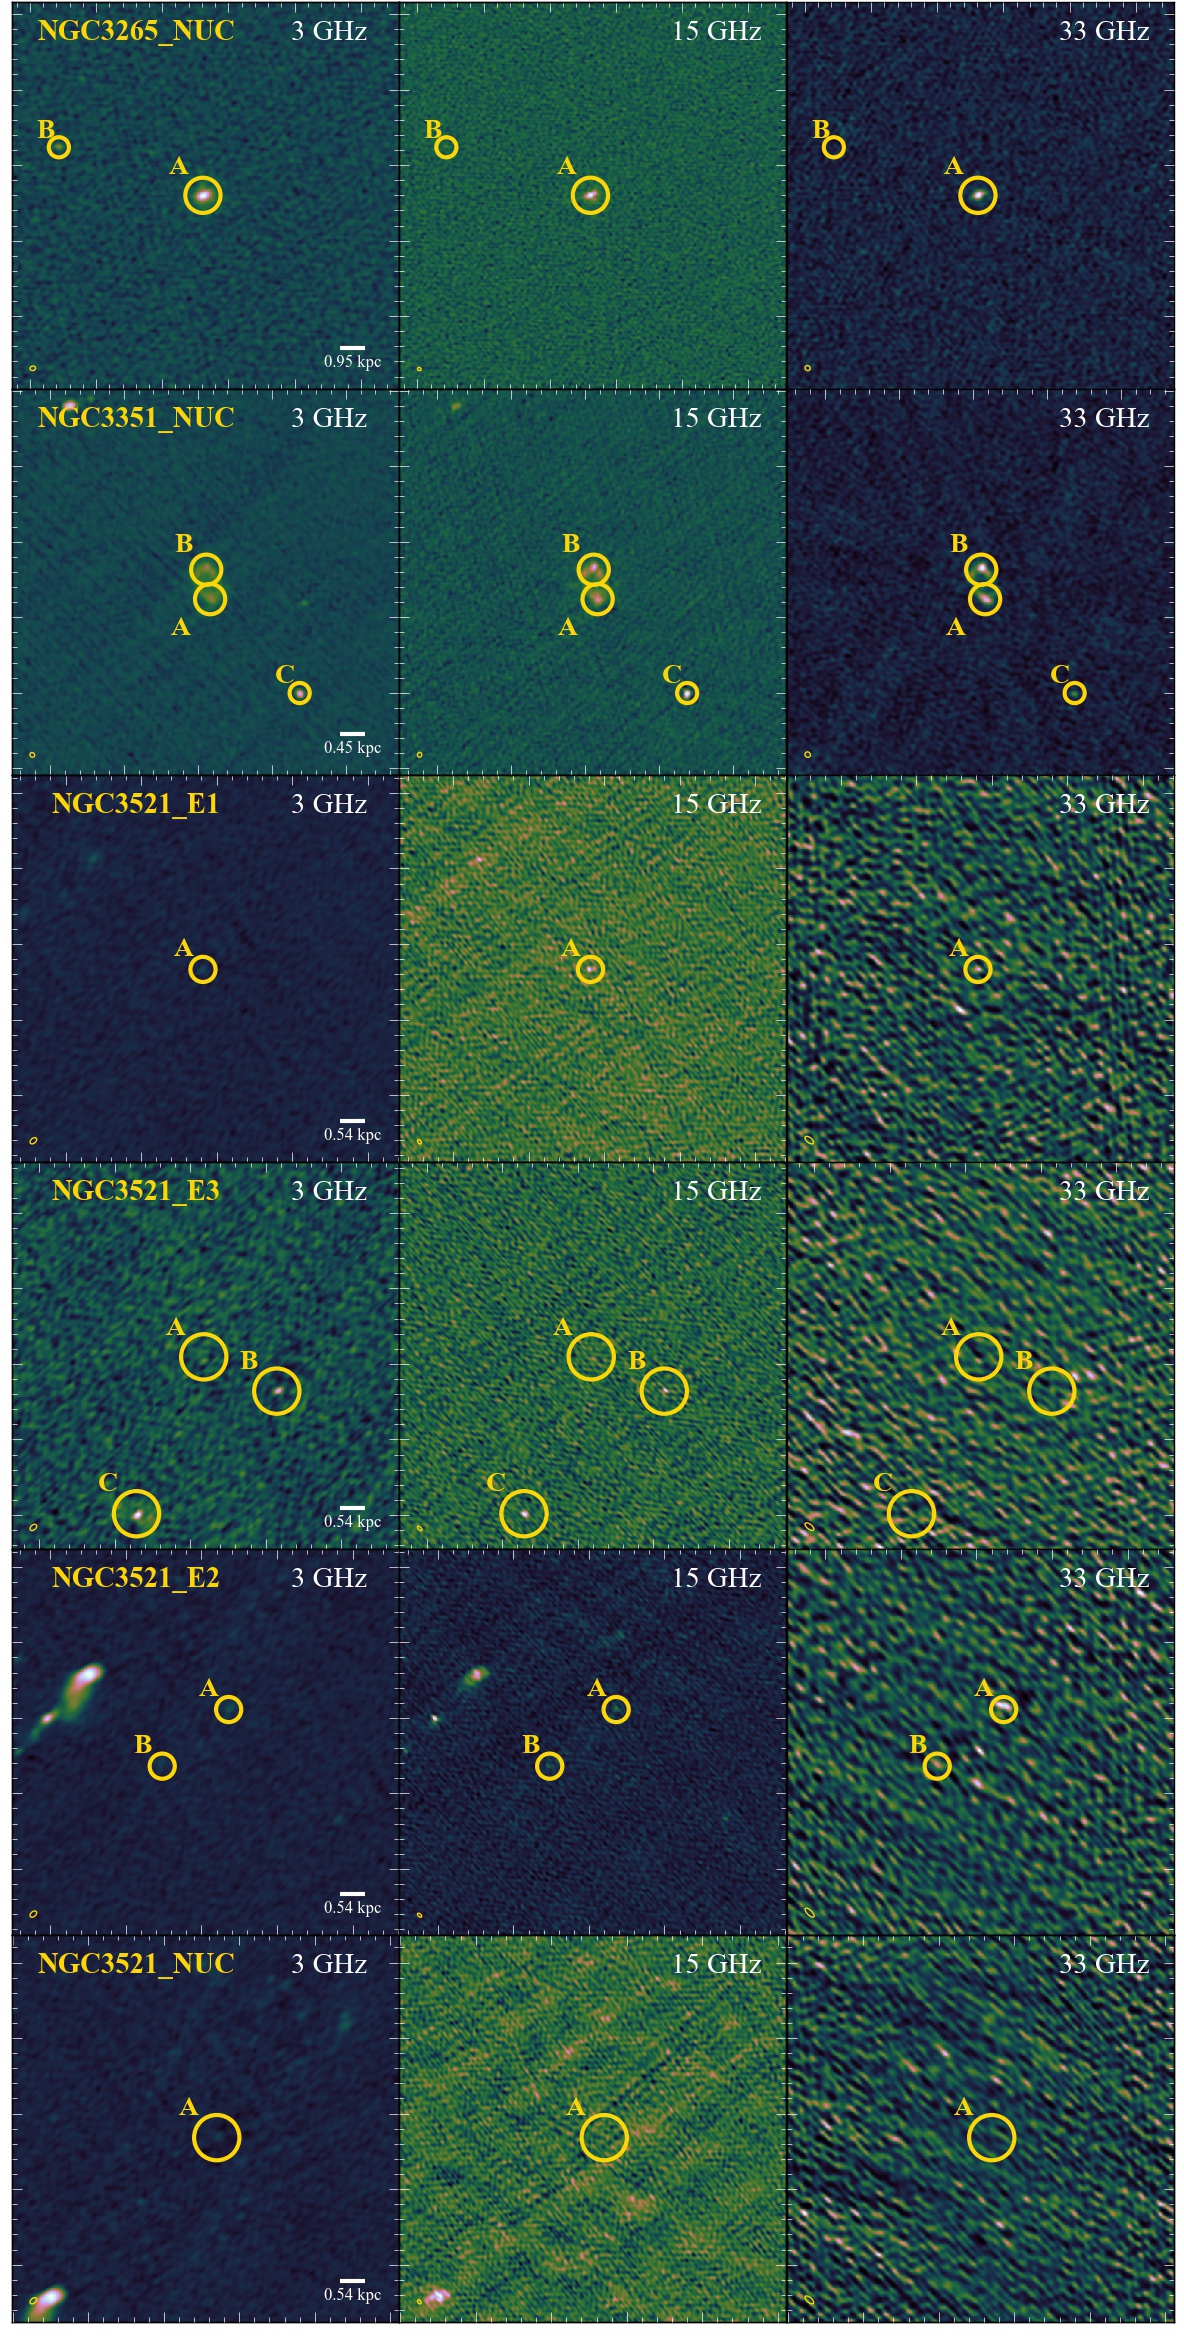
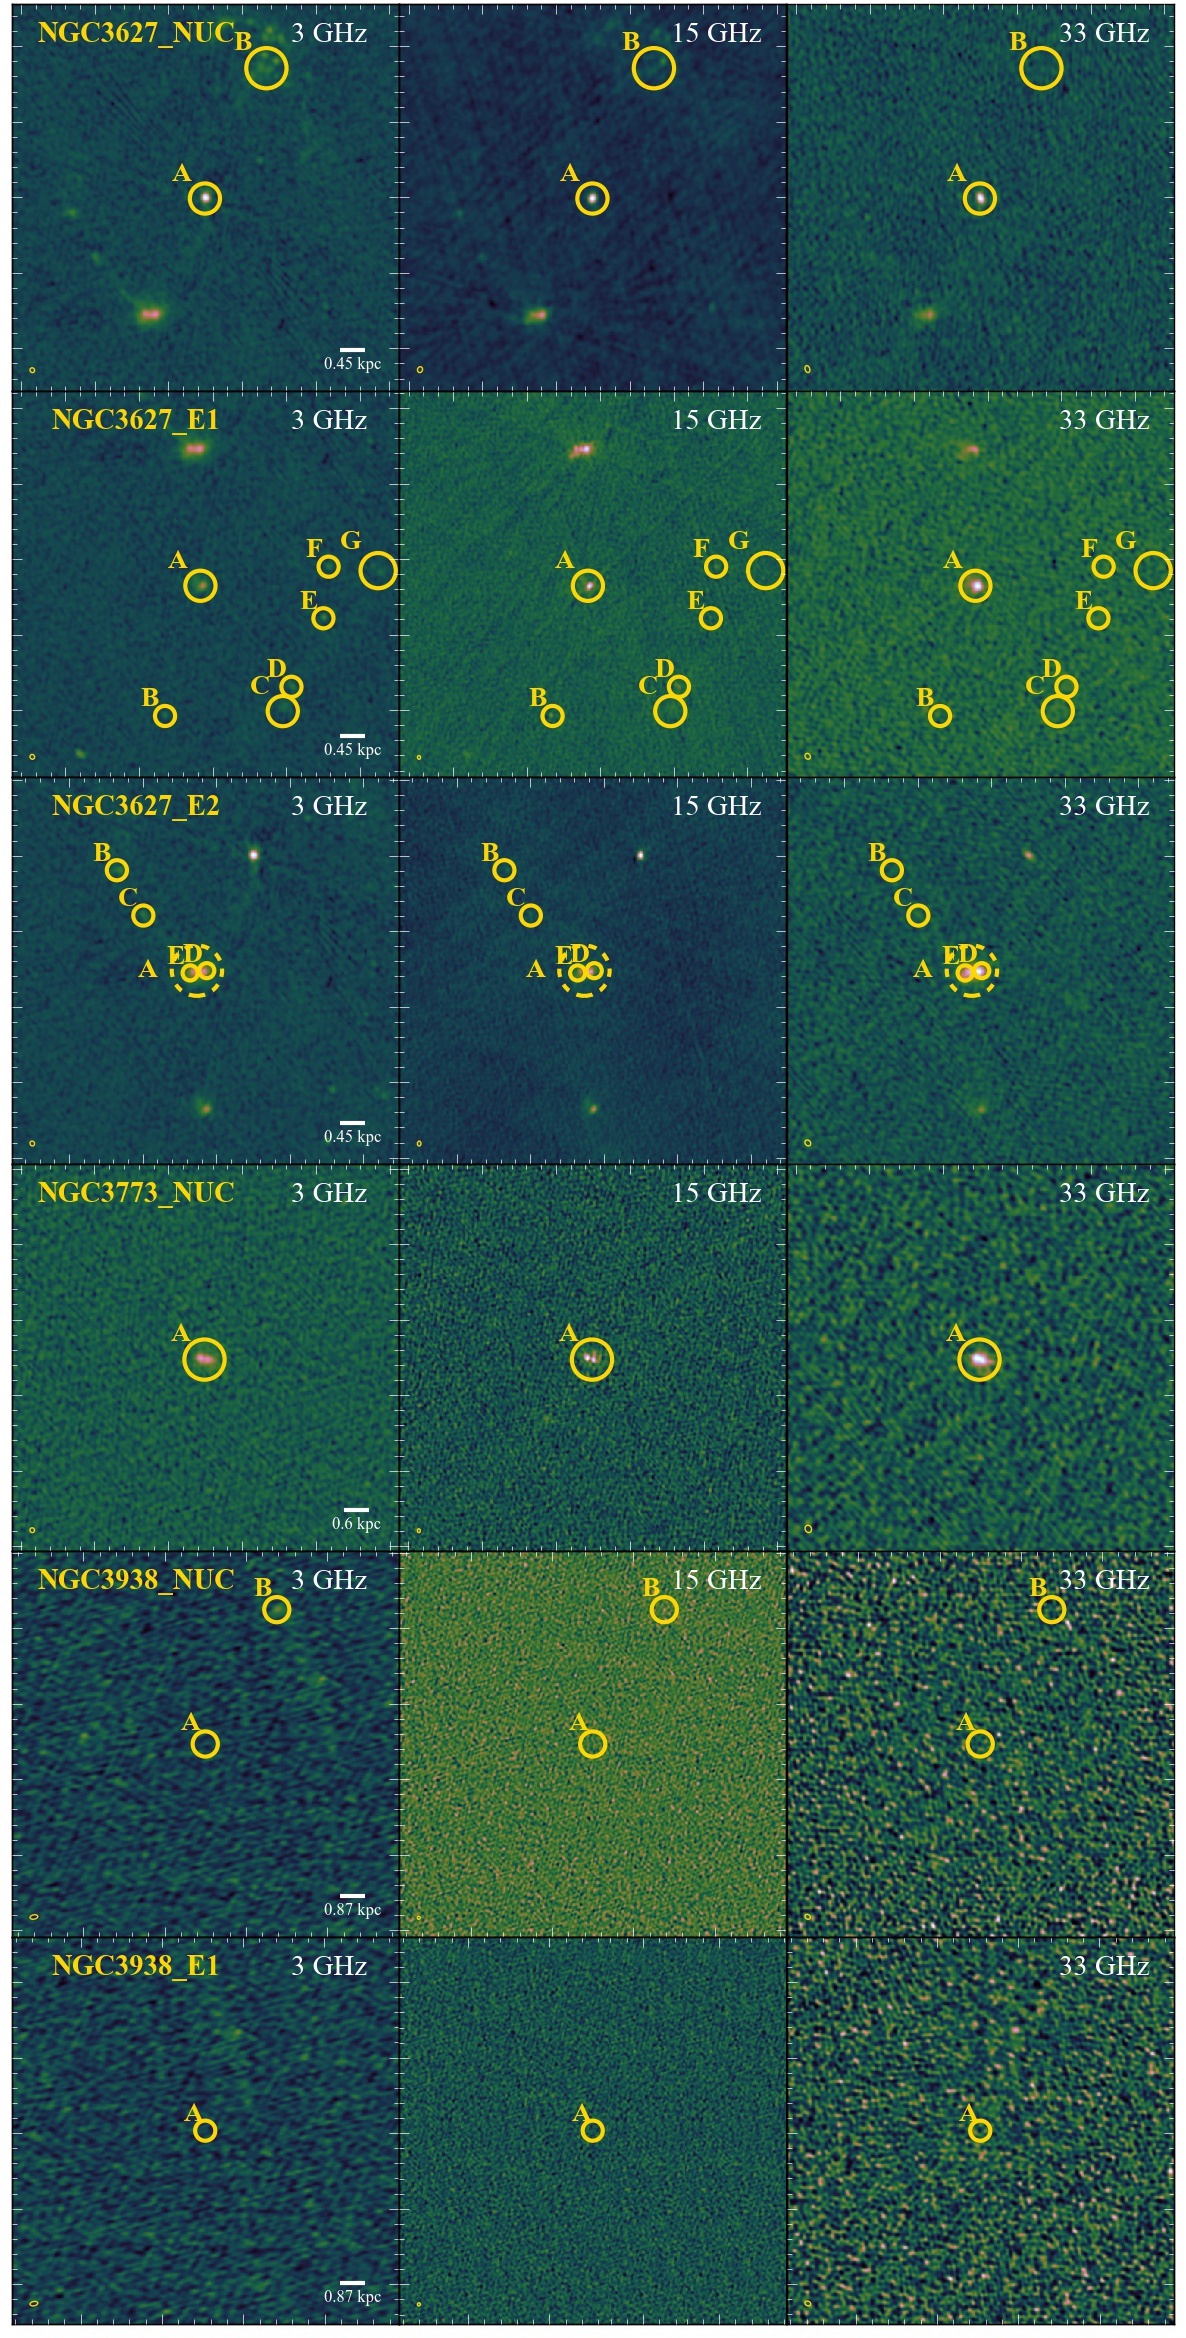
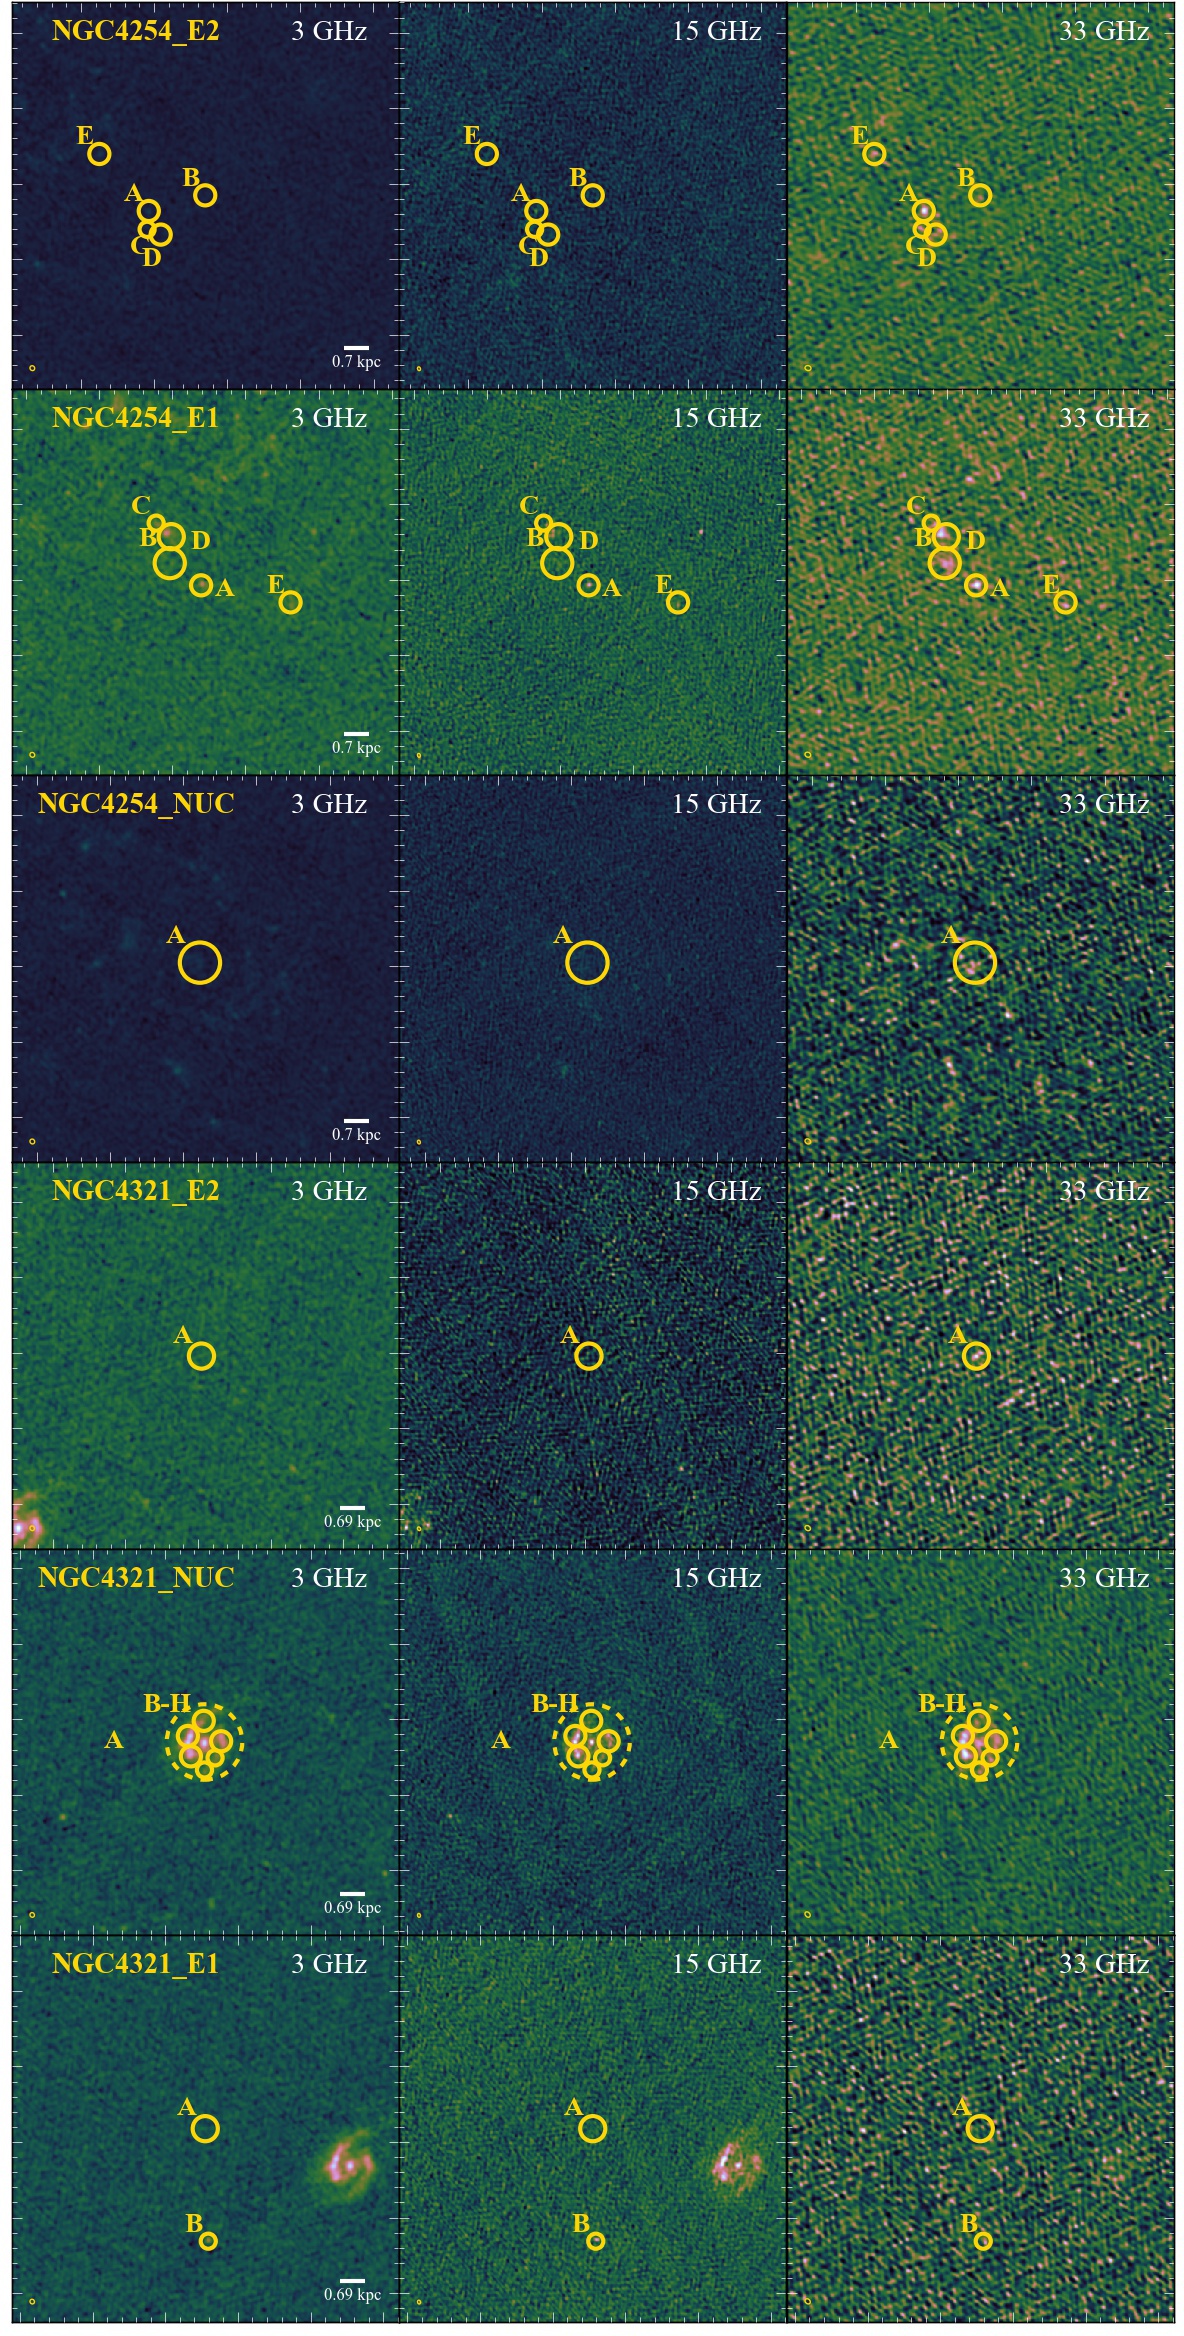
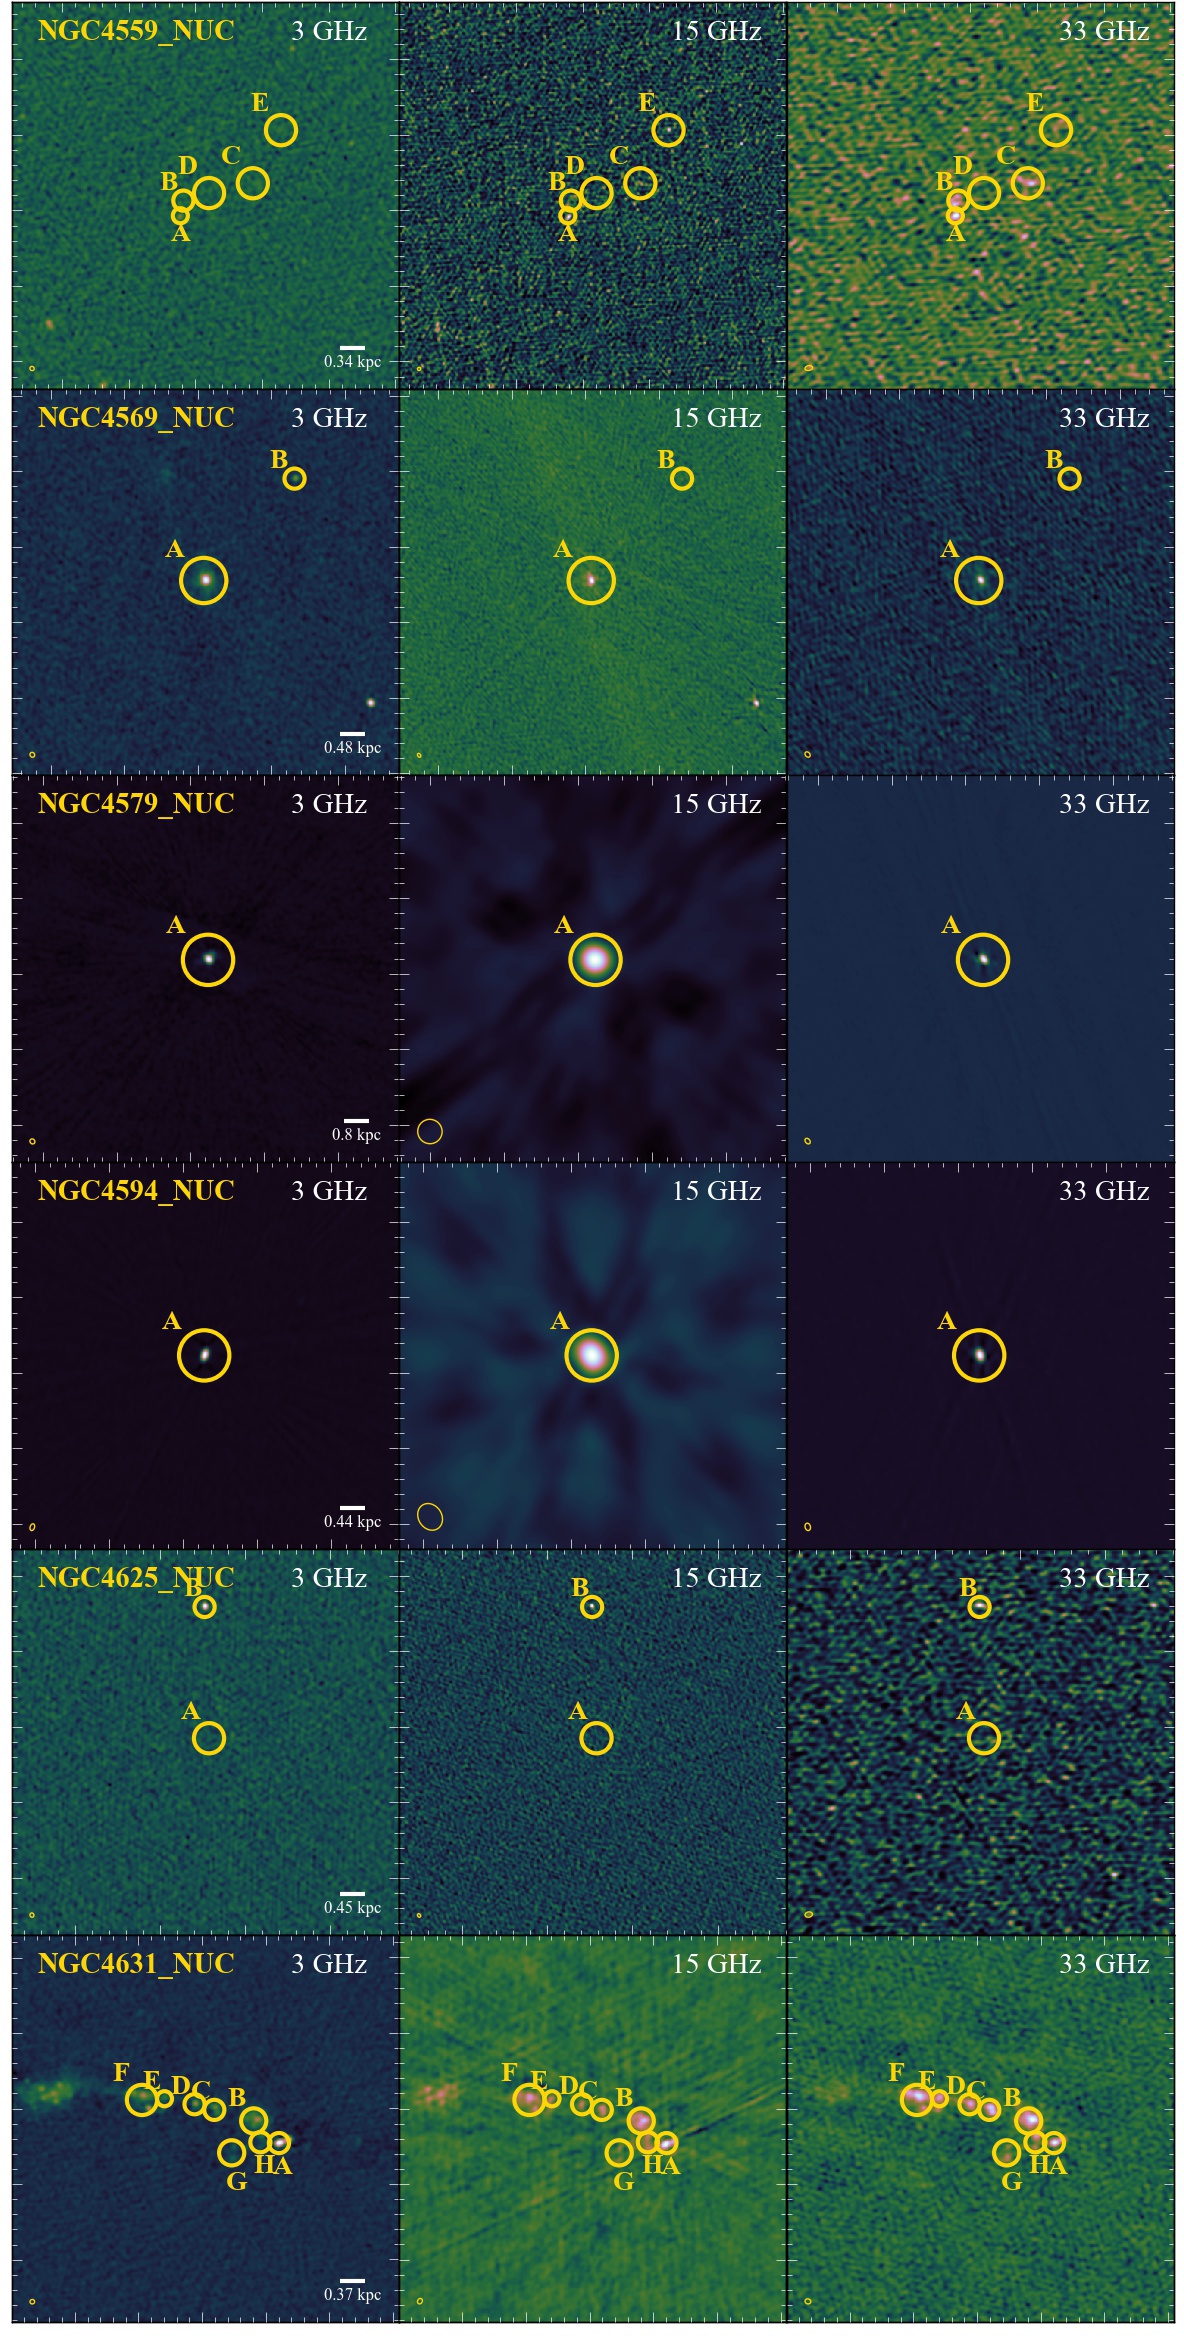
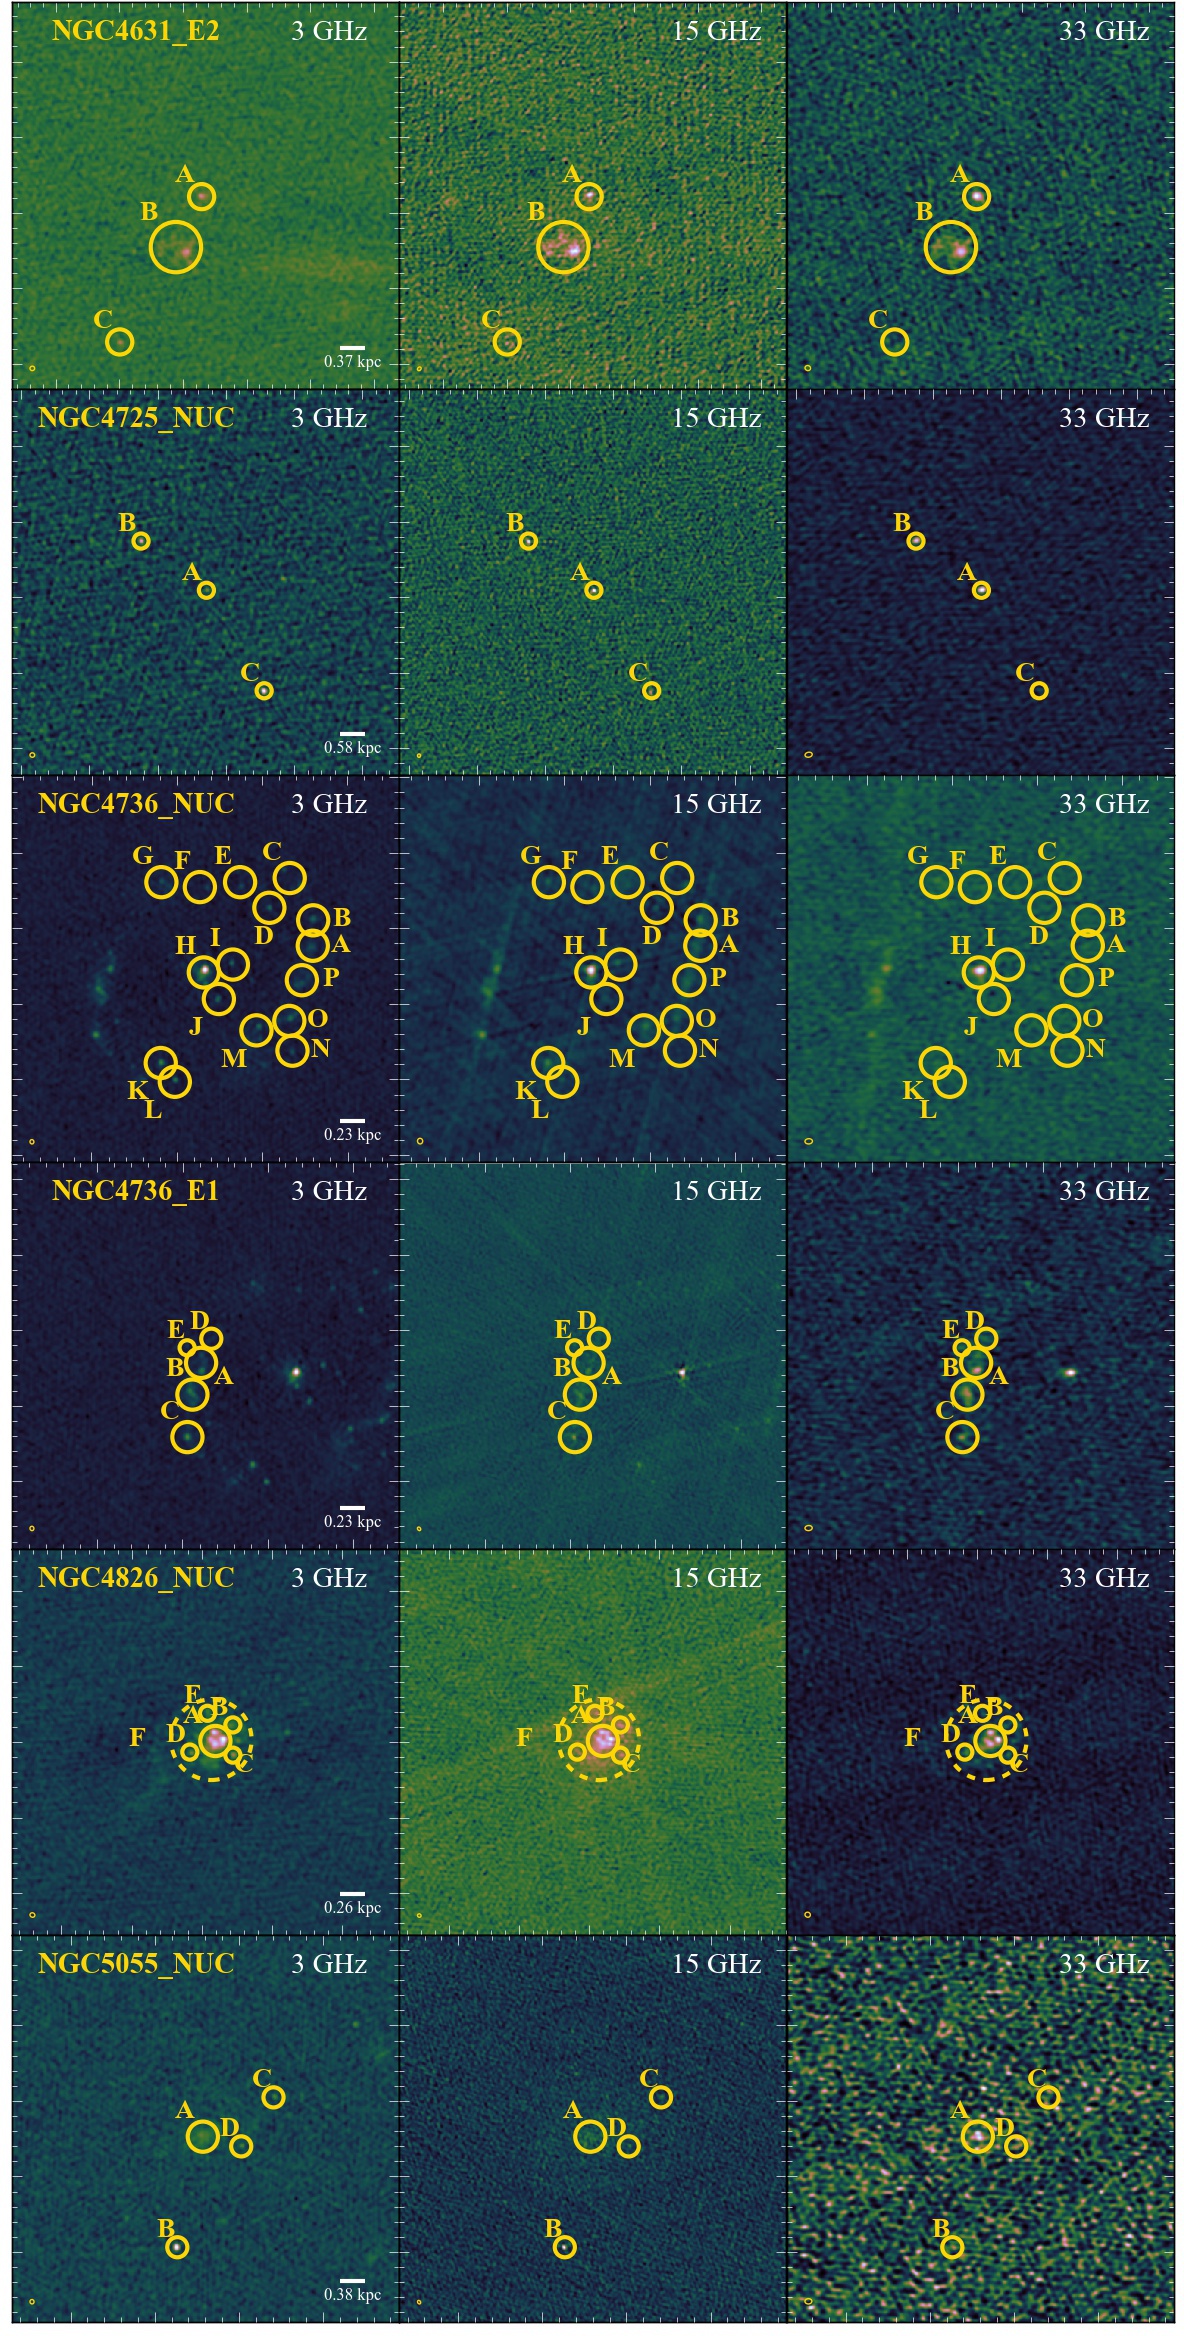
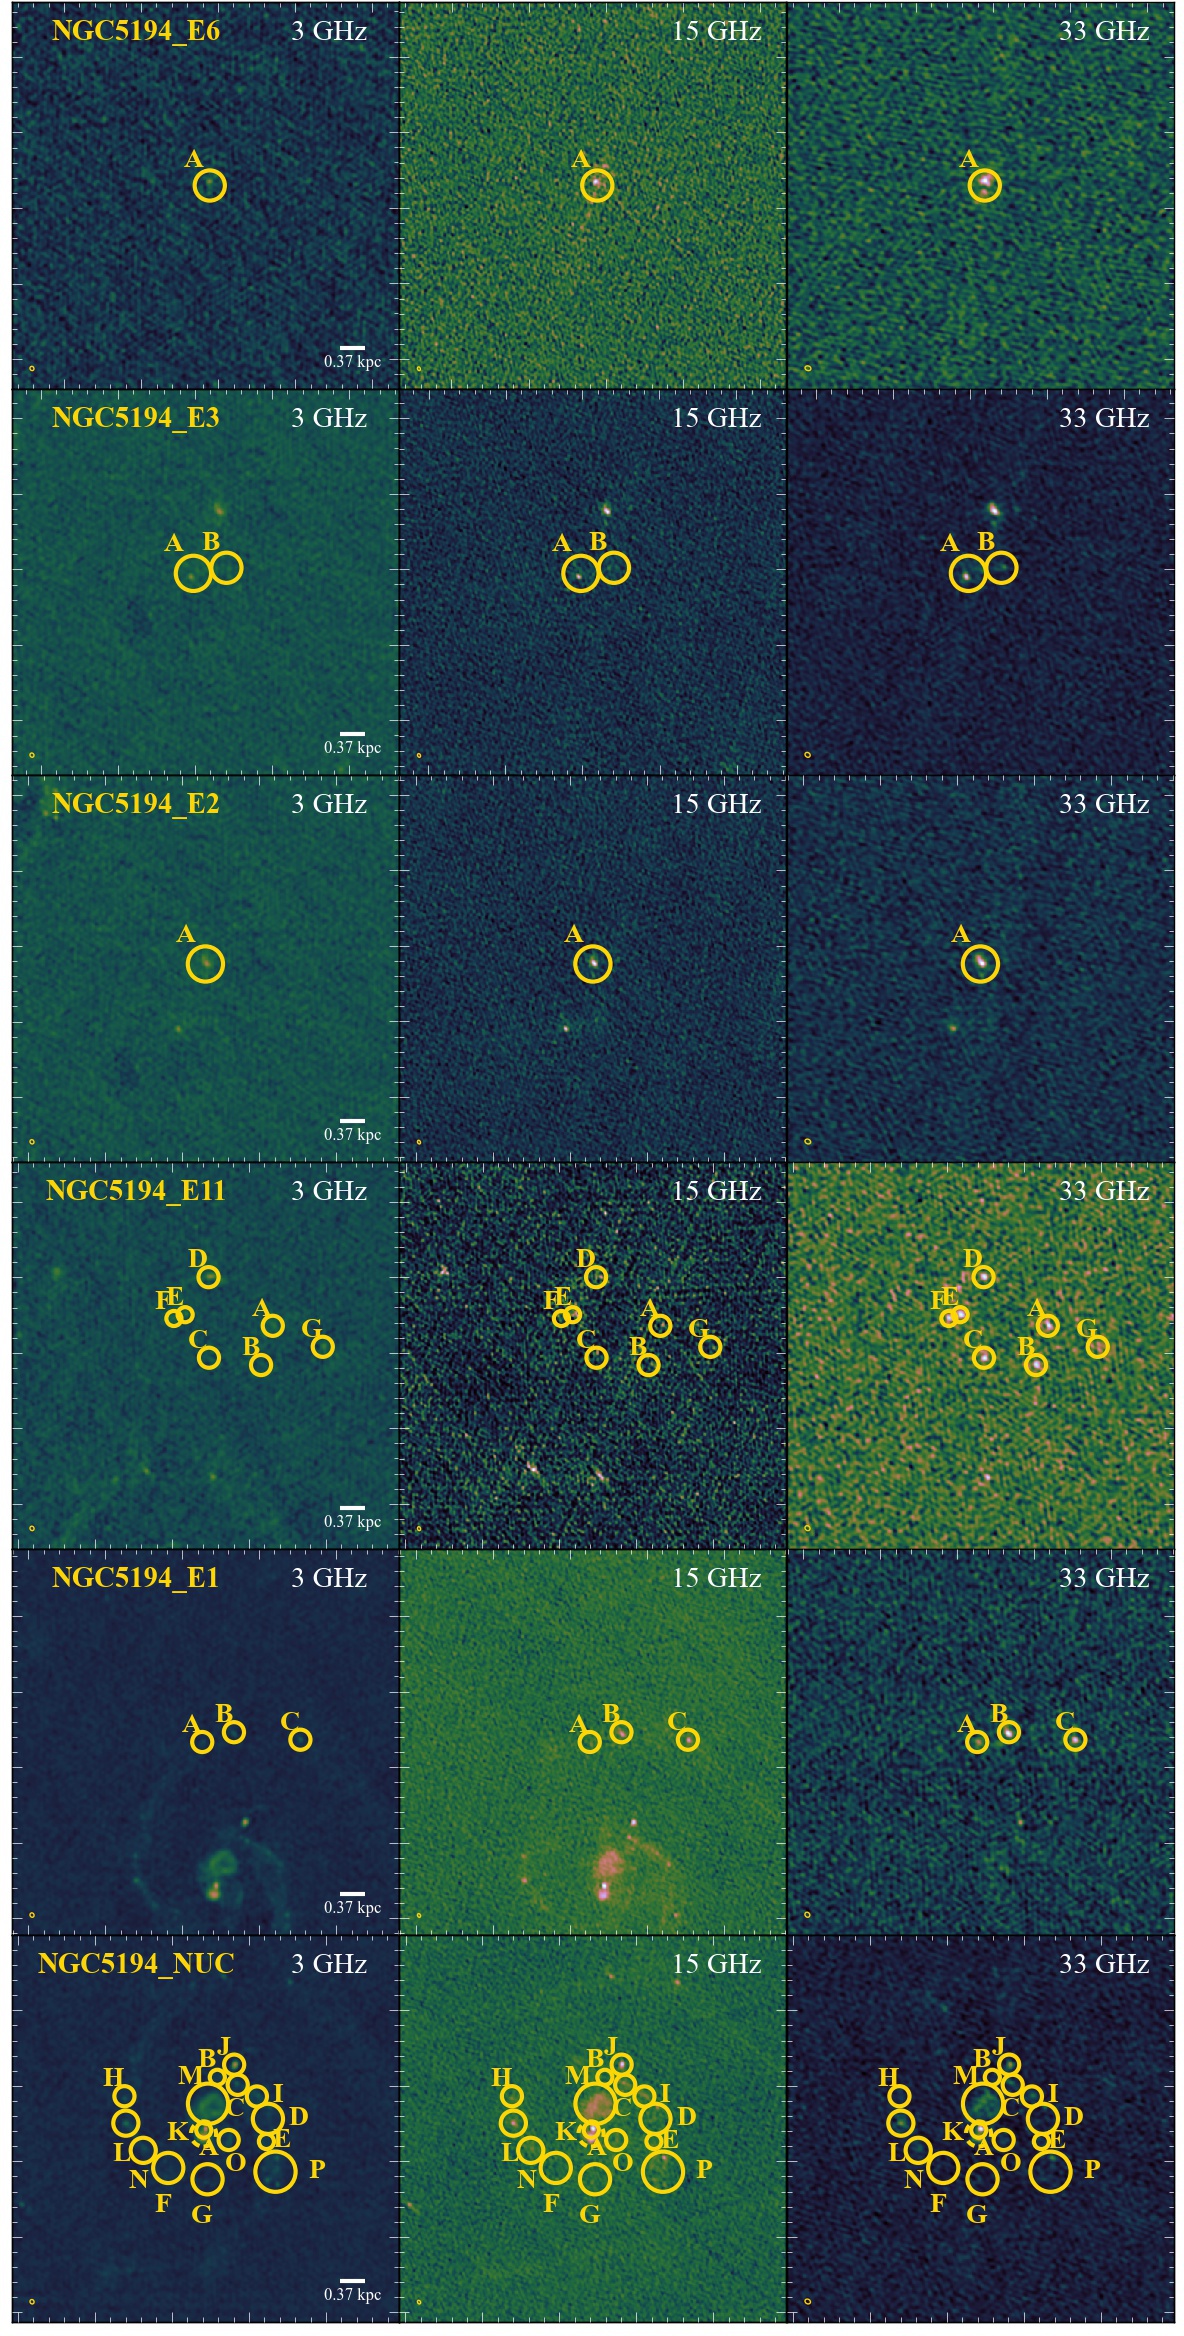
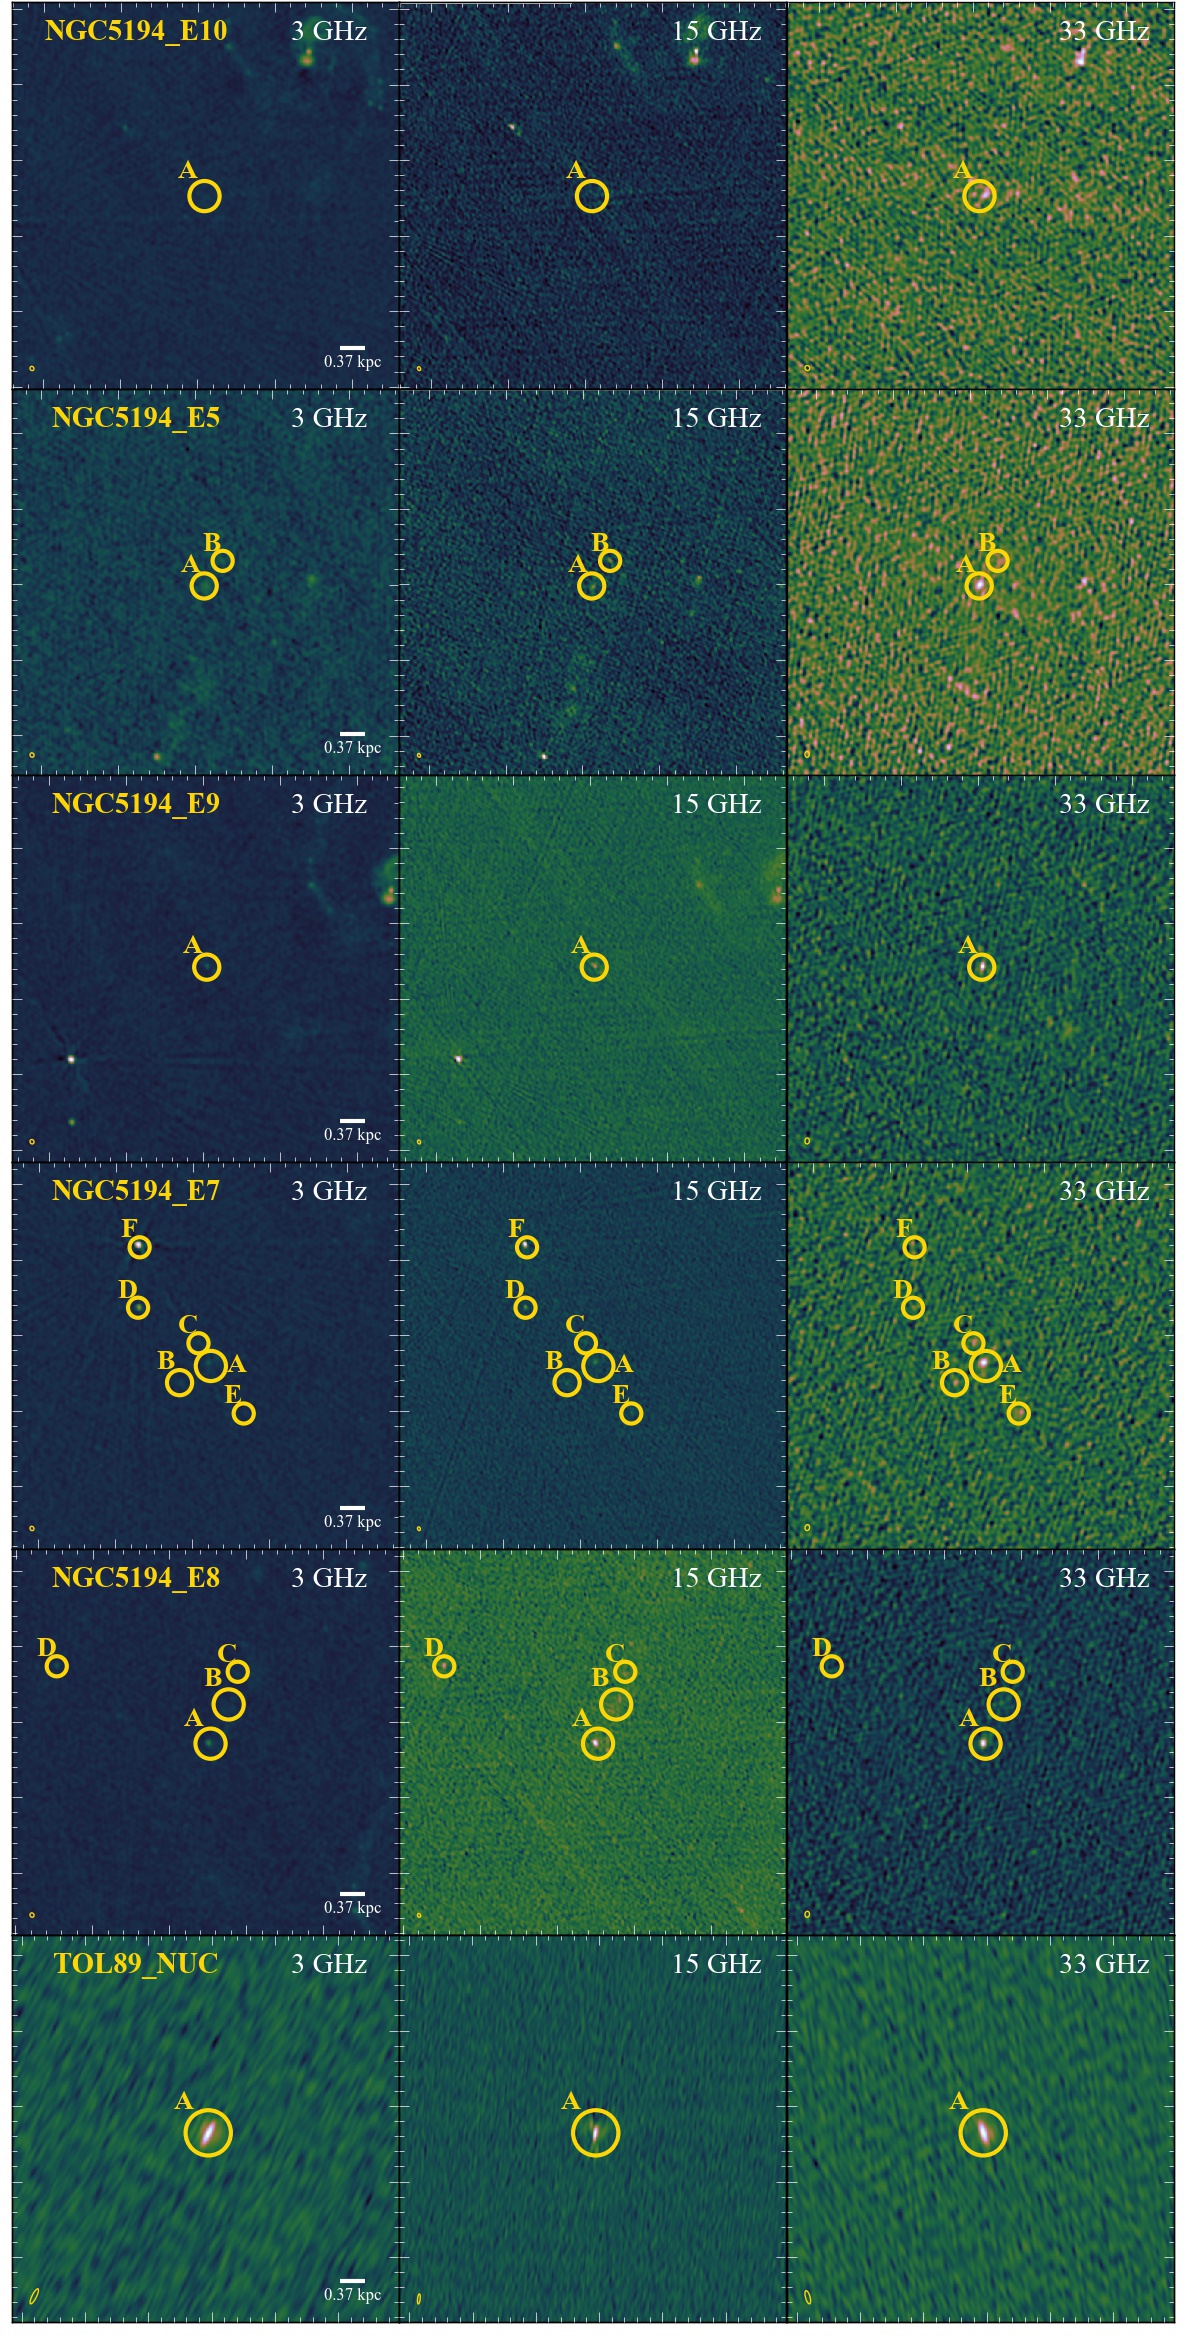
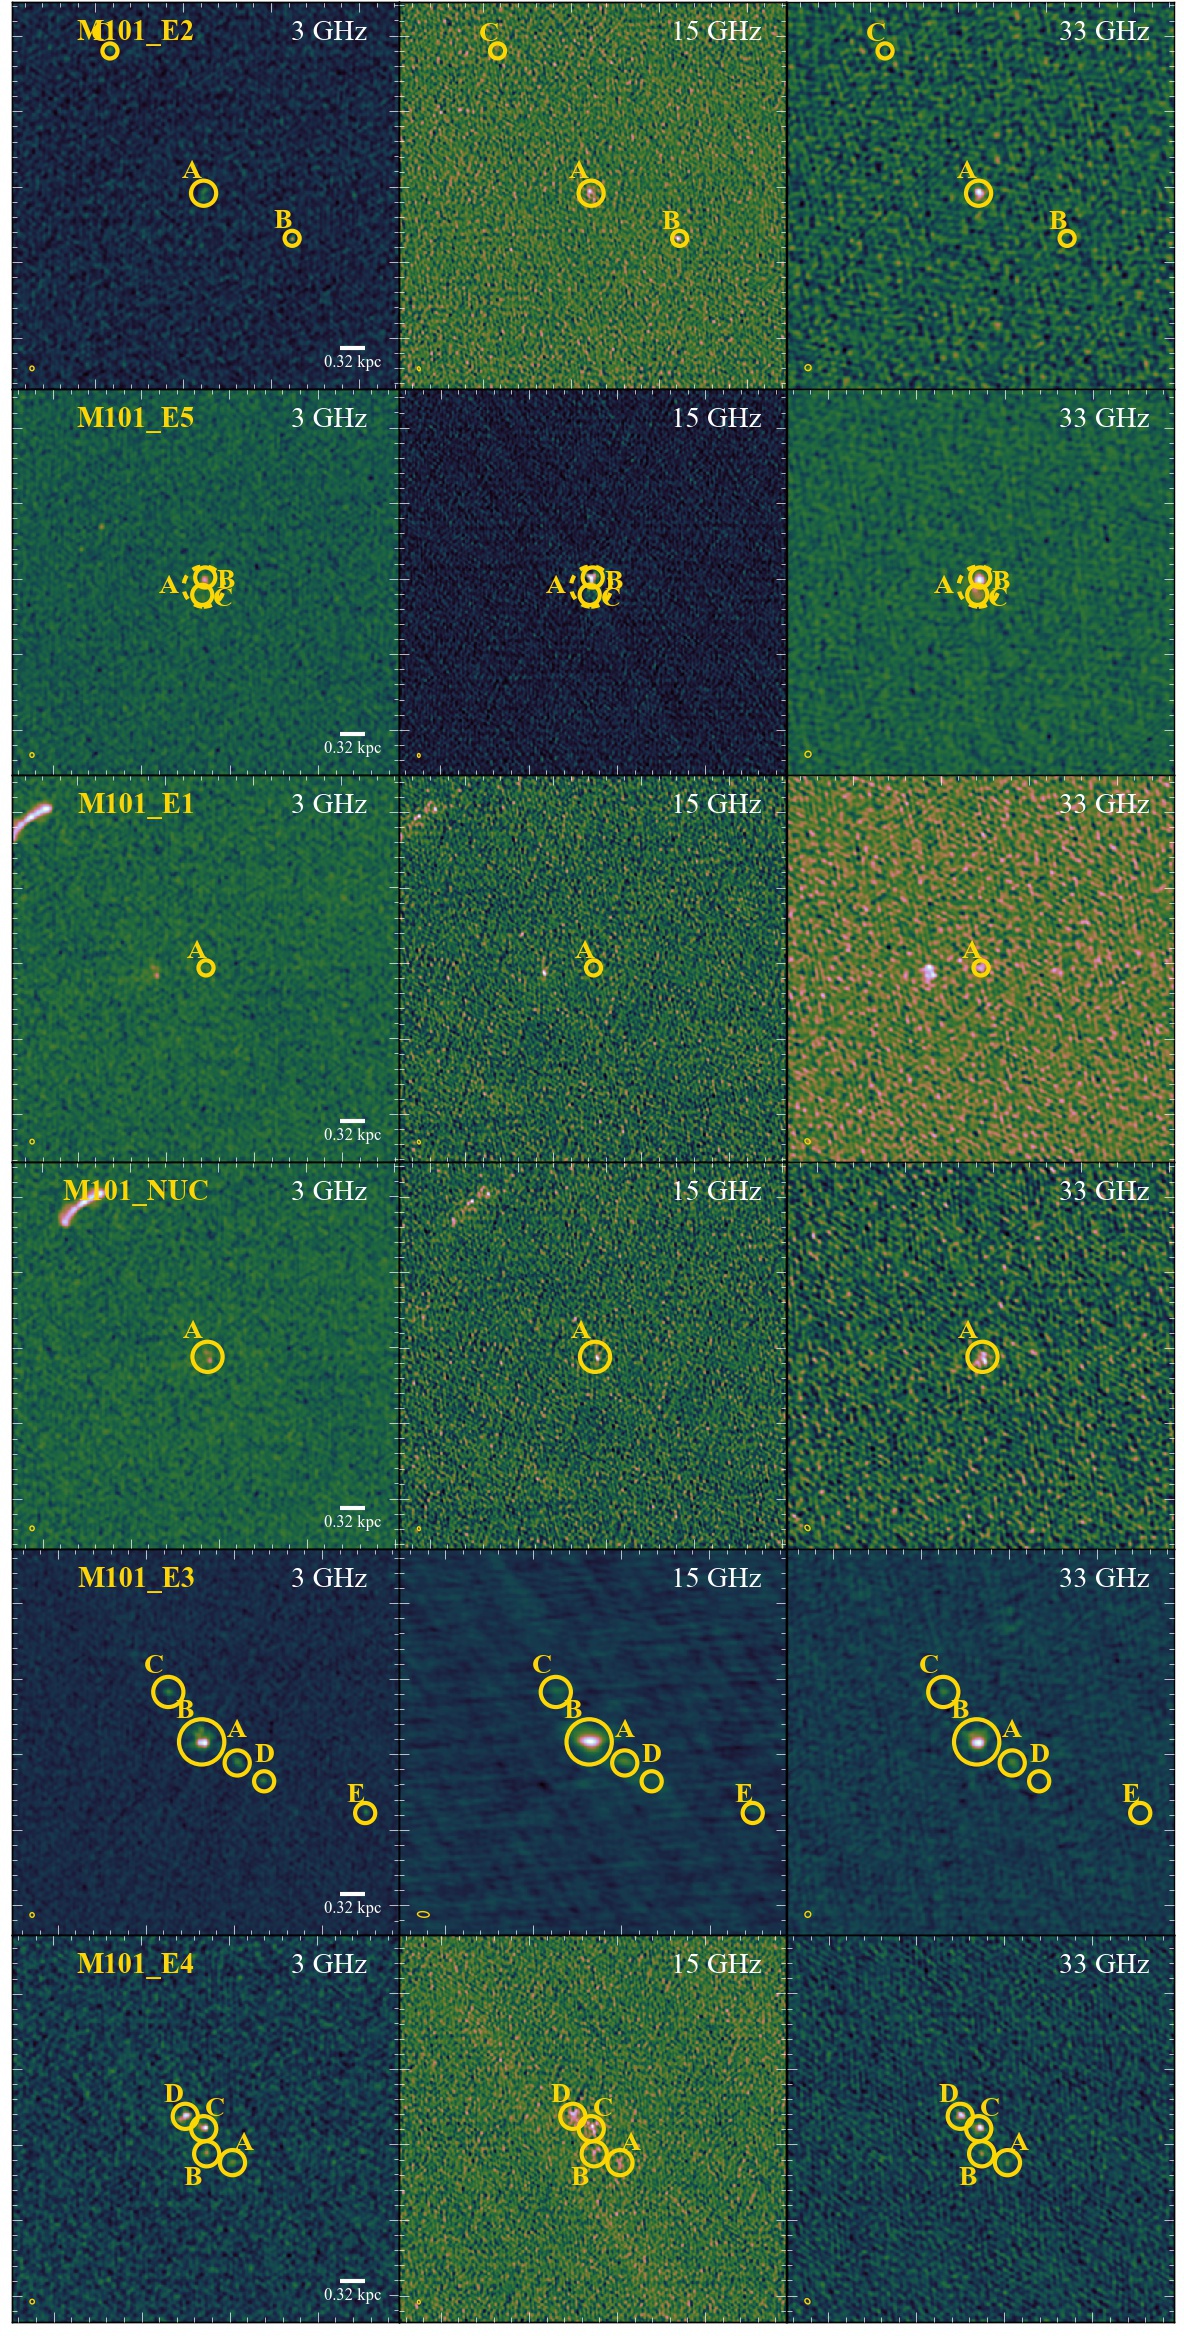
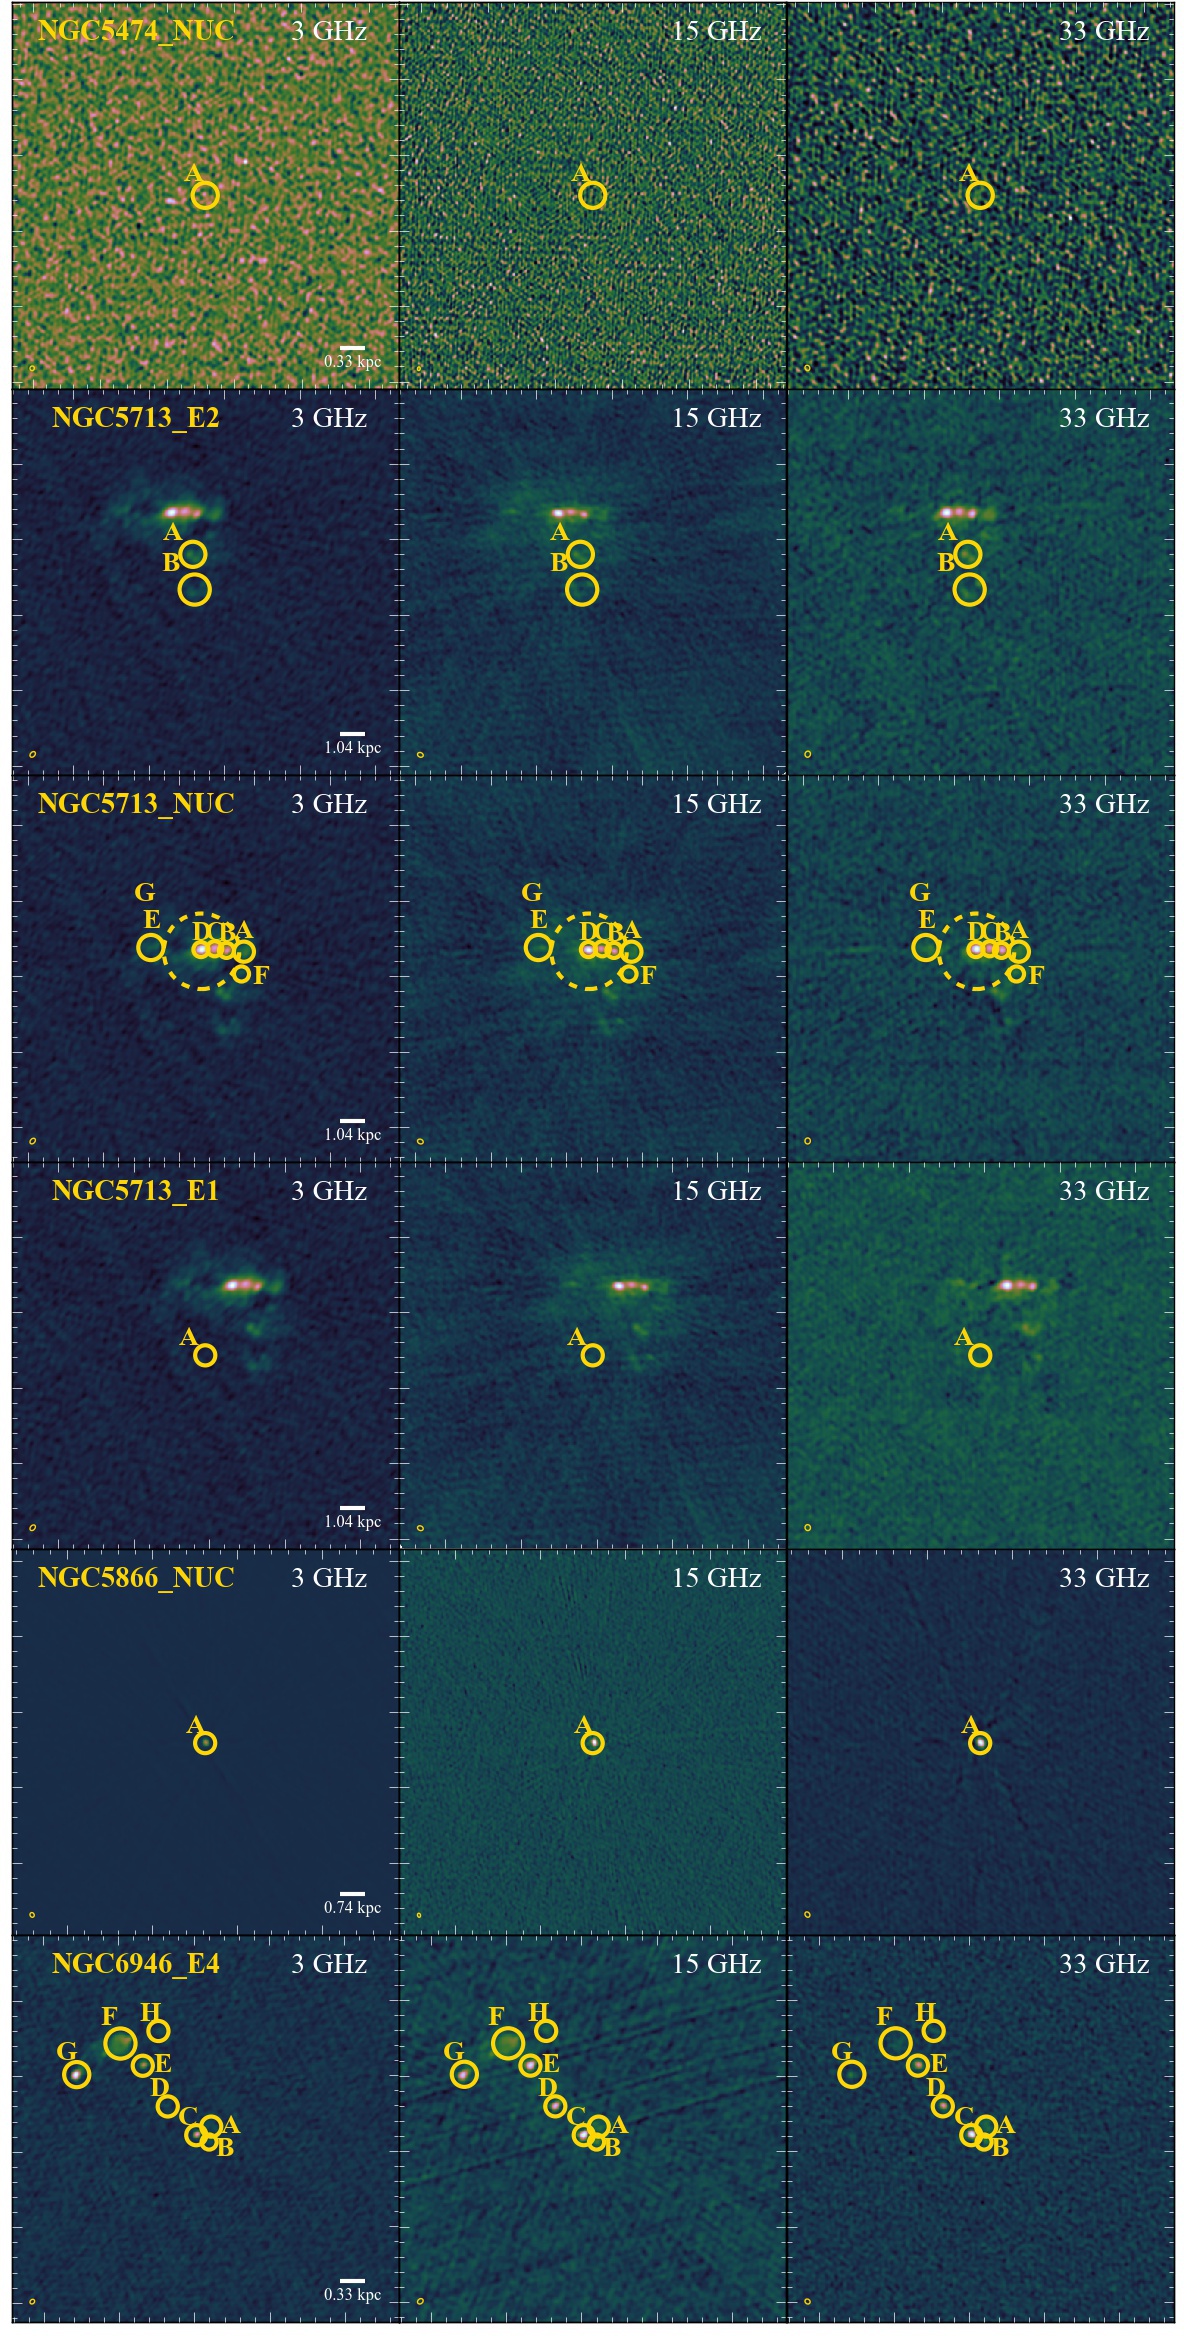
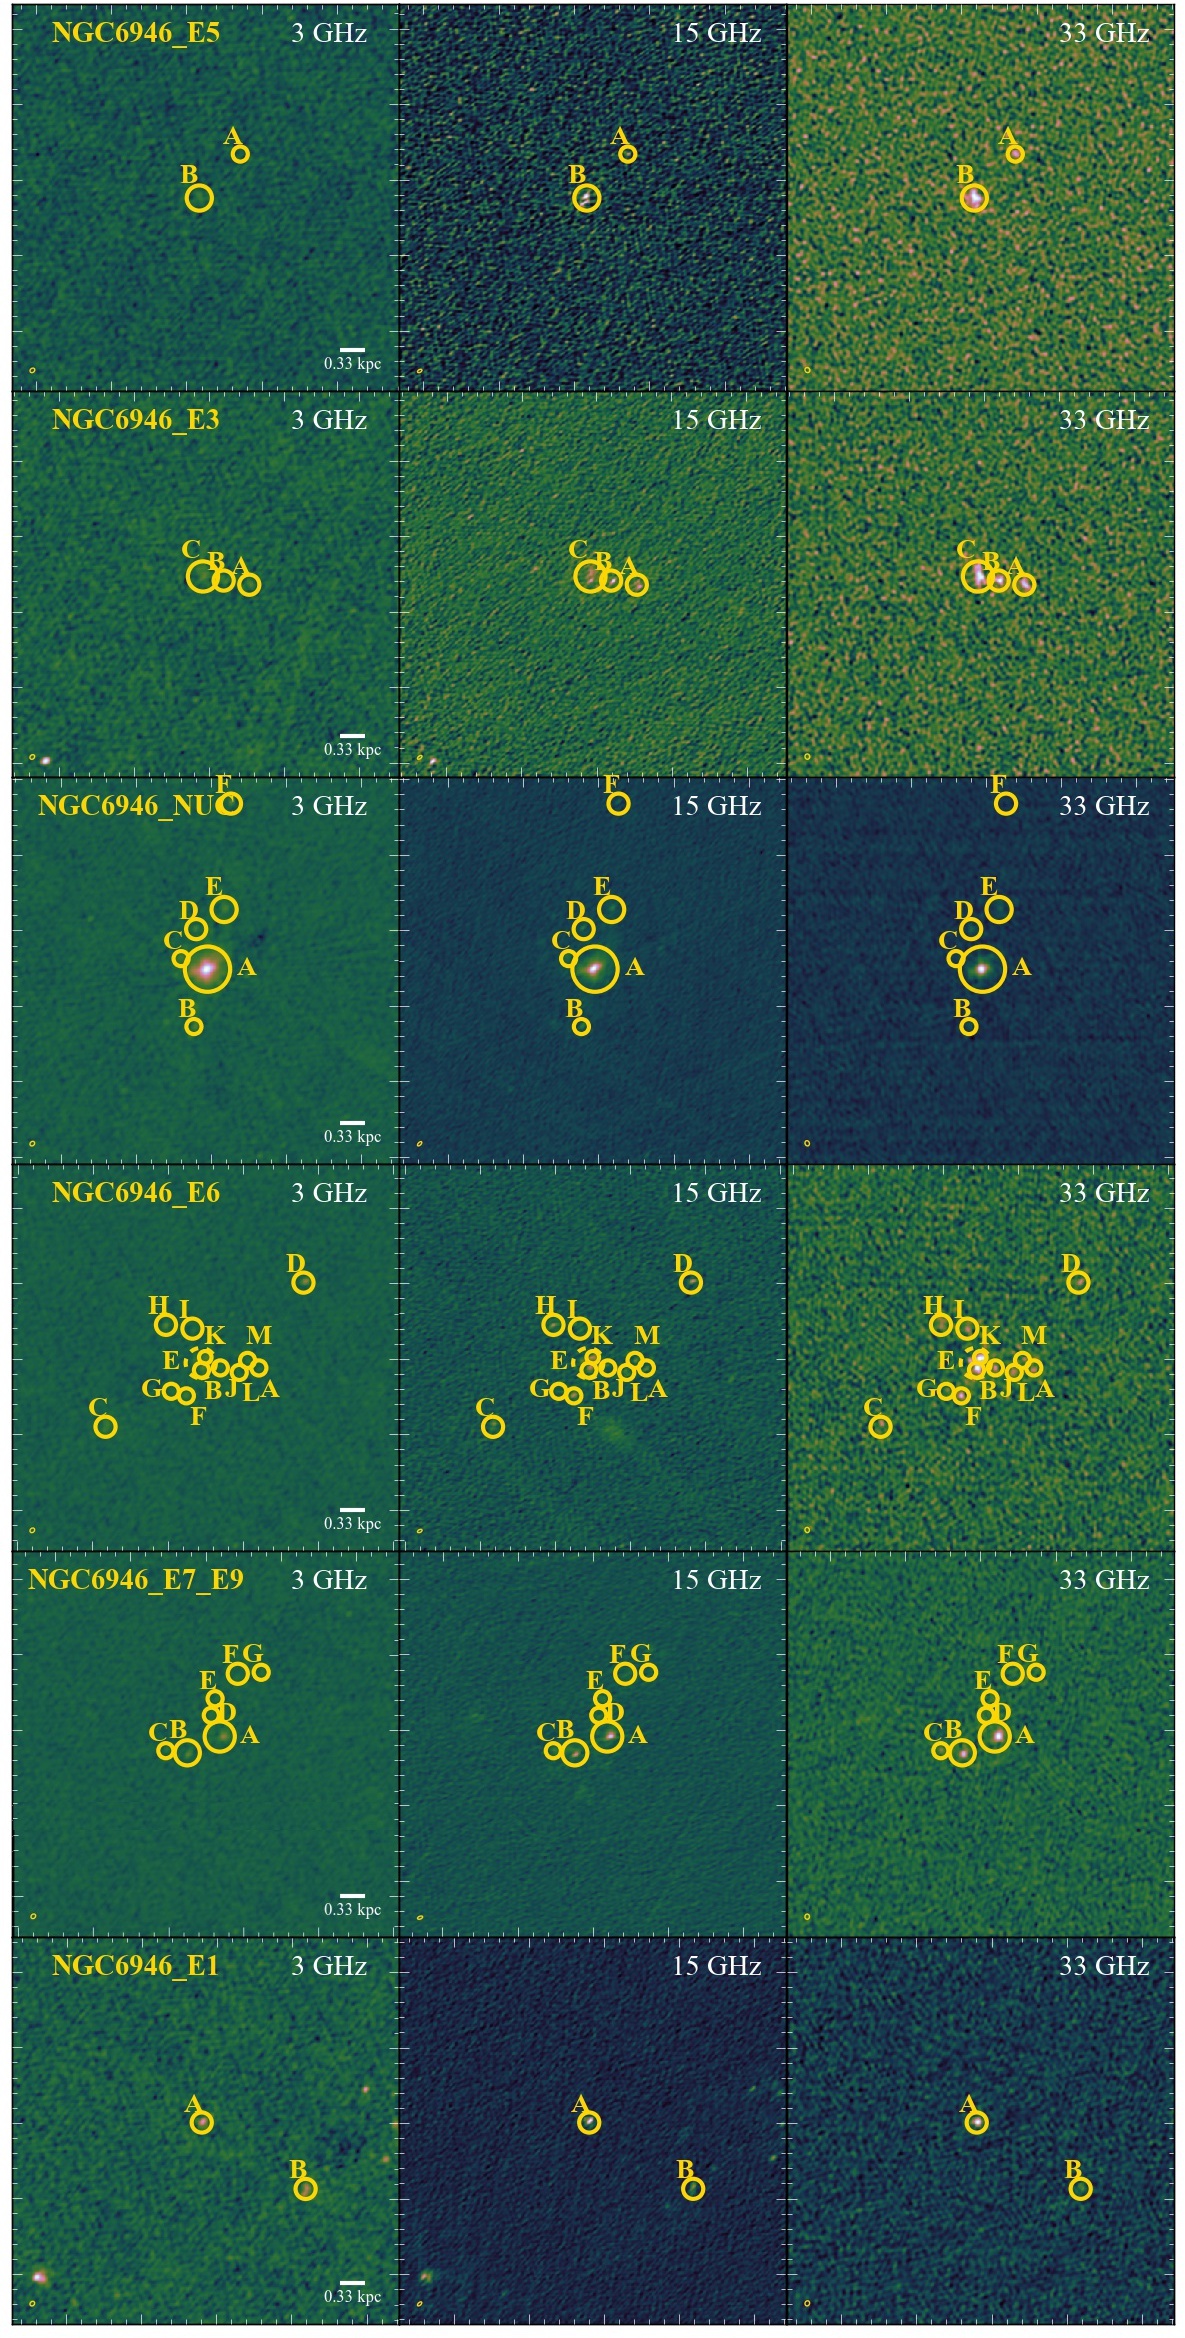
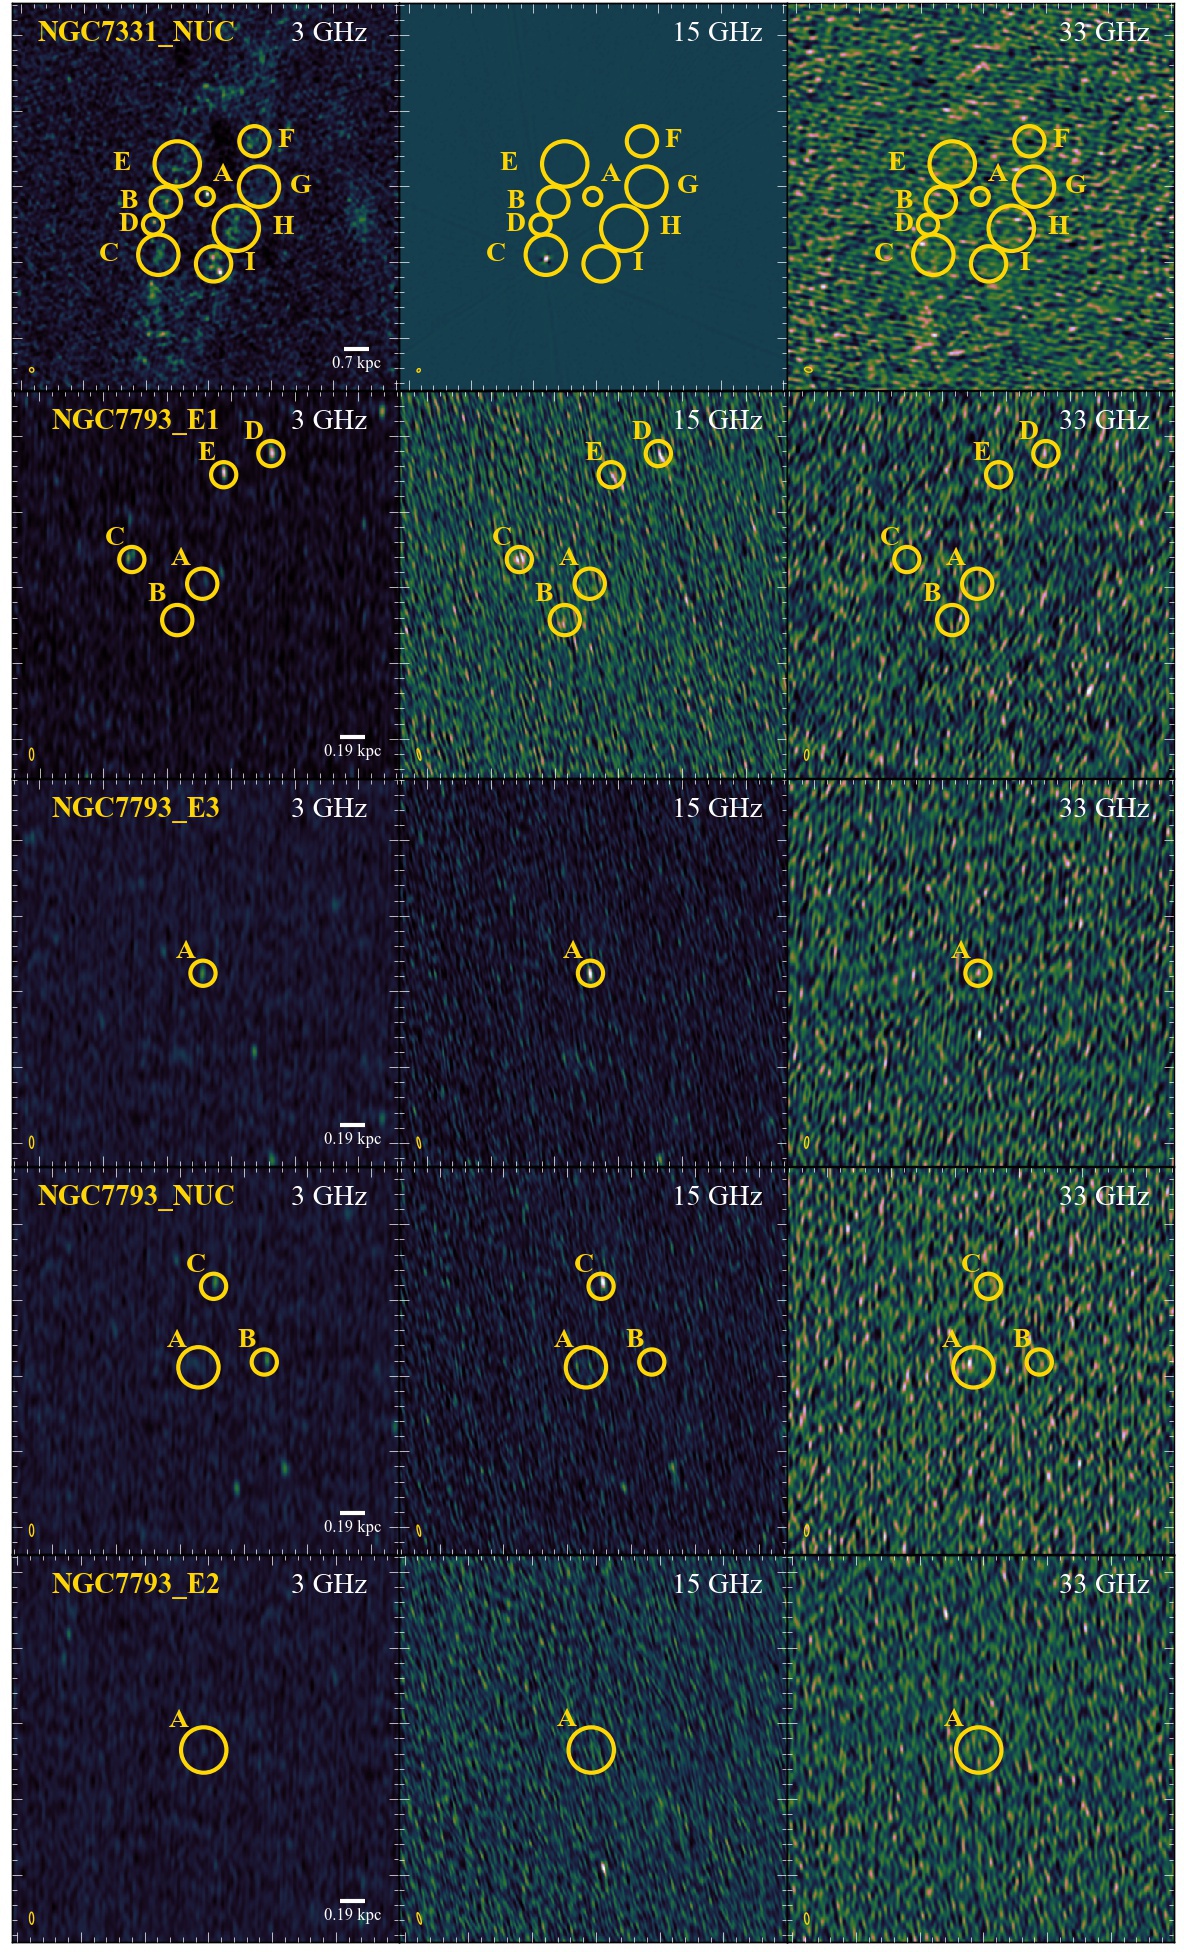
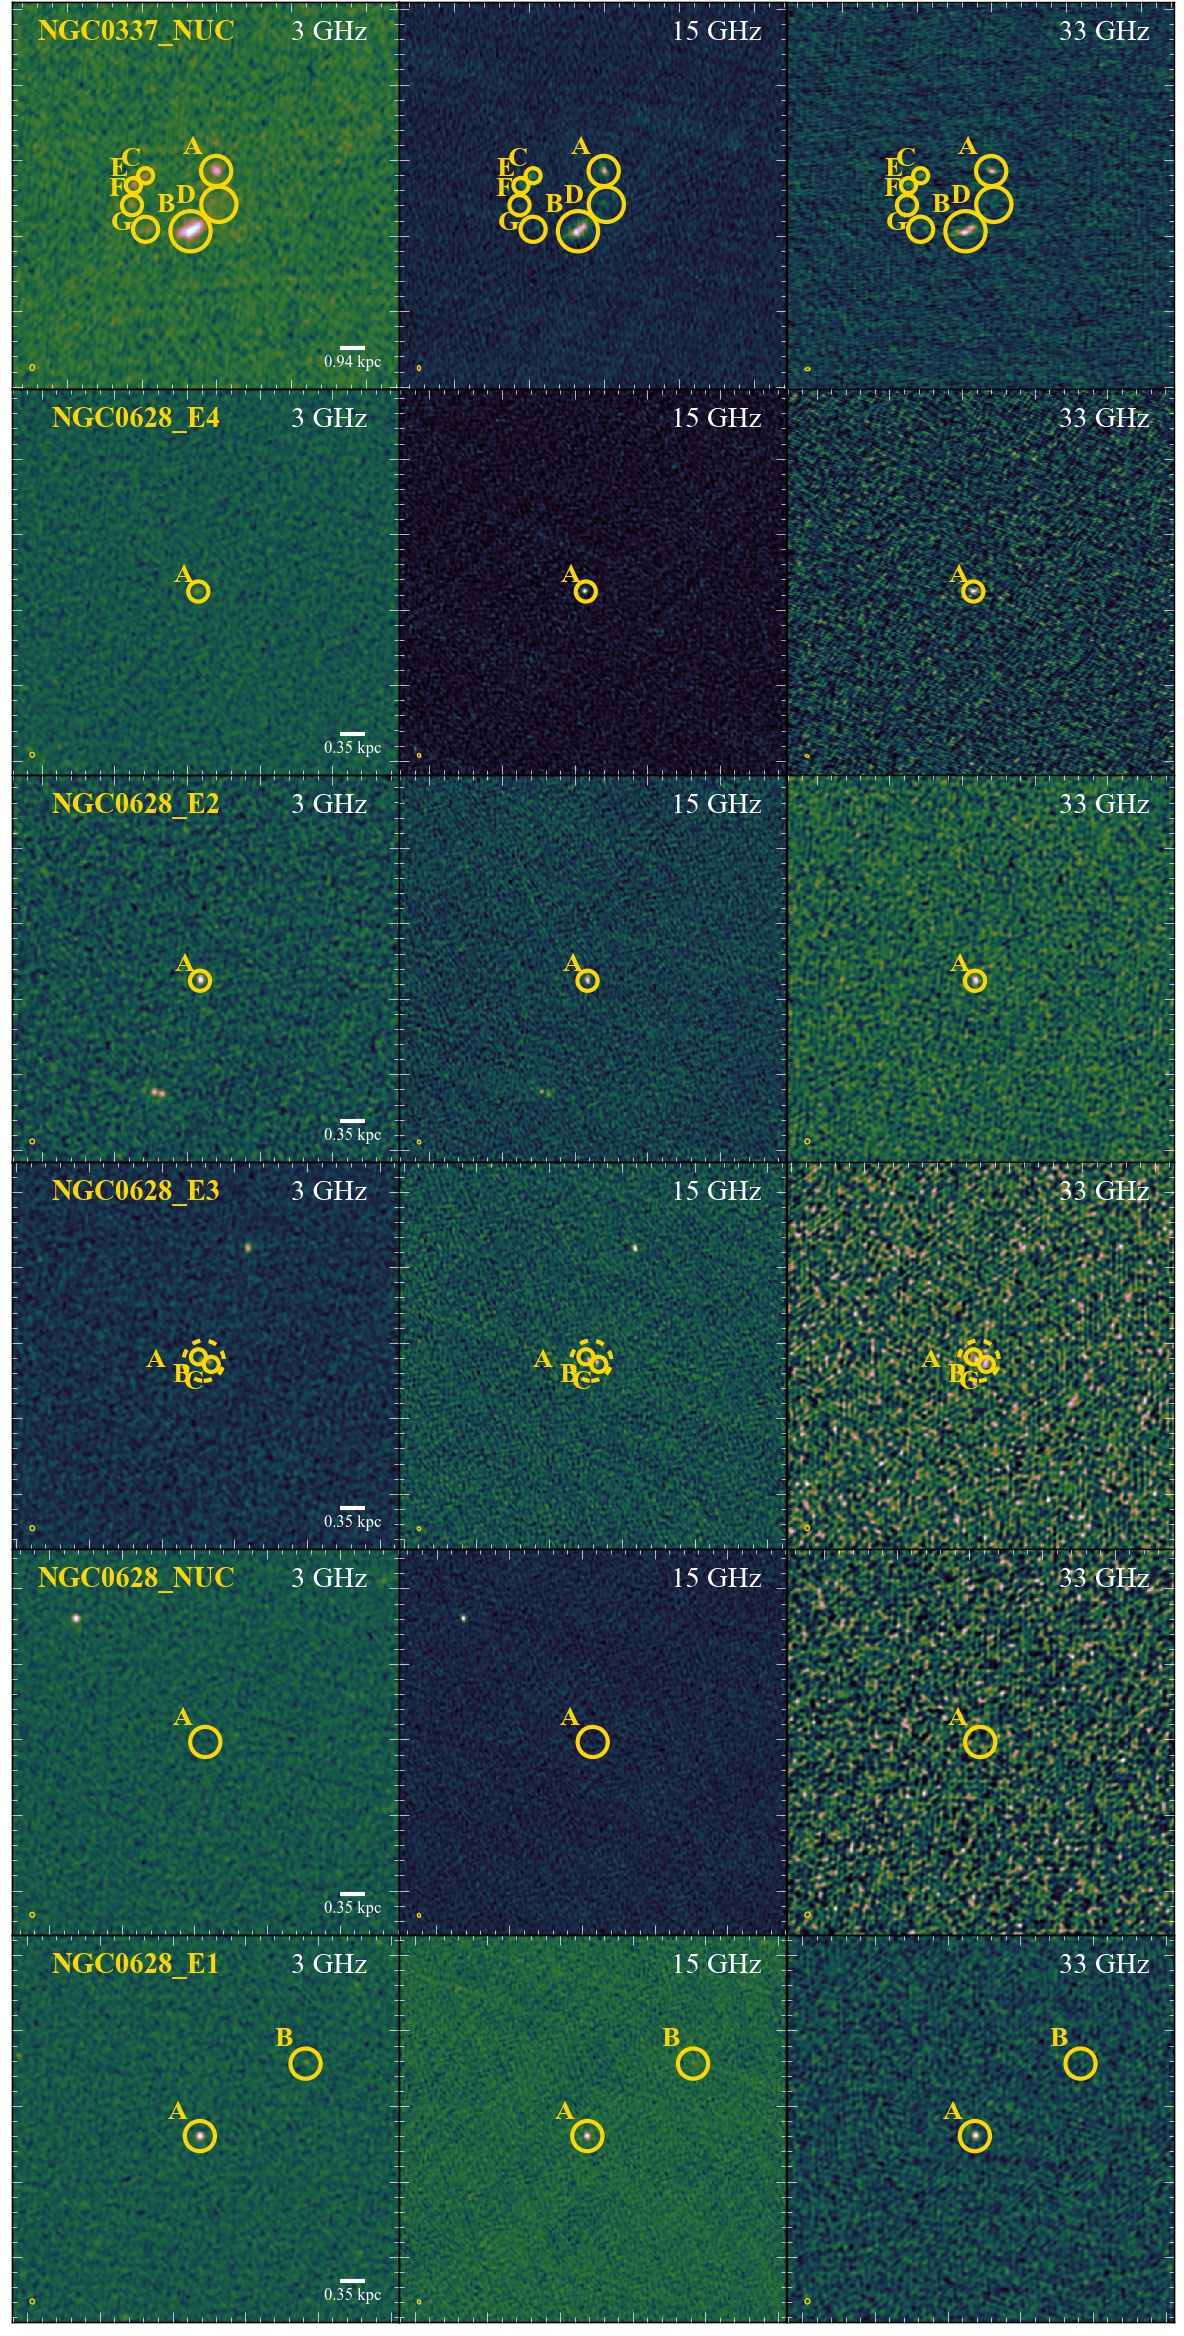
A primary beam correction was applied using the CASA task impbcor before analyzing the images. The primary-beam-corrected continuum images at GHz are shown in Figure 1. The FWHM of the synthesized beam along with the corresponding point-source and brightness temperature sensitivities for each image are given in Tables 2 and 3. Finally, in order to accurately compare the flux density measured for each star-forming region across the full GHz frequency range, we use the CASA task imsmooth to match all VLA images for each pointing to a common circularized, Gaussian, beam corresponding to the lowest angular resolution among all three frequency bands scaled by a factor of (i.e., the pixel scale). This scaling factor eliminates cases for the convolution kernels used by imsmooth to have length zero in any axis in units of pixels. We additionally crop all images to a common field-of-view (FOV) equal to the FOV of our 33 GHz observations (i.e., a primary beam FWHM of 44″).
3 Ancillary Data and Photometry
In this section we provide a description of ancillary data used, as well as our procedure for extracting consistent aperture photometry across the full suite of multi-wavelength data available for galaxies in the SFRS.
3.1 Ancillary Data
GALEX far-UV (FUV; 1528Å) and near-UV (NUV; 2271Å) data were taken from the GALEX Large Galaxy Atlas (Seibert, 2007). The calibration uncertainty for these data is in both bands. One galaxy, NGC 1377, does not have existing near- or far-UV imaging.
The H data used in this analysis is taken from the compilation presented in Leroy et al. (2012), where details about the data quality and preparation (e.g., correction for [NII] emission) can be found, as well as the SINGS archive. All H images were then further corrected for foreground stars. The typical resolution of the seeing-limited H images is , and the calibration uncertainty among these maps is taken to be . Two galaxies, IC 342 and NGC 2146 do not have H imaging from SINGS.
Archival Spitzer 8m and 24m data were largely taken from the SINGS and Local Volume Legacy (LVL) legacy programs, and have a calibration uncertainty of . Details on the associated observation strategies and data reduction steps can be found in Dale et al. (2007, 2009). Two galaxies, IC 342 and NGC 2146, were not a part of SINGS or LVL; their 24 m imaging comes from Engelbracht et al. (2008).
Finally, in order to account for the significant differences between the point-spread functions (PSF) of the various telescopes used in this analysis, we implement the convolution kernels presented in Aniano et al. (2011) to convolve the instrumental PSF for each image, and produce a corrected Gaussian beam of 7″ at each wavelength.
3.2 Region Identification and Aperture Photometry
To identify and characterize potential star-forming regions in the SFRS, we start by searching within an area that is equal to twice the FWHM of the VLA primary beam at 33 GHz (”). Any region visually identified in least one radio band is retained for further investigation. The location of all radio-identified sources were compared with the 8m maps of each galaxy to determine if the source has a corresponding detection in the mid-IR, and is thus likely associated with a star-forming region. Sources characterized as potential background galaxies have no obvious 8 m counterpart, and very rarely a 33 GHz counterpart. In total, we visually identified 389 regions for which we perform aperture photometry to determine those that are statistically significant detections. Of the 389 sources visually identified, 377 had a statistically significant detection (i.e., ) in at least one band, which is given in Table 4. For completeness, the remaining 12 sources are still labeled in the panels of Figure 1 to demonstrate the full identification process we utilized.
Using the CASA task imstat, we measured and report the GHz flux densities for each region. The size of the apertures were hand-selected to fully encompass the visible extent of the GHz radio flux density of each region, with an additional constraint of having a diameter equal to or larger than the FWHM of the synthesized beam for that pointing. We do not apply aperture corrections to our photometry given that we both convolve all images for a given pointing to common beam and use the same sized aperture at all wavelengths. Photometric uncertainties were conservatively estimated by taking the empirically measured noise from empty regions in each non primary beam corrected image, applying the empirical primary beam correction based on Equation 4 in EVLA Memo 195, and scaling by the ratio of the synthesized beam area to the adopted aperture area. This noise is then added in quadrature with the VLA calibration uncertainty (3%; Perley & Butler, 2013). The median size of the apertures used for all 377 sources is pc with a median absolute deviation of 97 pc. The aperture sizes used for each identified region is given in Table 4.
We additionally carried out photometry on the full VLA, GALEX, H, and Spitzer/MIPS 24 m datasets after matching their resolution (7″ FWHM), cropping each image to a common field of view, and re-gridding to a common pixel scale (). In total, we identify 180 discrete sources, and critical apertures of 7″ were used in all cases. Unlike our native-resolution photometry, we report sources with upper-limits in all radio bands if a statistically significant detection exists in our ancillary GALEX and Spitzer imaging. The median size of the apertures used at 7″ resolution is pc with a median absolute deviation of 73 pc. The UV and H photometry of each region was corrected for Milky Way extinction using Schlegel et al. (1998) assuming and the modeled extinction curves of Weingartner & Draine (2001) and Draine (2003). The results from our radio photometry are given in Table 5. The GALEX, H, and Spitzer/MIPS 24 m photometry results, which are presented in Table 6, are not used directly in the present analysis, but will be utilized for further studies.
Finally, in order to account for and remove any diffuse emission component that is most likely unassociated with the most recent star formation activity in the disks of these galaxies, we measure a local background value within the vicinity of each star-forming region. The local background was measured by placing an annulus a distance of 1.5 times the synthesized beam FWHM away from the center of the source position in both the full-resolution and smoothed maps. The median surface brightness within this annulus was then multiplied by the effective area of the beam to get an estimate of the local diffuse background emission. These values are given in Table 7. Further, we measure the fractional contribution of the background emission for each region, and find that the median value is , , and , with median absolute deviations of , , and for our 3, 15, and 33 GHz observations respectively. Importantly, these values are smaller than the found for the regions studied at (kpc) scales with the GBT (Murphy et al., 2011).
The regions, listed in Tables 4 and 5, are named according to the nearest 33 GHz image, with an alphabetical suffix if there are multiple regions corresponding to one image. For example, “NGC 2403 Enuc. 2 B” is the second of three regions within the VLA pointing of extranuclear region 2 in NGC 2403. We distinguish individual sources identified in the 7″ smoothed maps by instead using a lowercase letter. For example, “NGC 2403 Enuc. 2 b” is one of two regions in the image of extranuclear region 2 in NGC 2403, and is composed of the sum contribution of “NGC 2403 Enuc. 2 B” and “NGC 2403 Enuc. 2 C” in the full-resolution maps.
| Source ID | R.A. | Decl. | |||||||
|---|---|---|---|---|---|---|---|---|---|
| (J2000) | (J2000) | (mJy) | (mJy) | (mJy) | (pc) | (kpc) | |||
| Star-Forming Regions | |||||||||
| NGC 0337 D | 00 59 49.94 | -07 34 47.60 | 655. | 0.921 | |||||
| NGC 0337 A | 00 59 50.01 | -07 34 34.33 | 561. | 0.881 | |||||
| NGC 0337 B | 00 59 50.69 | -07 34 58.26 | 749. | 2.041 | |||||
| NGC 0337 C | 00 59 51.89 | -07 34 36.20 | 281. | 3.735 | |||||
| NGC 0337 G | 00 59 51.89 | -07 34 57.50 | 468. | 3.123 | |||||
| NGC 0337 E | 00 59 52.22 | -07 34 40.10 | 281. | 4.048 | |||||
| NGC 0337 F | 00 59 52.26 | -07 34 47.90 | 374. | 3.753 | |||||
| NGC 0628 Enuc. 4 | 01 36 35.69 | +15 50 07.22 | 140. | 7.614 | |||||
| NGC 0628 Enuc. 2 | 01 36 37.64 | +15 45 07.19 | 140. | 4.468 | |||||
| NGC 0628 Enuc. 3 C | 01 36 38.63 | +15 44 21.40 | 105. | 5.798 | |||||
| NGC 0628 Enuc. 3 A† | 01 36 38.84 | +15 44 22.90 | 279. | 5.724 | |||||
| NGC 0628 Enuc. 3 B | 01 36 38.99 | +15 44 24.40 | 105. | 5.657 | |||||
| NGC 0628 Enuc. 1 B | 1 36 42.340 | +15 48 16.84 | 0.13 | 0.66 | 209. | 2.695 | |||
| NGC 0628 Enuc. 1 A | 01 36 45.25 | +15 47 48.06 | 209. | 2.466 | |||||
| NGC 0855 C | 02 14 03.56 | +27 52 38.30 | 377. | 0.072 | |||||
| NGC 0855 A† | 02 14 03.80 | +27 52 37.85 | 613. | 0.305 | |||||
| NGC 0855 B | 02 14 04.36 | +27 52 36.80 | 189. | 0.910 | |||||
| NGC 0925 D | 02 27 15.981 | +33 33 38.58 | 0.75 | 133. | 5.510 | ||||
| NGC 0925 A | 02 27 17.00 | +33 34 43.00 | 0.06 | 0.09 | 177. | 0.183 | |||
| NGC 0925 B | 02 27 20.62 | +33 34 29.80 | 0.21 | 133. | 2.097 | ||||
| NGC 1097 Enuc. 2 | 02 46 14.40 | -30 15 04.80 | 0.16 | 138. | 7.378 | ||||
| NGC 1097 D | 02 46 18.34 | -30 16 31.00 | 275. | 0.813 | |||||
| NGC 1097 B | 02 46 18.96 | -30 16 29.20 | 275. | 0.052 | |||||
| NGC 1097 A† | 02 46 18.96 | -30 16 29.20 | 964. | 0.052 | |||||
| NGC 1097 E | 02 46 19.08 | -30 16 20.20 | 275. | 0.831 | |||||
| NGC 1097 C | 02 46 19.45 | -30 16 33.70 | 275. | 0.514 | |||||
| NGC 1097 Enuc. 1 | 02 46 23.90 | -30 17 50.50 | 0.69 | 0.13 | 688. | 7.301 | |||
| NGC 1266 C | 03 16 00.76 | -02 25 36.50 | 445. | 0.390 | |||||
| NGC 1266 A† | 03 16 00.76 | -02 25 39.20 | 1038. | 0.267 | |||||
| NGC 1266 B | 03 16 00.76 | -02 25 42.50 | 445. | 0.964 | |||||
| NGC 1377 | 03 36 39.09 | -20 54 06.60 | 358. | 0.344 | |||||
| IC 342 B | 03 46 47.80 | +68 05 46.30 | 64. | 0.065 | |||||
| IC 342 A† | 03 46 48.45 | +68 05 46.30 | 159. | 0.007 | |||||
| IC 342 C | 03 46 49.14 | +68 05 48.40 | 64. | 0.074 | |||||
| IC 342 D | 03 46 50.918 | +68 06 05.89 | 0.30 | 64. | 0.404 | ||||
| NGC 1482 C | 03 54 38.73 | -20 30 07.30 | 438. | 0.272 | |||||
| NGC 1482 A† | 03 54 38.97 | -20 30 08.20 | 1205. | 0.104 | |||||
| NGC 1482 B | 03 54 39.22 | -20 30 08.20 | 438. | 0.516 | |||||
| NGC 2146 A | 06 18 31.67 | +78 21 43.84 | 417. | 3.862 | |||||
| NGC 2146 B | 06 18 33.90 | +78 21 34.94 | 250. | 2.205 | |||||
| NGC 2146 C | 06 18 35.34 | +78 21 30.75 | 250. | 1.322 | |||||
| NGC 2146 D | 06 18 38.35 | +78 21 23.02 | 667. | 0.410 | |||||
| NGC 2146 E | 06 18 43.83 | +78 21 11.70 | 334. | 3.245 | |||||
| NGC 2403 Enuc. 5 C | 07 36 19.35 | +65 37 06.40 | 62. | 3.520 | |||||
| NGC 2403 Enuc. 5 A† | 07 36 19.84 | +65 37 06.70 | 140. | 3.458 | |||||
| NGC 2403 Enuc. 5 E | 07 36 20.696 | +65 38 04.84 | 0.47 | 62. | 3.428 | ||||
| NGC 2403 Enuc. 5 B | 07 36 22.99 | +65 36 49.90 | 62. | 3.150 | |||||
| NGC 2403 Enuc. 6 A | 07 36 28.69 | +65 33 49.95 | 125. | 5.369 | |||||
| NGC 2403 Enuc. 6 B | 07 36 29.56 | +65 34 05.30 | 0.06 | 62. | 4.933 | ||||
| NGC 2403 Enuc. 1 E | 07 36 38.042 | +65 36 09.31 | 0.96 | 62. | 1.529 | ||||
| NGC 2403 Enuc. 1 A | 07 36 42.03 | +65 36 51.67 | 62. | 1.085 | |||||
| NGC 2403 C | 07 36 42.562 | +65 36 07.23 | 0.14 | 62. | 0.952 | ||||
| NGC 2403 Enuc. 1 B | 07 36 45.49 | +65 37 01.39 | 125. | 1.203 | |||||
| NGC 2403 Enuc. 1 C | 07 36 45.74 | +65 36 39.90 | 62. | 0.753 | |||||
| NGC 2403 Enuc. 1 D | 07 36 46.71 | +65 36 37.50 | 62. | 0.697 | |||||
| NGC 2403 Enuc. 2 B | 07 36 49.15 | +65 36 51.72 | 94. | 1.115 | |||||
| NGC 2403 Enuc. 2 D | 07 36 52.07 | +65 36 48.40 | 47. | 1.258 | |||||
| NGC 2403 Enuc. 2 A† | 07 36 52.46 | +65 36 45.70 | 125. | 1.229 | |||||
| NGC 2403 Enuc. 2 C | 07 36 52.80 | +65 36 45.10 | 47. | 1.247 | |||||
| NGC 2403 B | 07 36 55.91 | +65 35 38.49 | 0.08 | 0.13 | 62. | 0.699 | |||
| NGC 2403 E | 07 36 56.727 | +65 35 12.17 | 0.10 | 0.58 | 62. | 1.101 | |||
| NGC 2403 Enuc. 3 B | 07 37 06.66 | +65 36 38.40 | 78. | 2.763 | |||||
| NGC 2403 Enuc. 4 B | 07 37 16.55 | +65 33 50.80 | 0.08 | 62. | 3.305 | ||||
| NGC 2403 Enuc. 4 C | 07 37 18.14 | +65 33 37.90 | 0.08 | 62. | 3.556 | ||||
| NGC 2403 Enuc. 4 A | 07 37 18.30 | +65 33 49.90 | 125. | 3.446 | |||||
| Holmberg II B | 08 19 12.69 | +70 43 03.80 | 44. | 0.721 | |||||
| Holmberg II A | 08 19 13.09 | +70 43 08.90 | 59. | 0.739 | |||||
| NGC 2798 B | 09 17 22.56 | +41 59 51.10 | 375. | 2.580 | |||||
| NGC 2798 A | 09 17 22.83 | +42 00 01.00 | 1001. | 0.217 | |||||
| NGC 2841 A | 09 22 02.68 | +50 58 35.74 | 0.18 | 0.08 | 410. | 0.171 | |||
| NGC 2976 Enuc. 1 A | 09 47 05.09 | +67 55 51.70 | 86. | 1.432 | |||||
| NGC 2976 Enuc. 1 D | 09 47 07.64 | +67 55 55.30 | 69. | 1.208 | |||||
| NGC 2976 Enuc. 1 C | 09 47 07.85 | +67 55 48.10 | 52. | 1.111 | |||||
| NGC 2976 Enuc. 1 B† | 09 47 07.85 | +67 55 53.98 | 172. | 1.178 | |||||
| NGC 2976 B | 09 47 13.54 | +67 54 54.90 | 69. | 0.432 | |||||
| NGC 2976 A | 09 47 15.30 | +67 55 00.00 | 0.07 | 0.10 | 69. | 0.000 | |||
| NGC 2976 Enuc. 2 A | 09 47 23.94 | +67 53 53.40 | 120. | 1.421 | |||||
| NGC 2976 Enuc. 2 C | 09 47 23.94 | +67 54 05.40 | 103. | 1.278 | |||||
| NGC 2976 C | 09 47 25.079 | +67 55 09.45 | 0.07 | 0.48 | 69. | 2.002 | |||
| NGC 3049 A | 09 54 49.56 | +09 16 16.05 | 559. | 0.110 | |||||
| NGC 3049 B | 09 54 50.05 | +09 16 25.40 | 372. | 1.033 | |||||
| NGC 3049 C | 09 54 51.46 | +09 16 28.40 | 0.06 | 0.10 | 279. | 3.622 | |||
| NGC 3077 A | 10 03 19.15 | +68 43 59.90 | 186. | 0.045 | |||||
| NGC 3190 A | 10 18 04.31 | +21 49 31.79 | 374. | 9.635 | |||||
| NGC 3184 B | 10 18 11.442 | +41 24 49.70 | 1.56 | 340. | 4.382 | ||||
| NGC 3184 A | 10 18 16.91 | +41 25 27.02 | 340. | 0.057 | |||||
| NGC 3198 B | 10 19 50.990 | +45 32 50.16 | 0.34 | 410. | 5.622 | ||||
| NGC 3198 A | 10 19 55.02 | +45 32 59.24 | 410. | 0.180 | |||||
| NGC 3198 C | 10 19 57.979 | +45 32 28.54 | 0.39 | 410. | 8.035 | ||||
| IC 2574 D | 10 28 40.72 | +68 28 01.39 | 92. | 5.606 | |||||
| IC 2574 C | 10 28 43.88 | +68 28 26.90 | 129. | 6.262 | |||||
| IC 2574 A | 10 28 48.41 | +68 28 03.28 | 92. | 5.247 | |||||
| IC 2574 B | 10 28 48.78 | +68 28 35.90 | 0.13 | 73. | 6.263 | ||||
| NGC 3265 A | 10 31 06.77 | +28 47 48.01 | 665. | 0.090 | |||||
| NGC 3351 C | 10 43 55.25 | +11 41 29.90 | 181. | 2.844 | |||||
| NGC 3351 A | 10 43 57.67 | +11 42 07.19 | 271. | 0.267 | |||||
| NGC 3351 B | 10 43 57.77 | +11 42 18.88 | 271. | 0.271 | |||||
| NGC 3521 Enuc. 1 | 11 05 46.36 | -00 04 10.10 | 0.15 | 271. | 9.918 | ||||
| NGC 3521 Enuc. 3 A | 11 05 47.64 | +00 00 32.80 | 0.20 | 0.18 | 489. | 9.517 | |||
| NGC 3521 Enuc. 2 A | 11 05 49.28 | -00 03 26.70 | 271. | 4.474 | |||||
| NGC 3521 Enuc. 3 C | 11 05 49.421 | -0 00 29.52 | 0.22 | 2.62 | 489. | 6.970 | |||
| NGC 3521 Enuc. 2 B | 11 05 51.04 | -00 03 49.20 | 0.15 | 271. | 5.824 | ||||
| NGC 3621 C | 11 18 14.878 | -32 47 35.40 | 2.10 | 191. | 2.191 | ||||
| NGC 3621 A | 11 18 15.21 | -32 48 39.60 | 0.16 | 191. | 0.841 | ||||
| NGC 3621 H | 11 18 16.465 | -32 48 56.84 | 0.09 | 0.17 | 191. | 0.574 | |||
| NGC 3621 G† | 11 18 18.117 | -32 49 39.41 | 2.71 | 381. | 1.967 | ||||
| NGC 3621 B | 11 18 18.936 | -32 47 44.04 | 2.97 | 254. | 3.029 | ||||
| NGC 3621 F | 11 18 20.832 | -32 48 53.41 | 0.12 | 1.22 | 191. | 2.760 | |||
| NGC 3621 E | 11 18 21.542 | -32 49 08.39 | 4.80 | 191. | 3.143 | ||||
| NGC 3627 Enuc. 1 G | 11 20 11.500 | +12 57 55.42 | 0.33 | 2.45 | 318. | 7.592 | |||
| NGC 3627 Enuc. 1 F | 11 20 12.848 | +12 57 56.98 | 0.15 | 0.32 | 182. | 5.975 | |||
| NGC 3627 Enuc. 1 E | 11 20 12.989 | +12 57 36.49 | 0.15 | 182. | 6.672 | ||||
| NGC 3627 B | 11 20 13.34 | +13 00 21.30 | 364. | 3.072 | |||||
| NGC 3627 A | 11 20 15.01 | +12 59 29.53 | 273. | 0.023 | |||||
| NGC 3627 Enuc. 2 D | 11 20 16.26 | +12 58 44.30 | 136. | 2.534 | |||||
| NGC 3627 Enuc. 1 A | 11 20 16.33 | +12 57 49.39 | 273. | 4.706 | |||||
| NGC 3627 Enuc. 2 A† | 11 20 16.53 | +12 58 44.30 | 455. | 2.781 | |||||
| NGC 3627 Enuc. 2 E | 11 20 16.71 | +12 58 43.40 | 136. | 2.994 | |||||
| NGC 3627 Enuc. 2 C | 11 20 17.98 | +12 59 06.20 | 182. | 4.390 | |||||
| NGC 3627 Enuc. 2 B | 11 20 18.70 | +12 59 24.20 | 0.38 | 182. | 5.526 | ||||
| NGC 3773 | 11 38 13.02 | +12 06 44.10 | 481. | 0.023 | |||||
| NGC 3938 B | 11 52 46.860 | +44 08 07.38 | 0.08 | 0.59 | 434. | 5.503 | |||
| NGC 3938 Enuc. 2 B | 11 52 59.97 | +44 08 00.00 | 347. | 11.079 | |||||
| NGC 3938 Enuc. 2 A | 11 53 00.20 | +44 07 48.07 | 434. | 11.048 | |||||
| NGC 4254 Enuc. 2 D | 12 18 45.82 | +14 24 09.80 | 0.09 | 279. | 5.332 | ||||
| NGC 4254 Enuc. 2 C | 12 18 46.19 | +14 24 11.90 | 0.07 | 0.06 | 209. | 4.931 | |||
| NGC 4254 Enuc. 1 E | 12 18 46.77 | +14 23 51.00 | 0.14 | 279. | 5.622 | ||||
| NGC 4254 Enuc. 2 E | 12 18 47.495 | +14 24 41.83 | 0.09 | 0.14 | 279. | 2.617 | |||
| NGC 4254 | 12 18 49.54 | +14 25 01.40 | 559. | 0.124 | |||||
| NGC 4254 Enuc. 1 D | 12 18 50.03 | +14 24 17.10 | 349. | 3.167 | |||||
| NGC 4254 Enuc. 1 B | 12 18 50.07 | +14 24 06.60 | 419. | 3.924 | |||||
| NGC 4254 Enuc. 1 C | 12 18 50.44 | +14 24 22.50 | 0.05 | 209. | 2.953 | ||||
| NGC 4321 Enuc. 2 | 12 22 49.90 | +15 50 28.70 | 0.08 | 347. | 8.026 | ||||
| NGC 4321 C | 12 22 54.46 | +15 49 21.30 | 277. | 0.500 | |||||
| NGC 4321 F | 12 22 54.63 | +15 49 14.70 | 208. | 0.514 | |||||
| NGC 4321 H | 12 22 54.92 | +15 49 09.90 | 208. | 0.810 | |||||
| NGC 4321 A† | 12 22 54.92 | +15 49 21.00 | 1040. | 0.024 | |||||
| NGC 4321 B | 12 22 54.94 | +15 49 20.40 | 208. | 0.069 | |||||
| NGC 4321 G | 12 22 54.94 | +15 49 29.40 | 277. | 0.605 | |||||
| NGC 4321 D | 12 22 55.29 | +15 49 15.30 | 277. | 0.653 | |||||
| NGC 4321 E | 12 22 55.38 | +15 49 23.40 | 277. | 0.547 | |||||
| NGC 4321 Enuc. 1 B | 12 22 58.82 | +15 48 50.60 | 0.12 | 208. | 5.246 | ||||
| NGC 4536 C | 12 34 26.94 | +02 11 19.40 | 281. | 0.243 | |||||
| NGC 4536 A† | 12 34 27.08 | +02 11 17.30 | 844. | 0.030 | |||||
| NGC 4536 B | 12 34 27.34 | +02 11 15.50 | 281. | 0.330 | |||||
| NGC 4559 E | 12 35 55.427 | +27 58 01.88 | 0.15 | 203. | 1.703 | ||||
| NGC 4559 C | 12 35 56.27 | +27 57 40.80 | 203. | 1.294 | |||||
| NGC 4559 D | 12 35 57.59 | +27 57 36.90 | 0.12 | 0.07 | 203. | 0.090 | |||
| NGC 4559 B | 12 35 58.36 | +27 57 33.90 | 135. | 0.599 | |||||
| NGC 4559 A | 12 35 58.45 | +27 57 27.90 | 102. | 0.563 | |||||
| NGC 4569 A | 12 36 49.84 | +13 09 46.59 | 430. | 0.051 | |||||
| NGC 4579 | 12 37 43.52 | +11 49 05.50 | 795. | 0.103 | |||||
| NGC 4594 | 12 39 59.43 | -11 37 23.03 | 440. | 0.046 | |||||
| NGC 4631 Enuc. 1 | 12 41 40.47 | +32 31 50.00 | 296. | 13.669 | |||||
| NGC 4625 A | 12 41 52.27 | +41 16 25.50 | 0.12 | 0.06 | 271. | 0.190 | |||
| NGC 4631 A | 12 42 03.59 | +32 32 16.28 | 148. | 3.389 | |||||
| NGC 4631 H | 12 42 04.17 | +32 32 16.60 | 148. | 3.276 | |||||
| NGC 4631 B | 12 42 04.38 | +32 32 25.08 | 185. | 1.712 | |||||
| NGC 4631 G | 12 42 05.07 | +32 32 12.40 | 185. | 4.464 | |||||
| NGC 4631 Enuc. 2 B | 12 42 22.22 | +32 32 46.33 | 369. | 6.825 | |||||
| NGC 4631 Enuc. 2 C | 12 42 23.985 | +32 32 08.65 | 0.11 | 0.92 | 185. | 12.785 | |||
| NGC 4725 C | 12 50 24.87 | +25 29 22.80 | 0.12 | 173. | 2.693 | ||||
| NGC 4725 A | 12 50 26.57 | +25 30 02.72 | 173. | 0.034 | |||||
| NGC 4736 K | 12 50 49.204 | +41 07 33.20 | 0.42 | 136. | 1.102 | ||||
| NGC 4736 J | 12 50 49.219 | +41 07 23.09 | 0.36 | 136. | 1.017 | ||||
| NGC 4736 I | 12 50 49.604 | +41 07 09.41 | 0.29 | 136. | 0.922 | ||||
| NGC 4736 G | 12 50 49.935 | +41 06 41.41 | 0.24 | 0.43 | 136. | 1.248 | |||
| NGC 4736 L | 12 50 50.030 | +41 07 50.00 | 0.24 | 0.48 | 136. | 1.222 | |||
| NGC 4736 H | 12 50 50.045 | +41 06 53.23 | 136. | 1.002 | |||||
| NGC 4736 M | 12 50 50.746 | +41 07 38.18 | 0.21 | 0.25 | 136. | 0.872 | |||
| NGC 4736 F | 12 50 51.201 | +41 06 49.50 | 0.23 | 136. | 0.846 | ||||
| NGC 4736 N | 12 50 51.776 | +41 07 48.36 | 0.27 | 136. | 0.991 | ||||
| NGC 4736 A | 12 50 53.050 | +41 07 12.50 | 136. | 0.020 | |||||
| NGC 4736 O | 12 50 53.190 | +41 07 46.40 | 136. | 0.914 | |||||
| NGC 4736 E | 12 50 54.070 | +41 06 29.06 | 0.14 | 0.41 | 136. | 1.200 | |||
| NGC 4736 P | 12 50 54.541 | +41 07 48.36 | 136. | 1.069 | |||||
| NGC 4736 D | 12 50 54.565 | +41 06 36.52 | 136. | 1.029 | |||||
| NGC 4736 Enuc. 1 D | 12 50 55.99 | +41 07 26.60 | 90. | 0.869 | |||||
| NGC 4736 Enuc. 1 A | 12 50 56.35 | +41 07 17.00 | 136. | 0.860 | |||||
| NGC 4736 Enuc. 1 B | 12 50 56.65 | +41 07 04.40 | 136. | 0.928 | |||||
| NGC 4736 Enuc. 1 C | 12 50 56.83 | +41 06 47.52 | 136. | 1.133 | |||||
| NGC 4736 Enuc. 1 E | 12 50 56.84 | +41 07 23.00 | 0.12 | 68. | 1.033 | ||||
| NGC 4826 C | 12 56 43.11 | +21 40 54.79 | 77. | 0.427 | |||||
| NGC 4826 B | 12 56 43.11 | +21 41 06.79 | 77. | 0.295 | |||||
| NGC 4826 A | 12 56 43.61 | +21 41 00.41 | 153. | 0.034 | |||||
| NGC 4826 F† | 12 56 43.73 | +21 41 00.90 | 409. | 0.049 | |||||
| NGC 4826 E | 12 56 43.84 | +21 41 11.40 | 77. | 0.558 | |||||
| NGC 4826 D | 12 56 44.34 | +21 40 55.99 | 77. | 0.250 | |||||
| NGC 5055 C | 13 15 46.766 | +42 02 01.43 | 0.07 | 0.11 | 154. | 1.349 | |||
| NGC 5055 D | 13 15 47.919 | +42 01 41.96 | 0.08 | 154. | 0.722 | ||||
| NGC 5055 A | 13 15 49.29 | +42 01 45.82 | 231. | 0.054 | |||||
| NGC 5055 B | 13 15 50.20 | +42 01 01.90 | 0.24 | 154. | 2.805 | ||||
| NGC 5055 Enuc. 1 | 13 15 58.32 | +42 00 27.10 | 231. | 5.645 | |||||
| NGC 5194 Enuc. 6 | 13 29 39.32 | +47 08 38.90 | 222. | 12.377 | |||||
| NGC 5194 Enuc. 3 B | 13 29 43.77 | +47 10 00.65 | 0.19 | 222. | 7.645 | ||||
| NGC 5194 Enuc. 3 A | 13 29 45.06 | +47 09 58.43 | 259. | 7.051 | |||||
| NGC 5194 Enuc. 11 G | 13 29 45.117 | +47 13 32.37 | 0.11 | 148. | 5.358 | ||||
| NGC 5194 Enuc. 11 A | 13 29 47.07 | +47 13 40.72 | 0.10 | 148. | 4.942 | ||||
| NGC 5194 Enuc. 11 B | 13 29 47.52 | +47 13 25.14 | 0.13 | 148. | 4.365 | ||||
| NGC 5194 Enuc. 11 C | 13 29 49.56 | +47 13 28.04 | 0.13 | 148. | 4.057 | ||||
| NGC 5194 Enuc. 11 D | 13 29 49.57 | +47 14 00.06 | 148. | 5.220 | |||||
| NGC 5194 H | 13 29 49.96 | +47 11 25.90 | 296. | 1.968 | |||||
| NGC 5194 L | 13 29 50.26 | +47 11 46.90 | 222. | 1.450 | |||||
| NGC 5194 M | 13 29 50.32 | +47 11 37.90 | 111. | 1.520 | |||||
| NGC 5194 Enuc. 11 E | 13 29 50.48 | +47 13 45.15 | 111. | 4.641 | |||||
| NGC 5194 A | 13 29 50.69 | +47 11 55.79 | 148. | 1.185 | |||||
| NGC 5194 Enuc. 11 F | 13 29 50.92 | +47 13 43.64 | 111. | 4.592 | |||||
| NGC 5194 K | 13 29 51.43 | +47 12 00.40 | 148. | 0.876 | |||||
| NGC 5194 B | 13 29 51.57 | +47 12 08.43 | 148. | 1.045 | |||||
| NGC 5194 G | 13 29 51.79 | +47 11 38.50 | 148. | 0.629 | |||||
| NGC 5194 J | 13 29 52.23 | +47 12 03.40 | 111. | 0.777 | |||||
| NGC 5194 E | 13 29 52.59 | +47 11 52.90 | 296. | 0.379 | |||||
| NGC 5194 O | 13 29 52.61 | +47 11 22.90 | 0.13 | 222. | 0.813 | ||||
| NGC 5194 I | 13 29 52.76 | +47 11 42.40 | 111. | 0.037 | |||||
| NGC 5194 C† | 13 29 52.77 | +47 11 40.90 | 185. | 0.082 | |||||
| NGC 5194 Enuc. 1 A | 13 29 53.22 | +47 12 40.00 | 148. | 2.368 | |||||
| NGC 5194 Enuc. 4 D | 13 29 53.90 | +47 14 04.90 | 0.09 | 0.05 | 111. | 5.873 | |||
| NGC 5194 N | 13 29 54.14 | +47 11 27.40 | 0.14 | 222. | 0.919 | ||||
| NGC 5194 F | 13 29 55.12 | +47 11 34.39 | 185. | 1.412 | |||||
| NGC 5194 Enuc. 4 C | 13 29 55.73 | +47 13 48.40 | 111. | 5.770 | |||||
| NGC 5194 P | 13 29 55.85 | +47 11 55.90 | 148. | 2.119 | |||||
| NGC 5194 Enuc. 4 E | 13 29 56.20 | +47 14 08.50 | 0.09 | 0.05 | 111. | 6.690 | |||
| NGC 5194 Enuc. 10 | 13 29 56.73 | +47 10 45.70 | 222. | 2.829 | |||||
| NGC 5194 Enuc. 4 B | 13 29 57.62 | +47 13 54.82 | 0.05 | 111. | 6.717 | ||||
| NGC 5194 Enuc. 5 B | 13 29 58.92 | +47 14 09.40 | 148. | 7.776 | |||||
| NGC 5194 Enuc. 4 F | 13 29 59.00 | +47 14 09.10 | 111. | 7.798 | |||||
| NGC 5194 Enuc. 4 G | 13 29 59.59 | +47 13 59.50 | 148. | 7.726 | |||||
| NGC 5194 Enuc. 5 A | 13 29 59.64 | +47 13 59.43 | 185. | 7.748 | |||||
| NGC 5194 Enuc. 9 | 13 29 59.84 | +47 11 12.60 | 185. | 4.166 | |||||
| NGC 5194 Enuc. 8 C | 13 30 00.33 | +47 13 19.90 | 0.13 | 148. | 6.815 | ||||
| NGC 5194 Enuc. 8 B | 13 30 00.69 | +47 13 06.93 | 222. | 6.622 | |||||
| NGC 5194 Enuc. 7 E | 13 30 01.00 | +47 09 28.90 | 0.14 | 148. | 6.204 | ||||
| NGC 5194 Enuc. 8 A | 13 30 01.39 | +47 12 51.33 | 222. | 6.591 | |||||
| NGC 5194 Enuc. 7 A | 13 30 02.28 | +47 09 47.77 | 222. | 6.301 | |||||
| NGC 5194 Enuc. 7 C | 13 30 02.76 | +47 09 56.80 | 148. | 6.369 | |||||
| NGC 5194 Enuc. 7 B | 13 30 03.50 | +47 09 41.14 | 0.13 | 185. | 6.961 | ||||
| NGC 5194 Enuc. 7 F | 13 30 05.06 | +47 10 34.90 | 0.32 | 148. | 7.231 | ||||
| NGC 5194 Enuc. 8 D | 13 30 07.391 | +47 13 22.05 | 0.98 | 148. | 10.734 | ||||
| NGC 5398 | 14 01 20.11 | -33 04 10.66 | 334. | 1.417 | |||||
| NGC 5457 Enuc. 6 A | 14 02 28.23 | +54 16 26.55 | 195. | 15.711 | |||||
| NGC 5457 Enuc. 6 E | 14 02 28.34 | +54 16 36.20 | 162. | 15.525 | |||||
| NGC 5457 Enuc. 6 B | 14 02 29.59 | +54 16 15.85 | 227. | 15.552 | |||||
| NGC 5457 Enuc. 6 C | 14 02 30.59 | +54 16 09.84 | 130. | 15.416 | |||||
| NGC 5457 Enuc. 6 D | 14 02 30.64 | +54 16 01.20 | 130. | 15.563 | |||||
| NGC 5457 Enuc. 6 F | 14 02 31.08 | +54 15 49.70 | 0.15 | 97. | 15.678 | ||||
| NGC 5457 Enuc. 2 B | 14 02 51.05 | +54 22 09.50 | 0.11 | 97. | 7.282 | ||||
| NGC 5457 Enuc. 2 C | 14 02 59.329 | +54 23 23.97 | 0.78 | 97. | 6.670 | ||||
| NGC 5457 Enuc. 5 B | 14 03 01.10 | +54 14 30.50 | 130. | 13.068 | |||||
| NGC 5457 Enuc. 5 A† | 14 03 01.17 | +54 14 26.90 | 260. | 13.180 | |||||
| NGC 5457 Enuc. 5 C | 14 03 01.24 | +54 14 23.60 | 130. | 13.282 | |||||
| NGC 5457 Enuc. 1 | 14 03 10.17 | +54 20 58.10 | 0.04 | 97. | 0.756 | ||||
| NGC 5457 | 14 03 12.50 | +54 20 56.40 | 195. | 0.036 | |||||
| NGC 5457 Enuc. 3 E | 14 03 34.039 | +54 18 36.69 | 1.61 | 130. | 8.447 | ||||
| NGC 5457 Enuc. 3 D | 14 03 38.63 | +54 18 49.30 | 0.15 | 130. | 9.430 | ||||
| NGC 5457 Enuc. 3 A | 14 03 39.85 | +54 18 56.58 | 162. | 9.645 | |||||
| NGC 5457 Enuc. 3 B | 14 03 41.46 | +54 19 04.95 | 292. | 9.971 | |||||
| NGC 5457 Enuc. 3 C | 14 03 42.98 | +54 19 24.77 | 195. | 10.132 | |||||
| NGC 5457 Enuc. 4 A | 14 03 51.86 | +54 21 52.80 | 162. | 12.097 | |||||
| NGC 5457 Enuc. 4 B | 14 03 53.04 | +54 21 56.31 | 162. | 12.463 | |||||
| NGC 5457 Enuc. 4 C | 14 03 53.17 | +54 22 06.29 | 162. | 12.530 | |||||
| NGC 5457 Enuc. 4 D | 14 03 54.01 | +54 22 11.21 | 162. | 12.801 | |||||
| NGC 5457 Enuc. 7 D† | 14 04 29.03 | +54 23 48.80 | 325. | 23.774 | |||||
| NGC 5457 Enuc. 7 B | 14 04 29.24 | +54 23 52.98 | 97. | 23.859 | |||||
| NGC 5713 A | 14 40 10.28 | -00 17 20.25 | 415. | 2.130 | |||||
| NGC 5713 F | 14 40 10.34 | -00 17 29.10 | 311. | 2.197 | |||||
| NGC 5713 B | 14 40 10.74 | -00 17 19.74 | 311. | 1.329 | |||||
| NGC 5713 Enuc. 2 | 14 40 10.78 | -00 17 50.00 | 623. | 3.320 | |||||
| NGC 5713 Enuc. 2 A | 14 40 10.83 | -00 17 36.01 | 519. | 1.999 | |||||
| NGC 5713 C | 14 40 11.05 | -00 17 19.08 | 311. | 0.795 | |||||
| NGC 5713 G† | 14 40 11.40 | -00 17 20.10 | 1556. | 0.174 | |||||
| NGC 5713 D | 14 40 11.41 | -00 17 19.41 | 311. | 0.163 | |||||
| NGC 5713 Enuc. 1 A | 14 40 12.10 | -00 17 47.20 | 0.10 | 0.06 | 415. | 3.058 | |||
| NGC 5713 E | 14 40 12.74 | -00 17 18.60 | 519. | 2.158 | |||||
| NGC 5866 | 15 06 29.50 | +55 45 47.56 | 297. | 0.071 | |||||
| NGC 6946 Enuc. 4 A | 20 34 19.08 | +60 10 09.81 | 132. | 9.282 | |||||
| NGC 6946 Enuc. 4 B | 20 34 19.20 | +60 10 03.69 | 99. | 9.172 | |||||
| NGC 6946 Enuc. 4 H | 20 34 21.880 | +60 10 47.83 | 132. | 9.199 | |||||
| NGC 6946 Enuc. 8 A | 20 34 32.29 | +60 10 18.61 | 198. | 6.106 | |||||
| NGC 6946 Enuc. 5 A | 20 34 37.14 | +60 05 10.18 | 0.08 | 0.04 | 99. | 9.238 | |||
| NGC 6946 Enuc. 8 B | 20 34 37.489 | +60 09 36.47 | 0.11 | 0.58 | 132. | 6.106 | |||
| NGC 6946 Enuc. 5 B | 20 34 39.31 | +60 04 52.72 | 165. | 9.695 | |||||
| NGC 6946 Enuc. 3 A | 20 34 49.85 | +60 12 40.69 | 132. | 7.743 | |||||
| NGC 6946 Enuc. 3 B | 20 34 51.22 | +60 12 42.36 | 132. | 7.727 | |||||
| NGC 6946 A | 20 34 52.18 | +60 09 14.60 | 297. | 0.041 | |||||
| NGC 6946 Enuc. 3 C | 20 34 52.32 | +60 12 44.00 | 198. | 7.736 | |||||
| NGC 6946 B | 20 34 52.90 | +60 08 51.80 | 99. | 0.857 | |||||
| NGC 6946 C | 20 34 53.59 | +60 09 18.80 | 99. | 0.356 | |||||
| NGC 6946 Enuc. 6 J | 20 35 03.14 | +60 10 56.40 | 99. | 4.357 | |||||
| NGC 6946 Enuc. 6 I | 20 35 03.75 | +60 10 59.40 | 99. | 4.524 | |||||
| NGC 6946 Enuc. 6 H | 20 35 04.19 | +60 10 54.60 | 99. | 4.457 | |||||
| NGC 6946 Enuc. 6 F | 20 35 05.20 | +60 10 56.40 | 99. | 4.659 | |||||
| NGC 6946 Enuc. 6 E | 20 35 06.68 | +60 11 12.00 | 0.11 | 132. | 5.295 | ||||
| NGC 6946 Enuc. 6 B | 20 35 07.01 | +60 10 45.30 | 99. | 4.709 | |||||
| NGC 6946 Enuc. 6 C | 20 35 07.81 | +60 10 47.10 | 0.08 | 99. | 4.899 | ||||
| NGC 6946 Enuc. 9 E | 20 35 09.04 | +60 09 22.95 | 0.12 | 99. | 4.361 | ||||
| NGC 6946 Enuc. 9 D | 20 35 10.28 | +60 09 22.35 | 0.14 | 132. | 4.689 | ||||
| NGC 6946 Enuc. 9 A | 20 35 11.24 | +60 08 57.42 | 198. | 5.111 | |||||
| NGC 6946 Enuc. 6 L | 20 35 11.31 | +60 10 32.99 | 132. | 5.374 | |||||
| NGC 6946 Enuc. 9 C | 20 35 11.49 | +60 09 12.45 | 99. | 5.054 | |||||
| NGC 6946 Enuc. 9 B | 20 35 11.69 | +60 09 05.85 | 99. | 5.154 | |||||
| NGC 6946 Enuc. 7 A | 20 35 12.96 | +60 08 50.95 | 165. | 5.630 | |||||
| NGC 6946 Enuc. 7 B | 20 35 14.11 | +60 08 51.79 | 99. | 5.918 | |||||
| NGC 6946 Enuc. 1 A | 20 35 16.79 | +60 11 00.23 | 132. | 6.989 | |||||
| NGC 6946 Enuc. 2 C | 20 35 21.36 | +60 09 51.93 | 0.14 | 132. | 7.548 | ||||
| NGC 7331 G | 22 37 02.38 | +34 24 59.90 | 0.43 | 0.38 | 562. | 4.675 | |||
| NGC 7331 F | 22 37 02.52 | +34 25 17.90 | 0.34 | 422. | 3.998 | ||||
| NGC 7331 H | 22 37 03.11 | +34 24 43.40 | 0.40 | 633. | 3.296 | ||||
| NGC 7331 I | 22 37 03.83 | +34 24 29.30 | 0.38 | 492. | 2.483 | ||||
| NGC 7331 A | 22 37 04.10 | +34 24 56.00 | 0.16 | 281. | 0.000 | ||||
| NGC 7331 E | 22 37 05.00 | +34 25 08.90 | 0.48 | 633. | 3.053 | ||||
| NGC 7331 B | 22 37 05.36 | +34 24 53.90 | 0.26 | 422. | 3.445 | ||||
| NGC 7331 D | 22 37 05.77 | +34 24 44.90 | 0.20 | 281. | 4.371 | ||||
| NGC 7793 Enuc. 1 E | 23 57 48.222 | -32 36 15.38 | 0.35 | 95. | 1.430 | ||||
| NGC 7793 Enuc. 3 | 23 57 48.87 | -32 34 52.80 | 0.14 | 95. | 0.992 | ||||
| NGC 7793 Enuc. 1 A | 23 57 48.89 | -32 36 58.60 | 0.17 | 114. | 2.587 | ||||
| NGC 7793 C | 23 57 48.94 | -32 34 54.60 | 95. | 0.941 | |||||
| NGC 7793 A | 23 57 49.41 | -32 35 26.70 | 152. | 0.097 | |||||
| NGC 7793 Enuc. 1 B | 23 57 49.68 | -32 37 13.00 | 0.09 | 0.19 | 114. | 2.962 | |||
| NGC 7793 Enuc. 1 C | 23 57 51.10 | -32 36 49.00 | 0.21 | 95. | 2.268 | ||||
| NGC 7793 Enuc. 2 | 23 57 56.15 | -32 35 40.60 | 0.13 | 0.08 | 171. | 1.540 | |||
| Likely Background Galaxies | |||||||||
| NGC 0925 C | 02 27 15.30 | +33 35 28.60 | 133. | 3.375 | |||||
| IC 342 E | 03 46 45.793 | +68 05 29.95 | 0.29 | 64. | 0.373 | ||||
| Holmberg II C | 08 19 12.69 | +70 43 03.80 | 44. | 2.067 | |||||
| NGC 2841 B | 09 22 00.988 | +50 59 05.13 | 0.10 | 0.07 | 205. | 2.374 | |||
| NGC 2976 Enuc. 1 E | 09 47 04.737 | +67 56 41.47 | 0.07 | 0.39 | 69. | 2.080 | |||
| NGC 3077 B | 10 03 16.379 | +68 43 42.53 | 0.14 | 56. | 0.456 | ||||
| NGC 3190 B | 10 18 05.64 | +21 49 55.91 | 374. | 0.082 | |||||
| NGC 3265 B | 10 31 11.125 | +28 48 07.09 | 0.52 | 380. | 5.817 | ||||
| NGC 3351 D | 10 43 55.136 | +11 42 05.36 | 0.21 | 181. | 2.472 | ||||
| NGC 3627 Enuc. 1 B | 11 20 17.291 | +12 56 57.67 | 0.16 | 0.44 | 182. | 7.224 | |||
| NGC 4569 B | 12 36 47.368 | +13 10 27.07 | 0.12 | 0.46 | 191. | 5.433 | |||
| NGC 4625 B | 12 41 52.424 | +41 17 17.64 | 180. | 2.434 | |||||
| NGC 6946 Enuc. 4 F | 20 34 23.90 | +60 10 42.90 | 198. | 8.611 | |||||
| NGC 6946 Enuc. 4 G | 20 34 26.24 | +60 10 30.59 | 165. | 7.811 | |||||
| Likely Associated with Supernovae | |||||||||
| NGC 2403 Enuc. 3 D | 07 37 17.034 | +65 35 57.79 | 0.09 | 2.94 | 62. | 3.525 | |||
| NGC 4736 B | 12 50 52.026 | +41 07 15.63 | 0.19 | 0.15 | 136. | 0.280 | |||
| NGC 4736 C | 12 50 52.522 | +41 07 01.94 | 0.20 | 0.15 | 136. | 0.350 | |||
| NGC 5194 D | 13 29 55.79 | +47 11 45.19 | 185. | 1.909 | |||||
| NGC 5194 Enuc. 7 D | 13 30 05.12 | +47 10 10.90 | 0.15 | 148. | 7.398 | ||||
| NGC 6946 F | 20 34 50.927 | +60 10 20.35 | 2.45 | 132. | 2.527 | ||||
| NGC 6946 Enuc. 6 D | 20 35 08.09 | +60 11 13.50 | 132. | 5.557 | |||||
| NGC 6946 Enuc. 2 B | 20 35 25.29 | +60 09 58.64 | 231. | 8.572 | |||||
| NGC 7331 C | 22 37 05.60 | +34 24 32.90 | 562. | 3.813 | |||||
| NGC 7793 B | 23 57 47.35 | -32 35 24.60 | 0.04 | 0.11 | 95. | 0.591 | |||
| Likely AME Candidates | |||||||||
| NGC 2403 Enuc. 5 D | 07 36 20.57 | +65 37 08.50 | 62. | 3.362 | |||||
| NGC 2403 Enuc. 2 E | 07 36 57.88 | +65 37 24.39 | 62. | 2.684 | |||||
| NGC 2403 Enuc. 3 A | 07 37 05.20 | +65 36 41.74 | 62. | 2.637 | |||||
| NGC 2403 Enuc. 3 C | 07 37 07.86 | +65 36 38.56 | 62. | 2.921 | |||||
| NGC 3627 Enuc. 1 D | 11 20 13.857 | +12 57 09.26 | 182. | 7.171 | |||||
| NGC 3627 Enuc. 1 C | 11 20 14.093 | +12 56 59.60 | 273. | 7.467 | |||||
| NGC 4254 Enuc. 2 A | 12 18 46.14 | +14 24 19.18 | 279. | 4.669 | |||||
| NGC 4254 Enuc. 1 A | 12 18 49.21 | +14 23 57.78 | 279. | 4.437 | |||||
| NGC 4631 C | 12 42 05.62 | +32 32 29.46 | 148. | 1.354 | |||||
| NGC 4631 D | 12 42 06.24 | +32 32 31.70 | 148. | 1.525 | |||||
| NGC 4631 E | 12 42 07.18 | +32 32 33.90 | 111. | 1.740 | |||||
| NGC 4631 F | 12 42 07.89 | +32 32 33.42 | 222. | 1.366 | |||||
| NGC 4631 Enuc. 2 A | 12 42 21.41 | +32 33 06.38 | 185. | 9.993 | |||||
| NGC 4725 B | 12 50 28.49 | +25 30 22.26 | 173. | 1.930 | |||||
| NGC 5194 Enuc. 2 | 13 29 44.09 | +47 10 22.86 | 259. | 6.852 | |||||
| NGC 5194 Enuc. 1 C | 13 29 49.39 | +47 12 40.90 | 148. | 2.587 | |||||
| NGC 5194 Enuc. 1 B | 13 29 51.98 | +47 12 43.90 | 148. | 2.327 | |||||
| NGC 5194 Enuc. 4 A | 13 29 55.50 | +47 14 01.50 | 148. | 6.192 | |||||
| NGC 5457 Enuc. 2 A | 14 02 55.08 | +54 22 27.44 | 162. | 6.429 | |||||
| NGC 5457 Enuc. 7 A | 14 04 28.61 | +54 23 52.40 | 97. | 23.668 | |||||
| NGC 5457 Enuc. 7 C | 14 04 29.45 | +54 23 47.11 | 130. | 23.894 | |||||
| NGC 6946 Enuc. 4 C | 20 34 19.88 | +60 10 06.42 | 132. | 9.032 | |||||
| NGC 6946 Enuc. 4 D | 20 34 21.39 | +60 10 17.87 | 132. | 8.808 | |||||
| NGC 6946 Enuc. 4 E | 20 34 22.72 | +60 10 34.04 | 132. | 8.741 | |||||
| NGC 6946 E | 20 34 51.30 | +60 09 38.30 | 165. | 0.972 | |||||
| NGC 6946 D | 20 34 52.78 | +60 09 30.50 | 132. | 0.601 | |||||
| NGC 6946 Enuc. 6 M | 20 35 00.77 | +60 11 30.29 | 132. | 5.163 | |||||
| NGC 6946 Enuc. 6 G | 20 35 06.00 | +60 11 00.60 | 99. | 4.894 | |||||
| NGC 6946 Enuc. 6 K | 20 35 06.20 | +60 10 55.50 | 99. | 4.801 | |||||
| NGC 6946 Enuc. 6 A† | 20 35 06.24 | +60 10 58.32 | 198. | 4.876 | |||||
| NGC 6946 Enuc. 1 B | 20 35 11.25 | +60 10 33.89 | 132. | 5.374 | |||||
| NGC 6946 Enuc. 2 A | 20 35 23.61 | +60 09 48.93 | 132. | 8.130 | |||||
| NGC 7793 Enuc. 1 D | 23 57 46.742 | -32 36 07.00 | 0.81 | 95. | 1.393 | ||||
Note. — † The aperture used for this region contained multiple smaller individual regions.
| Source ID | R.A. | Decl. | |||||||
|---|---|---|---|---|---|---|---|---|---|
| (J2000) | (J2000) | (mJy) | (mJy) | (mJy) | (pc) | (kpc) | |||
| Star-Forming Regions | |||||||||
| NGC 0337 a | 00 59 50.018 | -07 34 33.9 | 655. | 0.945 | |||||
| NGC 0337 b | 00 59 50.683 | -07 34 57.6 | 655. | 1.966 | |||||
| NGC 0337 c | 00 59 51.995 | -07 34 54.9 | 655. | 3.227 | |||||
| NGC 0337 d | 00 59 52.156 | -07 34 38.2 | 655. | 4.061 | |||||
| NGC 0628 Enuc. 4 | 01 36 35.718 | +15 50 07.25 | 244. | 7.608 | |||||
| NGC 0628 Enuc. 2 | 01 36 37.645 | +15 45 07.2 | 244. | 4.468 | |||||
| NGC 0628 Enuc. 3 | 01 36 38.779 | +15 44 23.2 | 244. | 5.720 | |||||
| NGC 0628 | 01 36 41.7 | +15 46 59 | 0.03 | 0.02 | 0.04 | 244. | 0.071 | ||
| NGC 0628 Enuc. 1 | 01 36 45.266 | +15 47 48.3 | 244. | 2.478 | |||||
| NGC 0855 | 02 14 03.677 | +27 52 37.85 | 330. | 0.202 | |||||
| NGC 0925 | 02 27 17 | +33 34 43 | 0.03 | 310. | 0.183 | ||||
| NGC 1097 Enuc. 2 | 02 46 14.4 | -30 15 03.992 | 0.19 | 0.04 | 0.06 | 482. | 7.435 | ||
| NGC 1097 | 02 46 18.984 | -30 16 28.8 | 482. | 0.020 | |||||
| NGC 1097 Enuc. 1 a | 02 46 22.557 | -30 17 29.9 | 0.21 | 482. | 5.416 | ||||
| NGC 1097 Enuc. 1 b | 02 46 22.927 | -30 17 48.1 | 0.04 | 482. | 6.817 | ||||
| NGC 1097 Enuc. 1 c | 02 46 24.062 | -30 17 50.9 | 0.21 | 0.04 | 482. | 7.392 | |||
| NGC 1266 | 03 16 00.76 | -02 25 37.1 | 1038. | 0.270 | |||||
| NGC 1377 | 03 36 38.9 | -20 54 06 | 0.06 | 0.03 | 0.06 | 835. | 0.580 | ||
| NGC 1482 | 03 54 38.966 | -20 30 07.8 | 767. | 0.124 | |||||
| NGC 2403 Enuc. 6 | 07 36 28.693 | +65 33 49.4 | 109. | 5.380 | |||||
| NGC 2403 Enuc. 1 a | 07 36 42.061 | +65 36 51.898 | 109. | 1.087 | |||||
| NGC 2403 Enuc. 1 b | 07 36 45.5 | +65 37 00.9 | 109. | 1.192 | |||||
| NGC 2403 Enuc. 2 a | 07 36 49.115 | +65 36 51.697 | 109. | 1.113 | |||||
| NGC 2403 | 07 36 50 | +65 36 04 | 0.03 | 0.02 | 0.02 | 109. | 0.000 | ||
| NGC 2403 Enuc. 2 b | 07 36 52.361 | +65 36 46.9 | 109. | 1.249 | |||||
| NGC 2403 Enuc. 4 | 07 37 18.19 | +65 33 48.1 | 109. | 3.455 | |||||
| Holmberg II | 08 19 13.058 | +70 43 08 | 104. | 0.738 | |||||
| NGC 2798 | 09 17 22.854 | +42 00 00.4 | 876. | 0.144 | |||||
| NGC 2841 | 09 22 02.668 | +50 58 35.7 | 479. | 0.155 | |||||
| NGC 2976 Enuc. 1 a | 09 47 05.192 | +67 55 51.999 | 120. | 1.420 | |||||
| NGC 2976 Enuc. 1 b | 09 47 07.64 | +67 55 54.7 | 120. | 1.201 | |||||
| NGC 2976 | 09 47 13.491 | +67 54 53.999 | 120. | 0.462 | |||||
| NGC 2976 Enuc. 2 a | 09 47 23.834 | +67 53 54.9 | 120. | 1.394 | |||||
| NGC 2976 Enuc. 2 b | 09 47 23.941 | +67 54 02.1 | 120. | 1.310 | |||||
| NGC 3049 | 09 54 49.559 | +09 16 16.1 | 652. | 0.103 | |||||
| NGC 3077 | 10 03 19.15 | +68 43 59.90 | 130. | 0.045 | |||||
| NGC 3190 | 10 18 05.643 | +21 49 55.9 | 655. | 0.098 | |||||
| NGC 3184 | 10 18 16.94 | +41 25 27 | 397. | 0.063 | |||||
| NGC 3198 | 10 19 54.986 | +45 32 59.3 | 479. | 0.116 | |||||
| IC 2574 a | 10 28 43.712 | +68 28 26.296 | 129. | 6.253 | |||||
| IC 2574 b | 10 28 48.4 | +68 28 03.5 | 129. | 5.254 | |||||
| NGC 3265 | 10 31 06.768 | +28 47 48 | 665. | 0.087 | |||||
| NGC 3351 a | 10 43 57.677 | +11 42 08 | 317. | 0.230 | |||||
| NGC 3351 b | 10 43 57.8 | +11 42 18.5 | 317. | 0.258 | |||||
| NGC 3521 Enuc. 1 | 11 05 46.3 | -00 04 08.992 | 0.07 | 380. | 9.929 | ||||
| NGC 3521 Enuc. 3 | 11 05 47.6 | +00 00 33.004 | 0.05 | 0.05 | 380. | 9.509 | |||
| NGC 3521 | 11 05 48.9 | -00 02 06 | 0.06 | 0.10 | 0.05 | 380. | 0.625 | ||
| NGC 3521 Enuc. 2 a | 11 05 49.34 | -00 03 24.2 | 380. | 4.302 | |||||
| NGC 3521 Enuc. 2 b | 11 05 49.94 | -00 03 55.9 | 0.06 | 0.06 | 380. | 6.044 | |||
| NGC 3621 | 11 18 16 | -32 48 42 | 0.04 | 0.07 | 222. | 0.348 | |||
| NGC 3627 | 11 20 15 | +12 59 29.4 | 318. | 0.028 | |||||
| NGC 3627 Enuc. 1 | 11 20 16.323 | +12 57 49.2 | 318. | 4.712 | |||||
| NGC 3627 Enuc. 2 | 11 20 16.464 | +12 58 43.4 | 318. | 2.746 | |||||
| NGC 3773 | 11 38 13.02 | +12 06 43.8 | 421. | 0.023 | |||||
| NGC 3938 b | 11 52 48.191 | +44 07 05.9 | 0.03 | 0.02 | 607. | 1.407 | |||
| NGC 3938 a | 11 52 49.5 | +44 07 14 | 0.03 | 0.02 | 0.03 | 607. | 0.140 | ||
| NGC 3938 Enuc. 2 a | 11 53 00.056 | +44 08 00 | 607. | 11.158 | |||||
| NGC 3938 Enuc. 2 b | 11 53 00.195 | +44 07 48.3 | 607. | 11.049 | |||||
| NGC 4254 Enuc. 2 a | 12 18 45.777 | +14 24 10.4 | 489. | 5.342 | |||||
| NGC 4254 Enuc. 2 b | 12 18 46.128 | +14 24 18.8 | 489. | 4.698 | |||||
| NGC 4254 a | 12 18 48.677 | +14 24 42.5 | 489. | 1.553 | |||||
| NGC 4254 b | 12 18 49.668 | +14 24 59 | 489. | 0.111 | |||||
| NGC 4254 Enuc. 1 b | 12 18 50.009 | +14 24 06.9 | 489. | 3.886 | |||||
| NGC 4254 c | 12 18 50.102 | +14 25 11.6 | 489. | 0.960 | |||||
| NGC 4254 Enuc. 1 c | 12 18 50.194 | +14 24 18.6 | 489. | 3.116 | |||||
| NGC 4254 d | 12 18 51.63 | +14 25 08.599 | 489. | 2.344 | |||||
| NGC 4254 e | 12 18 51.899 | +14 24 49.699 | 489. | 2.813 | |||||
| NGC 4254 f | 12 18 51.919 | +14 24 40.099 | 0.02 | 489. | 3.149 | ||||
| NGC 4321 Enuc. 2 a | 12 22 48.844 | +15 50 12.8 | 485. | 8.305 | |||||
| NGC 4321 Enuc. 2 b | 12 22 49.904 | +15 50 27.8 | 485. | 7.979 | |||||
| NGC 4321 Enuc. 2 | 12 22 50.652 | +15 50 27.2 | 0.03 | 0.02 | 485. | 7.285 | |||
| NGC 4321 a | 12 22 54.651 | +15 49 19.8 | 485. | 0.284 | |||||
| NGC 4321 b | 12 22 55.129 | +15 49 20.4 | 485. | 0.270 | |||||
| NGC 4321 Enuc. 1 | 12 22 58.9 | +15 49 35.003 | 0.03 | 0.02 | 0.02 | 485. | 4.520 | ||
| NGC 4536 | 12 34 27.06 | +02 11 18.2 | 492. | 0.126 | |||||
| NGC 4559 a | 12 35 56.273 | +27 57 40.5 | 237. | 1.304 | |||||
| NGC 4559 b | 12 35 56.455 | +27 57 21.3 | 237. | 1.880 | |||||
| NGC 4559 c | 12 35 58.47 | +27 57 29.7 | 237. | 0.608 | |||||
| NGC 4569 | 12 36 49.8 | +13 09 46.6 | 335. | 0.037 | |||||
| NGC 4579 | 12 37 43.518 | +11 49 05.6 | 557. | 0.105 | |||||
| NGC 4594 a | 12 39 59.42 | -11 37 23 | 308. | 0.052 | |||||
| NGC 4631 Enuc. 1 | 12 41 40.468 | +32 31 49.1 | 259. | 13.762 | |||||
| NGC 4625 | 12 41 52.4 | +41 16 24 | 0.03 | 316. | 0.139 | ||||
| NGC 4631 a | 12 42 03.433 | +32 32 17.198 | 259. | 3.189 | |||||
| NGC 4631 b | 12 42 03.978 | +32 32 15.999 | 259. | 3.435 | |||||
| NGC 4631 c | 12 42 04.31 | +32 32 25.299 | 259. | 1.734 | |||||
| NGC 4631 d | 12 42 05.093 | +32 32 10.6 | 259. | 4.988 | |||||
| NGC 4631 e | 12 42 05.568 | +32 32 29.5 | 259. | 1.387 | |||||
| NGC 4631 Enuc. 2 b | 12 42 21.988 | +32 32 45 | 259. | 6.651 | |||||
| NGC 4725 a | 12 50 26.556 | +25 30 03 | 404. | 0.044 | |||||
| NGC 4736 | 12 50 53.053 | +41 07 12.8 | 158. | 0.014 | |||||
| NGC 4736 Enuc. 1 a | 12 50 56.412 | +41 07 14.3 | 158. | 0.864 | |||||
| NGC 4736 Enuc. 1 b | 12 50 56.704 | +41 07 05 | 158. | 0.939 | |||||
| NGC 4736 Enuc. 1 c | 12 50 56.784 | +41 06 47.6 | 158. | 1.123 | |||||
| NGC 4826 | 12 56 43.556 | +21 41 00.6 | 179. | 0.055 | |||||
| NGC 5055 | 13 15 49.308 | +42 01 45.1 | 269. | 0.009 | |||||
| NGC 5055 Enuc. 1 | 13 15 58.323 | +42 00 27.4 | 269. | 5.630 | |||||
| NGC 5194 Enuc. 6 a | 13 29 39.324 | +47 08 40.7 | 259. | 12.321 | |||||
| NGC 5194 Enuc. 3 | 13 29 45.13 | +47 09 57.4 | 259. | 7.048 | |||||
| NGC 5194 Enuc. 11 a | 13 29 47.138 | +47 13 41.298 | 259. | 4.941 | |||||
| NGC 5194 Enuc. 11 b | 13 29 47.58 | +47 13 24.799 | 0.04 | 259. | 4.340 | ||||
| NGC 5194 Enuc. 11 d | 13 29 49.582 | +47 13 28.7 | 0.04 | 259. | 4.078 | ||||
| NGC 5194 Enuc. 11 c | 13 29 49.671 | +47 14 00.2 | 259. | 5.221 | |||||
| NGC 5194c | 13 29 50.022 | +47 11 31.898 | 259. | 1.804 | |||||
| NGC 5194 Enuc. 11 e | 13 29 50.642 | +47 13 44.9 | 259. | 4.633 | |||||
| NGC 5194 b | 13 29 51.64 | +47 12 06.7 | 259. | 0.977 | |||||
| NGC 5194 e | 13 29 52.553 | +47 11 52.6 | 259. | 0.365 | |||||
| NGC 5194 d | 13 29 52.729 | +47 11 40.6 | 259. | 0.092 | |||||
| NGC 5194 Enuc. 1c | 13 29 53.129 | +47 12 39.4 | 259. | 2.323 | |||||
| NGC 5194 Enuc. 4 a | 13 29 53.932 | +47 14 04.899 | 0.04 | 0.02 | 259. | 5.880 | |||
| NGC 5194 Enuc. 10 a | 13 29 55.346 | +47 10 47.199 | 259. | 2.336 | |||||
| NGC 5194 Enuc. 4c | 13 29 55.611 | +47 13 50.2 | 259. | 5.798 | |||||
| NGC 5194 a | 13 29 55.791 | +47 11 45.097 | 259. | 1.906 | |||||
| NGC 5194 Enuc. 10 b | 13 29 56.523 | +47 10 46.9 | 259. | 2.723 | |||||
| NGC 5194 Enuc. 4 d | 13 29 58.733 | +47 14 09.398 | 259. | 7.696 | |||||
| NGC 5194 Enuc. 5 a | 13 29 59.6 | +47 13 59.8 | 259. | 7.742 | |||||
| NGC 5194 Enuc. 9 | 13 29 59.782 | +47 11 12.3 | 259. | 4.131 | |||||
| NGC 5194 Enuc. 7 a | 13 30 01.029 | +47 09 28.599 | 259. | 6.221 | |||||
| NGC 5194 Enuc. 8 | 13 30 01.482 | +47 12 51.7 | 259. | 6.650 | |||||
| NGC 5194 Enuc. 7 b | 13 30 02.382 | +47 09 48.7 | 259. | 6.329 | |||||
| NGC 5194 Enuc. 7 c | 13 30 03.471 | +47 09 40.3 | 259. | 6.962 | |||||
| NGC 5398 | 14 01 20.105 | -33 04 09.2 | 260. | 1.381 | |||||
| NGC 5457 Enuc. 6 a | 14 02 28.203 | +54 16 27.2 | 227. | 15.707 | |||||
| NGC 5457 Enuc. 6 b | 14 02 29.607 | +54 16 15.799 | 227. | 15.550 | |||||
| NGC 5457 Enuc. 6 c | 14 02 30.566 | +54 16 09.798 | 227. | 15.422 | |||||
| NGC 5457 Enuc. 5 a | 14 03 01.203 | +54 14 28.4 | 227. | 13.129 | |||||
| NGC 5457 Enuc. 1 | 14 03 10.2 | +54 20 57.8 | 0.02 | 227. | 0.744 | ||||
| NGC 5457 | 14 03 12.531 | +54 20 55.2 | 227. | 0.062 | |||||
| NGC 5457 Enuc. 3 a | 14 03 38.317 | +54 18 51.398 | 0.10 | 227. | 9.307 | ||||
| NGC 5457 Enuc. 3 b | 14 03 39.894 | +54 18 56.799 | 227. | 9.655 | |||||
| NGC 5457 Enuc. 3 c | 14 03 41.437 | +54 19 04.9 | 227. | 9.964 | |||||
| NGC 5457 Enuc. 3 d | 14 03 42.912 | +54 19 24.699 | 227. | 10.113 | |||||
| NGC 5457 Enuc. 4 a | 14 03 52.036 | +54 21 52.5 | 227. | 12.149 | |||||
| NGC 5457 Enuc. 4 b | 14 03 52.997 | +54 21 57.3 | 227. | 12.453 | |||||
| NGC 5457 Enuc. 4 c | 14 03 53.203 | +54 22 06.3 | 227. | 12.540 | |||||
| NGC 5457 Enuc. 4 d | 14 03 53.993 | +54 22 10.8 | 227. | 12.795 | |||||
| NGC 5474 | 14 05 01.3 | +53 39 44 | 0.03 | 0.02 | 0.02 | 231. | 0.070 | ||
| NGC 5713 Enuc. 2 a | 14 40 10.8 | -00 17 35.5 | 726. | 1.984 | |||||
| NGC 5713 Enuc. 2 b | 14 40 10.86 | -00 17 50.2 | 726. | 3.295 | |||||
| NGC 5713 | 14 40 11.3 | -00 17 27 | 726. | 0.795 | |||||
| NGC 5713 Enuc. 1 | 14 40 11.36 | -00 17 18.2 | 726. | 0.313 | |||||
| NGC 5866 | 15 06 29.5 | +55 45 47.7 | 519. | 0.051 | |||||
| NGC 6946 Enuc. 4 c | 20 34 22.738 | +60 10 34.197 | 231. | 8.739 | |||||
| NGC 6946 Enuc. 8 | 20 34 32.28 | +60 10 19.3 | 231. | 6.122 | |||||
| NGC 6946 Enuc. 5 a | 20 34 37.155 | +60 05 10.099 | 0.03 | 0.02 | 231. | 9.239 | |||
| NGC 6946 Enuc. 5 b | 20 34 39.361 | +60 04 52.4 | 231. | 9.704 | |||||
| NGC 6946 Enuc. 3 a | 20 34 49.865 | +60 12 40.699 | 231. | 7.742 | |||||
| NGC 6946 Enuc. 3 b | 20 34 52.24 | +60 12 43.7 | 231. | 7.729 | |||||
| NGC 6946 b | 20 34 52.26 | +60 09 14.3 | 231. | 0.016 | |||||
| NGC 6946 Enuc. 6 b | 20 35 06.965 | +60 10 46.5 | 231. | 4.728 | |||||
| NGC 6946 Enuc. 9 | 20 35 11.086 | +60 08 57.45 | 231. | 5.071 | |||||
| NGC 6946 Enuc. 7 | 20 35 12.974 | +60 08 50.55 | 231. | 5.637 | |||||
| NGC 6946 Enuc. 1 | 20 35 16.801 | +60 11 00 | 231. | 6.989 | |||||
| NGC 7331 | 22 37 04.1 | +34 24 56 | 0.07 | 492. | 0.000 | ||||
| NGC 7793 Enuc. 1 | 23 57 48.8 | -32 36 57.991 | 0.07 | 133. | 2.574 | ||||
| NGC 7793 Enuc. 3 | 23 57 48.8 | -32 34 51.995 | 0.08 | 133. | 1.016 | ||||
| NGC 7793 a | 23 57 49.2 | -32 35 24 | 133. | 0.174 | |||||
| NGC 7793 b | 23 57 49.58 | -32 35 25.6 | 133. | 0.081 | |||||
| NGC 7793 Enuc. 2 | 23 57 56.1 | -32 35 40 | 0.04 | 0.02 | 0.04 | 133. | 1.526 | ||
| Likely Associated with Supernovae | |||||||||
| NGC 6946 Enuc. 6 a | 20 35 06.08 | +60 10 58.5 | 231. | 4.855 | |||||
| Likely AME Candidates | |||||||||
| NGC 2403 Enuc. 5 | 07 36 19.839 | +65 37 05.5 | 109. | 3.464 | |||||
| NGC 2403 Enuc. 3 | 07 37 06.948 | +65 36 39 | 109. | 2.811 | |||||
| NGC 4254 Enuc. 1 a | 12 18 49.203 | +14 23 57.9 | 489. | 4.428 | |||||
| NGC 4631 f | 12 42 06.256 | +32 32 31.9 | 259. | 1.566 | |||||
| NGC 4631 g | 12 42 07.466 | +32 32 31.599 | 259. | 0.960 | |||||
| NGC 4631 h | 12 42 08.059 | +32 32 34.899 | 259. | 1.769 | |||||
| NGC 4631 Enuc. 2 a | 12 42 21.419 | +32 33 06.3 | 259. | 9.974 | |||||
| NGC 4725 b | 12 50 28.484 | +25 30 21.899 | 404. | 1.921 | |||||
| NGC 5194 Enuc. 2 | 13 29 44.1 | +47 10 23.4 | 259. | 6.834 | |||||
| NGC 5194 Enuc. 1 a | 13 29 49.508 | +47 12 40.296 | 259. | 2.534 | |||||
| NGC 5194 Enuc. 1 b | 13 29 52.07 | +47 12 43.6 | 259. | 2.322 | |||||
| NGC 5194 Enuc. 4 b | 13 29 55.493 | +47 14 01.6 | 259. | 6.193 | |||||
| NGC 5457 Enuc. 2 | 14 02 55 | +54 22 27.5 | 227. | 6.451 | |||||
| NGC 5457 Enuc. 7 | 14 04 29.334 | +54 23 47.6 | 227. | 23.861 | |||||
| NGC 6946 Enuc. 4 a | 20 34 19.842 | +60 10 06.6 | 231. | 9.044 | |||||
| NGC 6946 Enuc. 4 b | 20 34 21.41 | +60 10 17.699 | 231. | 8.801 | |||||
| NGC 6946 a | 20 34 51.295 | +60 09 39.2 | 231. | 1.004 | |||||
| NGC 6946 c | 20 34 52.742 | +60 09 30.5 | 231. | 0.601 | |||||
| NGC 6946 Enuc. 2 a | 20 35 23.572 | +60 09 48.899 | 231. | 8.120 | |||||
| NGC 6946 Enuc. 2 b | 20 35 25.381 | +60 09 58.8 | 231. | 8.595 | |||||
4 Results
Using the 3, 15, and 33 GHz photometry, along with the 8 m imaging from Spitzer, we classify each region as either a star-forming region (SF), a background galaxy candidate (BG), a likely supernova remnant (SNe/R: see Section 5.4), or an anomalous microwave emission candidate (AME: see Section 5.5). In total we have identified 320 star-forming regions, 14 likely background galaxies, 10 likely supernovae/supernova remnants, and 33 AME candidates. Given that we are primarily interested in emission arising from our sample galaxies, the potential background galaxies have been removed from all plots, and are discussed as a separate population of sources in Section 5.3. Regions identified at 7″ which include emission from potential AME and SNe/R candidates are correspondingly classified in Table 5.
We present results for the spectral index and thermal fraction distributions only including regions identified in the SFRS that have a measured in at least two radio bands. This ensures that our fit results are not biased by single detections at one frequency, and allows us to make accurate comparisons with the regions identified in M18a, for which a detection at 33 GHz was required. This requirement removes 4 likely background galaxies, 4 likely supernova remnants, and 34 star-forming regions. These single-band detections are distributed almost uniformly across all three frequency bands: 19, 11, and 12 at 3, 15, and 33 GHz, respectively. Accordingly, in the sample used to study the radio spectral indices and thermal fractions, we have retained 335 (286 SF, 10 BG, 6 SNe/R, and 33 AME) of the 377 sources with a statistically significant detection in at least one band. The median of these 335 sources is 18, 15, and 9 for detections at 3, 15, and 33 GHz, respectively.
We apply the same criteria for sources included in the spectral index and thermal fraction analysis using the 7″ smoothed images. This removes 17 star-forming regions. These single-band detections are also distributed uniformly across all three bands: 7, 4, and 6 at 3, 15, and 33 GHz, respectively. Accordingly, we have retained 163 (142 SF, 0 BG, 1 SNe/R, and 20 AME) of the 180 sources with a statistically significant detection in at least one band. The median of these 163 sources is 24, 23, and 19 for detections at 3, 15, and 33 GHz, respectively.
4.1 Spectral Indices
The simplest approach to modeling the radio spectra of galaxies is by adopting a two-component power-law, with the thermal/nonthermal ratio as well as the non-thermal spectral index allowed to vary as free parameters. For many star-forming galaxies in the local Universe, this model adequately describes the dominant physical processes occurring at radio frequencies (Condon, 1992). However, a robust interpretation of the radio spectrum can be complex. For example: the thermal and nonthermal fractions may vary with galaxy mass (e.g. Hughes et al., 2007; Bell, 2003), the nonthermal index can vary within galaxies (Tabatabaei et al., 2017), and AME may add an additional component to the radio spectra at high frequencies in some regions (e.g. Murphy et al., 2010, 2018b).
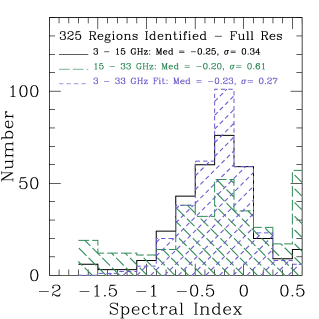
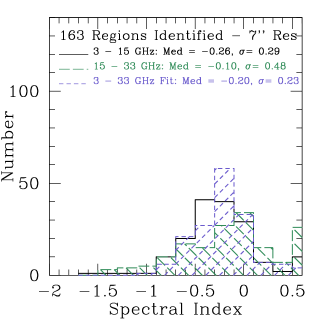
To measure the GHz spectral indices, we performed a linear least-squares fit to the data with a single power-law representing the combination of thermal and nonthermal emission. The distributions of the measured spectral slopes with the 10 likely background galaxies removed are given in the top panel of Figure 2 (325 total regions). The median spectral indices we measure from , , and GHz are , , and , respectively. The median absolute deviation of these distributions is 0.34, 0.61, and 0.27 respectively. Interestingly, we do not see particularly steep spectral indices from GHz, indicating that the contribution of non-thermal emission to the radio flux density of individual star-forming regions is marginal on pc scales in these galaxies. This is consistent with the results presented in Murphy et al. (2012), where they show that the thermal fraction at 33 GHz increased as function of decreasing linear resolution. Despite the relatively flat spectral slopes from GHz, we do see evidence that the spectrum continues to flatten from GHz, on average. This is consistent with expectations for star-forming regions, where the radio spectrum is synchrotron-dominated at low frequencies, and flattens at higher frequencies as the contribution of thermal emission increases (Condon et al., 2012; Clemens et al., 2010; Murphy et al., 2013). Finally, we do not see any significant evidence for free-free absorption, which is known to affect the compact central regions of local star-forming and starburst galaxies, and would result in steep spectral indices even at high frequencies (Condon & Yin, 1990; Clemens et al., 2008; Murphy et al., 2013).
In the nearby Universe, the typical radio spectrum of normal star-forming galaxies is well-described by a power-law spectrum with a spectral index of , and a thermal fraction of at 1 GHz (Klein et al., 1988; Condon & Yin, 1990), whereas studies of local luminous infrared galaxies (LIRGs) find a flat spectrum around 1 GHz and a steepening spectrum above 10 GHz (Clemens et al., 2008; Leroy et al., 2011; Murphy et al., 2013). New high-resolution observations of a large sample of LIRGs in the Great Observatories All-Sky LIRG Survey (GOALS) have revealed that the steep spectrum seen in highly star-forming galaxies are attributed solely to the nucleus, and that in extranuclear regions the spectral shape is typical of the star-forming regions identified in this study (Linden et al., 2019).
4.2 Thermal Fractions
Given the results above, we now calculate the thermal fraction of each region by using the spectral index, measured in Section 4.1, from GHz () to set the lower-limit on the nonthermal spectral index () such that if , and if . A constant nonthermal radio spectral index of is assumed based on the average non-thermal spectral index found among the 10 star-forming regions studied in NGC 6946 by Murphy et al. (2011). Furthermore, this value is consistent with the results of Niklas & Beck (1997, i.e., with a scatter of ) for a sample of 74 nearby galaxies. Finally, we adopt a single power-law exponent for the free-free emission (), and use the fit from 3 to 33 GHz to set the overall radio spectral index. Then, using the prescription in Klein et al. (1984), we can calculate the thermal fraction at 33 GHz such that,
| (1) |
where is the target frequency (33 GHz), is the observed slope from 3 to 33 GHz, and is the nonthermal spectral index. In the top Panel of Figure 3 we show the resulting thermal fractions of the star-forming regions in our sample using the empirically measured values from Equation 1. We find that the median value is with a median absolute deviation of . This demonstrates that we can reliably use the 33 GHz flux density to infer the total free-free emission, and thus current star formation activity, on the scales of individual Hii and star-forming regions. While this result had been suggested by our previous GBT and VLA campaigns (e.g., Murphy et al., 2011, 2012, 2018a), this is the first measurement of the 33 GHz thermal fraction based on the shape of the radio spectrum at these frequencies and spatial scales in nearby galaxies.
Further, by restricting our analysis such that we remove all non-SF regions, all apertures containing multiple smaller individual regions, and require pc (238 regions), we mitigate contamination from any central AGN and can determine broad population statistics for extragalactic Hii regions using our cleanest sample of extranuclear star-forming regions. In Figure 4 we find that the median thermal fraction is with a median absolute deviation of . This value is consistent with the results presented in Figures 2, and 3, and confirms that supernova remnants, ultra-compact Hii regions, and/or AME candidates do not bias our results.
Finally, we measure the thermal fraction at 33 GHz for 163 regions identified at 7″ resolution in M18a to be % with a median absolute deviation of . This result is consistent with the measurements at 2” and confirms that free-free emission dominates the radio spectra of star-forming regions on scales up to 500pc. Further, when we apply the same radial cut (i.e., pc) and remove all non-SF regions, retaining 111/163 regions, the median thermal fraction at 33 GHz is with a median absolute deviation of . Thus, it is clear that regardless of the size of the photometric apertures used, isolating extranuclear SF regions in nearby galaxies results in a higher thermal fraction at 33 GHz and a smaller median absolute deviation in the overall distribution.
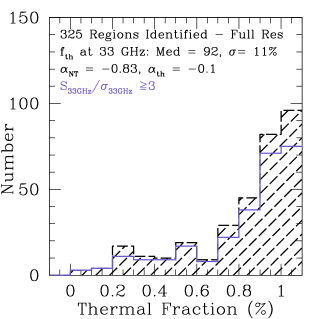
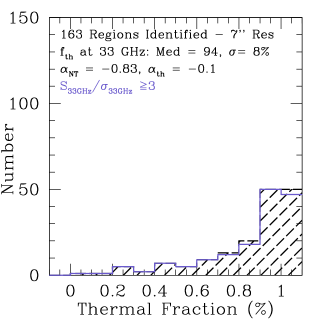


4.3 MCMC Parameter Estimation
From Equation 1 it is clear that reliable estimates for the 33 GHz thermal fraction are sensitive to the value adopted for the nonthermal spectral index (). While the median GHz spectral index observed for our sample is well below the canonical value (i.e., ), degeneracies may still exist between and . In this case classical fitting methods may underestimate the true uncertainties associated with modeling the radio spectrum as a two-component power-law [i.e., ]. Here, we explore whether the marginalized posterior distributions from a Monte-Carlo Markov Chain (MCMC) analysis better reflect the uncertainties associated with this decomposition (Hogg et al., 2010).
For this exercise, we use the Python package emcee (Foreman-Mackey et al., 2013) to generate posterior probability distributions for each of the fitted parameters (, , and ) given the typical ratio of our three-band observations. Following Westcott et al. (2018), we parameterize our two-component power-law model at a reference frequency of 1 GHz to avoid dependencies in frequency space. Further, we adopt a gaussian probability distribution function for the nonthermal spectral index whose mean and standard deviation are consistent with the values obtained in Niklas & Beck (1997). Finally, we make a slight modification to Equation 9 presented in Westcott et al. (2018),
| (2) |
such that H is equal to 1 when the values of A and B are greater than zero. This is done in order to constrain the nonthermal spectral index, thermal fraction, and normalization constants of each component simultaneously. We make 1000 realizations of this model at three different ratios (5, 10, and 50) by randomly selecting a nonthermal spectral index () and vales of A(B) [], to represent the typical variance in the values observed for our sample.
In Figure 5 we plot the relative difference in the input and output thermal fraction as a function of the input nonthermal spectral index. For a fixed per region of 10, and with only three data points, our MCMC modeling can recover the input nonthermal spectral index to within 1 for . Importantly, we find that the best-constrained spectra have nonthermal indices very close to the fixed-value adopted for our -minimization (). This result demonstrates that adopting fixed values for the does not introduce systematic biases into the derived 33 GHz thermal fractions, over a reasonable set of input conditions for our two-component power-law model. This is an important result for calibrations of the total star-formation rate, which rely on using the observed radio continuum (Murphy et al., 2011, 2012).
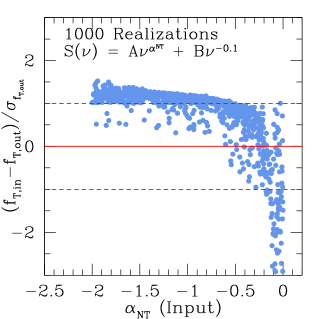
5 Discussion
5.1 Trends with Galactocentric Radius
Following the same procedure as M18a, we use the measured position angle (PA) and inclination of each galaxy to convert the angular separation of each star-forming region from the nucleus into a de-projected galactocentric radius (). In M18a we found that the median 33 GHz continuum-to-H line flux ratio was statistically larger within pc relative to the outer disk regions by a factor of , while the ratio of 33 GHz-to-24m flux densities is lower by a factor of . Such a situation may arise if the circumnuclear regions of these galaxies have extended star formation histories in which star formation that has taken place over a longer period of time, resulting in an accumulation of young dust-heating stars in addition to much older bulge stars that boost the 24 m flux density relative to what is seen in the extranuclear regions. This is largely opposite to what we would expect if there was an additional nonthermal component powering the 33 GHz emission in the central regions of these galaxies, unless the excess dust-heating at 24 m far exceeds any additional nonthermal emission contribution at 33 GHz.
Therefore, these results suggested that the larger ratio of 33 GHz flux density to H line flux found in the central regions of these galaxies may primarily arise from increased extinction. We can now test this picture for 325 discrete regions (background galaxies removed) with detailed radio spectral fitting and thermal fraction estimates, which do not suffer from the effects of variable dust extinction in galaxies. In Figure 6 it is clear that the overall dispersion in the measured spectral index and thermal fraction at 33 GHz increases significantly for regions that lie within the 250 pc galactocentric radius cut used in M18a to distinguish extranuclear from nuclear/circumnuclear star-forming regions. In fact, limiting the analysis to sources with pc results in a value for the median 33 GHz thermal fraction of with a median absolute deviation of 18% relative to with a median absolute deviation of 11% for regions with pc. Additionally, the scatter of the thermal fraction distribution increases by nearly a factor of 2 within pc. This confirms that while extinction may play a role in driving the previously seen correlations, excess nonthermal emission is indeed present in many of the circumnuclear star-forming regions observed in the SFRS.
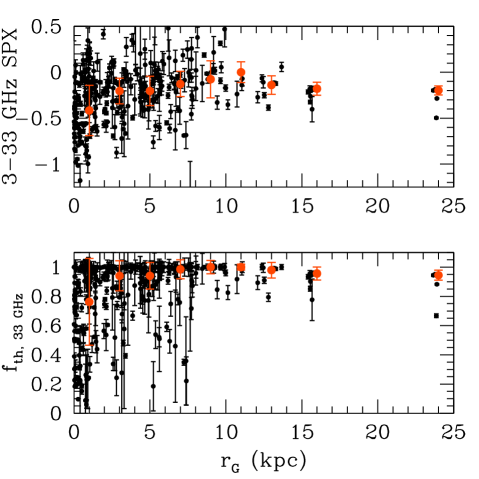
5.2 Model Age Fitting
By making use of differences in the timescales associated with thermal (free-free) and synchrotron emission, we can place estimates on the age of star-forming regions by examining how these processes affect the radio spectral indicex from GHz. Since free-free emission is directly associated with ionizing photons that are only produced by the shortest-lived ( Myr) massive stars, its presence in large quantities relative to synchrotron emission is indicative of very young star formation.
To better-quantify these different timescales, we use a Starburst 99 (SB99) model of a single instantaneous burst with default inputs (solar metallicity and 2-component Kroupa IMF) run for 1 Gyr (Leitherer et al., 1999). However, in order to take into account the fact that at the median physical scales we are probing, ( pc), a single, instantaneous starburst may not be representative, we also include SB99 models with a continuous star formation history of SFR = yr-1 using the same metallicity and IMF input as in the instantaneous burst model (Figure 7 - Left Panel). The details of these models, and their application to extranuclear star-forming regions identified in LIRGs is presented in Linden et al. (2019).
For both models we then perform a minimization to the observed spectral indices for each star-forming region in the sample. We stress that without including cosmic-ray propagation, which will affect the relative ratio of free-free and non-thermal emission on these scales, this exercise is simply meant to understand how the observed distribution of spectral indices can be represented as a distribution of ages. In the left panel of Figure 7 it is clear that our models are insensitive to Hii regions with ages Myr and Myr. However, in the intermediate age range we find that a typical uncertainty of on the observed spectral index corresponds to a dex uncertainty in age. Therefore while the age of any individual region may be uncertain, the increase in the number of young ( Myr) relative to old ( Myr) star-forming regions is robust.
The right panel of Figure 7 shows the distribution of fitted ages for the instantaneous burst model in blue and the continuous model in green. Overall, we find that the majority () of our regions are best-modeled by a continuous burst, with a median age of Myr (grey distribution). Further we find that when all regions are modeled using a continuous SFH, an age-gradient emerges in Figure 6. At small , the regions with low thermal fractions, which drive the observed scatter, are preferentially older ( Myr). This further supports the notion that the central star-forming regions are, on average, older, and that the associated cosmic ray population in the inner disk of these galaxies is being continuously replenished by ongoing star-formation.
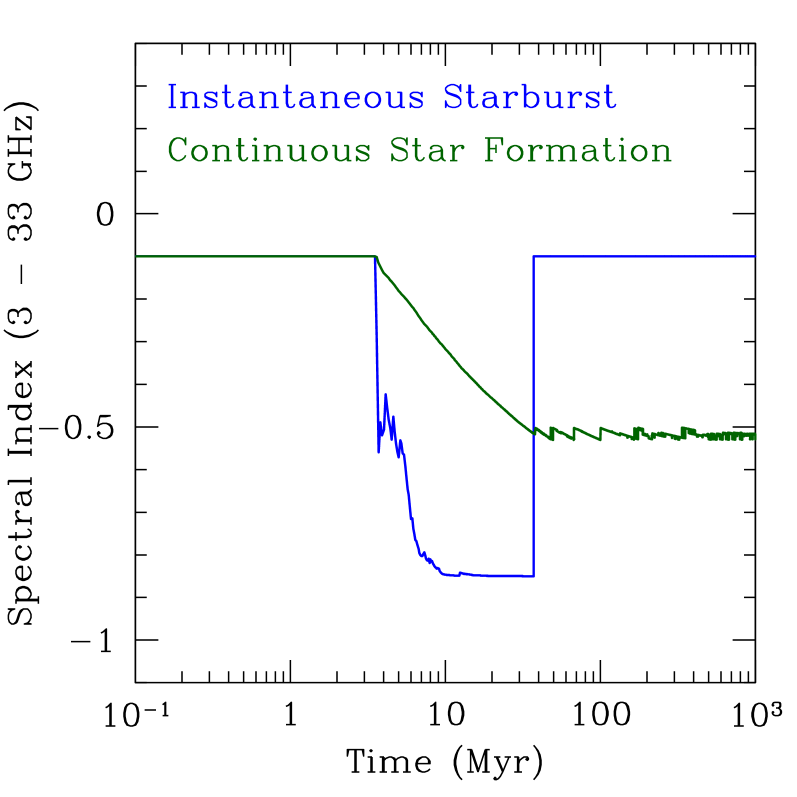
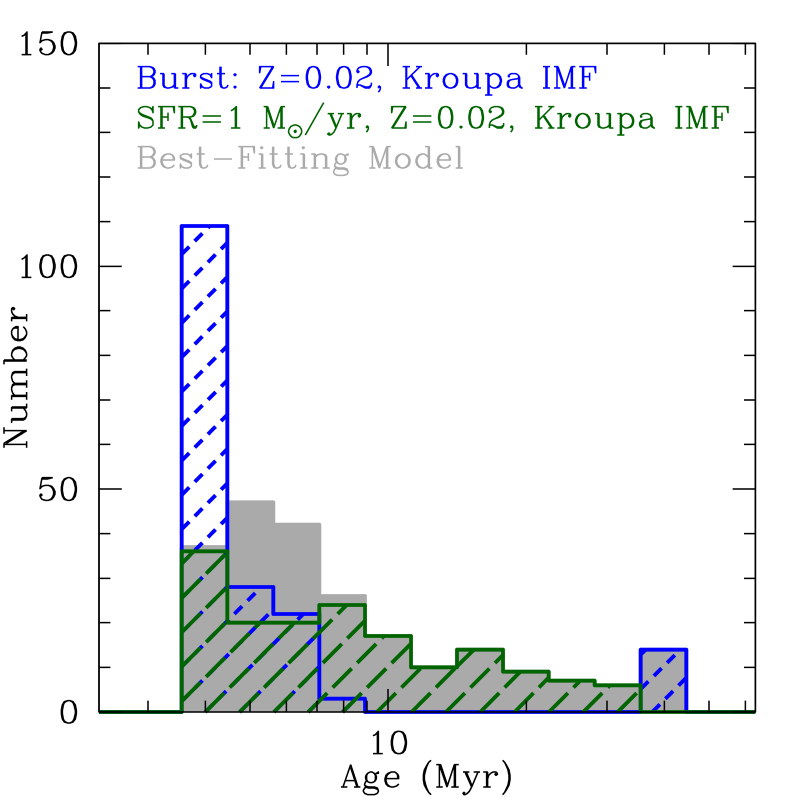
5.3 Likely Background Galaxies
For the 10 likely background sources (BG) identified (i.e. sources with no obvious 8 m counterpart), which have a in at least two radio bands, the median GHz spectral index is with a median absolute deviation of 0.3. This value is significantly steeper than the average value measured for the SF regions, and indicates that these sources are primarily dominated by synchrotron emission. This result further suggests that our visual classification scheme involving both radio and near-IR imaging appears to be an effective discriminator for various types of radio sources in surveys of nearby galaxies. Finally, a cross-reference with NED suggests that none of these sources have been previously identified in the literature.
5.4 Supernova and Supernova Remnants
In order to identify possible supernova remnants, we cross-correlated our sample of 377 regions against the Open Supernova Catalog (OSC: Guillochon et al., 2017). In total we identify 6 sources as being spatially coincident (within ) to an identified radio source with a in at least two radio bands. The GHz spectral slopes measured are uniformly distributed from to 0.5. This scatter is likely driven by SNe/R at various stages of their evolution, and therefore a large range in the degree of energy loss of the CRs as they propagate through the ISM. For one region identified in NGC 7331, the measured 15 GHz flux density is larger by over an order of magnitude due to a supernova, SN2014C, which was discovered in January of 2014, between the time our 3 and 15 GHz observations of this source were taken (Shivvers et al., 2019).
5.5 Anomalous Microwave Emission
Anomalous Microwave Emission (AME) is a known dust-correlated component of Galactic emission that has been detected by cosmic microwave background (CMB) experiments and other radio/microwave instruments at frequencies GHz since the mid-1990s (see Dickinson et al., 2018, and articles within for recent reviews). AME is found to be spatially correlated with far-infrared thermal dust emission, but cannot be explained by synchrotron, or free-free emission mechanisms, and is far in excess of the emission contributed by thermal dust with the power-law opacity consistent with observations at sub-mm wavelengths. The most natural explanation for AME is rotational (electric dipole) emission from ultra-small dust grains (i.e., ‘spinning dust’: Erickson, 1957; Draine & Lazarian, 1998). The emission forms part of the diffuse Galactic foregrounds that contaminate CMB data, which operate in the frequency range GHz, and hence knowledge of the spatial structure and spectral shape can inform CMB component separation. However, spinning dust emission depends critically on the dust grain size distribution, the type of dust, and the environmental conditions (density, temperature, interstellar radiation field, etc.). Thus, precise measurements of AME can also provide a new window into the ISM, complementing other multiwavelength tracers.
A number of searches for extragalactic AME have been undertaken with WMAP and Planck data (e.g., the Magellanic Clouds and NGC4945: Bot et al., 2010; Peel et al., 2011), all of which were inconclusive. Most recently, we have identified two additional detections of AME in the SFRS sample as having anomalously high 33 GHz-to-m flux ratios (NGC 6946 E4 and NGC 4725 B: Murphy et al., 2010, 2018b). NGC 4725 B in particular appears consistent with a highly-embedded ( mag) nascent star-forming region, in which young ( Myr) massive stars are still enshrouded by their natal cocoons of gas and dust, lacking enough supernova to produce synchrotron emission.
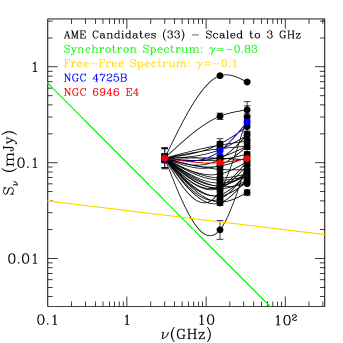
While it is possible that NGC 4725 B and NGC 6946 E4 represent the most favorable conditions for AME detection, there are likely remaining regions in the SFRS that still harbor AME at a lower level relative to the other emission components (Hensley et al., 2015). Isolating the factors that govern the level of AME in these regions will lend insight into the physical mechanisms powering this emission as well as the nature of its carriers. In particular, we have observed that a common feature among both detections thus far is a shallow or even rising spectra from 3 - 33 GHz, as the contribution from AME increases and eventually dominates beyond GHz. These regions can be identified as having elevated 33 GHz emission relative to the expected extrapolation from lower-frequency radio data using a standard two-component power law.
By measuring the and GHz spectral indices, we made an initial selection of 58 extragalactic AME candidates as regions that have an 8m counterpart, a in at least 2 radio bands, a de-projected galactocentric radius of pc, and a measured spectral slope that is above the canonical value expected for free-free emission. This represents a conservative upper-limit to identify regions by assuming that the non-thermal synchrotron emission is negligible at 33 GHz, and thus does not contribute to the measured slope from GHz. This assumption is well-supported here for our full spectral analysis of over 300 star-forming regions identified in the SFRS, which show that the median thermal fraction measured at 33 GHz on a few pc scales is . We then visually inspected all 58 AME candidates, only retaining 33 regions where the emission was found to be compact, similar to the previously identified extragalactic AME sources. This is done to ensure that any differences in surface brightness sensitivity between our observations would not result in diffuse emission with an artificially flattened spectrum, which is unassociated with an individual source. Our final requirement removes 4 sources (NGC 4254 Enuc. 1 B, NGC 3521 Enuc. 1, NGC 4736 N, and NGC 7331 D), which have very steeply rising 3-15 GHz spectral slopes, but are undetected at 33 GHz, and therefore are not confidently identified as AME candidates.
In Figure 8 we plot the GHz spectrum of the 33 AME candidate regions normalized to the highest measured 3 GHz flux density. Viewed in this way we see that many of our AME candidates, similar to NGC 4725 B, have shallow or slightly negative slopes from GHz, and a much steeper positive slope from GHz. However, there are some regions which look more similar to NGC 6946 Enuc 4., which have steeper GHz slopes and a less significant increase from GHz. Importantly, these spectra cannot be explained by a simple combination of synchrotron (green) and free-free (yellow) emission components, suggesting that either an additional emission component peaking at GHz is required (e.g., AME), it is a (very) high-frequency GHz-peaked background galaxy, or the source is variable. A final possibility is that the free-free emission is optically-thick at 33 GHz. However, such ‘ultra-compact’ Hii regions have much higher radio luminosities and SFRs ( mJy) then the regions identified here (e.g., Meier et al., 2002).
6 Conclusions
We have presented 3, 15, and 33 GHz imaging towards galaxy nuclei and extranuclear star-forming regions in the SFRS, and have identified 335 regions (286 SF, 10 BG, 6 SNe/R, and 33 AME) with in at least two radio bands. Through detailed measurements of their radio spectra we have confirmed that:
-
1.
The average local background contribution to the measured 3, 15, and 33 GHz flux densities on pc scales is . This is significantly smaller than the found for the sample of regions studied at (kpc) scales with the GBT (Murphy et al., 2011).
-
2.
On 100 pc scales, the median thermal fraction at 33 GHz of all regions identified as non-background galaxies is with a median absolute deviation of . Limiting our analysis to extranuclear (pc) SF regions, we measure a median thermal fraction of with a median absolute deviation of . Further, we find that on 7″ scales the median thermal fraction is , and thus the thermal fraction remains up to pc scales.
-
3.
We have confirmed through MCMC analysis that we do not introduce systematic biases when interpreting the results of the -minimization of a two-component power-law model to fit the observed radio spectrum from GHz, and that this model can adequately separate the thermal free-free and nonthermal synchrotron emission components over a realistic range of input values.
-
4.
We find a systematic increase in the scatter of the measured spectral indices and thermal fractions as the de-projected galactocentric radius approaches the nucleus. This trend is reflective of the ongoing star-formation activity occurring in centers of these galaxies, and results in a larger contribution of diffuse nonthermal emission.
-
5.
We have identified a sample of 33 sources whose rising GHz emission may be due to anomalous microwave emission. Follow-up observations at high ( GHz) frequencies will be necessary to confirm these sources as discrete regions of extragalactic AME.
References
- Aniano et al. (2011) Aniano, G., Draine, B. T., Gordon, K. D., & Sandstrom, K. 2011, PASP, 123, 1218
- Bell (2003) Bell, E. F. 2003, ApJ, 586, 794
- Bot et al. (2010) Bot, C., Ysard, N., Paradis, D., et al. 2010, A&A, 523, A20
- Ciardullo et al. (2002) Ciardullo, R., Feldmeier, J. J., Jacoby, G. H., et al. 2002, ApJ, 577, 31
- Clemens et al. (2010) Clemens, M. S., Scaife, A., Vega, O., & Bressan, A. 2010, MNRAS, 405, 887
- Clemens et al. (2008) Clemens, M. S., Vega, O., Bressan, A., et al. 2008, A&A, 477, 95
- Condon (1992) Condon, J. J. 1992, ARA&A, 30, 575
- Condon & Yin (1990) Condon, J. J., & Yin, Q. F. 1990, ApJ, 357, 97
- Condon et al. (2012) Condon, J. J., Cotton, W. D., Fomalont, E. B., et al. 2012, ApJ, 758, 23
- Conway et al. (1990) Conway, J. E., Cornwell, T. J., & Wilkinson, P. N. 1990, MNRAS, 246, 490
- Cornwell (2008) Cornwell, T. J. 2008, IEEE Journal of Selected Topics in Signal Processing, 2, 793
- Dale et al. (2007) Dale, D. A., Gil de Paz, A., Gordon, K. D., et al. 2007, ApJ, 655, 863
- Dale et al. (2009) Dale, D. A., Cohen, S. A., Johnson, L. C., et al. 2009, ApJ, 703, 517
- de Jong et al. (1985) de Jong, T., Klein, U., Wielebinski, R., & Wunderlich, E. 1985, A&A, 147, L6
- de Vaucouleurs et al. (1991) de Vaucouleurs, G., de Vaucouleurs, A., Corwin, Herold G., J., et al. 1991
- Dickinson et al. (2018) Dickinson, C., Ali-Haïmoud, Y., Barr, A., et al. 2018, New A Rev., 80, 1
- Draine (2003) Draine, B. T. 2003, ARA&A, 41, 241
- Draine & Lazarian (1998) Draine, B. T., & Lazarian, A. 1998, ApJ, 508, 157
- Engelbracht et al. (2008) Engelbracht, C. W., Rieke, G. H., Gordon, K. D., et al. 2008, ApJ, 678, 804
- Erickson (1957) Erickson, W. C. 1957, ApJ, 126, 480
- Foreman-Mackey et al. (2013) Foreman-Mackey, D., Hogg, D. W., Lang, D., & Goodman, J. 2013, PASP, 125, 306
- Freedman et al. (2001) Freedman, W. L., Madore, B. F., Gibson, B. K., et al. 2001, ApJ, 553, 47
- Green (2011) Green, D. A. 2011, Bulletin of the Astronomical Society of India, 39, 289
- Guillochon et al. (2017) Guillochon, J., Parrent, J., Kelley, L. Z., & Margutti, R. 2017, ApJ, 835, 64
- Heesen et al. (2014) Heesen, V., Brinks, E., Leroy, A. K., et al. 2014, AJ, 147, 103
- Helou et al. (1985) Helou, G., Soifer, B. T., & Rowan-Robinson, M. 1985, ApJ, 298, L7
- Hensley et al. (2015) Hensley, B., Murphy, E., & Staguhn, J. 2015, MNRAS, 449, 809
- Hogg et al. (2010) Hogg, D. W., Bovy, J., & Lang, D. 2010, arXiv e-prints, arXiv:1008.4686
- Hughes et al. (2007) Hughes, A., Staveley-Smith, L., Kim, S., Wolleben, M., & Filipović, M. 2007, MNRAS, 382, 543
- Jarrett et al. (2003) Jarrett, T. H., Chester, T., Cutri, R., Schneider, S. E., & Huchra, J. P. 2003, AJ, 125, 525
- Kennicutt et al. (2011) Kennicutt, R. C., Calzetti, D., Aniano, G., et al. 2011, PASP, 123, 1347
- Kennicutt et al. (2003) Kennicutt, Jr., R. C., Armus, L., Bendo, G., et al. 2003, PASP, 115, 928
- Klein et al. (1984) Klein, U., Wielebinski, R., & Beck, R. 1984, A&A, 135, 213
- Klein et al. (1988) Klein, U., Wielebinski, R., & Morsi, H. W. 1988, A&A, 190, 41
- Koyama et al. (1995) Koyama, K., Petre, R., Gotthelf, E. V., et al. 1995, Nature, 378, 255
- Lacki & Thompson (2010) Lacki, B. C., & Thompson, T. A. 2010, ApJ, 717, 196
- Lacki et al. (2010) Lacki, B. C., Thompson, T. A., & Quataert, E. 2010, ApJ, 717, 1
- Leitherer et al. (1999) Leitherer, C., Schaerer, D., Goldader, J. D., et al. 1999, ApJS, 123, 3
- Leroy et al. (2011) Leroy, A. K., Evans, A. S., Momjian, E., et al. 2011, ApJ, 739, L25
- Leroy et al. (2012) Leroy, A. K., Bigiel, F., de Blok, W. J. G., et al. 2012, AJ, 144, 3
- Linden et al. (2019) Linden, S. T., Song, Y., Evans, A. S., et al. 2019, ApJ, 881, 70
- Lonsdale Persson & Helou (1987) Lonsdale Persson, C. J., & Helou, G. 1987, ApJ, 314, 513
- McMullin et al. (2007) McMullin, J. P., Waters, B., Schiebel, D., Young, W., & Golap, K. 2007, in Astronomical Society of the Pacific Conference Series, Vol. 376, Astronomical Data Analysis Software and Systems XVI, ed. R. A. Shaw, F. Hill, & D. J. Bell, 127
- Meier et al. (2002) Meier, D. S., Turner, J. L., & Beck, S. C. 2002, AJ, 124, 877
- Moustakas et al. (2010) Moustakas, J., Kennicutt, Jr., R. C., Tremonti, C. A., et al. 2010, ApJS, 190, 233
- Murphy et al. (2018a) Murphy, E. J., Dong, D., Momjian, E., et al. 2018a, ApJS, 234, 24
- Murphy et al. (2018b) Murphy, E. J., Linden, S. T., Dong, D., et al. 2018b, ApJ, 862, 20
- Murphy et al. (2013) Murphy, E. J., Stierwalt, S., Armus, L., Condon, J. J., & Evans, A. S. 2013, ApJ, 768, 2
- Murphy et al. (2006) Murphy, E. J., Braun, R., Helou, G., et al. 2006, ApJ, 638, 157
- Murphy et al. (2010) Murphy, E. J., Helou, G., Condon, J. J., et al. 2010, ApJ, 709, L108
- Murphy et al. (2011) Murphy, E. J., Condon, J. J., Schinnerer, E., et al. 2011, ApJ, 737, 67
- Murphy et al. (2012) Murphy, E. J., Bremseth, J., Mason, B. S., et al. 2012, ApJ, 761, 97
- Niklas & Beck (1997) Niklas, S., & Beck, R. 1997, A&A, 320, 54
- Peel et al. (2011) Peel, M. W., Dickinson, C., Davies, R. D., Clements, D. L., & Beswick, R. J. 2011, MNRAS, 416, L99
- Perley & Butler (2013) Perley, R. A., & Butler, B. J. 2013, ApJS, 204, 19
- Rau & Cornwell (2011) Rau, U., & Cornwell, T. J. 2011, A&A, 532, A71
- Sault & Wieringa (1994) Sault, R. J., & Wieringa, M. H. 1994, A&AS, 108, 585
- Schlegel et al. (1998) Schlegel, D. J., Finkbeiner, D. P., & Davis, M. 1998, ApJ, 500, 525
- Seibert (2007) Seibert, M. 2007, The Galex Large Galaxy Atlas (glga), GALEX Proposal
- Shivvers et al. (2019) Shivvers, I., Filippenko, A. V., Silverman, J. M., et al. 2019, MNRAS, 482, 1545
- Tabatabaei et al. (2017) Tabatabaei, F. S., Schinnerer, E., Krause, M., et al. 2017, ApJ, 836, 185
- Weingartner & Draine (2001) Weingartner, J. C., & Draine, B. T. 2001, ApJ, 548, 296
- Westcott et al. (2018) Westcott, J., Brinks, E., Hindson, L., Beswick, R., & Heesen, V. 2018, MNRAS, 475, 5116
| Source ID | Å) | Å) | ||
|---|---|---|---|---|
| (Jy) | (Jy) | (erg s-1 cm-2) | (mJy) | |
| Star-Forming Regions | ||||
| NGC 0337 a | ||||
| NGC 0337 b | ||||
| NGC 0337 c | ||||
| NGC 0337 d | ||||
| NGC 0628 Enuc. 4 | ||||
| NGC 0628 Enuc. 2 | ||||
| NGC 0628 Enuc. 3 | ||||
| NGC 0628 | ||||
| NGC 0628 Enuc. 1 | ||||
| NGC 0855 | ||||
| NGC 0925 | ||||
| NGC 1097 Enuc. 2 | ||||
| NGC 1097 | ||||
| NGC 1097 Enuc. 1 a | ||||
| NGC 1097 Enuc. 1 b | ||||
| NGC 1097 Enuc. 1 c | ||||
| NGC 1266 | ||||
| NGC 1377 | ||||
| NGC 1482 | ||||
| NGC 2403 Enuc. 6 | ||||
| NGC 2403 Enuc. 1 a | ||||
| NGC 2403 Enuc. 1 b | ||||
| NGC 2403 Enuc. 2 a | ||||
| NGC 2403 | ||||
| NGC 2403 Enuc. 2 b | ||||
| NGC 2403 Enuc. 4 | ||||
| Holmberg II | ||||
| NGC 2798 | ||||
| NGC 2841 | ||||
| NGC 2976 Enuc. 1 a | ||||
| NGC 2976 Enuc. 1 b | ||||
| NGC 2976 | ||||
| NGC 2976 Enuc. 2 a | ||||
| NGC 2976 Enuc. 2 b | ||||
| NGC 3049 | ||||
| NGC 3077 | † | |||
| NGC 3190 | ||||
| NGC 3184 | ||||
| NGC 3198 | ||||
| IC 2574 a | ||||
| IC 2574 b | ||||
| NGC 3265 | ||||
| NGC 3351 a | ||||
| NGC 3351 b | ||||
| NGC 3521 Enuc. 1 | ||||
| NGC 3521 Enuc. 3 | ||||
| NGC 3521 | ||||
| NGC 3521 Enuc. 2 a | ||||
| NGC 3521 Enuc. 2 b | ||||
| NGC 3621 | ||||
| NGC 3627 | ||||
| NGC 3627 Enuc. 1 | ||||
| NGC 3627 Enuc. 2 | ||||
| NGC 3773 | ||||
| NGC 3938 a | ||||
| NGC 3938 Enuc. 2 a | ||||
| NGC 3938 Enuc. 2 b | ||||
| NGC 4254 Enuc. 2 a | ||||
| NGC 4254 Enuc. 2 b | ||||
| NGC 4254 a | ||||
| NGC 4254 Enuc. 1 a | ||||
| NGC 4254 b | ||||
| NGC 4254 Enuc. 1 b | ||||
| NGC 4254 c | ||||
| NGC 4254 Enuc. 1 c | ||||
| NGC 4254 d | ||||
| NGC 4254 e | ||||
| NGC 4254 f | ||||
| NGC 4321 Enuc. 2 a | ||||
| NGC 4321 Enuc. 2 b | ||||
| NGC 4321 Enuc. 2 | ||||
| NGC 4321 a | ||||
| NGC 4321 b | ||||
| NGC 4321 Enuc. 1 | ||||
| NGC 4536 | ||||
| NGC 4559 a | ||||
| NGC 4559 b | ||||
| NGC 4559 c | ||||
| NGC 4569 | ||||
| NGC 4579 | ||||
| NGC 4594 a | ||||
| NGC 4625 | ||||
| NGC 4631 a | ||||
| NGC 4631 b | ||||
| NGC 4631 c | ||||
| NGC 4631 d | ||||
| NGC 4631 h | ||||
| NGC 4631 Enuc. 2 a | ||||
| NGC 4631 Enuc. 2 b | ||||
| NGC 4725 b | ||||
| NGC 4736 | ||||
| NGC 4736 Enuc. 1 a | ||||
| NGC 4736 Enuc. 1 b | ||||
| NGC 4736 Enuc. 1 c | ||||
| NGC 4826 | ||||
| NGC 5055 | ||||
| NGC 5055 Enuc. 1 | ||||
| NGC 5194 Enuc. 6 a | ||||
| NGC 5194 Enuc. 2 | ||||
| NGC 5194 Enuc. 3 | ||||
| NGC 5194 Enuc. 11 a | ||||
| NGC 5194 Enuc. 11 b | ||||
| NGC 5194 Enuc. 11 d | ||||
| NGC 5194 Enuc. 11 c | ||||
| NGC 5194c | ||||
| NGC 5194 b | ||||
| NGC 5194 Enuc. 1 b | ||||
| NGC 5194 e | ||||
| NGC 5194 d | ||||
| NGC 5194 Enuc. 10 a | ||||
| NGC 5194 Enuc. 4 b | ||||
| NGC 5194 Enuc. 4c | ||||
| NGC 5194 a | ||||
| NGC 5194 Enuc. 10 b | ||||
| NGC 5194 Enuc. 4 d | ||||
| NGC 5194 Enuc. 5 a | ||||
| NGC 5194 Enuc. 9 | ||||
| NGC 5194 Enuc. 7 a | ||||
| NGC 5194 Enuc. 8 | ||||
| NGC 5194 Enuc. 7 b | ||||
| NGC 5194 Enuc. 7 c | ||||
| NGC 5398 | ||||
| NGC 5457 Enuc. 6 a | ||||
| NGC 5457 Enuc. 6 b | ||||
| NGC 5457 Enuc. 6 c | ||||
| NGC 5457 Enuc. 5 a | ||||
| NGC 5457 Enuc. 1 | ||||
| NGC 5457 | ||||
| NGC 5457 Enuc. 3 a | ||||
| NGC 5457 Enuc. 3 b | ||||
| NGC 5457 Enuc. 3 c | ||||
| NGC 5457 Enuc. 3 d | ||||
| NGC 5457 Enuc. 4 a | ||||
| NGC 5457 Enuc. 4 b | ||||
| NGC 5457 Enuc. 4 c | ||||
| NGC 5457 Enuc. 4 d | ||||
| NGC 5474 | ||||
| NGC 5713 Enuc. 2 a | ||||
| NGC 5713 Enuc. 2 b | ||||
| NGC 5713 | ||||
| NGC 5713 Enuc. 1 | ||||
| NGC 5866 | ||||
| NGC 6946 Enuc. 4 b | ||||
| NGC 6946 Enuc. 4 c | ||||
| NGC 6946 Enuc. 8 | ||||
| NGC 6946 Enuc. 5 a | ||||
| NGC 6946 Enuc. 3 a | ||||
| NGC 6946 a | ||||
| NGC 6946 c | ||||
| NGC 6946 Enuc. 6 a | ||||
| NGC 6946 Enuc. 6 b | ||||
| NGC 6946 Enuc. 7 | ||||
| NGC 6946 Enuc. 2 b | ||||
| NGC 7331 | 0.20 | |||
| NGC 7793 Enuc. 1 | ||||
| NGC 7793 Enuc. 3 | ||||
| NGC 7793 a | ||||
| NGC 7793 b | ||||
| NGC 7793 Enuc. 2 | ||||
| Likely Associated with Supernovae | ||||
| NGC 6946 Enuc. 5 b | ||||
| Likely AME Candidates | ||||
| NGC 2403 Enuc. 5 | ||||
| NGC 2403 Enuc. 3 | ||||
| NGC 3938 b | ||||
| NGC 4631 Enuc. 1 | ||||
| NGC 4631 e | ||||
| NGC 4631 f | ||||
| NGC 4631 g | ||||
| NGC 4725 a | 0.01 | |||
| NGC 5194 Enuc. 1 a | ||||
| NGC 5194 Enuc. 11 e | ||||
| NGC 5194 Enuc. 1c | ||||
| NGC 5194 Enuc. 4 a | ||||
| NGC 5457 Enuc. 2 | ||||
| NGC 5457 Enuc. 7 | 0.26 | 0.46 | ||
| NGC 6946 Enuc. 4 a | ||||
| NGC 6946 Enuc. 3 b | ||||
| NGC 6946 b | ||||
| NGC 6946 Enuc. 9 | ||||
| NGC 6946 Enuc. 1 | ||||
| NGC 6946 Enuc. 2 a | ||||
Note. — † Photometry unreliable and not reported due to saturation by the nucleus in the 24 m image.
| Source ID | Back | Back | Back | f | f | f |
|---|---|---|---|---|---|---|
| (mJy) | (mJy) | (mJy) | (‡) | (‡) | (‡) | |
| Star-Forming Regions | ||||||
| NGC 0337 D | 0.207 | 0.099 | 0.019 | 0.174 | 0.130 | 0.062 |
| NGC 0337 A | 0.046 | 0.070 | 0.024 | 0.046 | 0.100 | 0.085 |
| NGC 0337 B | 0.133 | 0.059 | -0.022 | 0.027 | 0.022 | 0.012 |
| NGC 0337 C | 0.026 | 0.019 | 0.005 | 0.087 | 0.064 | 0.024 |
| NGC 0337 G | 0.030 | 0.013 | -0.005 | 0.082 | 0.068 | 0.032 |
| NGC 0337 E | 0.026 | 0.027 | 0.010 | 0.096 | 0.099 | 0.034 |
| NGC 0337 F | 0.021 | 0.038 | 0.023 | 0.075 | 0.195 | 0.104 |
| NGC 0628 Enuc. 4 | -0.004 | 0.013 | 0.013 | 0.015 | 0.049 | 0.057 |
| NGC 0628 Enuc. 2 | 0.017 | -0.012 | 0.026 | 0.033 | 0.033 | 0.092 |
| NGC 0628 Enuc. 3 C | 0.009 | 0.010 | 0.018 | 0.033 | 0.050 | 0.080 |
| NGC 0628 Enuc. 3 A† | -0.007 | 0.019 | -0.012 | 0.013 | 0.052 | 0.024 |
| NGC 0628 Enuc. 3 B | 0.023 | 0.018 | 0.014 | 0.080 | 0.091 | 0.066 |
| NGC 0628 Enuc. 1 B | 0.063 | 0.156 | ||||
| NGC 0628 Enuc. 1 A | 0.007 | 0.029 | -0.031 | 0.026 | 0.114 | 0.118 |
| NGC 0855 C | 0.082 | 0.071 | 0.018 | 0.045 | 0.067 | 0.024 |
| NGC 0855 A† | 0.057 | 0.037 | -0.042 | 0.025 | 0.024 | 0.049 |
| NGC 0855 B | 0.022 | 0.026 | 0.022 | 0.060 | 0.110 | 0.120 |
| NGC 0925 D | -0.004 | 0.005 | 0.014 | 0.022 | ||
| NGC 0925 A | 0.020 | 0.211 | ||||
| NGC 0925 B | -0.001 | -0.003 | 0.004 | 0.019 | ||
| NGC 1097 Enuc. 2 | 0.005 | 0.000 | 0.004 | 0.002 | ||
| NGC 1097 D | 1.142 | 0.248 | 0.223 | 0.096 | 0.083 | 0.100 |
| NGC 1097 B | 2.604 | 0.681 | 0.481 | 0.367 | 0.203 | 0.159 |
| NGC 1097 A† | 5.145 | 0.574 | 0.810 | 0.049 | 0.020 | 0.038 |
| NGC 1097 E | 1.014 | 0.248 | 0.180 | 0.103 | 0.084 | 0.095 |
| NGC 1097 C | 1.450 | 0.285 | 0.235 | 0.119 | 0.087 | 0.100 |
| NGC 1097 Enuc. 1 | 0.023 | 0.073 | ||||
| NGC 1266 C | 0.089 | 0.039 | 0.051 | 0.003 | 0.004 | 0.009 |
| NGC 1266 A† | 0.079 | 0.006 | 0.037 | 0.002 | 0.001 | 0.009 |
| NGC 1266 B | 0.121 | 0.031 | 0.014 | 0.006 | 0.007 | 0.006 |
| NGC 1377 | 0.003 | -0.005 | 0.004 | 0.014 | 0.073 | 0.069 |
| IC 342 B | 3.176 | 1.428 | 1.135 | 0.081 | 0.078 | 0.081 |
| IC 342 A† | 2.376 | 0.743 | 0.477 | 0.026 | 0.020 | 0.018 |
| IC 342 C | 2.542 | 0.970 | 0.790 | 0.109 | 0.093 | 0.098 |
| IC 342 D | 0.077 | 0.027 | 0.086 | 0.199 | ||
| NGC 1482 C | 1.810 | 0.339 | 0.237 | 0.039 | 0.026 | 0.026 |
| NGC 1482 A† | 1.692 | 0.078 | 0.255 | 0.014 | 0.003 | 0.023 |
| NGC 1482 B | 1.855 | 0.606 | 0.270 | 0.043 | 0.048 | 0.031 |
| NGC 2146 A | 0.855 | 0.020 | 0.101 | 0.139 | 0.045 | 0.044 |
| NGC 2146 B | 1.934 | 0.046 | 0.377 | 0.106 | 0.040 | 0.065 |
| NGC 2146 C | 4.865 | 0.136 | 0.971 | 0.132 | 0.081 | 0.097 |
| NGC 2146 D | 16.740 | -0.052 | 1.332 | 0.067 | 0.002 | 0.022 |
| NGC 2146 E | 2.349 | 0.122 | 0.290 | 0.173 | 0.210 | 0.081 |
| NGC 2403 Enuc. 5 C | 0.066 | 0.080 | 0.049 | 0.072 | 0.107 | 0.066 |
| NGC 2403 Enuc. 5 A† | 0.014 | 0.114 | 0.045 | 0.007 | 0.055 | 0.025 |
| NGC 2403 Enuc. 5 E | 0.004 | 0.012 | 0.018 | 0.052 | ||
| NGC 2403 Enuc. 5 B | 0.004 | 0.006 | 0.006 | 0.026 | 0.033 | 0.059 |
| NGC 2403 Enuc. 6 A | -0.023 | 0.026 | 0.008 | 0.026 | 0.030 | 0.011 |
| NGC 2403 Enuc. 6 B | 0.015 | 0.000 | 0.130 | 0.002 | ||
| NGC 2403 Enuc. 1 E | 0.014 | 0.010 | 0.058 | 0.035 | ||
| NGC 2403 Enuc. 1 A | -0.001 | 0.013 | -0.001 | 0.001 | 0.033 | 0.003 |
| NGC 2403 C | 0.002 | 0.012 | 0.017 | 0.091 | ||
| NGC 2403 Enuc. 1 B | 0.031 | 0.066 | 0.040 | 0.020 | 0.048 | 0.035 |
| NGC 2403 Enuc. 1 C | 0.036 | 0.005 | 0.003 | 0.076 | 0.048 | 0.035 |
| NGC 2403 Enuc. 1 D | 0.022 | 0.023 | 0.009 | 0.108 | 0.170 | 0.079 |
| NGC 2403 Enuc. 2 B | -0.008 | 0.018 | -0.002 | 0.020 | 0.055 | 0.009 |
| NGC 2403 Enuc. 2 D | 0.039 | 0.030 | 0.029 | 0.061 | 0.054 | 0.053 |
| NGC 2403 Enuc. 2 A† | 0.024 | 0.024 | 0.061 | 0.011 | 0.015 | 0.041 |
| NGC 2403 Enuc. 2 C | 0.050 | 0.025 | 0.022 | 0.084 | 0.055 | 0.055 |
| NGC 2403 B | 0.027 | 0.138 | ||||
| NGC 2403 E | 0.013 | 0.096 | ||||
| NGC 2403 Enuc. 3 B | 0.177 | 0.165 | 0.229 | 0.046 | 0.052 | 0.079 |
| NGC 2403 Enuc. 4 B | 0.018 | 0.003 | 0.158 | 0.039 | ||
| NGC 2403 Enuc. 4 C | 0.013 | 0.008 | 0.122 | 0.098 | ||
| NGC 2403 Enuc. 4 A | 0.016 | 0.066 | 0.034 | 0.016 | 0.066 | 0.037 |
| Holmberg II B | 0.006 | 0.011 | 0.019 | 0.041 | 0.080 | 0.115 |
| Holmberg II A | 0.017 | 0.016 | 0.031 | 0.050 | 0.050 | 0.091 |
| NGC 2798 B | 0.180 | 0.041 | 0.011 | 0.102 | 0.067 | 0.057 |
| NGC 2798 A | 0.624 | 0.184 | 0.058 | 0.056 | 0.073 | 0.062 |
| NGC 2841 A | -0.003 | 0.005 | ||||
| NGC 2976 Enuc. 1 A | 0.043 | 0.044 | 0.032 | 0.038 | 0.057 | 0.043 |
| NGC 2976 Enuc. 1 D | 0.143 | 0.101 | 0.073 | 0.064 | 0.056 | 0.047 |
| NGC 2976 Enuc. 1 C | 0.019 | 0.019 | 0.019 | 0.039 | 0.052 | 0.059 |
| NGC 2976 Enuc. 1 B† | 0.106 | 0.145 | 0.063 | 0.032 | 0.058 | 0.031 |
| NGC 2976 B | 0.014 | 0.004 | -0.001 | 0.086 | 0.025 | 0.005 |
| NGC 2976 A | -0.004 | 0.027 | ||||
| NGC 2976 Enuc. 2 A | 0.069 | 0.068 | 0.025 | 0.041 | 0.046 | 0.020 |
| NGC 2976 Enuc. 2 C | 0.047 | 0.045 | 0.015 | 0.084 | 0.099 | 0.038 |
| NGC 2976 C | 0.012 | 0.048 | ||||
| NGC 3049 A | 0.007 | 0.021 | 0.018 | 0.005 | 0.039 | 0.040 |
| NGC 3049 B | 0.005 | 0.014 | 0.014 | 0.015 | 0.066 | 0.090 |
| NGC 3049 C | 0.009 | 0.041 | ||||
| NGC 3077 A | 0.523 | 0.387 | 0.170 | 0.046 | 0.054 | 0.027 |
| NGC 3190 A | 0.024 | 0.008 | 0.005 | 0.043 | 0.013 | 0.004 |
| NGC 3184 B | 0.013 | 0.012 | 0.040 | 0.062 | ||
| NGC 3184 A | 0.027 | -0.006 | -0.004 | 0.042 | 0.018 | 0.012 |
| NGC 3198 B | 0.014 | 0.001 | 0.067 | 0.005 | ||
| NGC 3198 A | 0.020 | 0.013 | -0.023 | 0.041 | 0.044 | 0.120 |
| NGC 3198 C | -0.019 | 0.015 | 0.112 | 0.085 | ||
| IC 2574 D | 0.032 | 0.016 | 0.010 | 0.033 | 0.053 | 0.021 |
| IC 2574 C | 0.160 | 0.112 | 0.060 | 0.179 | 0.178 | 0.077 |
| IC 2574 A | 0.009 | 0.004 | 0.011 | 0.016 | 0.008 | 0.023 |
| IC 2574 B | -0.005 | 0.005 | 0.056 | 0.049 | ||
| NGC 3265 A | 0.145 | 0.044 | 0.028 | 0.053 | 0.066 | 0.066 |
| NGC 3351 C | -0.016 | -0.022 | -0.010 | 0.007 | 0.021 | 0.008 |
| NGC 3351 A | 0.497 | 0.179 | 0.036 | 0.069 | 0.065 | 0.018 |
| NGC 3351 B | 0.409 | 0.101 | 0.109 | 0.046 | 0.028 | 0.048 |
| NGC 3521 Enuc. 1 | -0.022 | 0.023 | 0.162 | 0.080 | ||
| NGC 3521 Enuc. 3 A | 0.027 | 0.085 | ||||
| NGC 3521 Enuc. 2 A | 0.021 | 0.016 | -0.019 | 0.032 | 0.047 | 0.068 |
| NGC 3521 Enuc. 3 C | 0.021 | 0.021 | ||||
| NGC 3521 Enuc. 2 B | 0.011 | 0.012 | 0.037 | 0.034 | ||
| NGC 3621 C | 0.025 | 0.032 | 0.065 | 0.099 | ||
| NGC 3621 A | 0.060 | 0.026 | 0.057 | 0.095 | ||
| NGC 3621 H | 0.012 | 0.103 | ||||
| NGC 3621 G† | 0.109 | 0.079 | 0.051 | 0.051 | ||
| NGC 3621 B | 0.035 | 0.048 | 0.037 | 0.086 | ||
| NGC 3621 F | 0.002 | 0.013 | ||||
| NGC 3621 E | -0.001 | -0.010 | 0.002 | 0.054 | ||
| NGC 3627 Enuc. 1 G | 0.037 | 0.072 | ||||
| NGC 3627 Enuc. 1 F | 0.015 | 0.064 | ||||
| NGC 3627 Enuc. 1 E | -0.002 | 0.003 | 0.006 | 0.007 | ||
| NGC 3627 B | 0.382 | 0.392 | -0.004 | 0.096 | 0.162 | 0.003 |
| NGC 3627 A | 0.008 | 0.037 | 0.021 | 0.004 | 0.034 | 0.030 |
| NGC 3627 Enuc. 2 D | 0.140 | 0.073 | 0.060 | 0.034 | 0.029 | 0.032 |
| NGC 3627 Enuc. 1 A | 0.074 | 0.118 | 0.035 | 0.031 | 0.081 | 0.028 |
| NGC 3627 Enuc. 2 A† | 0.161 | 0.208 | 0.029 | 0.022 | 0.049 | 0.008 |
| NGC 3627 Enuc. 2 E | 0.197 | 0.120 | 0.077 | 0.048 | 0.057 | 0.046 |
| NGC 3627 Enuc. 2 C | -0.008 | 0.039 | 0.003 | 0.019 | 0.092 | 0.012 |
| NGC 3627 Enuc. 2 B | 0.027 | 0.059 | 0.035 | 0.117 | ||
| NGC 3773 | 0.078 | 0.049 | 0.017 | 0.031 | 0.036 | 0.015 |
| NGC 3938 B | 0.028 | 0.102 | ||||
| NGC 3938 Enuc. 2 B | 0.002 | -0.003 | 0.011 | 0.009 | 0.027 | 0.060 |
| NGC 3938 Enuc. 2 A | -0.007 | 0.000 | -0.003 | 0.021 | 0.000 | 0.013 |
| NGC 4254 Enuc. 2 D | 0.008 | 0.019 | 0.081 | 0.112 | ||
| NGC 4254 Enuc. 2 C | 0.007 | 0.089 | ||||
| NGC 4254 Enuc. 1 E | 0.020 | 0.013 | 0.068 | 0.114 | ||
| NGC 4254 Enuc. 2 E | -0.003 | 0.019 | ||||
| NGC 4254 | 0.024 | 0.095 | 0.014 | 0.059 | 0.185 | 0.038 |
| NGC 4254 Enuc. 1 D | 0.056 | 0.011 | 0.014 | 0.071 | 0.046 | 0.040 |
| NGC 4254 Enuc. 1 B | 0.033 | -0.004 | 0.023 | 0.152 | 0.028 | 0.056 |
| NGC 4254 Enuc. 1 C | 0.002 | -0.008 | 0.008 | 0.063 | ||
| NGC 4321 Enuc. 2 | 0.014 | -0.010 | 0.082 | 0.084 | ||
| NGC 4321 C | 0.424 | 0.192 | 0.101 | 0.165 | 0.176 | 0.173 |
| NGC 4321 F | 0.215 | 0.099 | 0.067 | 0.231 | 0.218 | 0.214 |
| NGC 4321 H | 0.115 | 0.055 | 0.037 | 0.176 | 0.177 | 0.136 |
| NGC 4321 A† | 0.326 | 0.381 | -0.122 | 0.014 | 0.042 | 0.024 |
| NGC 4321 B | 0.379 | 0.153 | 0.089 | 0.153 | 0.193 | 0.197 |
| NGC 4321 G | 0.330 | 0.115 | 0.076 | 0.186 | 0.184 | 0.198 |
| NGC 4321 D | 0.387 | 0.173 | 0.129 | 0.119 | 0.135 | 0.156 |
| NGC 4321 E | 0.750 | 0.277 | 0.158 | 0.190 | 0.199 | 0.182 |
| NGC 4321 Enuc. 1 B | -0.012 | 0.008 | 0.043 | 0.045 | ||
| NGC 4536 C | 2.914 | 0.834 | 0.455 | 0.086 | 0.066 | 0.057 |
| NGC 4536 A† | 1.452 | 0.485 | 0.149 | 0.016 | 0.017 | 0.009 |
| NGC 4536 B | 2.138 | 0.635 | 0.335 | 0.079 | 0.064 | 0.051 |
| NGC 4559 E | -0.017 | 0.013 | 0.116 | 0.106 | ||
| NGC 4559 C | -0.013 | 0.028 | 0.005 | 0.065 | 0.158 | 0.026 |
| NGC 4559 D | 0.026 | 0.228 | ||||
| NGC 4559 B | 0.012 | 0.010 | 0.002 | 0.130 | 0.064 | 0.018 |
| NGC 4559 A | 0.002 | 0.008 | 0.002 | 0.014 | 0.073 | 0.013 |
| NGC 4569 A | 0.253 | 0.180 | 0.057 | 0.088 | 0.125 | 0.065 |
| NGC 4579 | -0.139 | 0.254 | 0.152 | 0.068 | 0.092 | 0.255 |
| NGC 4594 | -0.021 | 0.011 | 0.021 | 0.025 | 0.023 | 0.026 |
| NGC 4631 Enuc. 1 | -0.000 | 0.064 | 0.049 | 0.000 | 0.097 | 0.080 |
| NGC 4625 A | 0.035 | 0.323 | ||||
| NGC 4631 A | 0.044 | 0.178 | 0.034 | 0.006 | 0.072 | 0.023 |
| NGC 4631 H | 0.128 | 0.195 | 0.071 | 0.130 | 0.149 | 0.084 |
| NGC 4631 B | 0.456 | 0.220 | 0.208 | 0.083 | 0.066 | 0.068 |
| NGC 4631 G | 0.043 | 0.050 | 0.030 | 0.047 | 0.068 | 0.049 |
| NGC 4631 Enuc. 2 B | 0.014 | 0.042 | -0.000 | 0.009 | 0.030 | 0.000 |
| NGC 4631 Enuc. 2 C | 0.019 | 0.088 | ||||
| NGC 4725 C | -0.007 | 0.000 | 0.032 | 0.006 | ||
| NGC 4725 A | 0.003 | 0.002 | 0.001 | 0.038 | 0.014 | 0.002 |
| NGC 4736 K | 0.004 | 0.015 | 0.007 | 0.020 | ||
| NGC 4736 J | 0.104 | 0.001 | 0.103 | 0.002 | ||
| NGC 4736 I | 0.097 | 0.034 | 0.077 | 0.052 | ||
| NGC 4736 G | 0.044 | 0.163 | ||||
| NGC 4736 L | 0.047 | 0.084 | ||||
| NGC 4736 H | 0.088 | 0.080 | 0.026 | 0.069 | 0.074 | 0.074 |
| NGC 4736 M | -0.016 | 0.103 | ||||
| NGC 4736 F | 0.134 | 0.108 | 0.099 | 0.121 | ||
| NGC 4736 N | -0.004 | 0.133 | 0.017 | 0.124 | ||
| NGC 4736 A | 0.193 | -0.016 | 0.021 | 0.031 | 0.007 | 0.017 |
| NGC 4736 O | 0.015 | 0.086 | 0.024 | 0.084 | 0.194 | 0.062 |
| NGC 4736 E | 0.141 | 0.182 | ||||
| NGC 4736 P | 0.133 | 0.036 | -0.008 | 0.126 | 0.120 | 0.013 |
| NGC 4736 D | 0.015 | 0.112 | 0.009 | 0.025 | 0.107 | 0.020 |
| NGC 4736 Enuc. 1 D | 0.015 | 0.015 | 0.030 | 0.096 | 0.044 | 0.109 |
| NGC 4736 Enuc. 1 A | 0.049 | 0.099 | 0.093 | 0.032 | 0.093 | 0.106 |
| NGC 4736 Enuc. 1 B | 0.148 | 0.038 | 0.065 | 0.053 | 0.024 | 0.063 |
| NGC 4736 Enuc. 1 C | -0.002 | 0.062 | 0.027 | 0.001 | 0.054 | 0.043 |
| NGC 4736 Enuc. 1 E | 0.013 | 0.015 | 0.148 | 0.110 | ||
| NGC 4826 C | 0.049 | 0.086 | 0.033 | 0.068 | 0.177 | 0.152 |
| NGC 4826 B | 0.134 | 0.109 | 0.039 | 0.185 | 0.205 | 0.155 |
| NGC 4826 A | 0.779 | 0.470 | 0.174 | 0.064 | 0.103 | 0.062 |
| NGC 4826 F† | 0.236 | 0.899 | 0.044 | 0.021 | 0.093 | 0.012 |
| NGC 4826 E | 0.048 | 0.087 | 0.019 | 0.110 | 0.189 | 0.136 |
| NGC 4826 D | 0.077 | 0.075 | 0.030 | 0.136 | 0.229 | 0.096 |
| NGC 5055 C | 0.005 | 0.033 | ||||
| NGC 5055 D | 0.023 | 0.040 | 0.106 | 0.207 | ||
| NGC 5055 A | 0.204 | 0.150 | 0.066 | 0.103 | 0.149 | 0.197 |
| NGC 5055 B | -0.011 | 0.002 | 0.010 | 0.006 | ||
| NGC 5055 Enuc. 1 | 0.002 | 0.024 | 0.020 | 0.005 | 0.055 | 0.050 |
| NGC 5194 Enuc. 6 | 0.034 | 0.043 | 0.044 | 0.050 | 0.082 | 0.078 |
| NGC 5194 Enuc. 3 B | 0.026 | 0.022 | 0.074 | 0.165 | ||
| NGC 5194 Enuc. 3 A | 0.050 | 0.035 | 0.040 | 0.062 | 0.064 | 0.069 |
| NGC 5194 Enuc. 11 G | -0.031 | 0.009 | 0.105 | 0.030 | ||
| NGC 5194 Enuc. 11 A | 0.053 | 0.008 | 0.114 | 0.036 | ||
| NGC 5194 Enuc. 11 B | 0.035 | 0.010 | 0.220 | 0.053 | ||
| NGC 5194 Enuc. 11 C | 0.004 | 0.009 | 0.042 | 0.064 | ||
| NGC 5194 Enuc. 11 D | 0.074 | 0.029 | 0.000 | 0.087 | 0.109 | 0.004 |
| NGC 5194 H | 0.055 | -0.011 | -0.017 | 0.019 | 0.009 | 0.060 |
| NGC 5194 L | 0.333 | 0.092 | 0.031 | 0.200 | 0.140 | 0.179 |
| NGC 5194 M | 0.089 | 0.050 | 0.012 | 0.130 | 0.199 | 0.090 |
| NGC 5194 Enuc. 11 E | 0.018 | 0.034 | 0.009 | 0.086 | 0.149 | 0.056 |
| NGC 5194 A | 0.240 | 0.079 | 0.008 | 0.170 | 0.144 | 0.030 |
| NGC 5194 Enuc. 11 F | 0.025 | 0.015 | 0.005 | 0.100 | 0.101 | 0.036 |
| NGC 5194 K | 0.095 | 0.108 | 0.011 | 0.111 | 0.165 | 0.048 |
| NGC 5194 B | 0.028 | 0.018 | 0.008 | 0.014 | 0.029 | 0.022 |
| NGC 5194 G | 0.220 | 0.095 | 0.010 | 0.194 | 0.198 | 0.100 |
| NGC 5194 J | 0.077 | 0.036 | 0.015 | 0.130 | 0.261 | 0.200 |
| NGC 5194 E | 0.559 | 0.306 | 0.094 | 0.045 | 0.070 | 0.056 |
| NGC 5194 O | 0.011 | 0.111 | 0.028 | 0.238 | ||
| NGC 5194 I | 0.474 | 0.124 | 0.039 | 0.088 | 0.087 | 0.055 |
| NGC 5194 C† | 0.491 | 0.203 | 0.050 | 0.046 | 0.072 | 0.041 |
| NGC 5194 Enuc. 1 A | 0.025 | 0.001 | 0.007 | 0.076 | 0.010 | 0.027 |
| NGC 5194 Enuc. 4 D | 0.007 | 0.057 | ||||
| NGC 5194 N | 0.237 | 0.069 | 0.179 | 0.258 | ||
| NGC 5194 F | 0.024 | 0.041 | 0.014 | 0.032 | 0.079 | 0.044 |
| NGC 5194 Enuc. 4 C | 0.021 | 0.004 | 0.004 | 0.129 | 0.036 | 0.033 |
| NGC 5194 P | 0.112 | 0.014 | 0.002 | 0.157 | 0.048 | 0.010 |
| NGC 5194 Enuc. 4 E | 0.002 | 0.034 | ||||
| NGC 5194 Enuc. 10 | 0.065 | 0.041 | 0.037 | 0.092 | 0.117 | 0.105 |
| NGC 5194 Enuc. 4 B | 0.005 | -0.002 | 0.046 | 0.026 | ||
| NGC 5194 Enuc. 5 B | 0.021 | 0.005 | 0.000 | 0.079 | 0.027 | 0.001 |
| NGC 5194 Enuc. 4 F | 0.018 | 0.004 | 0.000 | 0.083 | 0.027 | 0.003 |
| NGC 5194 Enuc. 4 G | 0.029 | 0.026 | -0.000 | 0.052 | 0.090 | 0.004 |
| NGC 5194 Enuc. 5 A | 0.024 | 0.022 | 0.014 | 0.038 | 0.063 | 0.038 |
| NGC 5194 Enuc. 9 | 0.002 | -0.020 | 0.010 | 0.004 | 0.055 | 0.026 |
| NGC 5194 Enuc. 8 C | 0.005 | 0.032 | 0.014 | 0.118 | ||
| NGC 5194 Enuc. 8 B | 0.052 | 0.048 | 0.005 | 0.078 | 0.075 | 0.024 |
| NGC 5194 Enuc. 7 E | 0.028 | 0.002 | 0.150 | 0.008 | ||
| NGC 5194 Enuc. 8 A | 0.070 | 0.044 | -0.012 | 0.126 | 0.082 | 0.030 |
| NGC 5194 Enuc. 7 A | 0.103 | 0.022 | 0.019 | 0.086 | 0.055 | 0.057 |
| NGC 5194 Enuc. 7 C | 0.048 | 0.009 | -0.003 | 0.117 | 0.049 | 0.018 |
| NGC 5194 Enuc. 7 B | 0.022 | -0.013 | 0.067 | 0.081 | ||
| NGC 5194 Enuc. 7 F | 0.011 | 0.052 | 0.002 | 0.029 | ||
| NGC 5194 Enuc. 8 D | 0.002 | -0.018 | 0.006 | 0.092 | ||
| NGC 5398 | 0.000 | 0.024 | 0.002 | 0.000 | 0.014 | 0.001 |
| NGC 5457 Enuc. 6 A | 0.092 | 0.099 | 0.018 | 0.088 | 0.106 | 0.033 |
| NGC 5457 Enuc. 6 E | 0.071 | 0.077 | 0.024 | 0.106 | 0.174 | 0.052 |
| NGC 5457 Enuc. 6 B | 0.183 | 0.118 | 0.060 | 0.078 | 0.075 | 0.079 |
| NGC 5457 Enuc. 6 C | 0.060 | 0.066 | 0.013 | 0.060 | 0.090 | 0.023 |
| NGC 5457 Enuc. 6 D | 0.023 | 0.031 | 0.005 | 0.040 | 0.084 | 0.016 |
| NGC 5457 Enuc. 6 F | 0.009 | 0.009 | 0.042 | 0.084 | ||
| NGC 5457 Enuc. 2 B | 0.001 | -0.001 | 0.007 | 0.012 | ||
| NGC 5457 Enuc. 2 C | -0.007 | 0.004 | 0.046 | 0.077 | ||
| NGC 5457 Enuc. 5 B | 0.099 | 0.118 | 0.033 | 0.067 | 0.099 | 0.029 |
| NGC 5457 Enuc. 5 A† | 0.101 | 0.115 | 0.034 | 0.048 | 0.053 | 0.027 |
| NGC 5457 Enuc. 5 C | 0.103 | 0.062 | 0.045 | 0.118 | 0.100 | 0.065 |
| NGC 5457 Enuc. 1 | 0.009 | 0.005 | 0.083 | 0.058 | ||
| NGC 5457 | 0.015 | 0.021 | 0.013 | 0.017 | 0.086 | 0.035 |
| NGC 5457 Enuc. 3 E | -0.008 | 0.003 | 0.034 | 0.016 | ||
| NGC 5457 Enuc. 3 D | 0.013 | 0.032 | 0.022 | 0.090 | ||
| NGC 5457 Enuc. 3 A | 0.029 | 0.065 | 0.043 | 0.032 | 0.075 | 0.065 |
| NGC 5457 Enuc. 3 B | 0.257 | 0.299 | 0.087 | 0.022 | 0.032 | 0.012 |
| NGC 5457 Enuc. 3 C | 0.030 | 0.018 | -0.001 | 0.031 | 0.033 | 0.003 |
| NGC 5457 Enuc. 4 A | 0.043 | 0.026 | -0.001 | 0.104 | 0.101 | 0.006 |
| NGC 5457 Enuc. 4 B | 0.049 | 0.045 | 0.010 | 0.145 | 0.160 | 0.038 |
| NGC 5457 Enuc. 4 C | 0.081 | 0.078 | 0.041 | 0.098 | 0.140 | 0.090 |
| NGC 5457 Enuc. 4 D | 0.081 | 0.047 | 0.026 | 0.080 | 0.081 | 0.073 |
| NGC 5457 Enuc. 7 D† | 0.238 | 0.130 | 0.074 | 0.040 | 0.030 | 0.019 |
| NGC 5457 Enuc. 7 B | 0.115 | 0.151 | 0.081 | 0.054 | 0.200 | 0.111 |
| NGC 5713 A | 0.095 | 0.101 | 0.035 | 0.052 | 0.106 | 0.058 |
| NGC 5713 F | 0.035 | 0.063 | 0.025 | 0.094 | 0.194 | 0.127 |
| NGC 5713 B | 0.234 | 0.128 | 0.054 | 0.062 | 0.075 | 0.041 |
| NGC 5713 Enuc. 2 | 0.100 | 0.081 | -0.013 | 0.081 | 0.105 | 0.046 |
| NGC 5713 Enuc. 2 A | 0.185 | 0.141 | 0.024 | 0.096 | 0.131 | 0.038 |
| NGC 5713 C | 0.420 | 0.186 | 0.103 | 0.078 | 0.093 | 0.069 |
| NGC 5713 G† | 1.348 | 1.190 | 0.271 | 0.120 | 0.176 | 0.126 |
| NGC 5713 D | 0.334 | 0.182 | 0.096 | 0.044 | 0.056 | 0.040 |
| NGC 5713 Enuc. 1 A | 0.031 | 0.164 | ||||
| NGC 5713 E | 0.209 | 0.142 | 0.016 | 0.151 | 0.165 | 0.028 |
| NGC 5866 | 0.088 | 0.105 | 0.035 | 0.013 | 0.021 | 0.016 |
| NGC 6946 Enuc. 4 A | 0.047 | 0.035 | 0.045 | 0.122 | 0.103 | 0.116 |
| NGC 6946 Enuc. 4 B | 0.004 | 0.011 | 0.023 | 0.020 | 0.052 | 0.112 |
| NGC 6946 Enuc. 4 H | -0.002 | -0.003 | 0.000 | 0.023 | 0.028 | 0.002 |
| NGC 6946 Enuc. 8 A | 0.223 | 0.041 | 0.042 | 0.099 | 0.056 | 0.051 |
| NGC 6946 Enuc. 5 A | 0.007 | 0.064 | ||||
| NGC 6946 Enuc. 8 B | 0.015 | 0.067 | ||||
| NGC 6946 Enuc. 5 B | 0.009 | 0.027 | 0.010 | 0.028 | 0.071 | 0.026 |
| NGC 6946 Enuc. 3 A | -0.014 | 0.014 | 0.010 | 0.135 | 0.069 | 0.043 |
| NGC 6946 Enuc. 3 B | -0.011 | 0.029 | 0.014 | 0.089 | 0.143 | 0.069 |
| NGC 6946 A | 0.751 | 0.529 | 0.154 | 0.036 | 0.062 | 0.035 |
| NGC 6946 Enuc. 3 C | 0.015 | 0.049 | 0.028 | 0.031 | 0.103 | 0.065 |
| NGC 6946 B | 0.007 | 0.027 | -0.007 | 0.015 | 0.069 | 0.025 |
| NGC 6946 C | 0.101 | 0.060 | 0.034 | 0.136 | 0.096 | 0.107 |
| NGC 6946 Enuc. 6 J | 0.017 | 0.000 | 0.014 | 0.148 | 0.005 | 0.138 |
| NGC 6946 Enuc. 6 I | 0.025 | 0.008 | 0.022 | 0.113 | 0.073 | 0.210 |
| NGC 6946 Enuc. 6 H | 0.019 | 0.004 | 0.014 | 0.101 | 0.034 | 0.089 |
| NGC 6946 Enuc. 6 F | 0.013 | 0.012 | 0.015 | 0.056 | 0.188 | 0.127 |
| NGC 6946 Enuc. 6 E | 0.008 | 0.008 | 0.050 | 0.049 | ||
| NGC 6946 Enuc. 6 B | 0.011 | 0.011 | 0.001 | 0.032 | 0.038 | 0.007 |
| NGC 6946 Enuc. 6 C | 0.006 | 0.006 | 0.056 | 0.100 | ||
| NGC 6946 Enuc. 9 E | -0.004 | 0.006 | 0.031 | 0.077 | ||
| NGC 6946 Enuc. 9 D | 0.031 | 0.023 | 0.161 | 0.104 | ||
| NGC 6946 Enuc. 9 A | 0.060 | 0.090 | 0.033 | 0.070 | 0.122 | 0.053 |
| NGC 6946 Enuc. 6 L | 0.051 | 0.006 | 0.010 | 0.072 | 0.026 | 0.026 |
| NGC 6946 Enuc. 9 C | -0.007 | 0.020 | 0.011 | 0.057 | 0.100 | 0.102 |
| NGC 6946 Enuc. 9 B | 0.009 | 0.024 | 0.015 | 0.057 | 0.143 | 0.117 |
| NGC 6946 Enuc. 7 A | -0.007 | 0.045 | 0.013 | 0.035 | 0.060 | 0.027 |
| NGC 6946 Enuc. 7 B | -0.008 | 0.017 | 0.009 | 0.059 | 0.079 | 0.057 |
| NGC 6946 Enuc. 1 A | -0.003 | 0.029 | 0.031 | 0.004 | 0.045 | 0.047 |
| NGC 6946 Enuc. 2 C | 0.003 | 0.004 | 0.018 | 0.025 | ||
| NGC 7331 G | 0.120 | 0.172 | ||||
| NGC 7331 F | 0.073 | 0.115 | 0.106 | 0.268 | ||
| NGC 7331 H | 0.069 | -0.029 | 0.052 | 0.025 | ||
| NGC 7331 I | 0.076 | 0.143 | 0.062 | 0.097 | ||
| NGC 7331 A | -0.020 | 0.045 | 0.123 | 0.123 | ||
| NGC 7331 E | 0.061 | -0.057 | 0.067 | 0.117 | ||
| NGC 7331 B | 0.055 | 0.111 | 0.108 | 0.138 | ||
| NGC 7331 D | 0.014 | 0.076 | 0.096 | 0.170 | ||
| NGC 7793 Enuc. 1 E | -0.001 | -0.004 | 0.008 | 0.059 | ||
| NGC 7793 Enuc. 3 | -0.006 | 0.002 | 0.030 | 0.009 | ||
| NGC 7793 Enuc. 1 A | 0.006 | 0.004 | 0.059 | 0.051 | ||
| NGC 7793 C | -0.004 | 0.004 | -0.001 | 0.020 | 0.025 | 0.007 |
| NGC 7793 A | -0.008 | 0.013 | -0.003 | 0.035 | 0.067 | 0.016 |
| NGC 7793 Enuc. 1 B | 0.008 | 0.079 | ||||
| NGC 7793 Enuc. 1 C | -0.005 | 0.001 | 0.026 | 0.005 | ||
| NGC 7793 Enuc. 2 | -0.006 | 0.042 | ||||
| Likely Background Galaxies | ||||||
| NGC 0925 C | -0.001 | -0.004 | 0.003 | 0.001 | 0.006 | 0.011 |
| IC 342 E | 0.113 | 0.039 | 0.143 | 0.139 | ||
| Holmberg II C | 0.006 | 0.011 | 0.019 | 0.041 | 0.080 | 0.115 |
| NGC 2841 B | -0.003 | 0.026 | ||||
| NGC 2976 Enuc. 1 E | -0.005 | 0.031 | ||||
| NGC 3077 B | -0.004 | 0.009 | 0.066 | 0.078 | ||
| NGC 3190 B | 0.089 | 0.027 | 0.017 | 0.042 | 0.040 | 0.034 |
| NGC 3265 B | 0.001 | -0.001 | 0.001 | 0.017 | ||
| NGC 3351 D | -0.011 | 0.014 | 0.035 | 0.139 | ||
| NGC 3627 Enuc. 1 B | -0.000 | 0.003 | ||||
| NGC 4569 B | -0.017 | 0.034 | ||||
| NGC 4625 B | 0.001 | 0.004 | 0.001 | 0.001 | 0.016 | 0.004 |
| NGC 6946 Enuc. 4 F | 0.145 | 0.105 | 0.032 | 0.025 | 0.061 | 0.035 |
| NGC 6946 Enuc. 4 G | -0.044 | -0.002 | 0.011 | 0.018 | 0.002 | 0.022 |
| Likely Associated with Supernovae | ||||||
| NGC 2403 Enuc. 3 D | -0.038 | 0.022 | ||||
| NGC 4736 B | -0.016 | 0.100 | ||||
| NGC 4736 C | -0.027 | 0.169 | ||||
| NGC 5194 D | 0.034 | 0.065 | 0.045 | 0.028 | 0.103 | 0.055 |
| NGC 5194 Enuc. 7 D | 0.028 | -0.003 | 0.018 | 0.017 | ||
| NGC 6946 F | 0.016 | 0.012 | 0.079 | 0.108 | ||
| NGC 6946 Enuc. 6 D | 0.004 | 0.013 | -0.003 | 0.013 | 0.036 | 0.015 |
| NGC 6946 Enuc. 2 B | 0.006 | 0.087 | 0.029 | 0.005 | 0.061 | 0.015 |
| NGC 7331 C | 0.040 | 0.379 | 0.055 | 0.051 | 0.205 | 0.076 |
| NGC 7793 B | -0.002 | 0.013 | ||||
| Likely AME Candidates | ||||||
| NGC 2403 Enuc. 5 D | 0.045 | 0.073 | 0.036 | 0.071 | 0.115 | 0.059 |
| NGC 2403 Enuc. 2 E | 0.038 | 0.057 | 0.022 | 0.032 | 0.059 | 0.018 |
| NGC 2403 Enuc. 3 A | 0.015 | 0.030 | 0.033 | 0.038 | 0.075 | 0.063 |
| NGC 2403 Enuc. 3 C | 0.112 | 0.070 | 0.093 | 0.045 | 0.037 | 0.049 |
| NGC 3627 Enuc. 1 D | 0.014 | 0.048 | 0.014 | 0.036 | 0.086 | 0.023 |
| NGC 3627 Enuc. 1 C | 0.005 | 0.085 | -0.004 | 0.011 | 0.134 | 0.004 |
| NGC 4254 Enuc. 2 A | 0.005 | 0.008 | 0.011 | 0.041 | 0.052 | 0.049 |
| NGC 4254 Enuc. 1 A | 0.013 | 0.007 | 0.020 | 0.037 | 0.053 | 0.088 |
| NGC 4631 C | 0.115 | 0.020 | 0.081 | 0.066 | 0.023 | 0.065 |
| NGC 4631 D | 0.065 | 0.013 | 0.078 | 0.042 | 0.025 | 0.083 |
| NGC 4631 E | 0.075 | 0.038 | 0.065 | 0.080 | 0.083 | 0.083 |
| NGC 4631 F | 0.418 | 0.259 | 0.212 | 0.061 | 0.079 | 0.053 |
| NGC 4631 Enuc. 2 A | 0.033 | 0.006 | 0.005 | 0.055 | 0.027 | 0.013 |
| NGC 4725 B | -0.003 | 0.001 | 0.003 | 0.024 | 0.005 | 0.008 |
| NGC 5194 Enuc. 2 | 0.019 | 0.011 | 0.018 | 0.015 | 0.024 | 0.032 |
| NGC 5194 Enuc. 1 C | 0.053 | 0.030 | 0.033 | 0.098 | 0.064 | 0.045 |
| NGC 5194 Enuc. 1 B | 0.034 | 0.025 | 0.023 | 0.069 | 0.051 | 0.043 |
| NGC 5194 Enuc. 4 A | 0.040 | -0.004 | 0.018 | 0.056 | 0.012 | 0.044 |
| NGC 5457 Enuc. 2 A | 0.020 | 0.007 | 0.006 | 0.050 | 0.026 | 0.017 |
| NGC 5457 Enuc. 7 A | 0.084 | 0.071 | 0.048 | 0.079 | 0.127 | 0.068 |
| NGC 5457 Enuc. 7 C | 0.263 | 0.243 | 0.162 | 0.074 | 0.135 | 0.084 |
| NGC 6946 Enuc. 4 C | 0.026 | 0.037 | 0.042 | 0.017 | 0.026 | 0.027 |
| NGC 6946 Enuc. 4 D | -0.001 | 0.013 | 0.004 | 0.011 | 0.016 | 0.005 |
| NGC 6946 Enuc. 4 E | 0.014 | 0.035 | 0.023 | 0.011 | 0.026 | 0.018 |
| NGC 6946 E | 0.060 | 0.062 | 0.055 | 0.083 | 0.086 | 0.043 |
| NGC 6946 D | 0.018 | 0.064 | 0.005 | 0.045 | 0.126 | 0.010 |
| NGC 6946 Enuc. 6 M | -0.005 | -0.012 | 0.006 | 0.009 | 0.133 | 0.014 |
| NGC 6946 Enuc. 6 G | 0.050 | 0.019 | 0.044 | 0.064 | 0.038 | 0.080 |
| NGC 6946 Enuc. 6 K | 0.063 | 0.025 | 0.051 | 0.090 | 0.064 | 0.112 |
| NGC 6946 Enuc. 6 A† | 0.080 | 0.036 | 0.097 | 0.043 | 0.033 | 0.081 |
| NGC 6946 Enuc. 1 B | 0.078 | 0.006 | 0.009 | 0.108 | 0.016 | 0.013 |
| NGC 6946 Enuc. 2 A | -0.008 | 0.028 | 0.004 | 0.074 | 0.092 | 0.012 |
| NGC 7793 Enuc. 1 D | -0.010 | 0.001 | 0.044 | 0.006 | ||
Note. — † The aperture used for this star-forming region contained multiple smaller individual regions.
Note. — ‡ The fractional contribution of the absolute value of the local background measurement to the aperture flux density.