The high-energy emission from HD 93129A near periastron
Abstract
We conducted an observational campaign towards one of the most massive and luminous colliding wind binaries in the Galaxy, HD 93129A, close to its periastron passage in 2018. During this time the source was predicted to be in its maximum of high-energy emission. Here we present our data analysis from the X-ray satellites Chandra and NuSTAR and the -ray satellite AGILE. High-energy emission coincident with HD 93129A was detected in the X-ray band up to 18 keV, whereas in the -ray band only upper limits were obtained. We interpret the derived fluxes using a non-thermal radiative model for the wind-collision region. We establish a conservative upper limit for the fraction of the wind kinetic power that is converted into relativistic electron acceleration, . In addition, we set a lower limit for the magnetic field in the wind-collision region as G. We also argue a putative interpretation of the emission from which we estimate and G. We conclude that multi-wavelength, dedicated observing campaigns during carefully selected epochs are a powerful tool for characterising the relativistic particle content and magnetic field intensity in colliding wind binaries.
keywords:
stars: massive, winds — radiation mechanisms: non-thermal — acceleration of particles — X-rays: stars — gamma-rays: stars1 Introduction
The role of massive stars as accelerators of Galactic cosmic rays has been gaining more interest in the recent years (e.g. Seo et al., 2018; Aharonian et al., 2019; Prajapati et al., 2019). Unfortunately, it is not possible to directly assess the efficiency of cosmic ray acceleration from observations. The study of massive colliding-wind binaries (CWBs) is key in understanding the non-thermal physics taking place in systems harbouring massive stars (De Becker et al., 2017). The signature of relativistic particles is a non-thermal spectrum, typically a power-law with additional features such as a spectral break or an exponential cutoff. In the radio band, non-thermal emission can be produced by relativistic electrons interacting with the magnetic field (Eichler & Usov, 1993). The detection of this synchrotron radiation in radio observations of CWBs have provided conclusive evidence that at least dozens of CWBs in the Galaxy are capable of accelerating cosmic rays (De Becker & Raucq, 2013). The most accepted scenario is that relativistic particles accelerate via diffusive shock acceleration in the strong shocks of the wind-collision region (WCR; Pittard & Dougherty, 2006). However, the cosmic ray acceleration efficiency cannot be proven from radio data alone (e.g. del Palacio et al., 2016, an references therein). Therefore, additional information of the high-energy spectrum of CWBs is required in order to make progress in the characterisation of their non-thermal physics.
The idea that CWBs can produce significant non-thermal emission at high energies (X-rays and -rays) is supported by the detection of such a radiation from the exceptional binary -Carinae (Tavani et al., 2009b; Reitberger et al., 2015; Hamaguchi et al., 2018; H. E. S. S. Collaboration et al., 2020), although this fascinating object is hardly representative for CWBs in general. Another CWB, Vel, has also been likely detected at -rays (Pshirkov, 2016; Martí-Devesa et al., 2020). However, none of these two systems has been detected as a non-thermal radio emitter, most likely due to synchrotron emission being self-absorbed in the system (e.g. Benaglia et al., 2019). If more CWBs are confirmed as non-thermal emitters at high energies, it will be possible to assess the role of CWBs as cosmic ray injectors. Moreover, it will give compelling support to the idea that massive binary systems are frequently -ray emitters (Benaglia & Romero, 2003; De Becker et al., 2017).
In this work, we focus on the study of the high-energy emission from the extreme binary HD 93129A. This system, located in the core of the young star cluster Trumpler 14, is the most massive un-evolved binary in the solar vicinity. It is made up by two O2 stars that are among the earliest, hottest, most luminous, and with highest mass-loss rates in the Galaxy (Walborn et al., 2002; Maíz Apellániz et al., 2008). The most recent published ephemeris (Maíz Apellániz et al., 2017) yielded a binary period of years, a periastron passage in , and an orbital inclination (i.e., nearly edge-on). We have kept obtaining VLTI astrometry of the HD 93 129 Aa,Ab visual pair after the orbital solution that was published in Maíz Apellániz et al. (2017). The new data includes three post-periastron observations that help to significantly reduce the uncertainties in the orbital determination. Regarding the most relevant parameters for this study, the time of periastron passage is now tightly constrained to (i.e., a 1- uncertainty of just 2 months), and the distance at periastron is also well constrained within a uncertainty, namely as mas ( AU). In addition, the non-thermal synchrotron radiation from the WCR has been resolved in radio by Benaglia et al. (2015), allowing for a partial characterisation of the relativistic particle energy distribution, and confirming that particle acceleration occurs in this binary.
We conducted our high-energy observational campaign towards this system near its periastron passage. The high-energy non-thermal emission from the WCR, produced by inverse Compton scattering of stellar photons, was expected to peak towards periastron due to the increased number of target stellar photons. The non-thermal emission from this system was predicted by del Palacio et al. (2016) using a broadband radiative model for the WCR that takes into account (i) the evolution of the accelerated particles streaming along the shocked region, (ii) the emission by different radiative processes, and (iii) the attenuation of the emission propagating through the local matter and radiation fields. On the basis of their analysis, del Palacio et al. (2016) suggested that HD 93129A was a promising candidate for detecting high-energy emission close to its periastron passage. A multi-wavelength observational campaign was carried out to get a complete picture of this event. In this work, we present the analysis of high-energy observations performed with Chandra (soft X-rays, 0.3–10 keV), NuSTAR (hard X-rays, 3–79 keV) and AGILE (-rays, 50 MeV–300 GeV) close to periastron.
The paper is organised as follows. The description of the observations is given in Sect. 2, and the procedure adopted to reduce and analyse each data set in Sect. 3. We present the results from this analysis in Sect 4. In Sect. 5 we discuss the constraints of our results in the context of theoretical models, and we present a summary and concluding remarks in Sect 6.
2 Observations
We observed the binary HD 93129A close to its periastron passage in 2018. A summary of the analysed observations is presented in Table 1. In the following subsections we describe them in more detail.
| Instrument | Obs. ID | Date (MJD) | Exposure time (ks) | Effective time (ks) |
|---|---|---|---|---|
| Chandra | 4495 | 53269.7 | 58.06 | 57.33 |
| Chandra | 20152 | 58288.4 | 25.06 | 23.84 |
| Chandra | 20153 | 58343.1 | 25.06 | 23.84 |
| NuSTAR | 30402001002 | 58290.76 | 27.59 | 27.40 |
| NuSTAR | 30402001004 | 58350.03 | 33.07 | 32.20 |
2.1 Chandra observations
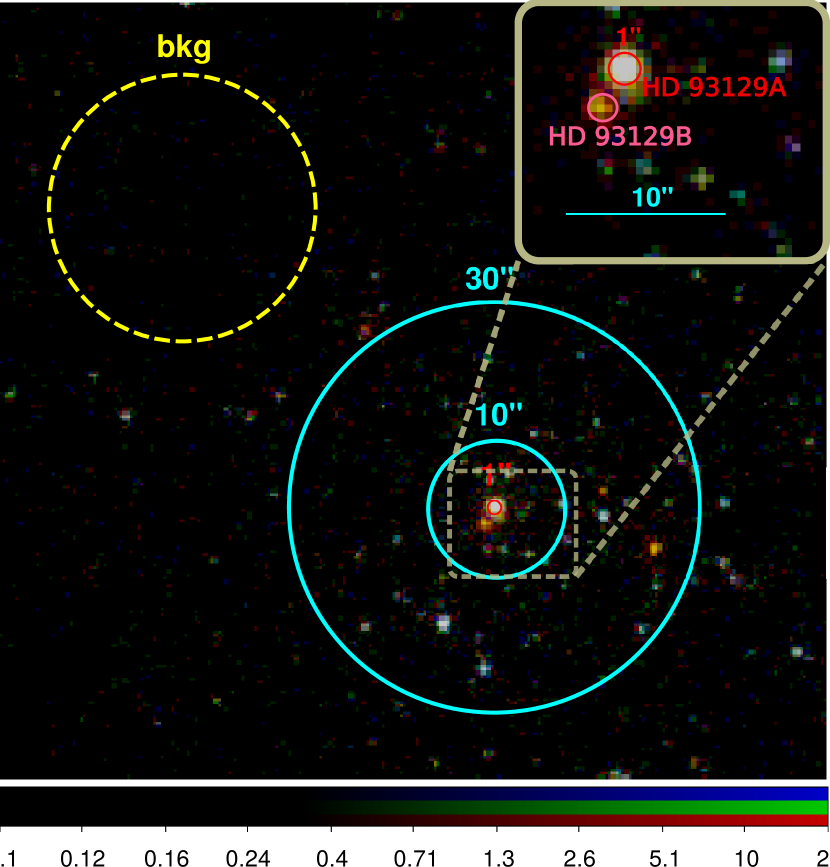
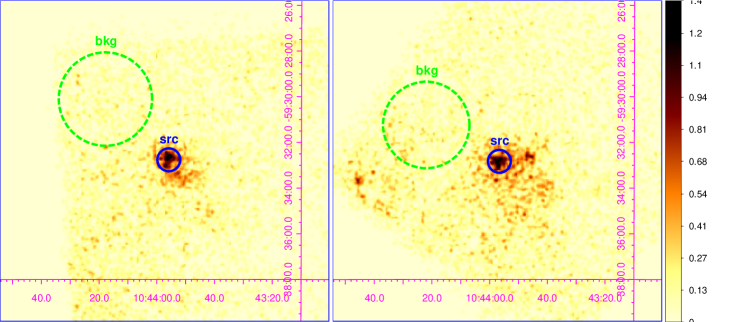
The Chandra X-Ray Observatory is unique in terms of the high angular resolution that it reaches in the X-ray band. The ACIS instrument on board of the satellite is capable of focusing X-rays with energies in the range 0.3–10 keV with subarcsecond resolution (Weisskopf et al., 2002a). This is particularly useful for our study as it allows us to quantify the contamination from background sources such as the Trumpler 14 association. An image of the field of vew of HD 93129A is shown in Fig. 1.
Since we are interested in studying the continuum emission from HD 93129A (i.e., not the detailed spectral lines), we restrict our analysis to on-axis observations without gratings. We found one archival observation (Obs. id. 4495) from 2004 with 58 ks exposure taken with ACIS-I. In addition, we have observations from June and August 2018 (Obs. id. 20152 and 20153, respectively), both with 25 ks exposure taken with ACIS-S.
We reduced the Chandra data using CIAO v.4.11 (Fruscione et al., 2006). For all the data sets we used the CIAO task chandra_repro to reprocess the data using the latest calibration files available (CALDB v.4.8.4.1).
The source spectra were extracted using the task specextract with the options appropriate for point source analysis (weight=no and correctpsf=yes). When considering a larger region ( or ) to estimate contamination by nearby sources, weight was set to yes. We found little variation between both observations from 2018 (less than 2% in the integrated flux above 3 keV), so the task combine_spectra was used to combine their spectra. Finally, we used the task ftgrouppha from HEASOFT v.6.26 to group the spectra with the optimal binning scheme by Kaastra & Bleeker (2016).
2.2 NuSTAR observations
The NuSTAR X-ray observatory, launched in 2012, counts with two co-aligned hard X-ray grazing incidence telescopes labelled by their focal plane modules FPMA and FPMB. These instruments are capable of observing in the 3–79 keV energy range with an angular resolution of 18″(half power diameter of 58″; Harrison et al., 2013).
NuSTAR observations with 30 ks exposure were performed within a week of the Chandra observations. This makes both data sets almost simultaneous considering the expected variability timescale. The nupipeline task was used to create level 2 data products. We used the option saacalc=2 saamode=optimized tentacle=yes to filter high background epochs. This leads to data loss111http://www.srl.caltech.edu/NuSTAR_Public/NuSTAROperationSite/SAA_Filtering/SAA_Filter.php.. We used the nuproducts task to create level 3 data products. We present an image (3–11 keV; channels 35–235) in Fig. 7, showing the selected source and background extraction regions for each observation.
2.3 AGILE observations
We analysed the data collected between 01/01/2018 and 31/12/2018 by the Gamma-Ray Imaging Detector (GRID; Barbiellini et al., 2002; Prest et al., 2003) on board the AGILE satellite (see Tavani et al., 2009a, for a detailed description of the AGILE payload). The AGILE-GRID is sensitive in the 30 MeV–50 GeV energy band. The point spread function (PSF) at 100 MeV and 400 MeV is and (68% containment radius), respectively (Sabatini et al., 2015). We restricted our analysis to photon energies from 100 MeV to 50 GeV. The angular resolution of AGILE in this range is , so that significant contamination from sources close to HD 93129A is expected.
Since 2009 AGILE observes in ‘spinning’ mode, covering a large fraction of the sky with a controlled rotation of the pointing axis. In this observing mode, typical two-day integration-time sensitivity for sources in the Galactic plane and photon energy above 100 MeV is photons cm-2 s-1 ().
The analysis of the AGILE-GRID data was carried out with the new Build 23 scientific software, FM3.119 calibrated filter and I0025 response matrices. The consolidated archive, available from the ASI Data Center (ASDCSTDk), was analyzed by applying South Atlantic Anomaly event cuts and Earth albedo filtering. Only incoming -ray events with an off-axis angle lower than were selected for the analysis. Statistical significance and flux determination of the point sources were calculated by using the AGILE multi-source likelihood analysis (MSLA) software (Bulgarelli et al., 2012) based on the Test Statistic (TS) method as formulated by Mattox et al. (1996). This statistical approach provides a detection significance assessment of a -ray source by comparing maximum-likelihood values of the null hypothesis (no source in the model) with the alternative hypothesis (point source in the field model). In this work we report 68% confidence level flux upper limits if TS (detection significance ). To estimate the likelihood of a detection, two different considerations were made to account for multiple nearby sources: i) excluding -Car, and ii) including -Car. For each of these background models we constructed weekly and monthly binned light-curves.
3 Spectral fitting
The X-ray spectrum of a CWB has many physical components produced by the two individual stellar winds and the two shocked winds. The individual stellar winds produce only low energy X-rays (typically keV, Owocki et al., 1988), whereas the shocked winds can produce hard X-rays above 3 keV via thermal emission or by IC scattering of stellar photons by relativistic electrons (Hamaguchi et al., 2018). These emission components are affected by absorption by the intertellar medium and within the stellar winds (Cohen et al., 2011). This means that a realistic and physically consistent model requires several components, which unfortunately leads to a degeneracy when fitting real data. In practice, the observed spectrum can be well approximated with a two-temperature apec222http://www.atomdb.org/ component together with a phabs (Anders & Grevesse, 1989) absorption component (Pittard, 2010). The apec is an optically thin plasma thermal emission model that has three parameters: the plasma temperature (), normalisation (), and abundance (). This model is adequate to represent the X-ray emission from a hot plasma such as those produced by hot stellar winds of massive stars (Feldmeier et al., 1997; Owocki et al., 2013) and CWBs (Stevens et al., 1992; Pittard & Parkin, 2010; Hamaguchi et al., 2018). The low temperature apec includes the thermal emission from the individual stellar winds and the outer (colder) regions of the WCR. The high-temperature apec represents the thermal emission from near the apex of the WCR. In addition, a multiplicative phabs model is used as an effective absorption component that takes into account the attenuation in the ISM and the stellar winds. We note that this model, despite being an oversimplification, is sufficient to qualitatively characterise the spectrum of the source (see Sect. 4.1). An additional power-law component can also be introduced to account for putative non-thermal emission. Finally, we stress that this study is focused on the high-energy emission, so a detailed spectral fitting of low energy photons ( keV) will be addressed in a separate work, together with a detailed analysis of the temporal variability of such thermal emission.
4 Results
4.1 Chandra
We aim to characterise the X-ray spectrum of HD 93129A and its environment using the Chandra data. In Fig. 1 we show the Chandra field of view centred at the position of HD 93129A. The source is resolved thanks to Chandra’s high angular resolution ( on axis). Several sources are detected within from HD 93129A. We therefore extract the spectrum from HD 93129A using a circular region so that the background/foreground contamination is minimal. The PSF is such that it ensures that almost 100% of the photons with keV, and for those with keV, are captured (Weisskopf et al., 2002b).
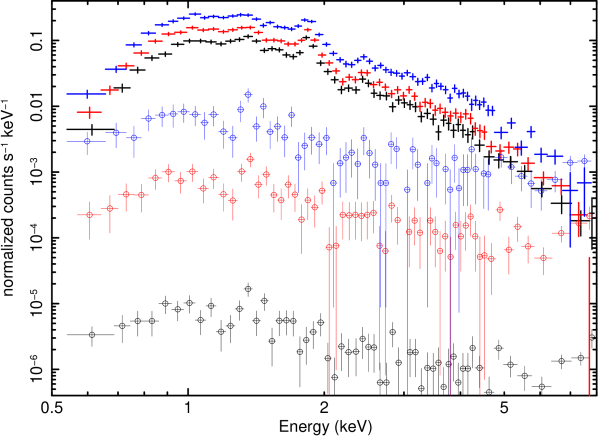
We compare the spectra from the 2004 and 2018 observations in Fig. 2.
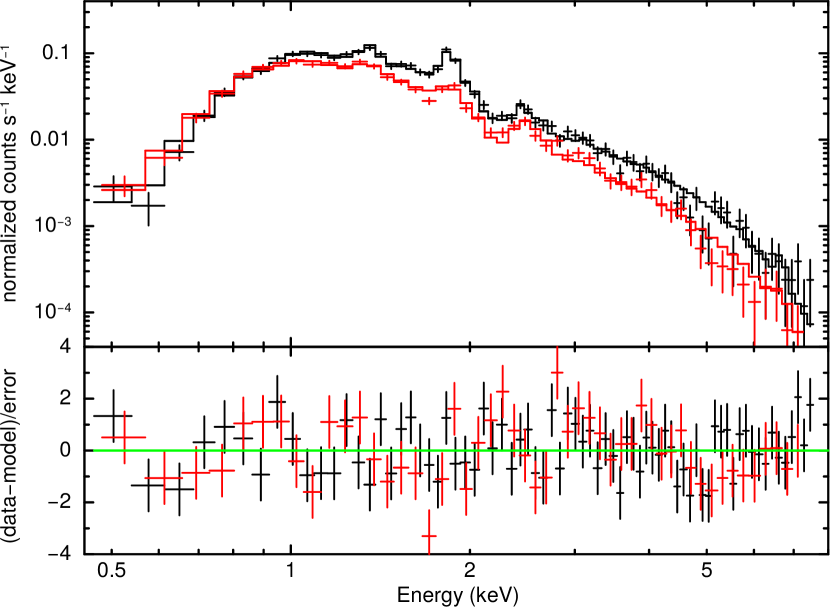
The source was detected up to 8 keV. We fitted both spectra simultaneously with a model [phabs*(vapec1+vapec2)]. We considered the same element abundances for both vapec components. We defined a common abundance for all elements except Si and S, which had prominent emission lines in the spectra, and Fe, which had a significantly lower abundance than the rest. We tried to minimise the amount of free parameters to fit while still obtaining a good spectral fit. For that reason, we tied the abundances of and Fe between epochs, and allowed only S and Si abundances to vary. The temperature of the colder vapec component, , was also tied between epochs. The values of , , and normalisations and , were fitted independently for each epoch. The best fit values are shown in Table 2. We found that between 2004 and 2018 the observed flux increased by more than 50% in the 0.5–3 keV range and 100% in the 3–8 keV range.
| extraction region | extraction region | |||
| Parameter | 2004 | 2018 | 2004 | 2018 |
| (1022 cm-2) | ||||
| Si | ||||
| S | ||||
| Fe | ||||
| (keV) | ||||
| ( cm-5) | ||||
| (keV) | ||||
| ( cm-5) | ||||
| ( erg cm-2 s-1) | ||||
| ( erg cm-2 s-1) | ||||
| /d.o.f. () | 140.7/110 (1.40) | 174.3/124 (1.40) | ||
In order to compare the Chandra and NuSTAR spectra, we need to use a extraction region for both. For this reason, we compared how selecting a extraction region affected the Chandra spectrum from 2018. We fitted the Chandra spectrum in the 3.0–7.6 keV energy range (the maximum energy is set by the larger background contamination dominating the spectrum, see Fig. 8) for two different extraction regions of radii and . We tested whether a complex model was required to fit the spectrum in this energy range. For this we checked that in this energy range the contribution from the low temperature vapec and from the absorption phabs were negligible. We therefore fitted the spectra with a single high temperature apec component. This component has keV for both extraction regions. We conclude that there is no significant spectral shape difference in the 3–7.6 keV energy range induced by the increased background contamination in the 2018 Chandra spectra extracted from a region with respect to the one from a region.
In addition, we also checked the 2004–2018 variability considering a extraction region. The spectral fitting parameters are summarised in Table 2. In this case, the flux between the two epochs increased only in in the 0.5–3 keV band and in the 3–8 keV band; similar increase factors were obtained for a region as well (Fig. 8). Interestingly, we can also estimate the average flux of the surrounding sources within an annulus given by the difference between the - and the -extraction regions. We obtain that the flux variations for the nearby (background) sources between 2004 and 2018 are in both of these energy bands (this can be appreciated more clearly in Fig. 9). Therefore, the observed flux variability within the region seems to be governed by HD 93129A. We took into account this information when interpreting the NuSTAR data in which the binary is not resolved from the surrounding sources (Fig. 1).
4.2 NuSTAR
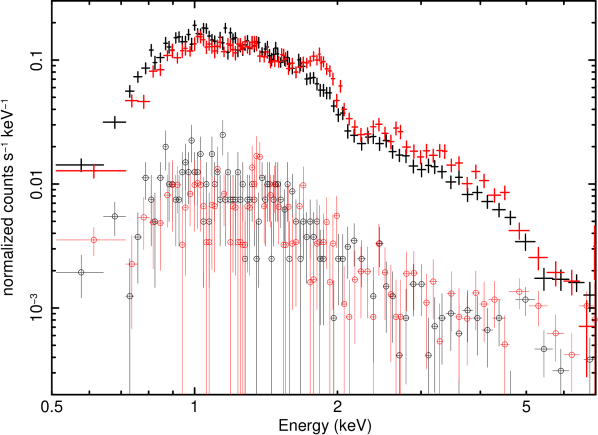
The 3–18 keV fluxes between both FPMA and FPMB cameras in each observation were consistent within less than 5%. We therefore co-added both cameras using addspec. In Fig. 3 we compare the source and background spectra grouped with ftgroup. The source is detected above background with a high significance at keV ( in the 11.3–15.1 keV energy range), and with a lower significance at keV ( in the 15.2–17.8 keV energy range). We confirmed this result by selecting different background extraction regions, although the total flux in 3–10 keV can vary within depending on the selected background. Moreover, the fluxes between the two observations differ only by , which is almost within 1- level and can be attributed to calibration uncertainties (up to 10%; Madsen et al., 2015) and a different background level (see top panel from Fig. 3). We therefore assume that the whole NuSTAR data set is comparable and co-add both observing epochs with addspec.
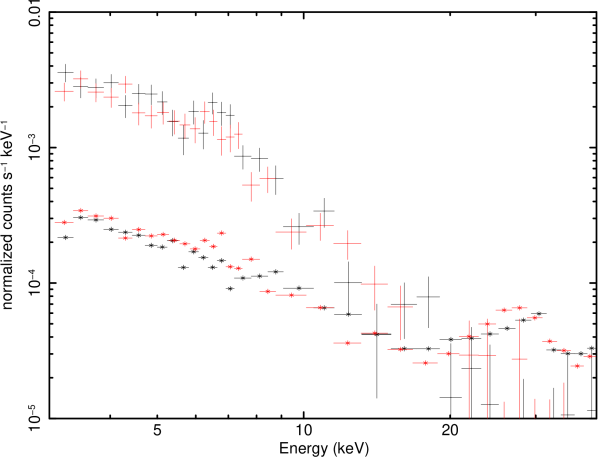
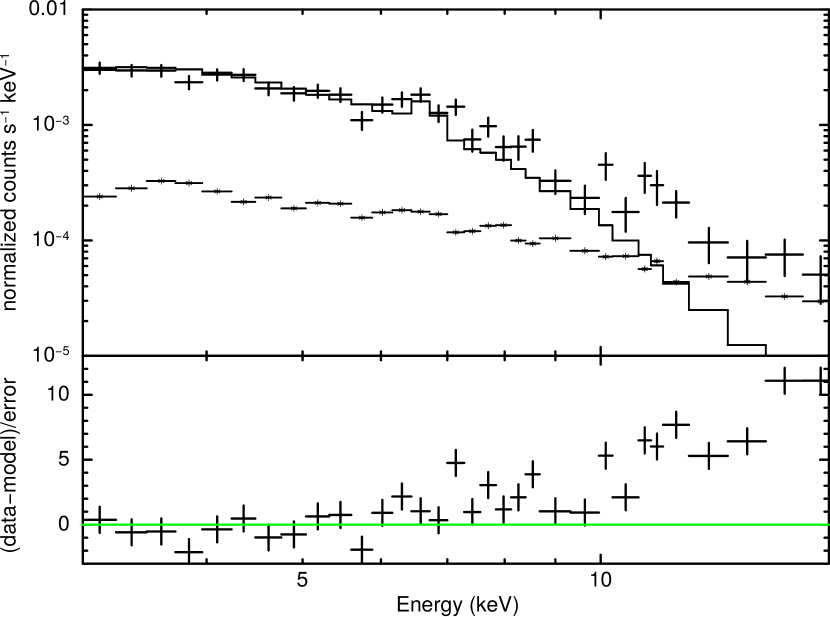
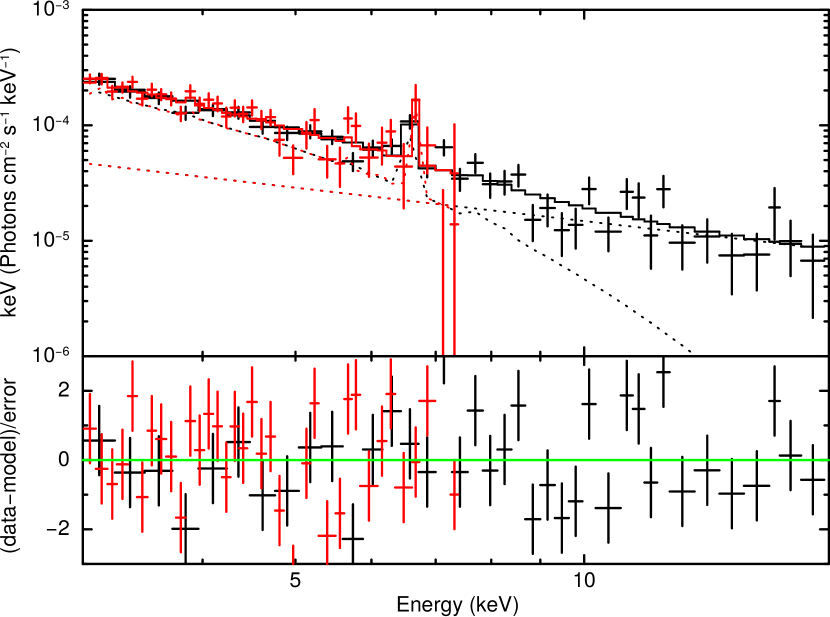
In Fig. 3 we plotted together the X-ray data from Chandra and NuSTAR. The spectra seemed to match well up to 6–7 keV. To check this, we fitted the NuSTAR spectrum below 7 keV with a model, and the Chandra spectrum from the 30″-region with the same model times a constant. The fitted value of the constant is , which is fully consistent with not needing a re-scaling for the data sets (i.e., setting the constant to one). We found that the model fitted using only the Chandra data matches very well the NuSTAR spectrum up to 6–7 keV. However, the Chandra model underestimates the emission above 7 keV. This could be simply due to a poorly constrained high-energy spectrum in the Chandra data resulting in a bad extrapolation of the fitted model. Regardless of its origin, the fact that this model falls below the observed flux in the NuSTAR spectrum suggests the presence of an additional component, either thermal and hotter or non-thermal.
In Fig. 4 we show a fit to the Chandra and NuSTAR spectra using an [apec + power-law] model. This fit yields keV, and (, with 87 d.o.f., and ). We use cflux to obtain the unabsorbed flux from the model and obtain erg s-1 cm-2 and erg s-1 cm-2. We also calculate the individual unabsorbed flux of the power law component and obtain erg s-1 cm-2.
We also considered the possibility of having only thermal emission. We fitted the Chandra + NuSTAR data with an [apec + apec] model, which yields (tied for both components), keV and keV (, with 80 d.o.f., and ). The unabsorbed fluxes in this case are erg s-1 cm-2and erg s-1 cm-2.
4.3 AGILE
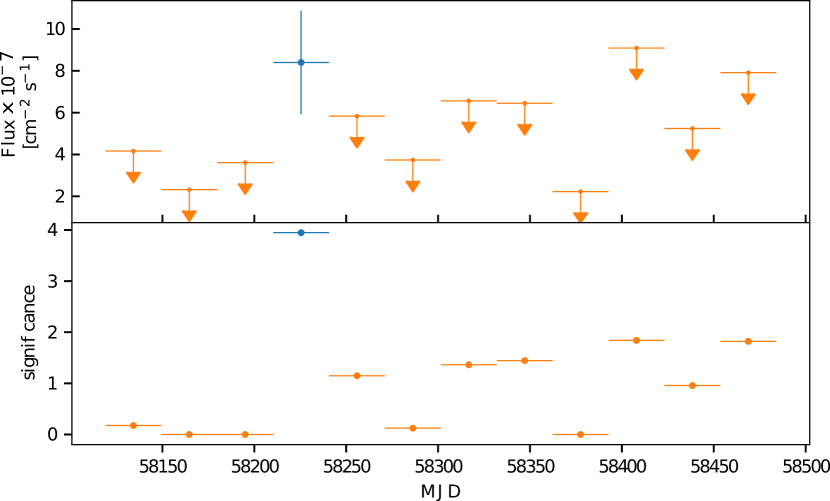
The result from the analysis of the AGILE data is consistent with an upper limit to the flux in 50 MeV–100 GeV of cm-2 s-1. This is confirmed by the light-curve obtained for HD 93129A using both a weekly and a monthly binning and including the background emission from multiple sources nearby. An example light curve is shown in Fig. 10. We note that there is a low significance detection of emission near April 2018 at a 4- level if emission from -Car is not considered. However, it is not likely related with HD 93129A, as discussed in Sect. 5.
5 Discussion
In Sect. 4 we presented the results from the observations with Chandra, NuSTAR and AGILE. The source HD 93129A was clearly detected in the X-ray domain ( keV range), whereas in the -ray domain no significant emission was detected.
5.1 Observations versus predictions
From the analysis of the Chandra data we can conclude that there is flux variability between 2004 and 2018. This variability is more clearly seen when a small extraction region is considered. For larger extraction regions with size the background level becomes comparable to the emission from HD 93129A, and therefore the estimated variability intrinsic to HD 93129A is unreliable.
The significant long-term variability detected is qualitatively consistent with the expected orbital modulation of the X-ray emission. The theoretical expectation for a thermal X-ray emission produced by the wind-wind interaction in adiabatic conditions is that the unabsorbed flux varies as (Stevens et al., 1992). However, testing this from observations requires to fit more complex spectral models, particularly in the soft X-ray band, which is the most affected by absorption. Moreover, converting the date of observation to system separation requires a precise knowledge of the orbital parameters. For this reason we did not aim to present a quantitative analysis of the flux variability in this work.
The spectrum above 12 keV is poorly constrained. Additional uncertainties arise given that NuSTAR is unable to resolve the emission coming from a region centred at the position of HD 93129A. Thus, it is impossible to determine the actual fraction of the observed flux that corresponds to HD 93129A. Nonetheless, Chandra’s high angular resolution is capable of disentangling the different contributions up to 8 keV. We find that approximately half of the emission in the 3–8 keV range comes from the CWB. The spectral shape of the background sources is consistent with the one from HD 93129A. Moreover, the value we obtained from a power-law fit is consistent with the value of found for -Car by Hamaguchi et al. (2018). This gives further support to the idea that the CWB HD 93129A is (partly) responsible for the observed hard X-ray emission. If we assume this extrapolation remains valid above 8 keV, we expect that roughly 50% of the observed flux by NuSTAR comes from HD 93129A as well.
Whether the measured 8–18 keV flux is an upper limit or a good estimate of the emission from HD 93129A depends on the assumptions made.
-
1.
First, we can place a hard limit to the maximum flux for the power-law IC component by considering that none of the observed flux in the 8–18 keV range comes from HD 93129A. In this case we obtain erg s-1 cm-2 (considering the upper-limit).
-
2.
A similar but less restrictive constraint is obtained by stating that the flux from the power-law IC component cannot be higher than the flux from the fitted power-law component. In this case we obtain erg s-1 cm-2 (again assuming the upper limit).
-
3.
The analysis in Sect. 4.1 suggests that roughly of the observed hard X-ray flux comes from HD 93129A. In this case we can estimate the flux from the power law component as erg s-1 cm-2.
The most conservative is the first.
Assuming the hard X-ray spectrum is thermal (with solar abundances), the maximum plasma temperature for an adiabatic shock in the WCR is keV (Stevens et al., 1992), with the wind velocity in units of cm s-1. For a wind speed of (Cohen et al., 2011), maximum (i.e. close to the apex) shock temperatures keV are expected. This is within the poorly constrained values obtained in Sect. 4.2.
The CWB HD 93129A does not display a significant -ray activity as to be detected by AGILE. We note that there is a low significance detection of emission near April 2018 at a 4- level if emission from -Car is not considered. Despite -Car being a known -ray source located at just from HD 93129A (i.e., within the same beam for AGILE), during this epoch -Car was expected to be in a low -ray emission state (Balbo & Walter, 2017; White et al., 2019). Thus, it is not likely that the detected flux of cm-2 s-1 is due to -Car. Nonetheless, it is less likely that it comes from HD 93129A, as its -ray flux was expected to be increasing at that epoch and no emission was found afterwards. Moreover, under the constraints imposed by not exceeding the observed hard X-ray flux, the -ray flux predicted by our non-thermal radiative model is cm-2 s-1, which is more than four orders of magnitude below the detected -ray flux (more details in Sect. 5.2). We also considered a possible hardening in the non-thermal electron distribution as in del Palacio et al. (2016), which can enhance the -ray emission in a factor ten, but still it is not possible to account for the detected -ray flux even considering uncertainties in the system or model parameters. Finally, this emission is detected only at a 2- level in the weekly-binned light-curves, and is thus not considered to be significant. We conclude that this emission is either a statistical fluctuation or due to a variable background.
5.2 Theoretical modelling
We use an updated version of the non-thermal emission code presented in del Palacio et al. (2016) to calculate the predicted X-ray flux from HD 93129A. The modifications introduced in the model are described in Appendix B. We adopt similar parameters for the stellar winds; specifically, mass-loss rates M⊙ yr-1 and M⊙ yr-1, and wind terminal velocities km s-1 and km s-1. This model has two free parameters: the ratio between the magnetic field pressure to thermal pressure in the WCR, , and the fraction of the available power at the shocks that is converted into relativistic electrons, . The available power for particle acceleration is the wind kinetic power injected perpendicularly to the WCR, which is calculated consistently in the model. It is possible to tie these two parameters by modelling the synchrotron component revealed by radio data by Benaglia et al. (2015). In this case the relation is (del Palacio et al., 2016), which we assume holds along the orbit. However, it is not possible to break the degeneracy between these two parameters from radio data alone.
Theoretical estimates of the non-thermal X-ray flux combined with the X-ray fluxes observed in the 8–18 keV allow us to constrain . This is the only parameter that has a significant impact in determining the non-thermal X-ray flux, which is . We adopt a periastron distance of AU (see Sect. 1) and compute the model 8–18 keV flux for reasonable values of . It is also possible to estimate the magnetic field in the apex of the WCR, , by assuming that the relation between and holds along the orbit. A constant value of is consistent with scaling as . This, in turn, is consistent with a constant (or null) -field amplification factor in the WCR. Taking into account that and , we get the relation . In Fig. 5 we show at the left vertical axis the required value of in order to reach a certain 8–18 keV flux, and the corresponding value of at the right vertical axis.
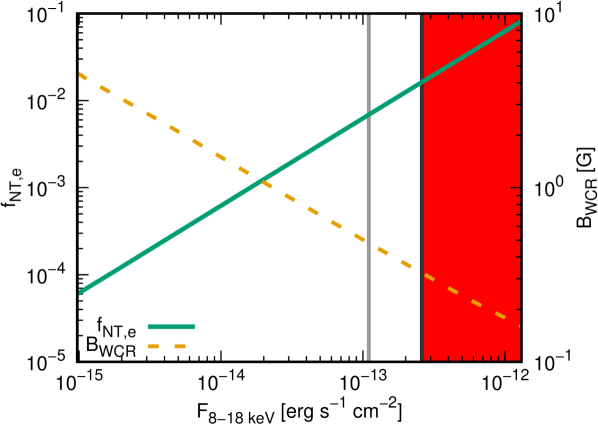
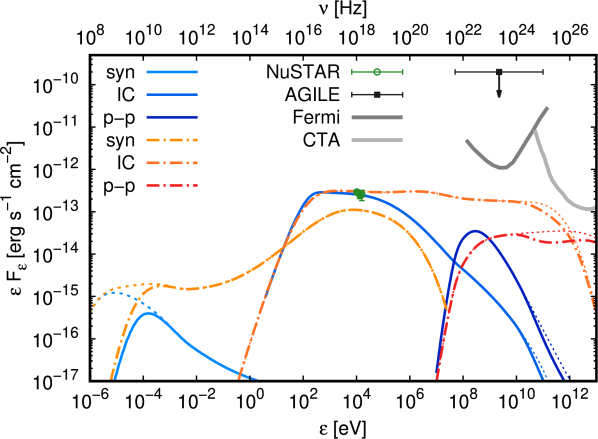
We can interpret Fig. 5 in two ways: (i) considering the upper limit to the power-law component in X-rays, from which we obtain an upper limit of and a lower limit of G (); and (ii) considering a detection at the estimated value of erg s-1 cm-2, from which we estimate and G (). For this latter case, we calculate the SED for two scenarios, one in which the injected particle energy distribution has a constant spectral index , and one more favourable for -ray production in which the injected distribution hardens at high energies ( MeV for electrons; see del Palacio et al., 2016). In Fig. 6 we show the modelled SED together with the observational data for the periastron passage. Unfortunately, further constraints to the non-thermal particle population cannot be placed using the AGILE upper limit as it is much higher than the -ray flux predicted in the most favourable scenario. In addition, as already discussed by del Palacio et al. (2016), it is difficult to observe this system in the radio band close to periastron passage: despite the intrinsic synchrotron flux increases close to periastron as it scales with , the absorption of the low-frequency photons in the stellar winds also boosts during this epoch, resulting in a reduced flux below 10 GHz.
It is possible to relate the inferred magnetic field intensity in the WCR to that in the stellar surface. At large distances from the star () the stellar magnetic field is toroidal and drops as . Following del Palacio et al. (2016, and references therein), we can express . This expression considers an Alfvén radius , a stellar rotation velocity , and also takes into account the adiabatic compression of magnetic field lines in the WCR. We set equal to the periastron separation and allow, again, for two interpretations: (i) on the one hand, we obtain G for the lower limit of G; (ii) on the other hand, we get G for the estimated value of G. Such a modest -field strength would not be sufficient to confine the winds (i.e. , as assumed). This is also consistent with insignificant emission of X-rays above keV by the individual stellar winds, which would require them to be magnetically confined (e.g. Ud-Doula et al., 2009).
We clarify that magnetic field amplification processes in the WCR (e.g. Bell, 2004; Drury & Downes, 2012; del Valle et al., 2016, for studies in the context of supernova remnants) were not considered nor computed in the calculations. If the measured magnetic field in the WCR actually results from some -field amplification, this would translate into a stellar value lower than the one determined from the sole toroidal geometric dilution and adiabatic compression.
6 Conclusions
We report the results from an observational campaign on the extreme colliding wind binary HD 93129A close to its periastron passage in 2018. The obtained optical data allowed us to determine the periastron epoch precisely (results will be presented in a forthcoming work), which we used to trigger our campaign in the high-energy domain. We observed HD 93129A with Chandra, NuSTAR, and AGILE, covering a wide range of energies in the X-ray and -ray domain. We conclude that there is no significant -ray emission from this system and the upper limit of the flux in the 50 MeV–100 GeV range, cm-2 s-1, is unconstraining for non-thermal emission models. Our main observational result is the detection of emission in the hard X-ray band with NuSTAR consistent with being (partially) produced by HD 93129A. It is not possible at this time to assess to what extent background contamination is accountable for this emission. Future observations of the source might reveal a persistent flux of the same value, which would indicate that this emission is produced by nearby sources, or a diminished flux, which would confirm HD 93129A as the responsible for this emission.
We interpret the derived hard X-ray fluxes using the tightly constrained periastron distance from the optical monitoring and the non-thermal radiative model described in del Palacio et al. (2016). This multi-zone model takes into account the relevant physical processes in the wind-collision region. The model has two parameters that can be constrained or estimated by our observations: the fraction of the wind kinetic power injected into the WCR that is converted into relativistic electron acceleration, , and the magnetic field in the wind-collision region, . We present the conclusions for two different interpretations:
-
•
Under the very conservative assumption that none of the X-ray flux above 8 keV is produced by HD 93129A, we obtain . In addition, we estimate the magnetic field in the wind-collision region as G. Neglecting possible magnetic-field amplification in the wind-collision region, we derive a lower limit for the surface stellar magnetic field of G.
-
•
We consider that of the 8–18 keV flux produced by a power-law component comes from HD 93129A. In this case we can estimate . In addition, we get G, from which we derive an upper limit for the surface stellar magnetic field G taking into account possible -field amplification.
We conclude that multi-wavelength, dedicated observing campaigns during carefully selected epochs is a powerful tool for characterising the relativistic particle content and magnetic field intensity in colliding wind binaries. This, in turn, allows to constrain the value of the magnetic field on the surface of very massive stars. We also highlight the need for more sensitive and higher angular-resolution observations in the -ray band in order to better characterise the non-thermal particle population in colliding-wind binaries.
Acknowledgements
We thank the anonymous referee for his/her comments that helped to improve the manuscript. S.d.P. thanks the Committee on Space Research (COSPAR) for support via its Capacity Building Program and its Capacity Building Fellowship Program. S.d.P., D.A. and F.G. acknowledge support from the Royal Society (RS) International Exchanges "The first step for High-Energy Astrophysics relations between Argentina and UK". F.G. acknowledges support from Athena project number 184.034.002, partly financed by the Dutch Research Council (NWO). D.A. acknowledges support from the RS. J.M.P., V.B.R. and G.E.R. acknowledge support by the Spanish Ministerio de Economía, Industria y Competitividad (MINEICO/FEDER, UE) under grants AYA2016-76012-C3-1- P, MDM-2014-0369 of ICCUB (Unidad de Excelencia ‘María de Maeztu’) and the Catalan DEC grant 2017 SGR 643. G.E.R. was also supported by PIP 0338 (CONICET). J.M.A. acknowledges support from the Spanish Government Ministerio de Ciencia, Innovación y Universidades through grant PGC2018-095 049-B-C22. R.H.B.S. acknowledges DIDULS Regular Project No. 18143. K.H. is supported by the Chandra grant GO8-19010A.
References
- Aharonian et al. (2019) Aharonian F., Yang R., de Oña Wilhelmi E., 2019, Nature Astronomy, 3, 561
- Anders & Grevesse (1989) Anders E., Grevesse N., 1989, Geochimica Cosmochimica Acta, 53, 197
- Arnaud (1996) Arnaud K. A., 1996, in Jacoby G. H., Barnes J., eds, Astronomical Society of the Pacific Conference Series Vol. 101, Astronomical Data Analysis Software and Systems V. p. 17
- Balbo & Walter (2017) Balbo M., Walter R., 2017, A&A, 603, A111
- Barbiellini et al. (2002) Barbiellini G., Fedel G., Liello F., Longo F., Pontoni C., Prest M., Tavani M., Vallazza E., 2002, Nuclear Instruments and Methods in Physics Research A, 490, 146
- Bell (2004) Bell A. R., 2004, MNRAS, 353, 550
- Benaglia & Romero (2003) Benaglia P., Romero G. E., 2003, A&A, 399, 1121
- Benaglia et al. (2015) Benaglia P., Marcote B., Moldón J., Nelan E., De Becker M., Dougherty S. M., Koribalski B. S., 2015, A&A, 579, A99
- Benaglia et al. (2019) Benaglia P., del Palacio S., Ishwara-Chandra C. H., De Becker M., Isequilla N. L., Saponara J., 2019, A&A, 625, A99
- Bulgarelli et al. (2012) Bulgarelli A., Chen A. W., Tavani M., Gianotti F., Trifoglio M., Contessi T., 2012, A&A, 540, A79
- Cohen et al. (2011) Cohen D. H., Gagné M., Leutenegger M. A., MacArthur J. P., Wollman E. E., Sundqvist J. O., Fullerton A. W., Owocki S. P., 2011, MNRAS, 415, 3354
- De Becker & Raucq (2013) De Becker M., Raucq F., 2013, A&A, 558, A28
- De Becker et al. (2017) De Becker M., Benaglia P., Romero G. E., Peri C. S., 2017, A&A, 600, A47
- Dorman & Arnaud (2001) Dorman B., Arnaud K. A., 2001, in Harnden Jr. F. R., Primini F. A., Payne H. E., eds, Astronomical Society of the Pacific Conference Series Vol. 238, Astronomical Data Analysis Software and Systems X. p. 415
- Drury & Downes (2012) Drury L. O., Downes T. P., 2012, MNRAS, 427, 2308
- Eichler & Usov (1993) Eichler D., Usov V., 1993, ApJ, 402, 271
- Feldmeier et al. (1997) Feldmeier A., Puls J., Pauldrach A. W. A., 1997, A&A, 322, 878
- Fruscione et al. (2006) Fruscione A., et al., 2006, CIAO: Chandra’s data analysis system. p. 62701V, doi:10.1117/12.671760
- Funk et al. (2013) Funk S., Hinton J. A., CTA Consortium 2013, Astroparticle Physics, 43, 348
- H. E. S. S. Collaboration et al. (2020) H. E. S. S. Collaboration et al., 2020, arXiv e-prints, p. arXiv:2002.02336
- Hamaguchi et al. (2018) Hamaguchi K., et al., 2018, NatAs,
- Harrison et al. (2013) Harrison F. A., et al., 2013, ApJ, 770, 103
- Kaastra & Bleeker (2016) Kaastra J. S., Bleeker J. A. M., 2016, A&A, 587, A151
- Khangulyan et al. (2014) Khangulyan D., Aharonian F. A., Kelner S. R., 2014, ApJ, 783, 100
- Madsen et al. (2015) Madsen K. K., et al., 2015, ApJS, 220, 8
- Maíz Apellániz et al. (2008) Maíz Apellániz J., Walborn N. R., Morrell N. I., Nelan E. P., Niemela V. S., Benaglia P., Sota A., 2008, in Revista Mexicana de Astronomia y Astrofisica Conference Series. pp 55–55 (arXiv:astro-ph/0702514)
- Maíz Apellániz et al. (2017) Maíz Apellániz J., Sana H., Barbá R. H., Le Bouquin J. B., Gamen R. C., 2017, MNRAS, 464, 3561
- Martí-Devesa et al. (2020) Martí-Devesa G., Reimer O., Li J., Torres D. F., 2020, arXiv e-prints, p. arXiv:2001.02708
- Mattox et al. (1996) Mattox J. R., et al., 1996, ApJ, 461, 396
- Merten et al. (2017) Merten L., Becker Tjus J., Eichmann B., Dettmar R.-J., 2017, Astroparticle Physics, 90, 75
- Muijres et al. (2011) Muijres L. E., de Koter A., Vink J. S., Krtička J., Kubát J., Langer N., 2011, A&A, 526, A32
- Owocki et al. (1988) Owocki S. P., Castor J. I., Rybicki G. B., 1988, ApJ, 335, 914
- Owocki et al. (2013) Owocki S. P., Sundqvist J. O., Cohen D. H., Gayley K. G., 2013, MNRAS, 429, 3379
- Pittard (2010) Pittard J. M., 2010, MNRAS, 403, 1633
- Pittard & Dougherty (2006) Pittard J. M., Dougherty S. M., 2006, MNRAS, 372, 801
- Pittard & Parkin (2010) Pittard J. M., Parkin E. R., 2010, Monthly Notices of the Royal Astronomical Society, 403, 1657
- Prajapati et al. (2019) Prajapati P., Tej A., del Palacio S., Benaglia, et al. P., 2019, arXiv e-prints,
- Prest et al. (2003) Prest M., Barbiellini G., Bordignon G., Fedel G., Liello F., Longo F., Pontoni C., Vallazza E., 2003, Nuclear Instruments and Methods in Physics Research A, 501, 280
- Pshirkov (2016) Pshirkov M. S., 2016, MNRAS, 457, L99
- Reitberger et al. (2015) Reitberger K., Reimer A., Reimer O., Takahashi H., 2015, A&A, 577, A100
- Sabatini et al. (2015) Sabatini S., et al., 2015, ApJ, 809, 60
- Seo et al. (2018) Seo J., Kang H., Ryu D., 2018, JKAS, 51, 37
- Stevens et al. (1992) Stevens I. R., Blondin J. M., Pollock A. M. T., 1992, ApJ, 386, 265
- Tavani et al. (2009a) Tavani M., et al., 2009a, A&A, 502, 995
- Tavani et al. (2009b) Tavani M., et al., 2009b, ApJ, 698, L142
- Ud-Doula et al. (2009) Ud-Doula A., Owocki S. P., Townsend R. H. D., 2009, MNRAS, 392, 1022
- Walborn et al. (2002) Walborn N. R., et al., 2002, AJ, 123, 2754
- Weisskopf et al. (2002a) Weisskopf M. C., Brinkman B., Canizares C., Garmire G., Murray S., Van Speybroeck L. P., 2002a, PASP, 114, 1
- Weisskopf et al. (2002b) Weisskopf M. C., Brinkman B., Canizares C., Garmire G., Murray S., Van Speybroeck L. P., 2002b, PASP, 114, 1
- White et al. (2019) White R., Breuhaus M., Konno R., Ohm S., Reville B., Hinton J. A., 2019, arXiv e-prints, p. arXiv:1911.01079
- del Palacio et al. (2016) del Palacio S., Bosch-Ramon V., Romero G. E., Benaglia P., 2016, A&A, 591, A139
- del Palacio et al. (2018) del Palacio S., Bosch-Ramon V., Müller A. L., Romero G. E., 2018, A&A, 617, A13
- del Valle et al. (2016) del Valle M. V., Lazarian A., Santos-Lima R., 2016, MNRAS, 458, 1645
Appendix A Images
We present here additional figures that complement our analysis. In Fig. 7 we show a NuSTAR-FPMB image of the field of view for the two observing epochs; FPMA image (not shown) is similar. The background extraction region was selected within the same chip that contained the source. Significant and variable background emission is observed close to the position of HD 93129A.
In Fig. 8 we show the comparison of the Chandra source and background spectra for different source extraction regions of radii , , and . For the source extraction region the background is negligible, whereas for radii it becomes comparable to the source emission at energies above 7 keV. In addition, in Fig. 9 we compare the combined Chandra spectra of the nearby sources to HD 93129A between 2004 and 2018. The spectra were extracted from an annulus of outer radius and an inner radius of centred at the position of HD 93129A. The combined spectra from these sources are remarkably stable above 2 keV, where the continuum dominates. The apparent discrepancy below 2 keV is probably caused by a difference in the ACIS instrumental response: ACIS-S has a better soft band sensitivity than ACIS-I, but the soft band efficiency of all ACIS sensors has declined recently with contamination on the optical blocking filter. ACIS-S also shows a moderately strong feature around keV. The flux difference between the two epochs is in the 0.5–3 keV range and in the 3–8 keV energy range.
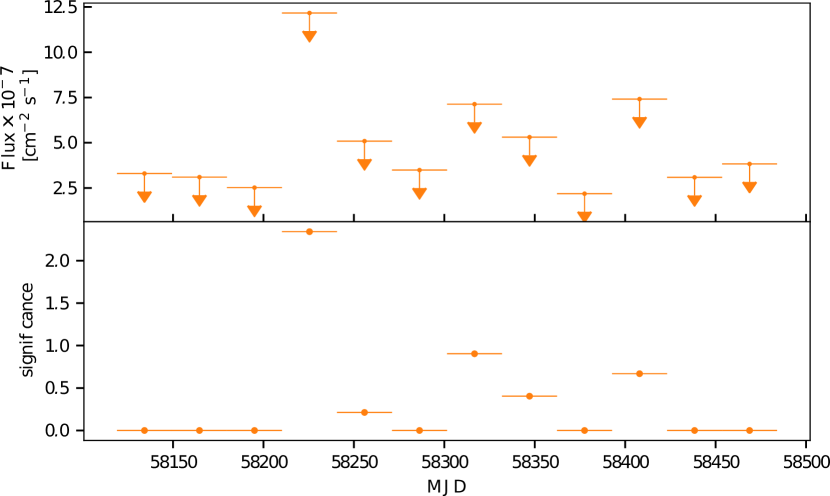
Finally, in Fig. 10 we present the monthly light curves obtained with AGILE for two different background models. When the possible contribution from -Car is not considered, a detection with a 4- significance is obtained in April 2018. However, when -Car is included as an additional background source the detection is not significant and only upper limits are obtained.
Appendix B Non-thermal emission model
Here we present a review of the non-thermal radiation model used. This model is an update to the one presented in del Palacio et al. (2016), suitable for adiabatic and quasi-stationary shocks with a laminar flow. The WCR structure is treated as a 2-dimensional surface under a thin shock approximation. We assume that relativistic particles are accelerated once a fluid line from the stellar wind enters the WCR region. These particles flow together with the shocked fluid which convects the ambient magnetic field. As they stream, particles cool down due to different processes and produce broadband radiation. This emission is corrected for absorption by interaction with the local matter and radiation fields.
The relativistic particle distribution injected at a given position in the WCR is a power law with the spectral index given by the radio observations. The normalisation of this distribution is such that the injected power is a fraction of the total power available for particle acceleration (which is only a fraction of the total power of the stellar winds; del Palacio et al., 2016). This power is distributed in electrons and protons as . It is usual to define , with (see Merten et al., 2017, for a discussion of uncertainties in this value). For a canonical value of , we expect , but with a large uncertainty.
The emission in the radio band is produced by synchrotron emission. This radiation can be significantly attenuated by free-free absorption in the ionised stellar winds. The non-thermal X-ray emission is produced by anisotropic inverse-Compton up-scattering of stellar photons. This process can dominate the -ray emission as well, competing with proton-proton inelastic collisions. The -ray photons can be absorbed in the stellar radiation field creating secondary electron-positron pairs.
We introduced the following modifications to the model in del Palacio et al. (2016):
-
•
The angle such that the observed distance between the stars is is no longer a free parameter of the model333In del Palacio et al. (2016) this angle was referred as , which can be confused with the orbital inclination.. A value of is used in accordance with the most recent orbital ephemeris.
-
•
We considered an increased free-free opacity at radio-frequencies due to clumping in the stellar winds. This effect enhances the opacity by a factor , where is the volume filling factor of the wind (Muijres et al., 2011). In this case there is no need to adopt a large value of to reproduce the spectral break at low frequencies as done in del Palacio et al. (2016). Instead, a typical value of MeV yields a good fit of the radio spectra.
-
•
The IC spectra is calculated using the expressions by Khangulyan et al. (2014) suitable for black-body-like target photon fields. This reduces the computation time significantly.
-
•
A small correction was introduced in the way particle evolution along stream lines is calculated. This considers variations of cooling times from cell to cell in the emitter (Eq. 16 from del Palacio et al., 2018).