Using quasar X-ray and UV flux measurements to constrain cosmological model parameters
Abstract
Risaliti and Lusso have compiled X-ray and UV flux measurements of 1598 quasars (QSOs) in the redshift range , part of which, , is largely cosmologically unprobed. In this paper we use these QSO measurements, alone and in conjunction with baryon acoustic oscillation (BAO) and Hubble parameter [] measurements, to constrain cosmological parameters in six different cosmological models, each with two different Hubble constant priors. In most of these models, given the larger uncertainties, the QSO cosmological parameter constraints are mostly consistent with those from the BAO + data. A somewhat significant exception is the nonrelativistic matter density parameter where QSO data favor in most models. As a result, in joint analyses of QSO data with + BAO data the one-dimensional distributions shift slightly toward larger values. A joint analysis of the QSO + BAO + data is consistent with the current standard model, spatially-flat CDM, but mildly favors closed spatial hypersurfaces and dynamical dark energy. Since the higher values favored by QSO data appear to be associated with the part of these data, and conflict somewhat with strong indications for from most data as well as from the cosmic microwave background anisotropy data at , in most models, the larger QSO data is possibly more indicative of an issue with the QSO data than of an inadequacy of the standard flat CDM model.
keywords:
(cosmology:) cosmological parameters – (cosmology:) observations – (cosmology:) dark energy1 Introduction
It is a well-established fact that the universe is now undergoing accelerated cosmological expansion. In general relativity, dark energy is responsible for the accelerated cosmological expansion. The simplest cosmological model consistent with this accelerated expansion is the spatially flat CDM model, the current standard model (Peebles 1984). In this model the accelerated expansion is powered by the time-independent and spatially homogenous cosmological constant () energy density. This model is consistent with many observations (Alam et al., 2017; Farooq et al., 2017; Scolnic et al., 2018; Planck Collaboration, 2018) when dark energy contributes about of the current cosmological energy budget, approximately 25 contributed from cold dark matter (CDM), and the remaining 5 due to baryons. The standard model assumes flat spatial hypersurfaces.
While the CDM model is consistent with many observations, it is based on the assumption of a spatially-homogeneous and time-independent dark energy density that is difficult to theoretically motivate. Additionally, data do not demand a time-independent dark energy density, and models in which the dark energy density decreases with time have been studied. In addition to the CDM model, here we consider two dynamical dark energy models, the XCDM parametrization with a dynamical dark energy -fluid and the CDM model with a dynamical dark energy scalar field .
While cosmological models with vanishing spatial curvature are consistent with many observations, current observations do not rule out a little spatial curvature.111Discussion of observational constraints on spatial curvature may be traced through Farooq et al. (2015), Chen et al. (2016), Yu Wang (2016), Rana et al. (2017), Ooba et al. (2018a, b, c), DES Collaboration (2019), Yu et al. (2018), Park Ratra (2018a, b, c, 2019, 2020), Wei (2018), Xu et al. (2019), Ruan et al. (2019), Li et al. (2019), Giambó et al. (2019), Coley (2019), Eingorn et al. (2019), Jesus et al. (2019), Handley (2019), Wang et al. (2019), Zhai et al. (2019), Geng et al. (2020), Kumar et al. (2020), Efstathiou Gratton (2020), Di Valentino et al. (2020) and references therein. So here, in addition to flat models, we also consider non-flat models with non-zero spatial curvature energy density. In this paper we test six different cosmological models, three spatially flat and three spatially non-flat.
These cosmological models have mostly been tested with data from low redshifts up to redshift baryon acoustic oscillation (BAO) measurements, as well as with cosmic microwave background (CMB) anisotropy data at . They are poorly tested against data in the redshift range between and . To establish an accurate cosmological model and tighten cosmological parameter constraints, it is important to use additional cosmological probes, such as the quasar (QSO) flux - redshift data studied here. These QSO data probe the universe to and are one of the few data sets that probe the redshift range.222In the last decade or so, HII starburst galaxy data has reached to (Siegel et al., 2005; Mania Ratra, 2012; González-Morán et al., 2019, and references therein) while gamma ray burst data reach to (Lamb Reichart, 2000; Samushia Ratra, 2010; Demianski et al., 2019, and references therein).
In 2015 Risaliti and Lusso published a systematic study that used quasar data to constrain cosmological parameters. The Risaliti Lusso (2015) quasar sample has 808 quasar measurements extending over a redshift range which covers a significant part of the universe. These measurements have been used to constrain cosmological parameters (Risaliti Lusso, 2015; López-Corredoria et al., 2016; Lazkoz et al., 2019; Khadka Ratra, 2020) and the constraints obtained are consistent with those obtained from most other cosmological probes. However, the QSO data constraints (Khadka Ratra, 2020) have larger error bars than those that result from BAO, Hubble parameter[], and some other data. This is because the empirical relation between the quasar’s UV and X-ray luminosity, that is the basis of this method, has a large dispersion (). In 2019 Risaliti and Lusso enhanced these data by compiling a larger sample of quasars (Risaliti Lusso, 2019). For cosmological purposes, they selected 1598 quasars from a much larger number of sources. The dispersion of the relation obtained from the new set of 1598 quasar measurements is smaller () than that for the Risaliti Lusso (2015) data. On the other hand, these new data give a relatively higher value of the matter density parameter in almost all models. This is one of the notable differences between the 2015 QSO and 2019 QSO data.
One major goal of our paper is to use the Risaliti Lusso (2019) QSO data to constrain cosmological parameters in six cosmological models. We also consider how two different Hubble constant priors affect cosmological parameter constraints. Since we use a number of different cosmological models here, we can draw somewhat model-independent conclusions about the QSO constraints. We find that the QSO measurements by themselves do not restrictively constrain cosmological parameters. However, given the larger error bars, the QSO constraints are mostly consistent with those that follow from the BAO + observations, and when analyzed together the 2019 QSO measurements slightly tighten BAO + data constraints in some of the models (but less so than did the 2015 QSO data, Khadka Ratra, 2020) and, more significantly, shift the matter density parameter () in most of the models to higher values. The QSO + BAO + data are consistent with the standard spatially-flat CDM model but mildly favor dynamical dark energy over a cosmological constant and closed spatial hypersurfaces over flat ones.
In most of the models we study here, the 2019 QSO data favor . Risaliti Lusso (2019) verify that the part of the QSO data are consistent with , which is also favored by most data up to , as well as by CMB anisotropy data at , in most cosmological models. This 2019 QSO data preference for is therefore possibly more an indication of an issue with the 2019 QSO data, and less an indication of the invalidity of the standard CDM model (Risaliti Lusso, 2019; Lusso et al., 2019). Since the QSO data is one of the very few probes of the part of the universe, it is important to resolve this issue.
In Sec. 2 we summarize the models we use. In Sec. 3 we describe the data we use to constrain cosmological model parameters. In Sec. 4 we describe the techniques we use in our analyses. In Sec. 5 we compare 2019 QSO and 2015 QSO data constraints and present cosmological parameter constraints from the 2019 QSO data and the 2019 QSO + + BAO data. We conclude in Sec. 6.
2 Models
We use one time-independent and two dynamical dark energy models to constrain cosmological model parameters. We use flat and non-flat versions of each dark energy cosmological model and examine a total of six cosmological models. For dark energy we use a cosmological constant in the CDM model, as well as an -fluid dynamical dark energy density in the XCDM parametrization, and a scalar field dynamical dark energy density in the CDM model.
In the CDM model the redshift dependence of the Hubble parameter is
| (1) |
where + + = 1. Here is the dark energy density parameter and and are the current values of the non-relativistic matter and the spatial curvature energy density parameters. In the spatially-flat CDM model we choose and to be the free parameters while in the spatially non-flat CDM model we choose , , and to be the free parameters.
In the XCDM parametrization the dynamical dark energy density decreases with time. In this case dark energy is modeled as a fluid with equation of state = . Here and are the pressure and energy density of the -fluid, and is the equation of state parameter whose value is negative (). In this parametrization the Hubble parameter is
| (2) |
where + + = 1 and is the current value of the -fluid energy density parameter. In the spatially-flat case we choose , , and to be the free parameters while in the non-flat case we choose , , , and to be the free parameters. In the = limit the XCDM parametrization becomes the CDM model.
In the CDM model a scalar field with potential energy density provides the dynamical dark energy density that decreases with time (Peebles Ratra, 1988; Ratra Peebles, 1988; Pavlov et al., 2013).333For discussions of observational constraints on the CDM model see Chen Ratra (2004), Samushia et al. (2007), Yashar et al. (2009), Samushia Ratra (2010), Samushia et al. (2010), Chen Ratra (2011b), Campanelli et al. (2012), Farooq Ratra (2013), Farooq et al. (2013), Avsajanishvili et al. (2015), Sòla et al. (2017), Sòla Peracaula et al. (2018, 2019), Zhai et al. (2017), Sangwan et al. (2018), Singh et al. (2019), Mitra et al. (2019), Cao et al. (2020), and references therein. A commonly used has the inverse power law form
| (3) |
with a positive parameter, being the Planck mass, and
| (4) |
The equations of motion of this model are
| (5) |
and
| (6) |
Here is the scale factor, an overdot denotes a time derivative, is negative, zero, and positive for open, flat, and closed spatial geometries, the non-relativistic matter density is , and the scalar field energy density is
| (7) |
The Hubble parameter in the CDM model is
| (8) |
where
| (9) |
with being the gravitational constant and + + = 1. In the CDM model has to be computed numerically. In the non-flat CDM model we choose , , , and to be the free parameters while in the spatially-flat CDM model we choose , , and to be the free parameters. In the limit the CDM model becomes the CDM model.
3 Data
The Risaliti Lusso (2015) QSO compilation has 808 quasar flux-redshift measurements over a redshift range . In this compilation most of the quasars are at high redshift, are at and only are at . These data have a larger intrinsic dispersion () in the X-ray and UV luminosity relation which affects the error bars and so these data do not tightly constrain cosmological parameters. See Khadka Ratra (2020) for cosmological constraints obtained from the 2015 QSO observations.
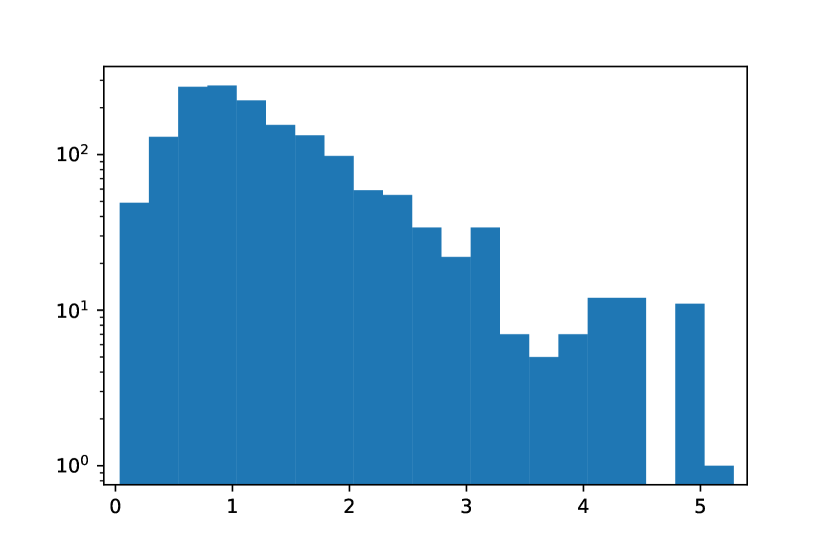
To improve upon their 2015 data set, in 2019 Risaliti and Lusso published a compilation of 1598 quasars, chosen for the purpose of constraining cosmological parameters from a large sample of 7,237 sources (Risaliti Lusso, 2019).444We thank Elisabeta Lusso (private communication, 2019) for very kindly providing these data to us. A significant portion of the QSOs in this new compilation are at lower redshift ( 43 are at redshift ), with QSOs in this new compilation distributed more uniformly over a smaller redshift range of in comparison to the old data. The redshift distribution of the new quasar data is shown in Fig. 1. These QSOs have an relation with a smaller intrinsic dispersion (). The main purpose of our paper is to use the 1598 QSO X-ray and UV flux measurements of Risaliti Lusso (2019) to determine parameter constraints.555For cosmological parameter constraints derived from the 2019 QSO data, see Risaliti Lusso (2019), Lusso et al. (2019), Melia (2019), Yang et al. (2019), Velten Gomes (2020), Wei Melia (2020), Lindner et al (2020), Zheng et al. (2020), and Mehrabi Basilakos (2020). We also compare the constraints from the 2019 QSO data to those that follow from the earlier Risaliti Lusso (2015) QSO compilation.
Additionally, we compare the 2019 QSO data cosmological constraints to those computed from more widely used measurements and BAO distance observations. The and BAO measurements we use consist of 31 observations over redshift and 11 BAO observations over redshift . The and BAO measurements we use are given in Table 2 of Ryan et al. (2018) and Table 1 of Ryan et al. (2019).
4 Method
Over the last four decades it has become clear that a quasar’s X-ray and UV luminosities are non-linearly correlated (Tananbaum et al., 1979; Zamorani et al., 1981; Avni Tananbaum, 1986; Steffen et al., 2006; Just et al., 2007; Young et al., 2010; Lusso et al., 2010; Grupe et al., 2010; Vagnetti et al., 2010). Risaliti Lusso (2015) made use of this correlation to constrain model parameters, as follows. The empirical relation between the quasar’s X-ray and UV luminosity is
| (10) |
where = and and are the QSO UV and X-ray luminosities and and are adjustable parameters to be determined from fitting to the measurements.
What is directly observed are the fluxes and so we need a relation between the UV and X-ray fluxes. Expressing the luminosity in terms of the flux we obtain
| (11) |
where and are the UV and X-ray fluxes respectively. Here is the luminosity distance, which depends on the redshift and the set of cosmological model parameters, , and is given by
| (12) |
where
| (13) |
and the Hubble parameter , which depends on the cosmological parameters, is given in Sec. 2 for each of the six cosmological models we examine in this paper.
| Data | Model | a | ||||||||
|---|---|---|---|---|---|---|---|---|---|---|
| 2019 QSO data | Flat CDM | - | - | - | - | |||||
| Non-flat CDM | - | - | ||||||||
| Flat XCDM | - | - | - | |||||||
| Non-flat XCDM | - | - | ||||||||
| Flat CDM | - | - | - | |||||||
| Non-flat CDM | - | - | ||||||||
| 2015 QSO datab | Flat CDM | - | - | - | - | |||||
| Non-flat CDM | - | - | ||||||||
| Flat XCDM | - | - | - | |||||||
| Non-flat XCDM | - | - | ||||||||
| Flat CDM | - | - | - | |||||||
| Non-flat CDM | - | - |
-
a
.
-
b
From Khadka Ratra (2020).
To constrain cosmological parameters we compare observed X-ray fluxes to model-predicted X-ray fluxes at the same redshifts. The model-predicted X-ray flux of a QSO depends on the set of cosmological model parameters, the redshift, and the observed UV flux, see eq. (11). We compute the best-fit values and uncertainties of the cosmological parameters of a model by maximizing the likelihood function. The QSO data analysis depends on the relation and this relation has an observed dispersion (). So we are required to consider a likelihood function normalization factor which is a function of . The QSO data likelihood function is (Risaliti Lusso, 2015)
| (14) |
where = and , and and are the measurement error on and the global intrinsic dispersion respectively. In eq. (14) is the corresponding theoretical model prediction defined by eq. (11), and depends on the observed and . is treated as a free parameter to be determined by the data, along with the other two free parameters, and , that characterise the - relation in eq. (10). In Risaliti Lusso (2019), also see Lusso et al. (2019), is not a free parameter, is determined by calibrating quasar distance modulus using JLA supernovae data over the common redshift range , and is a free parameter, whereas in Wei Melia (2020) is determined by calibrating quasar distance modulus using Hubble parameter measurements, and and are free parameters. We instead follow Khadka Ratra (2020) and treat , , and as free parameters to be determined, along with the cosmological parameters, from the QSO data, in each cosmological model. As a consequence, our QSO constraints are QSO-only constraints (they do not make use of the supernovae or data),666As discussed below, we do use two different priors for analysing the QSO data, however the derived QSO constraints on parameters, excluding that on , are almost insensitive to the choice of prior. which makes them a little less constraining than the Risaliti Lusso (2019) results, but allows us to compare QSO-only constraints to those from other data.
Our determination of the and BAO data constraints uses the procedure outlined in Sec. 4 of Khadka Ratra (2020).
For every parameter except , we use top-hat priors, that are non-zero over the ranges , , , , , , , and . Here = where is the current value of the scale factor. For we consider two different Gaussian priors, km s-1 Mpc-1, fron a median statistics analysis of a large compilation of measurements (Chen Ratra, 2011a),777This value is very consistent with those from earlier median statistics analyses (Gott et al., 2001; Chen et al., 2003), and with many recent measurements of (Chen et al., 2017; DES Collaboration, 2018; Yu et al., 2018; Gómez-Valent Amendola, 2018; Haridasu et al., 2018; Planck Collaboration, 2018; Zhang, 2018; Domínguez et al., 2019; Martinelli Tutusaus, 2019; Cuceu et al., 2019; Zeng Yan, 2019; Schöneberg et al., 2019; Lin Ishak, 2019; Zhang Huang, 2019). While the Planck Collaboration (2018) cosmic microwave background (CMB) anisotropy data more tightly constrains , these constraints depend on the cosmological model used to analyze the CMB data. and km s-1 Mpc-1, from a recent local expansion rate measurement (Riess et al., 2016).888Other local expansion rate determinations result in somewhat lower values with somewhat larger error bars (Rigault et al., 2015; Zhang et al., 2017; Dhawan et al., 2017; Fernández Arenas et al., 2018; Freedman et al., 2019, 2020; Rameez Sarkar, 2019).
The likelihood analysis is done using the Markov chain Monte Carlo (MCMC) method implemented in the emcee package (Foreman-Mackey et al., 2013) in Python 3.7.
For the QSO data we use the maximum likelihood value to compute the minimum = .999In Khadka Ratra (2020), the for the QSO data was incorrectly computed using the conventional minimum . This resulted in an incorrect, low, reduced for the 2015 QSO data, ¡ 0.6, see Tables 1 and 2 of Khadka Ratra (2020). Including the normalization factor in the computation of for the 2015 QSO data, the reduced are very close to unity in all models. The second term in the expression for is a consequence of the normalization factor in the QSO likelihood function, see eq. (14). The for the QSO + BAO + data set also accounts for the QSO normalization factor, while in the case of the + BAO data set we compute the conventional minimum = . In addition to we compute the Akaike Information Criterion
| (15) |
as well as the Bayes Information Criterion
| (16) |
where is the number of free model parameters, is the number of data points, and we define the degrees of freedom dof = . The and penalize models that have more free parameters.
| Model | Data set | a | dof | |||||||||||
|---|---|---|---|---|---|---|---|---|---|---|---|---|---|---|
| Flat CDM | + BAOb | 0.29 | 0.71 | - | - | - | 67.56 | - | - | - | 32.47 | 40 | 36.47 | 39.95 |
| QSO | 0.60 | 0.40 | - | - | - | 68.00 | 0.23 | 7.57 | 0.62 | 1606.99 | 1593 | 1616.99 | 1643.87 | |
| QSO + + BAO | 0.30 | 0.70 | - | - | - | 68.03 | 0.23 | 7.12 | 0.64 | 1630.00 | 1635 | 1640.00 | 1667.01 | |
| Non-flat CDM | + BAOb | 0.30 | 0.70 | - | - | 68.23 | - | - | - | 27.05 | 39 | 33.05 | 38.26 | |
| QSO | 0.56 | 0.98 | - | - | 68.00 | 0.23 | 7.93 | 0.61 | 1604.37 | 1592 | 1616.37 | 1648.63 | ||
| QSO + + BAO | 0.30 | 0.71 | - | - | 68.77 | 0.23 | 7.11 | 0.64 | 1630.00 | 1634 | 1642.00 | 1674.41 | ||
| Flat XCDM | + BAOb | 0.30 | 0.70 | - | - | 67.24 | - | - | - | 27.29 | 39 | 33.29 | 38.50 | |
| QSO | 0.20 | 0.80 | - | - | 68.00 | 0.23 | 7.66 | 0.62 | 1603.01 | 1592 | 1615.01 | 1647.27 | ||
| QSO + + BAO | 0.30 | 0.70 | - | - | 67.30 | 0.23 | 7.13 | 0.64 | 1629.76 | 1634 | 1641.76 | 1674.17 | ||
| Non-flat XCDM | + BAOb | 0.32 | - | - | 67.42 | - | - | - | 24.91 | 38 | 32.91 | 39.86 | ||
| QSO | 0.29 | - | - | 68.00 | 0.23 | 8.10 | 0.61 | 1604.29 | 1591 | 1618.29 | 1655.93 | |||
| QSO + + BAO | 0.33 | - | - | 67.43 | 0.23 | 7.54 | 0.62 | 1628.82 | 1633 | 1642.82 | 1680.64 | |||
| Flat CDM | + BAOb | 0.32 | - | - | - | 0.10 | 67.23 | - | - | - | 27.42 | 39 | 33.42 | 38.63 |
| QSO | 0.82 | - | - | - | 2.03 | 68.19 | 0.23 | 7.77 | 0.61 | 1589.32 | 1592 | 1601.32 | 1633.58 | |
| QSO + + BAO | 0.30 | - | - | - | 0.09 | 67.62 | 0.23 | 7.21 | 0.64 | 1633.40 | 1634 | 1645.40 | 1677.81 | |
| Non-flat CDM | + BAOb | 0.33 | - | - | 1.20 | 65.86 | - | - | - | 25.04 | 38 | 33.04 | 39.99 | |
| QSO | 0.56 | - | - | 0.08 | 67.63 | 0.23 | 7.99 | 0.61 | 1626.71 | 1591 | 1640.71 | 1678.35 | ||
| QSO + + BAO | 0.32 | - | - | 1.51 | 67.81 | 0.23 | 7.54 | 0.62 | 1624.67 | 1633 | 1639.67 | 1676.49 |
-
a
.
-
b
From Khadka Ratra (2020).
| Model | Data set | a | dof | |||||||||||
|---|---|---|---|---|---|---|---|---|---|---|---|---|---|---|
| Flat CDM | + BAOb | 0.30 | 0.70 | - | - | - | 69.11 | - | - | - | 33.76 | 40 | 38.76 | 41.24 |
| QSO | 0.60 | 0.40 | - | - | - | 73.24 | 0.23 | 7.54 | 0.62 | 1606.03 | 1593 | 1616.03 | 1642.91 | |
| QSO + + BAO | 0.31 | 0.69 | - | - | - | 69.15 | 0.23 | 7.12 | 0.64 | 1636.26 | 1635 | 1646.26 | 1673.27 | |
| Non-flat CDM | + BAOb | 0.30 | 0.78 | - | - | 71.56 | - | - | - | 28.80 | 39 | 34.80 | 40.01 | |
| QSO | 0.56 | 0.98 | - | - | 73.24 | 0.23 | 7.91 | 0.61 | 1604.37 | 1592 | 1616.37 | 1648.78 | ||
| QSO + + BAO | 0.31 | 0.79 | - | - | 71.85 | 0.23 | 7.16 | 0.64 | 1631.48 | 1634 | 1643.48 | 1675.89 | ||
| Flat XCDM | + BAOb | 0.29 | 0.71 | - | - | 71.27 | - | - | - | 30.68 | 39 | 36.68 | 41.89 | |
| QSO | 0.20 | 0.80 | - | - | 73.24 | 0.23 | 7.64 | 0.62 | 1603.01 | 1592 | 1615.01 | 1647.27 | ||
| QSO + + BAO | 0.30 | 0.70 | - | - | 71.32 | 0.23 | 7.13 | 0.64 | 1633.16 | 1634 | 1645.16 | 1677.57 | ||
| Non-flat XCDM | + BAOb | 0.32 | - | - | 71.22 | - | - | - | 28.17 | 38 | 36.17 | 43.12 | ||
| QSO | 0.29 | - | - | 73.24 | 0.23 | 8.08 | 0.61 | 1604.29 | 1591 | 1618.29 | 1655.93 | |||
| QSO + + BAO | 0.33 | - | - | 71.11 | 0.23 | 7.47 | 0.63 | 1632.09 | 1633 | 1646.09 | 1683.91 | |||
| Flat CDM | + BAOb | 0.33 | - | - | - | 0.09 | 69.31 | - | - | - | 33.36 | 39 | 39.36 | 44.57 |
| QSO | 0.61 | - | - | - | 0.26 | 73.11 | 0.23 | 7.53 | 0.62 | 1601.22 | 1592 | 1613.22 | 1645.48 | |
| QSO + + BAO | 0.31 | - | - | - | 0.003 | 69.40 | 0.23 | 7.17 | 0.63 | 1636.87 | 1634 | 1638.87 | 1671.28 | |
| Non-flat CDM | + BAOb | 0.32 | - | - | 1.14 | 69.23 | - | - | - | 27.62 | 38 | 35.62 | 42.57 | |
| QSO | 0.49 | - | - | 0.01 | 72.98 | 0.23 | 7.78 | 0.61 | 1606.10 | 1591 | 1620.10 | 1657.74 | ||
| QSO + + BAO | 0.32 | - | - | 1.09 | 71.22 | 0.23 | 7.47 | 0.63 | 1640.19 | 1633 | 1654.19 | 1692.01 |
-
a
.
-
b
From Khadka Ratra (2020).
| a prior | Model | a | |||||
|---|---|---|---|---|---|---|---|
| Flat CDM | - | - | - | - | |||
| Non-flat CDM | - | - | |||||
| Flat XCDM | - | - | - | ||||
| Non-flat XCDM | - | - | |||||
| Flat CDM | - | - | - | ||||
| Non-flat CDM | - | - | |||||
| Flat CDM | - | - | - | - | |||
| Non-flat CDM | - | - | |||||
| Flat XCDM | - | - | - | ||||
| Non-flat XCDM | - | - | |||||
| Flat CDM | - | - | - | ||||
| Non-flat CDM | - | - |
-
a
.
| a prior | Model | a | ||||||||
|---|---|---|---|---|---|---|---|---|---|---|
| Flat CDM | - | - | - | |||||||
| Non-flat CDM | - | - | ||||||||
| Flat XCDM | - | - | - | |||||||
| Non-flat XCDM | - | - | ||||||||
| Flat CDM | - | - | - | |||||||
| Non-flat CDM | - | - | ||||||||
| Flat CDM | - | - | - | |||||||
| Non-flat CDM | - | - | ||||||||
| Flat XCDM | - | - | - | |||||||
| Non-flat XCDM | - | - | ||||||||
| Flat CDM | - | - | - | |||||||
| Non-flat CDM | - | - |
-
a
.
5 Results
5.1 Comparison of 2015 and 2019 QSO data constraints
QSO constraints obtained from the 2015 QSO data (Khadka Ratra, 2020) and the 2019 QSO data are largely consistent with each other but there are some differences, including some significant ones. Tables 1 and 2 list best-fit parameter values and 1 error bars determined from the 2019 and 2015 QSO data, for the two different priors. Best-fit values of parameters related to the relation (, , and ) have changed in comparison to those obtained from the 2015 QSO data. and are the intercept and slope of the relation and their values do not tell how well this relation fits the data; the value of the intrinsic dispersion () quantifies how well the relation fits the data. The intrinsic dispersion of the relation obtained from the 2015 QSO data and 2019 QSO data are and respectively, independent of prior and cosmological model. This shows that the 2019 QSO data are described by a tighter relation than that for the 2015 data. This could be the result of the modified sample filtering process adopted in Risaliti Lusso (2019).
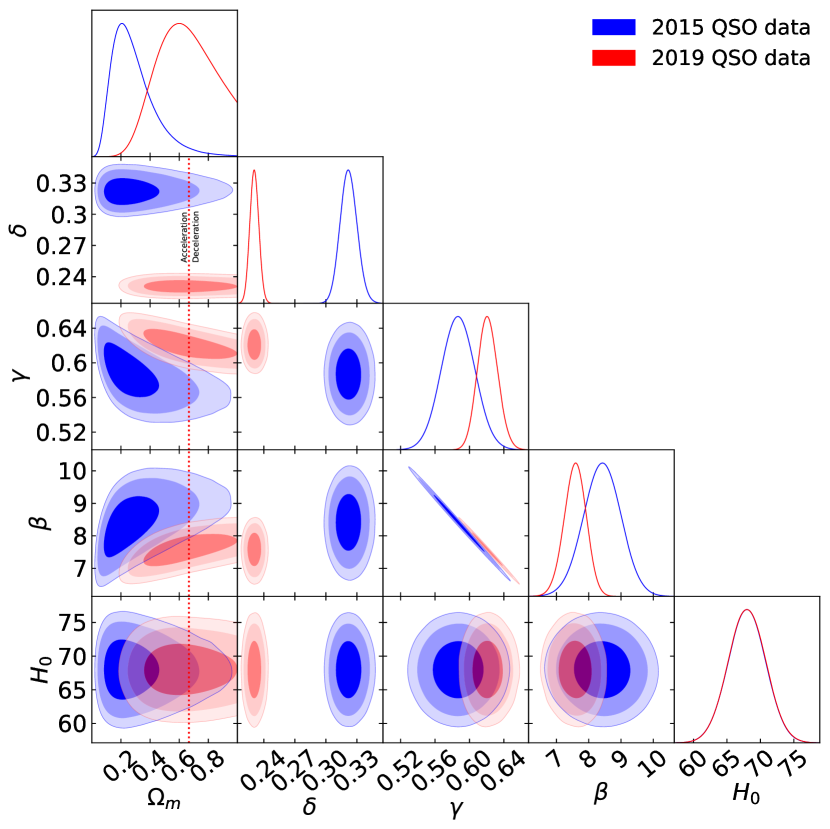
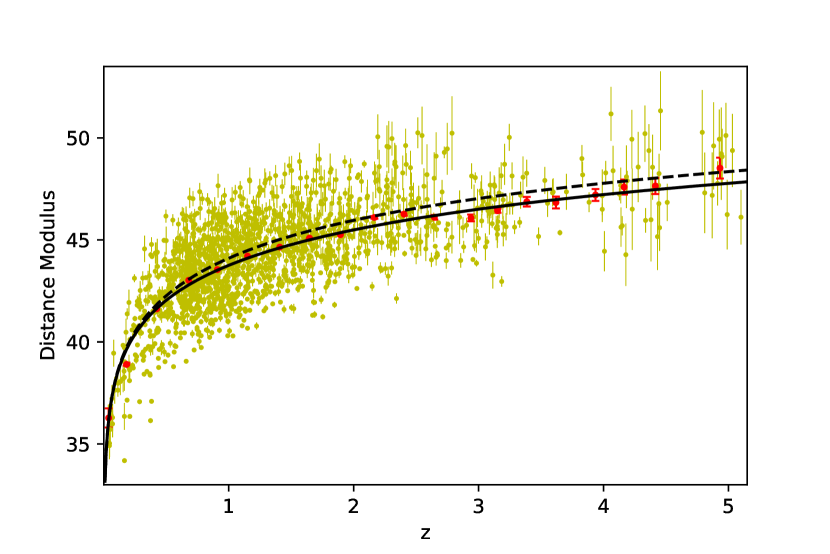
In the case of cosmological parameters, the best-fit values of the equation of state parameter () in the flat and non-flat XCDM parametrization obtained from the 2019 QSO data are significantly more negative than those obtained from the 2015 QSO data. From Tables 1 and 2, the 2019 QSO data indicate that the dark energy density in the XCDM parametrization increases with time. Another notable difference between the 2015 QSO data and the 2019 QSO data is that the 2015 QSO data favor a smaller value of the matter density parameter (), consistent with values obtained from other cosmological probes, while the 2019 QSO data favor a larger value of the matter density parameter (), with the exception of the flat XCDM case where the 2019 data also favor . This can be seen in Tables 1 and 2 and Fig. 2 which shows the constraints for the flat CDM model with the prior. We note that both high redshift cosmic microwave background anisotropy data (Planck Collaboration, 2018) and low redshift, , data (Chen Ratra, 2003; Park Ratra, 2018c) are both consistent with in a variety of different cosmological models, so it is somewhat surprising that the 2019 QSO data at largely favor .101010We note that our result differs significantly from Melia (2019), Table 1, who finds in the flat CDM model from the 2019 QSO data (which is identical to the Risaliti Lusso (2019) value of determined from the 2019 QSO data with the JLA supernovae data). The more approximate analyses of Yang et al. (2019) and Velten Gomes (2020) find larger values, as does the analyses of Wei Melia (2020) in which they use data to calibrate the 2019 QSO data. From their more approximate analyses Velten Gomes (2020) conclude that the 2019 QSO data are incompatible with a currently accelerating cosmological expansion, Our more accurate analyses shows that while part of the probability lies in the non-accelerating region of cosmological parameter space, in most models we study here a significant part of the probability lies in the accelerating part of cosmological parameter space, see Fig. 2 for the flat CDM case and later figures for other models, and so it is incorrect to claim that the 2019 QSO data are incompatible with currently accelerated cosmological expansion. It is probably more likely that this larger is a reflection of something related to the 2019 QSO data than an indication of the invalidity of the CDM scenario. A larger value of the matter density parameter gives a lower distance modulus for an astrophysical object at any redshift. So the Hubble diagram of quasars obtained from the 2019 QSO data lies below the Hubble diagram obtained from the concordance model (flat CDM) with non-relativistic matter density parameter and the difference increases with increasing redshift. This can be seen in Fig. 3. Qualitatively, Fig. 3 shows that QSO data at are consistent with an model while the QSO data at favor the model. This is qualitatively consistent with the findings of Risaliti Lusso (2019).
5.2 2019 QSO constraints
The observed correlation between a quasar’s X-ray and UV measurements, eq. (10), provides an opportunity to use QSO measurements to constrain cosmological parameters. The global intrinsic dispersion () obtained here is smaller than that of Khadka Ratra (2020) for the 2015 QSO data but it still is large and so parameter determination performed using these measurements is not as precise as that done using other data such as BAO or measurements. But the main advantage of using the QSO data is that it covers a very large range of redshift, part of which is not well probed by other data, so it provides the opportunity of testing cosmological models in a new, higher, redshift range, and it is likely that future, improved, QSO data will provide significant and interesting constraints on cosmological parameters.
The QSO measurements determined cosmological model parameter results are listed in Tables 1–4. The unmarginalized best-fit parameters are listed in the Tables 3 and 4 for the and priors respectively. The two-dimensional confidence contours and the one-dimensional likelihoods are shown in grey in the left panels of Figs. 4–15. The cosmological parameter constraints are almost insensitive to the prior used. For the QSO data, from Tables 1 and 2, the non-relativistic matter density parameter is measured to lie in the range = to ( to ) for flat (non-flat) models and the prior and to lie in the range = to ( to ) for flat (non-flat) models and the prior. While the errors are large, the values of obtained from the 2019 QSO data in most models are larger than those obtained from other cosmological probes.
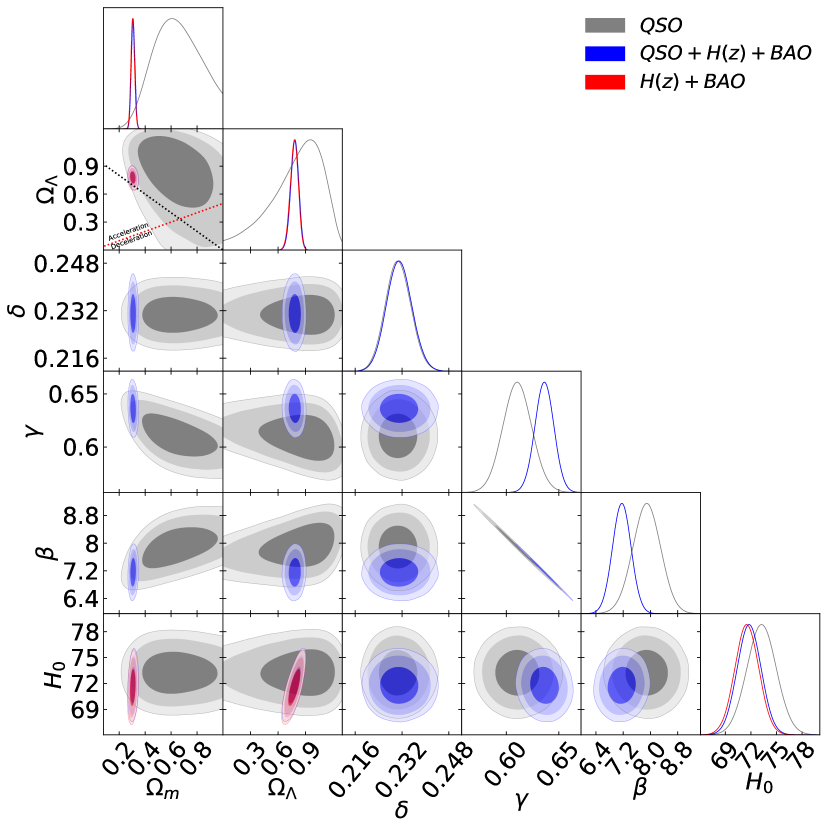
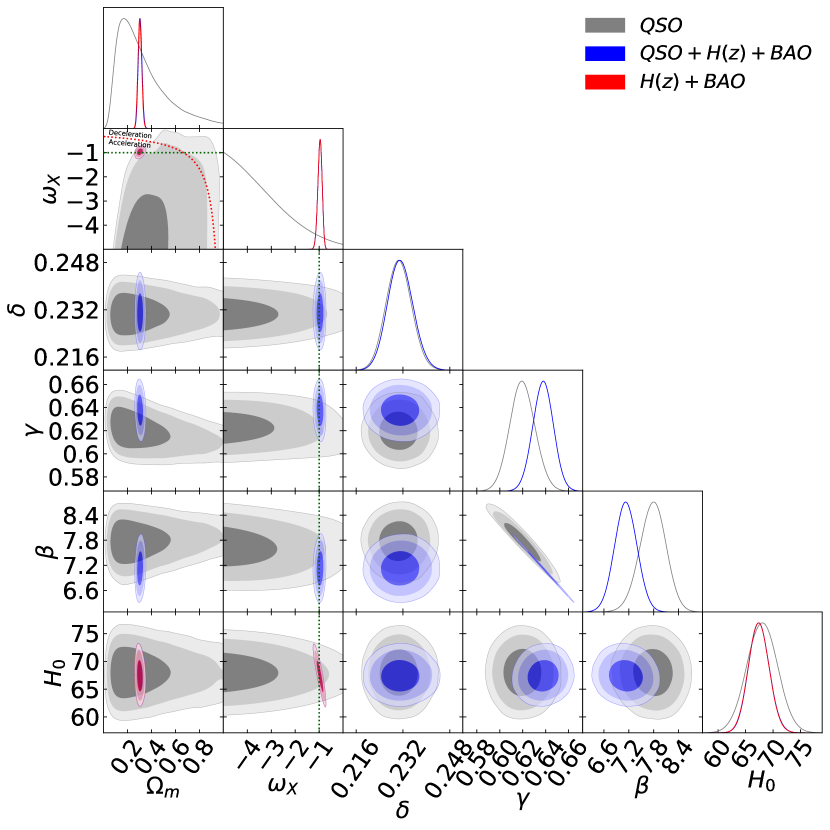
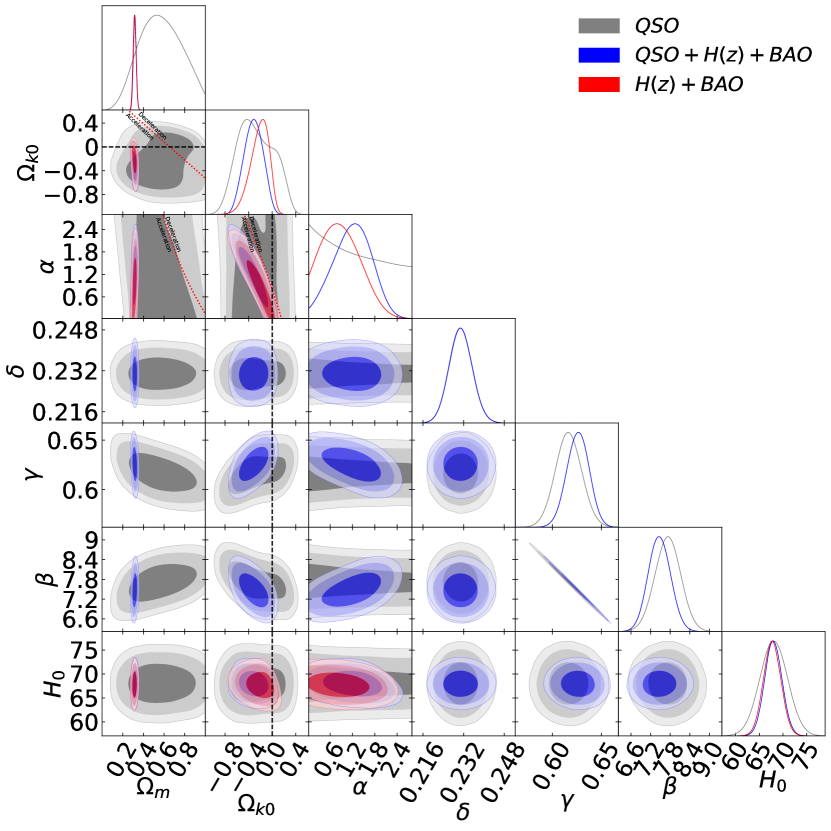
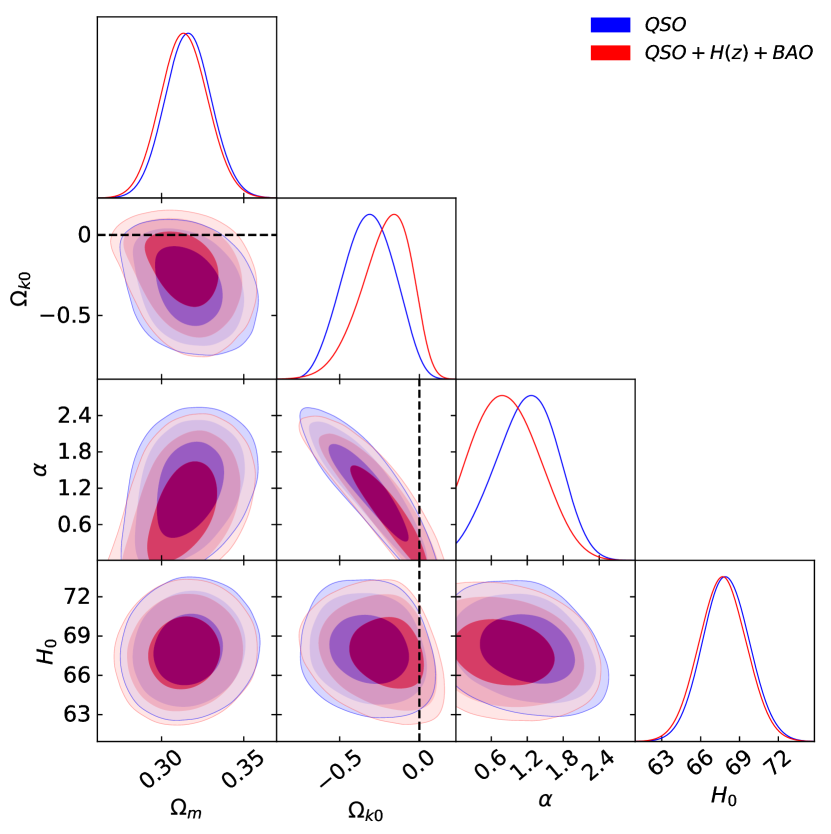
From Tables 1 and 2, for the non-flat CDM model the curvature energy density parameter is measured to be = () for the ( ) prior. For the non-flat XCDM model we find = () for the ( ) prior. For the non-flat CDM model we find = () for the ( ) prior. In all models closed spatial hypersurfaces are weakly favored.
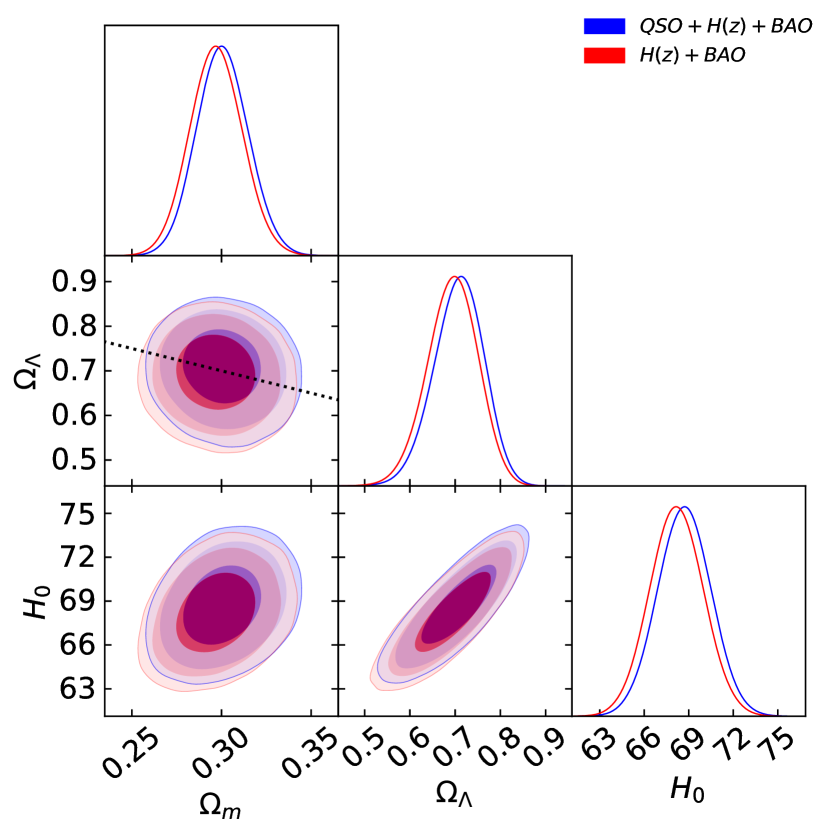
From Tables 1 and 2, for the flat (non-flat) CDM model the dark energy density parameter is = () for both and priors.
The equation of state parameter for the flat (non-flat) XCDM model is = () for the prior and () for the prior. For both priors is very low in comparison to the 2015 QSO data values obtained in Khadka Ratra (2020). In the XCDM parametrization the 2019 QSO data favors dark energy density that increases with time. The parameter in the flat (non-flat) CDM model is = () for the prior and () for the prior. In both models dynamical dark energy is favored.
From the , AIC, and BIC values for the QSO data listed in Tables 3 and 4, independent of prior, the flat CDM model is most favored while the non-flat CDM model is least favored. However, given the issue raised above about the 2019 QSO data, it is inappropriate to give much weight to these findings.
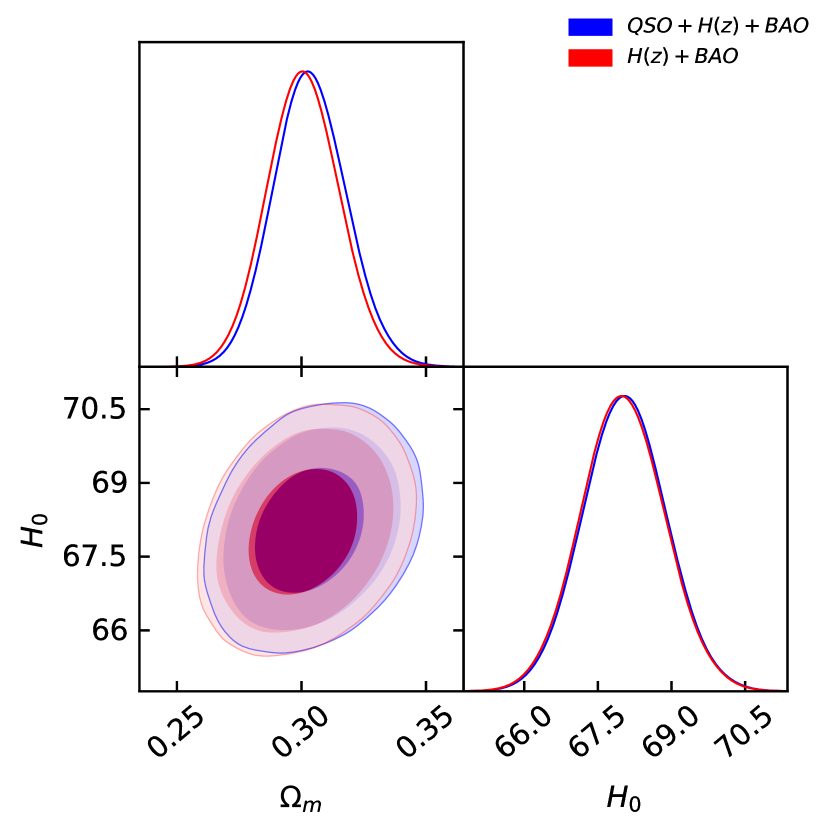
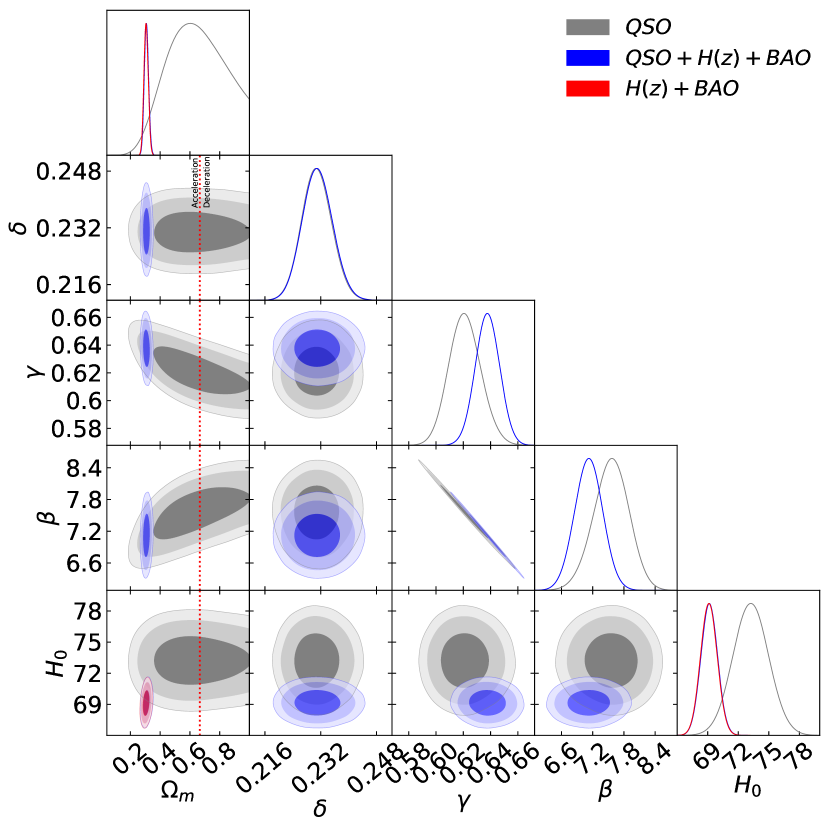
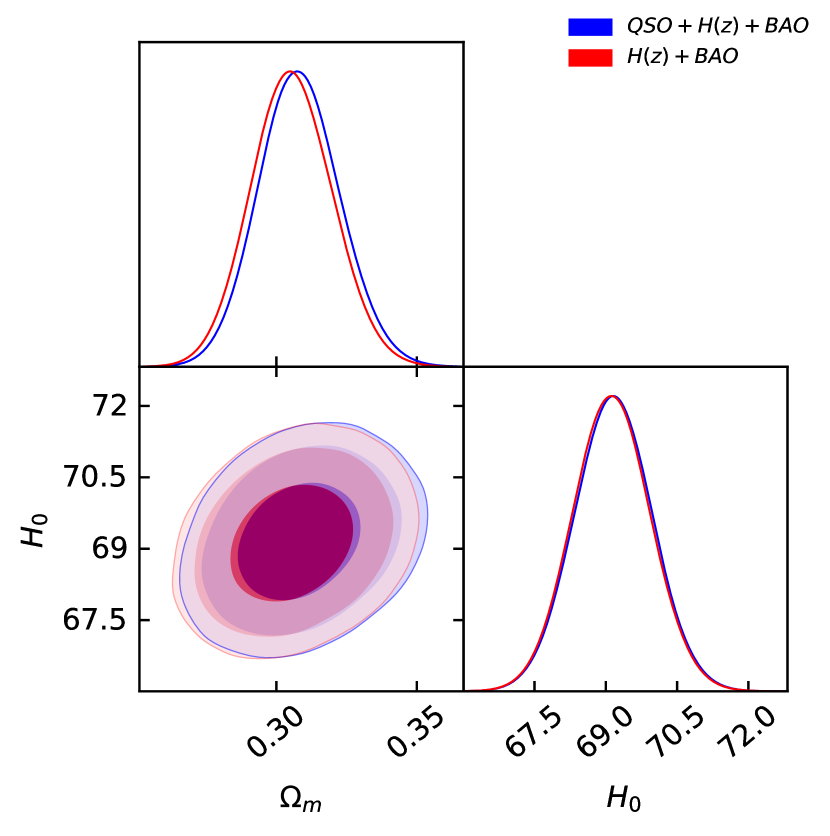
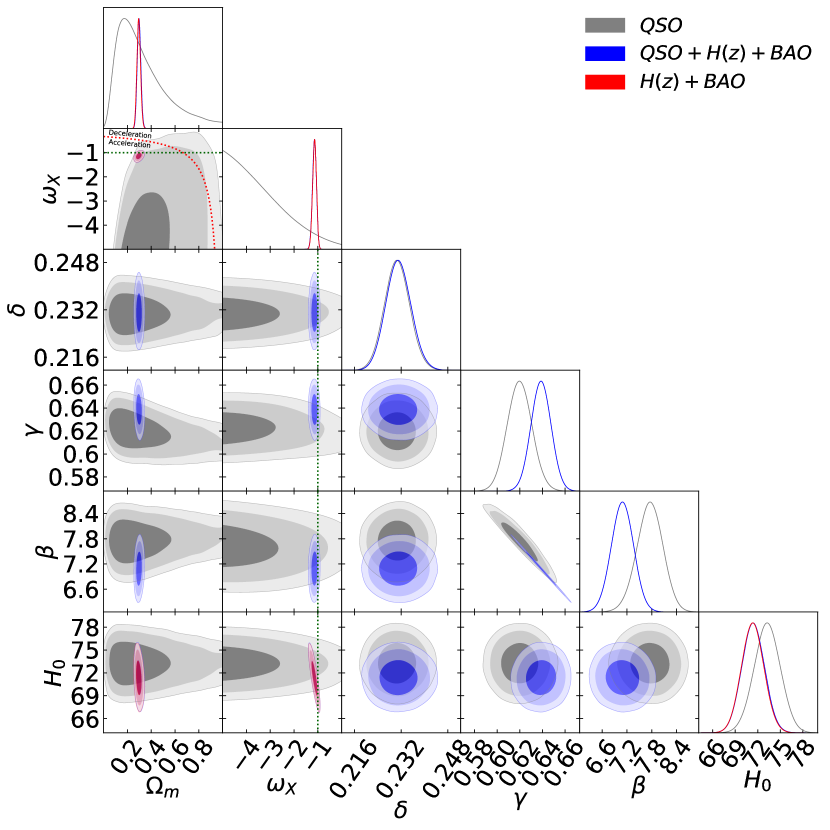
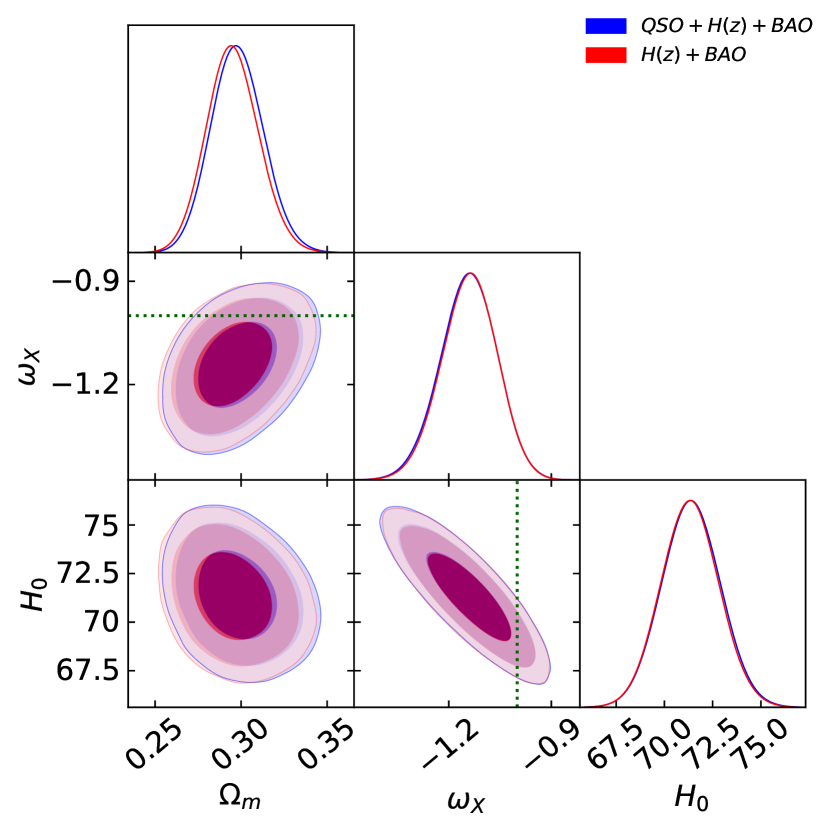
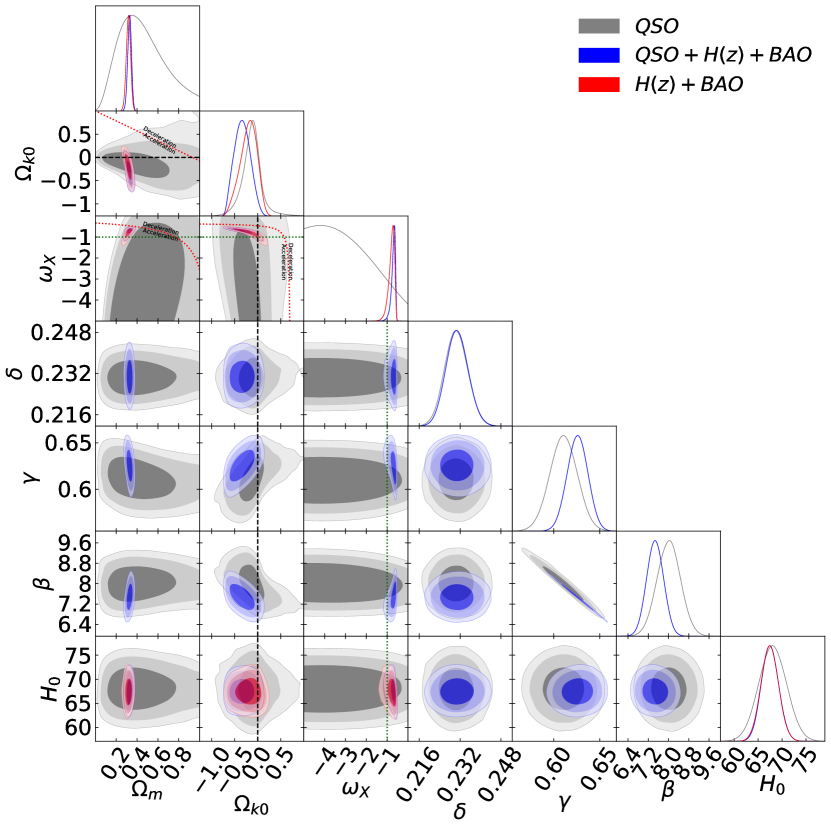
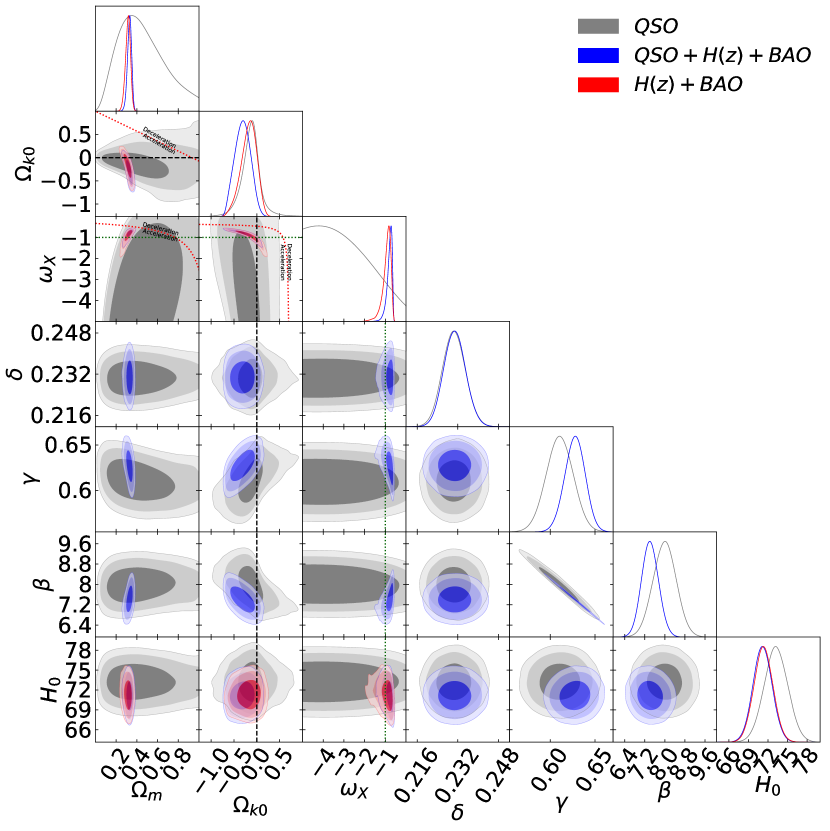
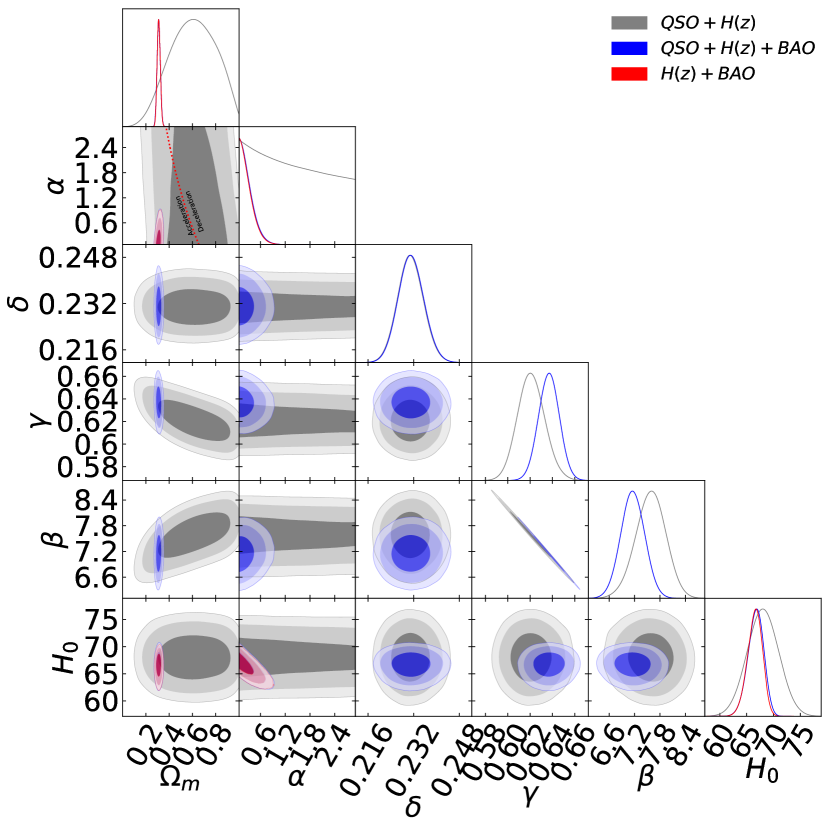
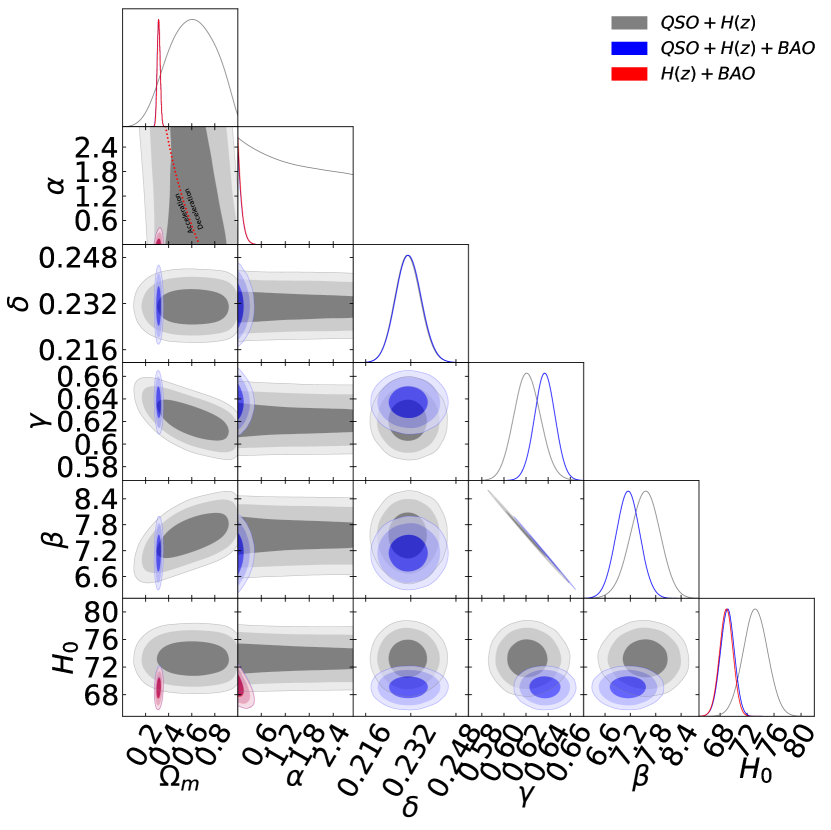
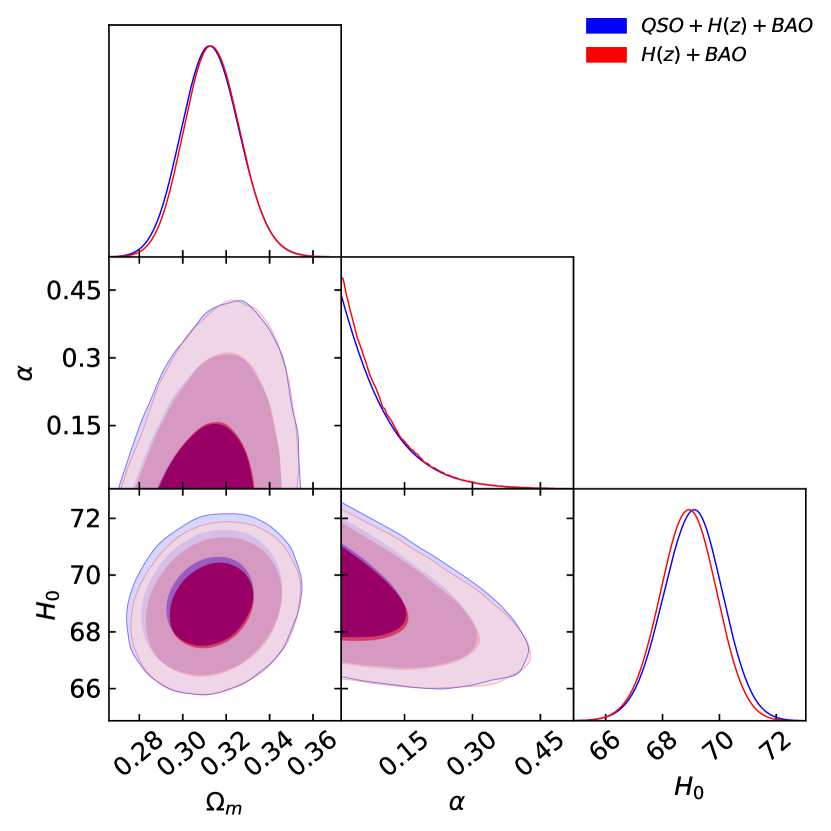
The cosmological parameters obtained by using the 2019 QSO data have relatively high uncertainty for all models so they are mostly consistent with the results obtained by using the BAO + data set, as can be seen from Figs. 4–15.
5.3 QSO + + BAO constraints
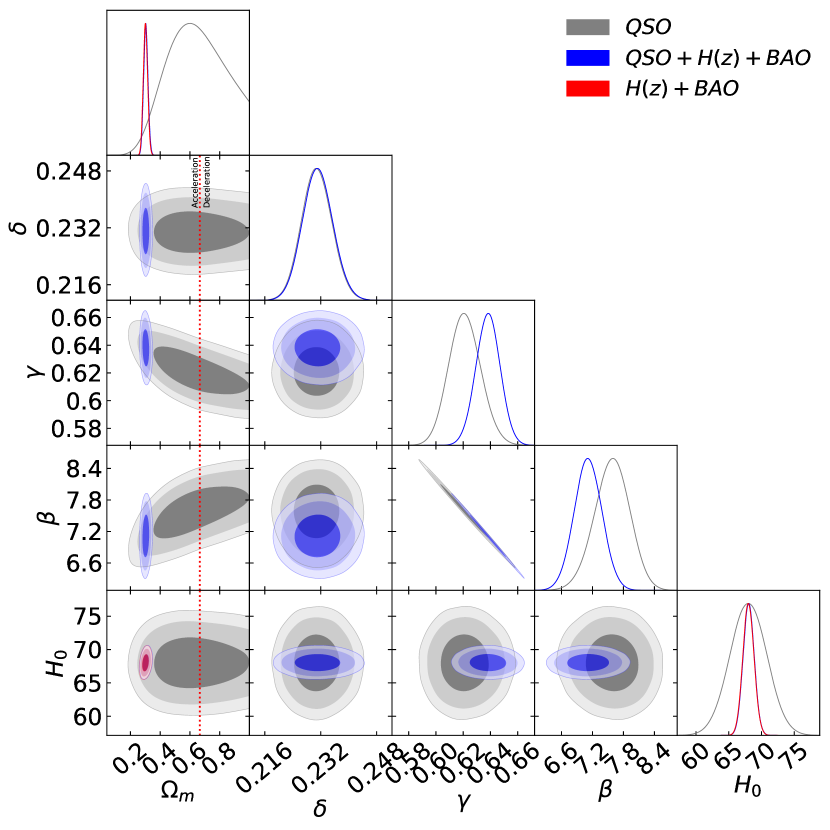
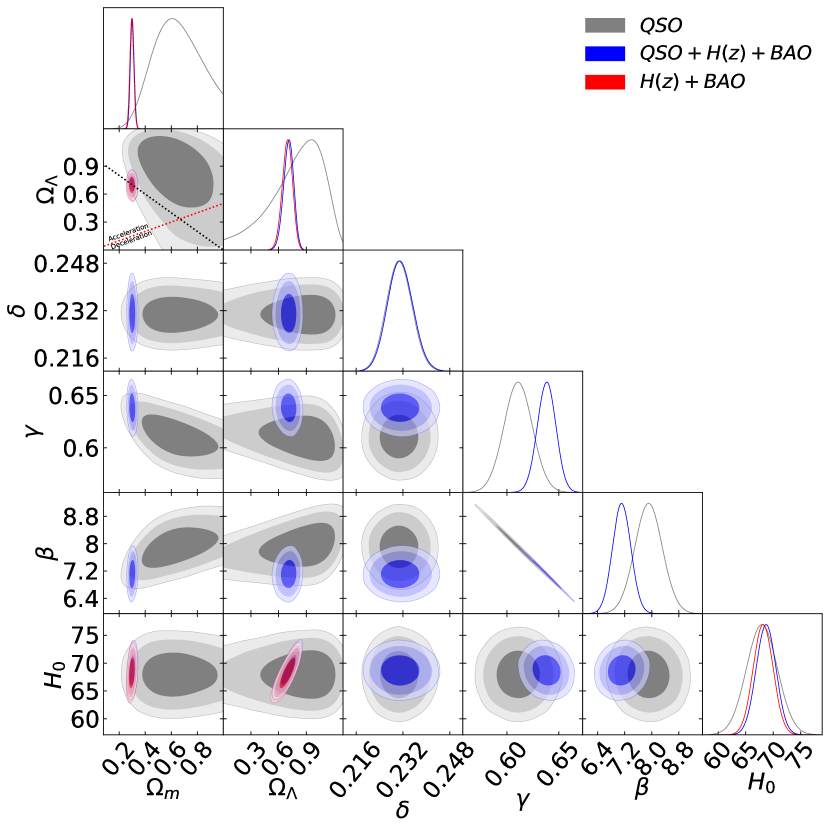
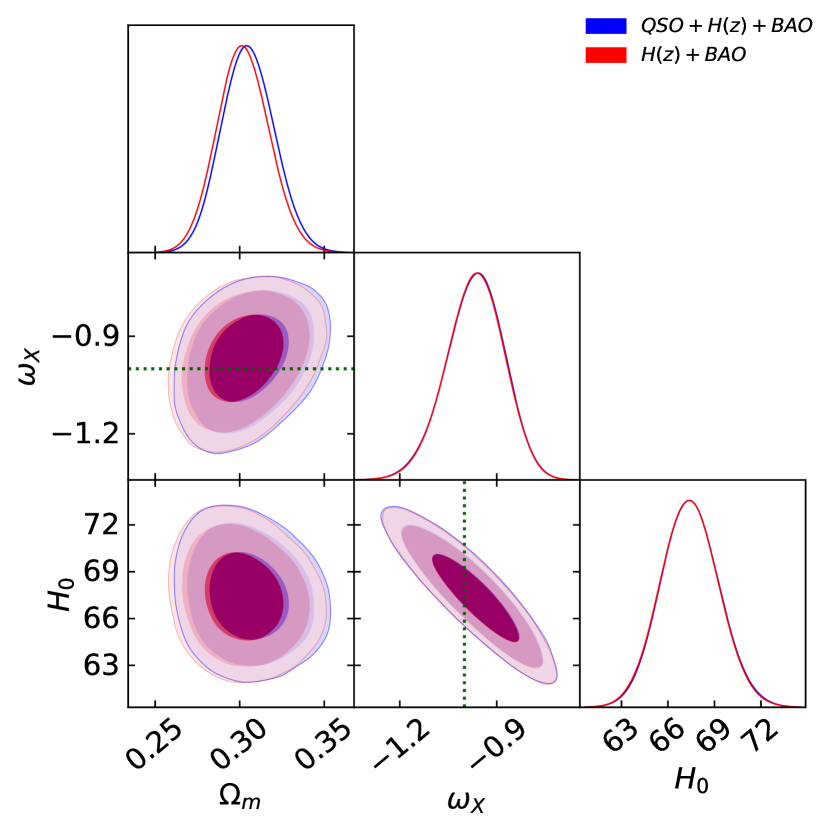
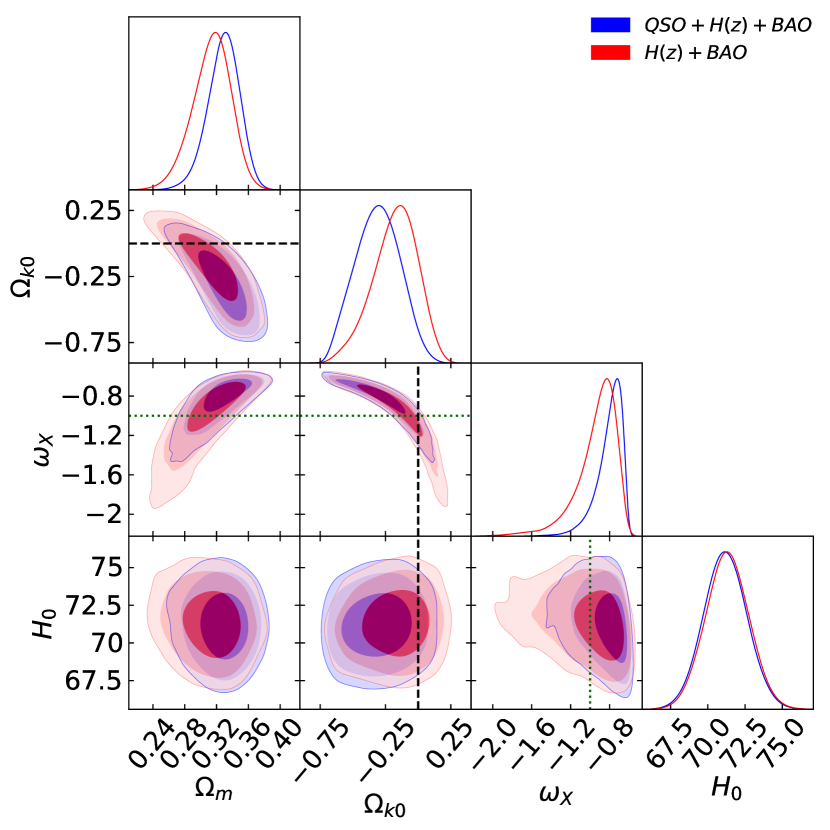
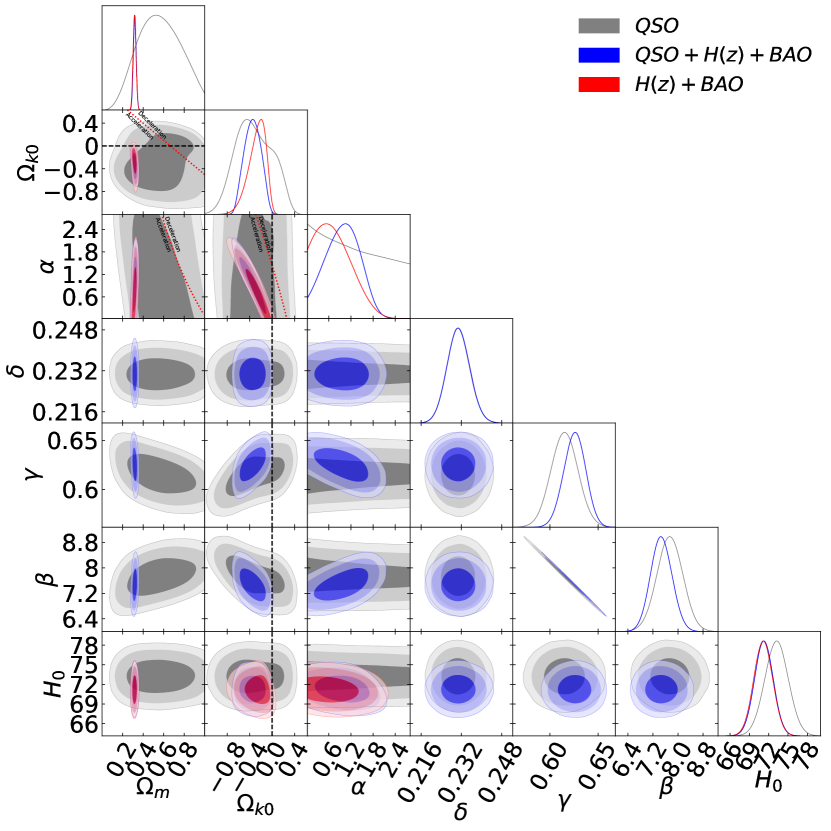
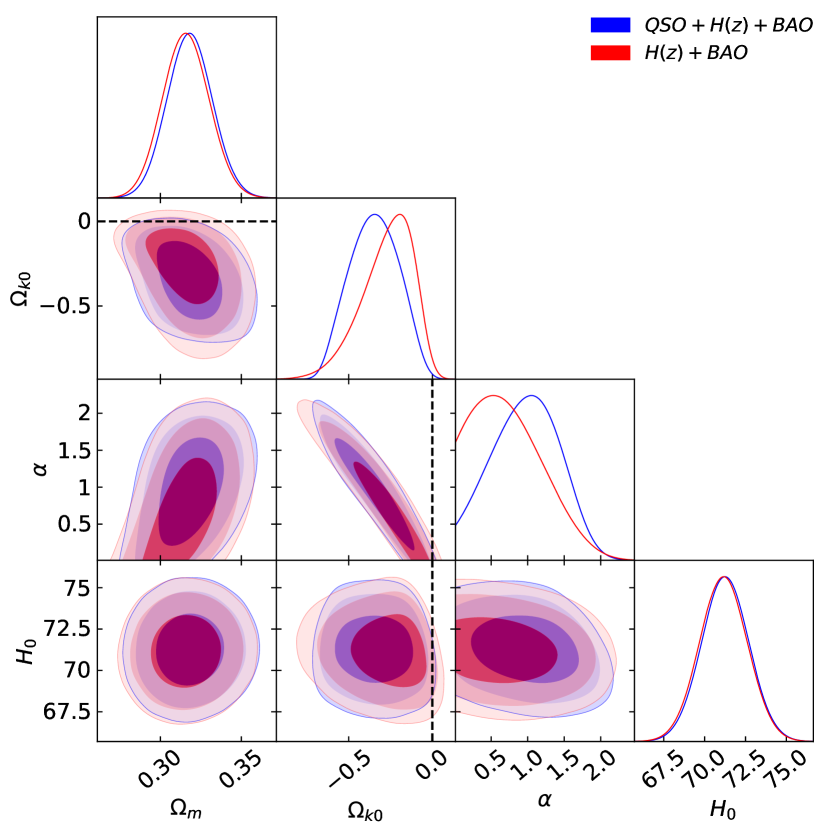
Results for the + BAO observations are given in Tables 3–5 and one-dimensional distributions and two-dimensional contours are shown in red in Figs. 4–15. Figures 4–15 show that constraints from the QSO data alone and those from the BAO + data are mostly consistent with each other. So it is not unresonable to do joint analyses of the QSO + +BAO data. Results from this joint analysis are listed in Tables 1, 2, and 6. The QSO + + BAO one-dimensional likelihoods and two-dimensional confidence contours for all free parameters are shown in blue in Figs. 4–15. The updated QSO data don’t significantly tighten the BAO + data contours except in the cases of the non-flat XCDM parametrization and the non-flat CDM model (Figs. 10, 11, 14, and 15). Another noticeable result is that adding the QSO data to the BAO + data results in the shifting of one-dimensional likelihood distribution of the matter density parameter towards higher values in most cosmological models studied here.
From joint analyses of the QSO + + BAO data, from Table 6, the matter density parameter lies in the range = to ( = to ) for flat (non-flat) models and the prior and lies in the range = to ( = to ) for flat (non-flat) models and the prior. In a few cases these results slightly differ from the BAO + data results in Table 5, being shifted to slightly larger values. These results are consistent with those results determined from other cosmological data.
The Hubble constant lies in the range = to ( = to ) for flat (non-flat) models and the prior and lies in the range = to ( = to ) for flat (non-flat) models and the prior. Not unexpectedly, for the prior case the measured value of is reduced below the prior value because the BAO and observations prefer a lower . In most cases the error bars have increased in comparison to those derived using the 2015 QSO + BAO + data in Khadka Ratra (2020).
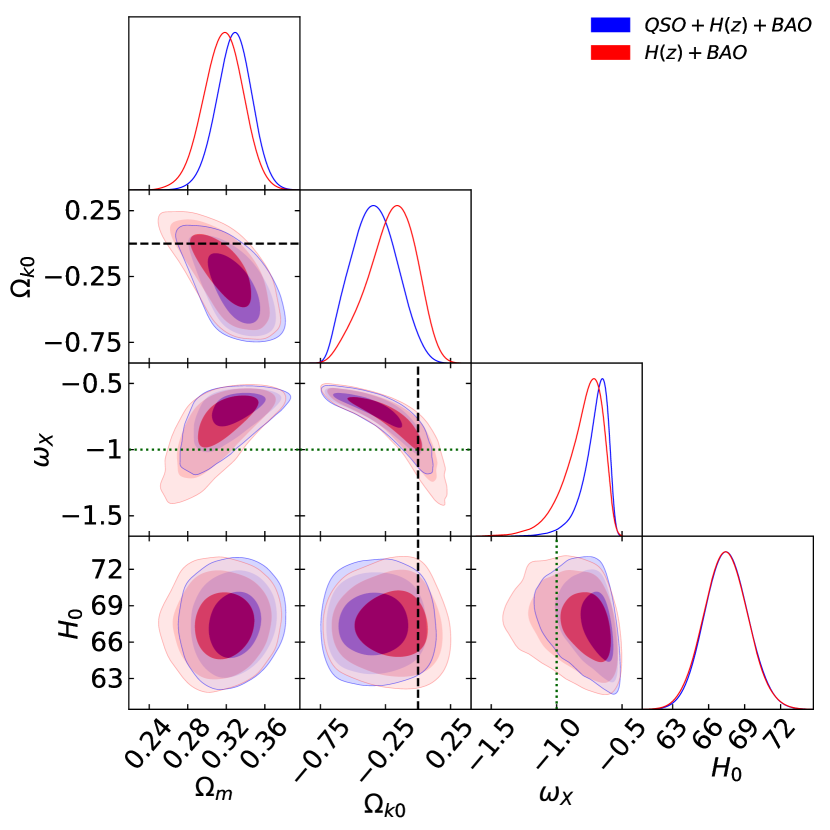
In all models, except for non-flat CDM with the prior, closed spatial hypersurfaces are favored at about 2. For the non-flat CDM model the curvature energy density parameter is = and for the and priors respectively. Values of curvature energy density parameter obtained for non-flat dynamical dark energy cosmological models are significantly higher than those obtained in the non-flat CDM model. The curvature energy density parameter is = and for the non-flat XCDM and non-flat CDM models for the prior and = and for the non-flat XCDM and non-flat CDM models for the prior. This preference for closed spatial geometries is largely driven by the BAO + data (Park Ratra, 2018c; Ryan et al., 2019).
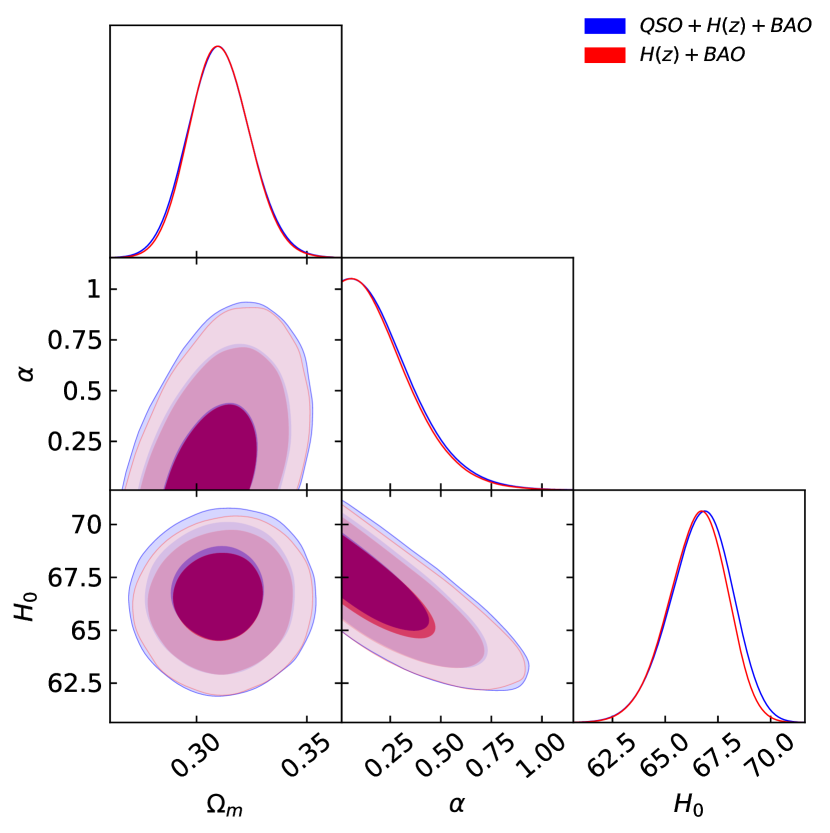
From Table 6, for the flat (non-flat) CDM model the dark energy density parameter is = () for the prior and = () for the prior.
The equation of state parameter for the flat (non-flat) XCDM parametrization is = () for the prior and () for the prior. So this set of data suggests decreasing XCDM dark energy density with time, except for the flat XCDM parametrization with prior, where it favors at almost 2, a XCDM dark energy density that increases with time. The value of the parameter in the flat (non-flat) CDM model is = () for the prior and () for the prior. All eight XCDM and CDM cases favor dynamical dark energy over a at between 0.4 and 4.4. Other data also favor mild dark energy dynamics (Ooba et al., 2019; Park Ratra, 2018b, 2019).
Unlike the case for the 2019 QSO only data, for the QSO + BAO data the , AIC, and BIC values are relatively similar for all models.
6 Conclusion
Following Risaliti Lusso (2019) we have used the correlation between X-ray and UV monochromatic luminosities in selected quasars to constrain cosmological model parameters in six different models. These selected quasars can be used as standard candles for cosmological model testing at redshifts that are not yet widely accessible through other cosmological probes. Our analyses of these data in six different cosmological models shows that parameters of the relation, i.e., the intercept , the slope , and the intrinsic dispersion , are only weakly dependent on the cosmological model assumed in the analysis. This reinforces the finding of Risaliti Lusso (2015) that carefully-selected quasar flux measurements can be used as standard candles.
The 2019 QSO data constraints are mostly consistent with joint analysis of BAO distance and Hubble parameter measurements, as also found in Khadka Ratra (2020) for the 2015 QSO data. We find that combined analysis of 2019 QSO and BAO + measurements slightly tightens the + BAO data constraints in the non-flat XCDM paramerization and the non-flat CDM model but not in the other four models. Overall, adding the 2019 QSO measurements to the BAO + observations has a less significant tightening effect than what was found for the 2015 QSO data (Khadka Ratra, 2020).
The value of the matter density parameter obtained by using the 2019 QSO data is typically greater than 0.5, Tables 1 and 2, which is significantly larger than values obtained using other cosmological probes, such as BAO, , Type Ia supernovae, and CMB anisotropy observations. Due to the larger from the QSO data, in joint analyses of the QSO + BAO + measurements the matter density parameter shifts to slightly larger values than the + BAO data values in a number of the models. The larger 2019 QSO data values are likely the cause of the tension between the 2019 QSO data and the flat CDM model that is discussed in Risaliti Lusso (2019) and Lusso et al. (2019). It is probably more likely that this tension has to do with the 2019 QSO data than with the invalidity of the flat CDM model. This is because almost all cosmological data, at and at , are consistent with . It is of great interest to understand why the 2019 QSO observations favour a larger value of .
The joint QSO + BAO + measurements constraints are consistent with the current standard spatially-flat CDM model, but weakly favour dynamical dark energy over a cosmological constant and closed over flat spatial hypersurfaces. Since they probe a little-studied, higher redshift region of the universe, future, improved QSO data will likely provide very useful, more restrictive, constraints on cosmological parameters, and should help to measure the dynamics of dark energy and the geometry of space.
Acknowledgements
We thank Elisabeta Lusso for her generous help, and Lado Samushia, Javier De Cruz, Shulei Cao, and Joe Ryan for useful discussions. We are grateful to the Beocat Research Cluster at Kansas State University team. This research was supported in part by DOE grant DE-SC0019038.
Data availability
The data underlying this article were provided to us by the authors of Risaliti Lusso (2019). These data will be shared on request to the corresponding author with the permission of the authors of Risaliti Lusso (2019).

References
- Alam et al. (2017) Alam S., et al., 2017, MNRAS, 470, 2617
- Avni Tananbaum (1986) Avni Y., Tananbaum H., 1986, ApJ, 305, 83
- Avsajanishvili et al. (2015) Avsajanishvili O., Samushia L., Arkhipova N. A., Kahniashvili T., 2015, preprint, (arXiv:1511.09317)
- Bisogni et al. (2017) Bisogni S., Risaliti G., Lusso E., 2017, preprint, (arXiv:1712.07515)
- Campanelli et al. (2012) Campanelli L. et al., 2012, Eur. Phys. J. C, C72, 2218
- Cao et al. (2020) Cao S., Ryan J., Ratra B., preprint, (arXiv:2005.12615)
- Chen et al. (2003) Chen G, Gott III J. R., Ratra B., 2003, PASP, 115, 1269
- Chen Ratra (2003) Chen G., Ratra B., 2003, PASP, 115, 1143
- Chen Ratra (2004) Chen G., Ratra B., 2004, ApJ, 612, L1
- Chen Ratra (2011a) Chen G., Ratra B., 2011a, PASP, 123, 1127
- Chen Ratra (2011b) Chen Y., Ratra B., 2011b, Physics Letters B, 703, 406
- Chen et al. (2017) Chen Y., Kumar S., Ratra B., 2017, ApJ, 835, 86
- Chen et al. (2016) Chen Y. et al., 2016, ApJ, 829, 61
- Coley (2019) Coley A. A., 2019, preprint, (arXiv:1905.04588)
- Cuceu et al. (2019) Cuceu A., Farr J., Lemos P., Font-Ribera A., 2019, JCAP, 1910, 044
- Demianski et al. (2019) Demianski M., Piedipalumbo E., Sawant D., Amati L., 2019, preprint, (arXiv: 1911.08228)
- DES Collaboration (2019) DES Collaboration, 2019, Phys. Rev. D, 99, 123505
- DES Collaboration (2018) DES Collaboration, 2018, MNRAS, 480, 3879
- Dhawan et al. (2017) Dhawan S., Jha S. W., Leibundgut B. 2017, AA, 609, A72
- Di Valentino et al. (2020) Di Valentino E., Melchiorri A., Silk J., 2020, preprint, (arXiv:2003.04935 )
- Domínguez et al. (2019) Domínguez A. et al., 2019, ApJ, 885, 137
- Efstathiou Gratton (2020) Efstathiou G., Gratton S., 2020, preprint, (arXiv:2002.06892)
- Eingorn et al. (2019) Eingorn M., Yukselci E. A., Zhuk A., 2019, EPJC, C79, 655
- Farooq et al. (2013) Farooq O., Crandall S., Ratra B., 2013, Physics Letters B, 726,72
- Farooq et al. (2017) Farooq O., Madiyar F., Crandall S, Ratra B., 2017, ApJ, 835, 26
- Farooq et al. (2015) Farooq O., Mania D., Ratra B., 2015, ApSS, 357, 11
- Farooq Ratra (2013) Farooq O., Ratra B., 2013, ApJ, 766, L7
- Fernández Arenas et al. (2018) Fernández Arenas D., et al., 2018, MNRAS, 474, 1250
- Foreman-Mackey et al. (2013) Foreman-Mackey D., Hogg D. W., Lang D., Goodman J., 2013, PASP, 125, 306
- Freedman et al. (2019) Freedman W. L. et al., 2019, ApJ, 882, 34
- Freedman et al. (2020) Freedman W. L. et al., 2020, ApJ, 891, 57
- Geng et al. (2020) Geng C. Q., Hsu Y. T., Yin L., Zhang K., 2020, preprint, (arXiv: 2002.05290)
- Giambó et al. (2019) Giambó R., Miritzis J., Pezzola A., 2019, preprint, (arXiv: 1905.01742)
- Grupe et al. (2010) Grupe D., Komossa S., Leighly K. M., Page K. L., 2010, ApJS, 187, 64
- Gómez-Valent Amendola (2018) Gómez-Valent A. Amendola L., 2018, JCAP, 1804, 051
- González-Morán et al. (2019) González-Morán et al., 2019, MNRAS, 487, 4669
- Gott et al. (2001) Gott III J. R., Vogeley M. S., Podariu S., Ratra B., 2001, ApJ, 549, 1
- Handley (2019) Handley W., 2019, Phys.Rev. D, 100, 123517
- Haridasu et al. (2018) Haridasu B. S., Luković V. V., Moresco M., Vittorio N., 2018, JCAP, 1810, 015
- Jesus et al. (2019) Jesus F. J., Valentim R., Moraes P. H. R. S., Malheiro M., 2019, preprint, (arXiv:1907.01033)
- Just et al. (2007) Just D. W. et al., 2007, ApJ, 665, 1004
- Khadka Ratra (2020) Khadka N., Ratra B., 2020, MNRAS, 492, 4456
- Kumar et al. (2020) Kumar D. et al., 2020, preprint, (arXiv: 2002.06354)
- Lamb Reichart (2000) Lamb D. Q., Reichart D. E., 2000, ApJ, 536, 1
- Lazkoz et al. (2019) Lazkoz R., Francisco S. N. Lobo, Ortiz-Baõ M., Salzano V., 2019, Phys.Rev. D, 100, 104027
- Li et al. (2019) Li E. K., Du M., Xu L., 2019, MNRAS, 491, 4960
- Lin Ishak (2019) Lin W., Ishak M., 2019, preprint, (arXiv: 1909.10991)
- Lindner et al (2020) Lindner M., Max K., Platscher M., Rezacek J., 2020, preprint, (arXiv: 2002.01487)
- López-Corredoria et al. (2016) López-Corredoira M., Melia F., Lusso E., Risaliti G., 2016, International Journal of Modern Physics D, 25, 05
- Lusso et al. (2010) Lusso E. et al., 2010, A A, 512, A34
- Lusso et al. (2019) Lusso E. et al., 2019, AA, 628, L4
- Mania Ratra (2012) Mania D., Ratra B., 2012, Phys.Lett.B, 715, 9
- Martinelli Tutusaus (2019) Martinelli M., Tutusaus I., 2019, Symmetry, 08, 986
- Mehrabi Basilakos (2020) Mehrabi A., Basilakos S., 2020, preprint, (arXiv: 2002.12577)
- Melia (2019) Melia F., 2019, MNRAS, 489, 517
- Mitra et al. (2019) Mitra S., Park C.-G, Choudhury T. R., Ratra B., 2019, MNRAS, 487, 5118
- Ooba et al. (2018a) Ooba J., Ratra B., Sugiyama N., 2018a, ApJ, 864, 80
- Ooba et al. (2018b) Ooba J., Ratra B., Sugiyama N., 2018b, ApJ, 866, 68
- Ooba et al. (2018c) Ooba J., Ratra B., Sugiyama N., 2018c, ApJ, 869, 34
- Ooba et al. (2019) Ooba J., Ratra B., Sugiyama N., 2019, ApSS, 364, 176
- Park Ratra (2018a) Park C.-G., Ratra B., 2018a, ApJ, 868, 83
- Park Ratra (2018b) Park C.-G., Ratra B., 2018b, ApSS, 364, 82
- Park Ratra (2019) Park C.-G., Ratra B., 2019, ApJ. 882, 158
- Park Ratra (2018c) Park C.-G., Ratra B., 2018d, ApSS, 364, 134
- Park Ratra (2020) Park C.-G., Ratra B., 2020, Phys.Rev. D, 101, 083508
- Pavlov et al. (2013) Pavlov A., Westmoreland S., Saaidi K, Ratra B., 2013, Phys. Rev. D, 88, 123513
- Peebles (1984) Peebles P.J.E., 1984, ApJ, 284, 439
- Peebles Ratra (1988) Peebles P.J.E., Ratra B., 1988, ApJ, 325, L17
- Planck Collaboration (2018) Planck Collaboration, 2018, preprint, (arXiv:1807.06209)
- Rameez Sarkar (2019) Rameez M., Sarkar S., 2019, preprint, (arXiv: 1911.06456)
- Rana et al. (2017) Rana A., Jain D., Mahajan S., Mukherjee A., 2017, JCAP, 1703, 028
- Ratra Peebles (1988) Ratra B., Peebles P.J.E., 1988, Phys. Rev. D, 37, 3406
- Riess et al. (2016) Riess A. G., et al., 2016, ApJ, 826, 56
- Rigault et al. (2015) Rigault M. et al., 2015, ApJ, 802, 20
- Risaliti Lusso (2015) Risaliti G., Lusso E., 2015, ApJ, 815, 33
- Risaliti Lusso (2019) Risaliti G., Lusso E., 2019, Nat. Astron., 3, 272
- Ruan et al. (2019) Ruan C.-Z., Melia F., Chen Y., Zhang T.-J., 2019, ApJ, 881, 137
- Ryan et al. (2019) Ryan J., Chen Y., Ratra B., 2019, MNRAS, 488, 3844
- Ryan et al. (2018) Ryan J., Doshi S., Ratra B., 2018, MNRAS, 480, 759
- Samushia et al. (2007) Samushia L., Chen G., Ratra B., 2007, Preprint, (arXiv:0706.1963)
- Samushia et al. (2010) Samushia L., Dev A., Jain D., Ratra B., 2010, Physics Letters B, 693, 509
- Samushia Ratra (2010) Samushia L., Ratra B., 2010, ApJ, 714, 1347
- Sangwan et al. (2018) Sangwan A., Tripathi A., Jassal H. K., 2018, preprint, (arXiv:1804.09350)
- Schöneberg et al. (2019) Schöneberg N., Lesgourgues J., Hooper D. C., 2019, JCAP, 1910, 029
- Scolnic et al. (2018) Scolnic D. et al., 2018, ApJ, 859, 101
- Siegel et al. (2005) Siegel E. et al., 2005, MNRAS, 356, 1117
- Singh et al. (2019) Singh A., Sangwan A., Jassal H. K., 2019, JCAP, 1904, 047
- Sòla et al. (2017) Solà J., Gómez-Valent A., Pérez J. d. C., 2017, Mod. Phys. Lett., A32, 1750054
- Sòla Peracaula et al. (2018) Solà Peracaula J., Pérez J. d. C., Gómez-Valent A., 2018, MNRAS, 478, 4357
- Sòla Peracaula et al. (2019) Solà Peracaula J., Gómez-Valent A., Pérez J. d. C., 2019, Phys. Dark Univ., 25, 100311
- Steffen et al. (2006) Steffen A. T., Strateva I., Brandt W. N. et al., 2006, AJ, 131, 2826
- Tananbaum et al. (1979) Tananbaum H., Avni Y., Branduardi G. et al., 1979, ApJ, 234, L9
- Vagnetti et al. (2010) Vagnetti F., Turriziani S., Trevese D., Antonucci M., 2010, A A, 519, A17
- Velten Gomes (2020) Velten H, Gomes S., 2020, Phys.Rev. D, 101, 043502
- Wang et al. (2019) Wang B., Qi J.-Z., Zhang J.-F., Zhang X., 2019, preprint, (arXiv: 1910.12173)
- Wei (2018) Wei J.-J., 2018, ApJ, 868, 29
- Wei Melia (2020) Wei J.-J, Melia F., 2020, ApJ, 888, 99
- Xu et al. (2019) Xu H., Huang Z., Liu Z., Miao H., 2019, ApJ, 877, 107
- Yang et al. (2019) Yang T., Banerjee A., Colgóin E., 2019, preprint, (arXiv: 1911.01681)
- Yashar et al. (2009) Yashar M. et al., 2009, Phys. Rev. D, 79, 103004
- Young et al. (2010) Young M., Elvis M., Risaliti G., 2010, ApJ, 708, 1388
- Yu et al. (2018) Yu H., Ratra B., Wang F.-Y., 2018, ApJ, 856, 3
- Yu Wang (2016) Yu H., Wang F. Y., 2016, ApJ, 828, 85
- Zamorani et al. (1981) Zamorani G., Henry J. P., Maccacaro T. et al., 1981, ApJ, 245, 357
- Zeng Yan (2019) Zeng H., Yan D., 2019, ApJ, 882, 87
- Zhai et al. (2017) Zhai Z., Blanton M., Slosar A., Tinker J, 2017, ApJ, 850, 183
- Zhai et al. (2019) Zhai Z., Park C.-G., Wang Y., Ratra B., 2019, preprint, (arXiv: 1912.04921)
- Zhang et al. (2017) Zhang B. R. et al., 2017, MNRAS, 471, 2254
- Zhang (2018) Zhang J., 2018, PASP, 130, 084502
- Zhang Huang (2019) Zhang X., Huang Q.-G., 2019, preprint, (arXiv: 1911.09439)
- Zheng et al. (2020) Zheng X. et al., 2020, preprint, (arXiv: 2002.09909)