The Conformational Space of a Flexible Amino Acid at Metallic Surfaces
Abstract
In interfaces between inorganic and biological materials relevant for technological applications, the general challenge of structure determination is exacerbated by the high flexibility of bioorganic components, chemical bonding, and charge rearrangement at the interface. In this paper, we investigate a chemically complex building block, namely, the arginine (Arg) amino-acid interfaced with Cu, Ag and Au (111) surfaces. We investigate how the environment changes the accessible conformational space of this amino acid, by building and analyzing a database of thousands of structures optimized with the PBE functional including screened pairwise van der Waals interactions. When in contact with metallic surfaces, the accessible space for Arg is dramatically reduced, while the one for Arg-H+ is instead increased if compared to the gas-phase. This is explained by the formation of strong bonds between Arg and the surfaces and by their absence and charge screening on Arg-H+ upon adsorption. We also observe protonation-dependent stereoselective binding of the amino acid to the metal surfaces: Arg adsorbs with its chiral CαH center pointing H away from the surfaces while Arg-H+ adsorbs with H pointing toward the surface.
I Introduction
The organic-inorganic interfaces formed between peptides and surfaces are of interest to diverse fields like medicine, optoelectronics and energy storage Wang et al. (2013); Guo et al. (2016); Khatayevich et al. (2014); Mannoor et al. (2012); Guy et al. (2012); Zhao et al. (2008); Sarikaya et al. (2003); Costa et al. (2015); Heinz and Ramezani-Dakhel (2016); Walsh and Knecht (2017). Amino acids and their oligomers – i.e. peptides – are particularly interesting materials because they are naturally biocompatible and offer a rich functional space already at the amino acid level, that can be extended by the combinatorial increase of molecular motifs available through the peptide bond formation. In these setups, the inorganic component offers a platform to immobilize and template the bioorganic counterpart, as well as to record electronic signals from interactions or reactions. However, emergent behavior makes it impossible to base the description of such interfaces solely on the study of its independent components.
On the experimental front, progress on the fundamental understanding of these interfaces has been achieved with recent soft landing techniques Rauschenbach et al. (2017) that allow amino acids and peptides of a few tens of building blocks to be deposited on solid surfaces and subsequently imaged in ultra-high vacuum conditions employing scanning tunneling microscopy (STM) Rauschenbach et al. (2016). These experiments have shown that small sequence modifications, changes in the protonation of a peptide, and charge transfer at the interface can yield drastic changes in the two-dimensional structure and self-assembly Rauschenbach et al. (2017); Abb et al. (2016); Méthivier et al. (2016).
Explaining the physical mechanisms that govern adsorption and pattern formation calls for systematic theoretical investigations with atomistic resolution of such interfaces. However, such studies are challenging as they require (i) accurate energetics for a system build-up of elements across the periodic table and where considerable charge rearrangement and chemical reactions can occur (ii) sampling and representing a large conformational space, and (iii) dealing with structure motifs that can only be represented by unit-cells containing hundreds of atoms. Pioneering work that used density-functional theory (DFT) to study amino-acid at inorganic substrates has focused on small or rigid amino acids, and a limited portion of their conformational space Di Felice et al. (2003); Di Felice and Selloni (2004); Ghiringhelli et al. (2006); Arrouvel et al. (2007); Iori et al. (2008). One of the first studies that was dedicated to larger amino acids was performed by Hong and coworkers Hong et al. (2009) and illustrates the challenge of properly sampling the large structure space of flexible biomolecules. These studies have clarified that an accurate energy function is only one of the ingredients needed to properly predict the structure of peptides at surfaces, with the sampling of structure space being just as important.
We propose to analyze how the structure space of a complex building block with multiple functional groups is affected by changes in its (non-biological) environment. To achieve this goal, we analyze a database of the arginine (Arg) amino-acid and its protonated counterpart (Arg-H+) in the gas-phase and interfaced with Cu(111), Ag(111) and Au(111). Arginine is a good test bed because it is a relatively small molecule, but yet contains a very flexible side-chain and allows for different stable protonation states. We show that it is possible to perform an exhaustive conformational space exploration while still treating the potential-energy surface (PES) with DFT, thus capturing the charge rearrangements at the interface. The outcome of such a computational structure-search is a large number of stationary-states on the respective PES, where not only the global minimum is of interest. Also the relative positioning of other local minima with respect to the structural degrees of freedom, as well as with respect to the energy scale of the PES, are relevant because they can reveal different basins and structures of interest under different conditions Ropo et al. (2016a); Rossi et al. (2013, 2014); Schubert et al. (2015); Baldauf and Rossi (2015). In order to handle such high-dimensional data, we make use of recent advances in machine-learning methods that can help to visualize conformational preferences of adsorbed molecules Ceriotti et al. (2011); Tribello et al. (2012); Ceriotti et al. (2013); De et al. (2016); Bartók et al. (2017); De et al. (2017).
In the following, we discuss the impact of the protonation state and the presence or absence of the surface on the accessible conformational space of arginine. We start by describing the procedure we followed to build the database of Arg and Arg-H+ on Cu(111), Ag(111), and Au(111), based on thousands of first-principles structure optimizations which we make available to the community Maksimov et al. . We then analyze this database and show how different patterns of bonding and charge transfer induce fundamental changes in the accessible conformational space. We also provide an analysis of property trends across the different metallic surfaces, including protonation-dependent stereoselective binding to the surfaces and deprotonation propensities.
II Computational methods
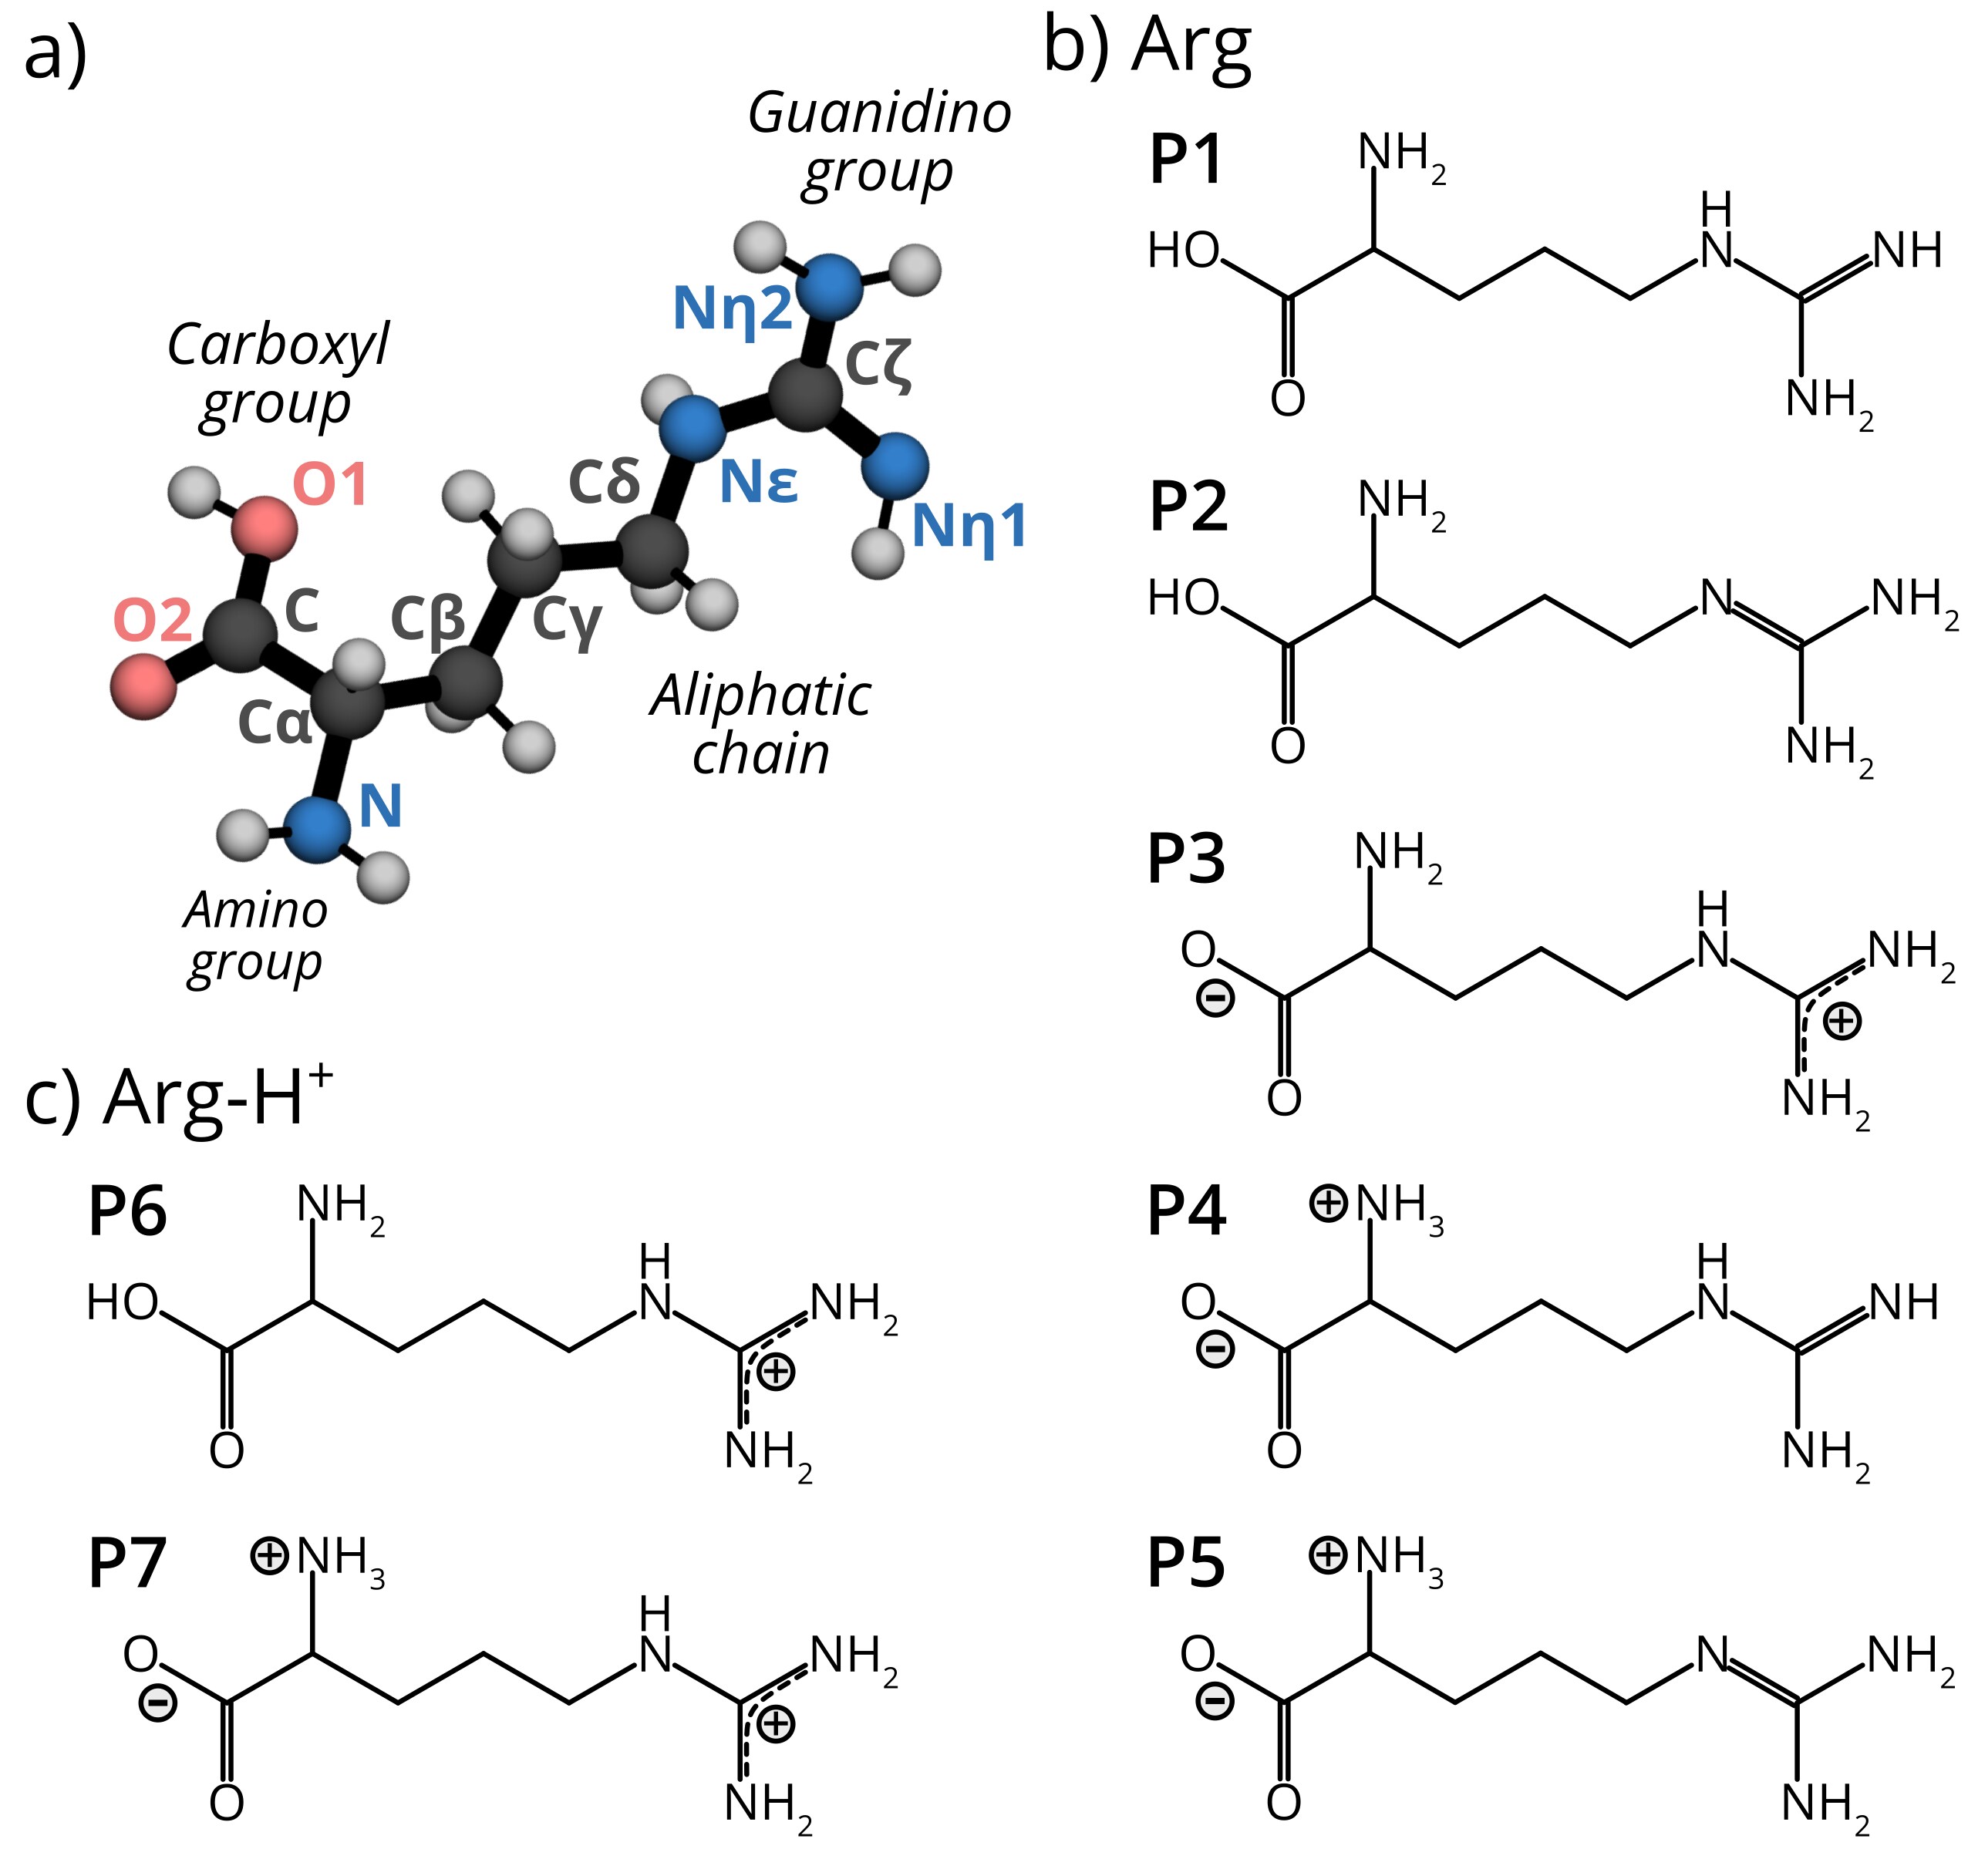
Arginine is an amino acid with a flexible side-chain of three (aliphatic) CH2 groups and a guanidino group. A depiction of the Arg molecule including the labeling of the different chemical groups and specific atoms we will refer to in the manuscript is shown in Fig. 1(a). In the context of this publication we use the term protonation state to distinguish between Arg and its singly-protonated form Arg-H+. We use the word protomers to distinguish different arrangements of protons within molecules of the same sum formula, for example the protomers P1 to P5 of Arg or the protomers P6 and P7 of Arg-H+, shown in Fig. 1(b) and (c). In this section, we describe the computational setup, convergence tests, and sampling strategies we employed in order to build the database of Arg and Arg-H+ adsorbed on different metal surfaces.
All the electronic structure calculations were carried out using the numeric atom-centered basis set all-electron code FHI-aims Blum et al. (2009); Havu et al. (2009). We used the standard light settings of FHI-aims for all species, except when stated otherwise. For modeling the adsorbed molecules, a surface unit cell with -point sampling was employed. The slab contains 4 layers and we added a 50 Å vacuum in the direction in order to separate periodic images of the system. A surface unit cell of this size does not completely isolate neighboring molecules on the surface plane. In order to estimate the magnitude of this spurious interaction, we calculated binding energies for three Arg and three Arg-H+ structures adsorbed on Cu(111) using different surface unit cell sizes. As shown in the SI (Tables S3 and S4), the relative binding energies change by no more than 50 meV when reaching a cell.
An accurate description of the dispersion interactions that play a role in weakly-bonded adsorbates on metallic surfaces can be achieved with newly-proposed methods that take into account electronic screening and the the many-body nature of the dispersion term Hermann and Tkatchenko (2019); however, such methods are not yet computationally feasible for large-scale studies. Considering dispersion interactions is, however, crucial to model such interfaces Ruiz et al. (2016); Ruiz Lopez (2016); Liu et al. (2013, 2012); Al-Saidi et al. (2012); van Ruitenbeek (2012); Wagner et al. (2012); Carrasco et al. (2014). We thus employ the PBE exchange-correlation functional augmented by the TS-vdW Ruiz et al. (2016) dispersion correction between pairs of atoms that involve the adsorbed molecule (molecule-molecule and molecule-surface dispersion). Adding pairwise vdW corrections for pairs of metal atoms did not result in a systematic improvement of the lattice constants due to the complex many-body nature of the electronic screening within the metallic bulk. Because the PBE lattice constants for Cu, Ag, and Au are in good agreement with experimental data (see Table S1 of the SI) and the electronic structure itself is not changed by the inclusion of these types of vdW interactions, we chose to use the simplest setup. We optimized all structures until all forces in the system were below 0.01 eV/Å . We also fixed the two bottom layers of the slabs in all optimizations. A dipole correction was applied in direction to compensate for the dipole formed by the asymmetric surface configurations.
II.1 Database Generation
The sampling of the structure space of the amino acid in two protonation states on metallic surfaces was performed by starting from a previously published data-set comprising stationary points of isolated amino acids and dipeptides Ropo et al. (2016b, a). For Arg, 1206 structures were present in the database. In order to reduce the number of possibilities, but keeping a representative share of the structures, we considered the 300 lowest energy conformers, the 27 highest energy conformers, and 125 conformers uniformly spanning the energy range in between. For the Arg-H+ amino acid, all 215 structures present in the gas-phase data set were used in this study.
We distinguish upstanding positions of the molecules where the largest principal axis of the molecule is approximately perpendicular to the surface plane, from flat lying positions with an arrangement parallel to the surface. For Arg, 3 lying configurations per structure were generated by randomly placing the molecule flat on the Cu(111) surface and then rotating it by around the principal axis. Two upstanding configurations were generated for the 25 lowest-energy gas-phase structures by first placing the molecule in a random upright orientation and then flipping it. For Arg-H+ a similar procedure was adopted: flat lying positions were created by rotations around the principal axis and upstanding configurations were created for 27 structures that were uniformly selected from the whole energy range. In summary, we considered a total of 1156 conformers of Arg@Cu(111) and 914 conformers of Arg-H+@Cu(111).
All optimized structures that fell within a range of 0.5 eV from the global minimum on Cu(111) were transferred to Ag(111) and Au(111) and further optimized. In addition, we randomly picked 105 Arg-H+ structures representing the higher energy range on Cu(111) to be further optimized on Ag(111) and Au(111). Moreover, for Arg, 180 randomly picked structures representing the higher energy range were considered on Ag(111) and 61 on Au(111). The total amount of calculated structures for each case is summarized in Table 1.
| Gas phase | Cu(111) | Ag(111) | Au(111) | |
|---|---|---|---|---|
| Arg | 1206 | 1156 | 327 | 209 |
| Arg-H+ | 215 | 914 | 718 | 721 |
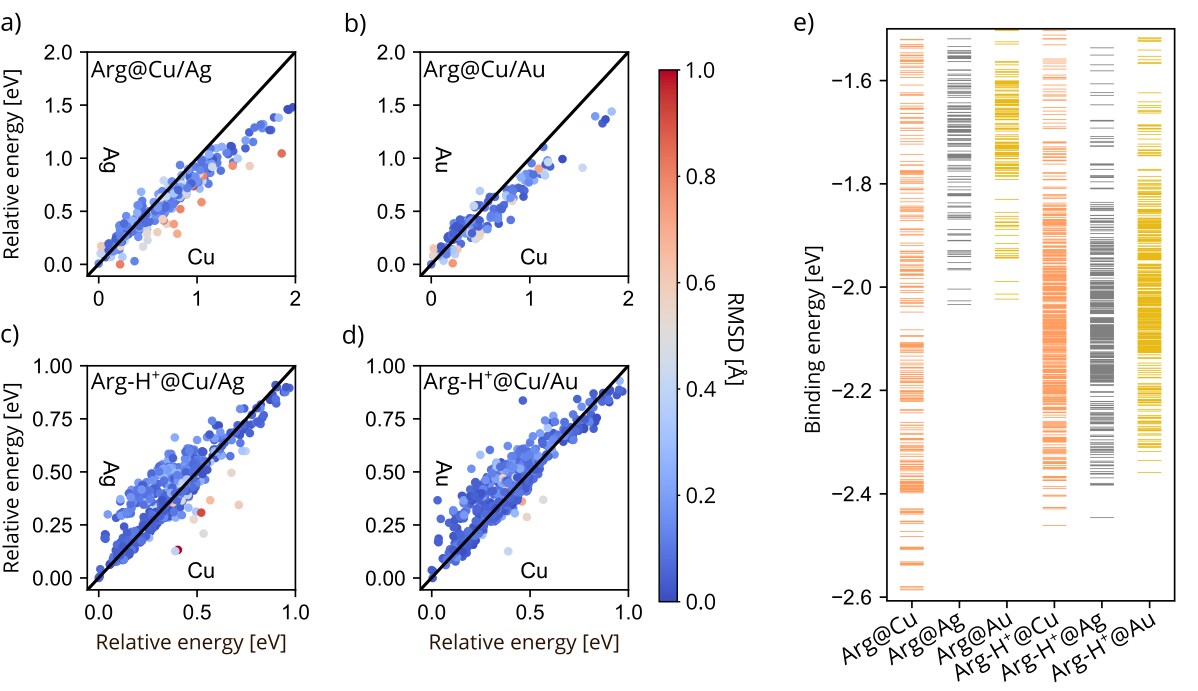
We checked that this strategy ensured a sufficient sampling of the low-energy range of both Arg and Arg-H+ on Ag(111) and Au(111) by analyzing the alterations in relative energy hierarchies on the different surfaces. In Fig. 2(a-d) each dot corresponds to a conformer that was optimized first on the Cu(111) surface and then post-relaxed on Ag(111) or Au(111). Within the lowest 0.5 eV range, we do not observe any significant rearrangement of the energy hierarchy with respect to the Cu(111) surface. The energy hierarchies of both Arg and Arg-H+ on the Ag(111) and Au(111) surfaces are almost identical. The most pronounced outliers in all plots correlate with a higher root mean square displacement (RMSD) of the molecular atoms (i.e. disregarding the surface-adsorption site), thus pointing to a structural rearrangement of the molecule.
II.2 Structure space representation and analysis
We analyse the structure space of all systems considered, as well as its alterations by employing a dimensionality reduction procedure that makes it more intuitive to understand the high-dimensional space. Following Ref. De et al. (2017), we represent the local atom-centered environments of the structures through the smooth overlap of atomic positions (SOAP)Bartók et al. (2017) descriptors. We then obtain the similarity matrix between different conformers with the regularized entropy match kernel (REMatch) De et al. (2016). We used SOAP descriptors with a cutoff of 5.0 Å, a Gaussian broadening of Å and an intermediate regularization parameter =0.01. SOAP kernels were calculated only for heavy atoms in the molecule (disregarding metal and hydrogen atoms) and were obtained using the GLOSIM package De et al. (2016); Ceriotti et al. .
For the dimensionality-reduced representation, we here chose to use the multi-dimensional scaling (MDS) algorithm as implemented in the scikit-learn packagePedregosa et al. (2011). This algorithm is similar to the Sketchmap algorithm previously employed in Ref. De et al. (2017), but we found it more suitable for the data at hand, which is composed of decorrelated local stationary-points, instead of structures generated from molecular dynamics trajectories. In short, the low-dimensional map was obtained considering all calculated structures of Arg in the gas-phase and through minimizing the stress function
| (1) |
where is the similarity between structures and in the high-dimensional space and the Cartesian distance in the low-dimensional (2D) space. We then projected structures in different environments onto the pre-computed map of gas-phase Arg by fixing the parameters of the map and finding the low-dimensional coordinates that minimize
| (2) |
where the sum runs over all structures in the optimized gas-phase Arg map and represents the high-dimensional representation of the new structure to be projected. In order to classify structural patterns, we employ the following notations:
-
•
We represent the protomers by the labels shown in Fig. 1(b) and (c).
-
•
We identify the presence of strong intramolecular hydrogen bonds (H-bonds) whenever the distances between the hydrogen connecting donor and acceptor are below 2.5 Å. We label the H-bond pattern between two atoms in the molecules according to the nomenclature shown in Fig. S3 in the SI.
-
•
We further classify the structures according to the longest distance between two heavy atoms in the molecule.
II.3 Binding energies and charge rearrangement
The binding energies for each structure were calculated as follows. For neutral Arg we computed where corresponds to the total energy of the interface, is the total energy of the pristine metallic slab and the total energy of the lowest energy gas-phase conformer.
For charged Arg-H+, we considered the binding energy of a two-step reaction. First, the interface is formed between the charged molecule and the clean surface: where the total energy of the most stable gas-phase conformer of the isolated charged molecule. Second, an electron from the metal neutralizes the unit cell where the adsorbed molecule is located, yielding where corresponds to the Fermi energy of the metallic surface. The final binding energy is thus considered to be
| (3) |
For reference, we report the values we used for at each surface in Table S5. These binding energies are shown in Fig. 2d, and will be discussed in detail in Section III.
In addition, for conformers within 0.1 eV of the respective global minimum of each system, we have calculated free energies at finite temperatures within the harmonic approximation McQuarrie (2000); Fultz (2010), in order to address question about thermal stability of such structures. We have calculated where is the total energy obtained from DFT, and we have used textbook expressions for the harmonic vibrational Helmholtz free energy . We have calculated the Hessian matrix only taking into account displacements of the adsorbate. The surface was only considered as an external field, which is a good approximation for physisorbed systems.
To address charge rearrangements after adsorption on the surface, we calculated electron density differences for selected structures on each surface by computing and in the case of Arg and in the case of Arg-H+. In these expressions, is the total electron density of the interface, is the electron density of the slab without molecule, and and are electron densities of neutral Arg and charged Arg-H+ molecules with the same geometries as in interface. The sign denotes that the final density difference integrates to +1 electron in the case of Arg-H+.
III Results and discussion
III.1 The unconstrained structure space: Arg in isolation
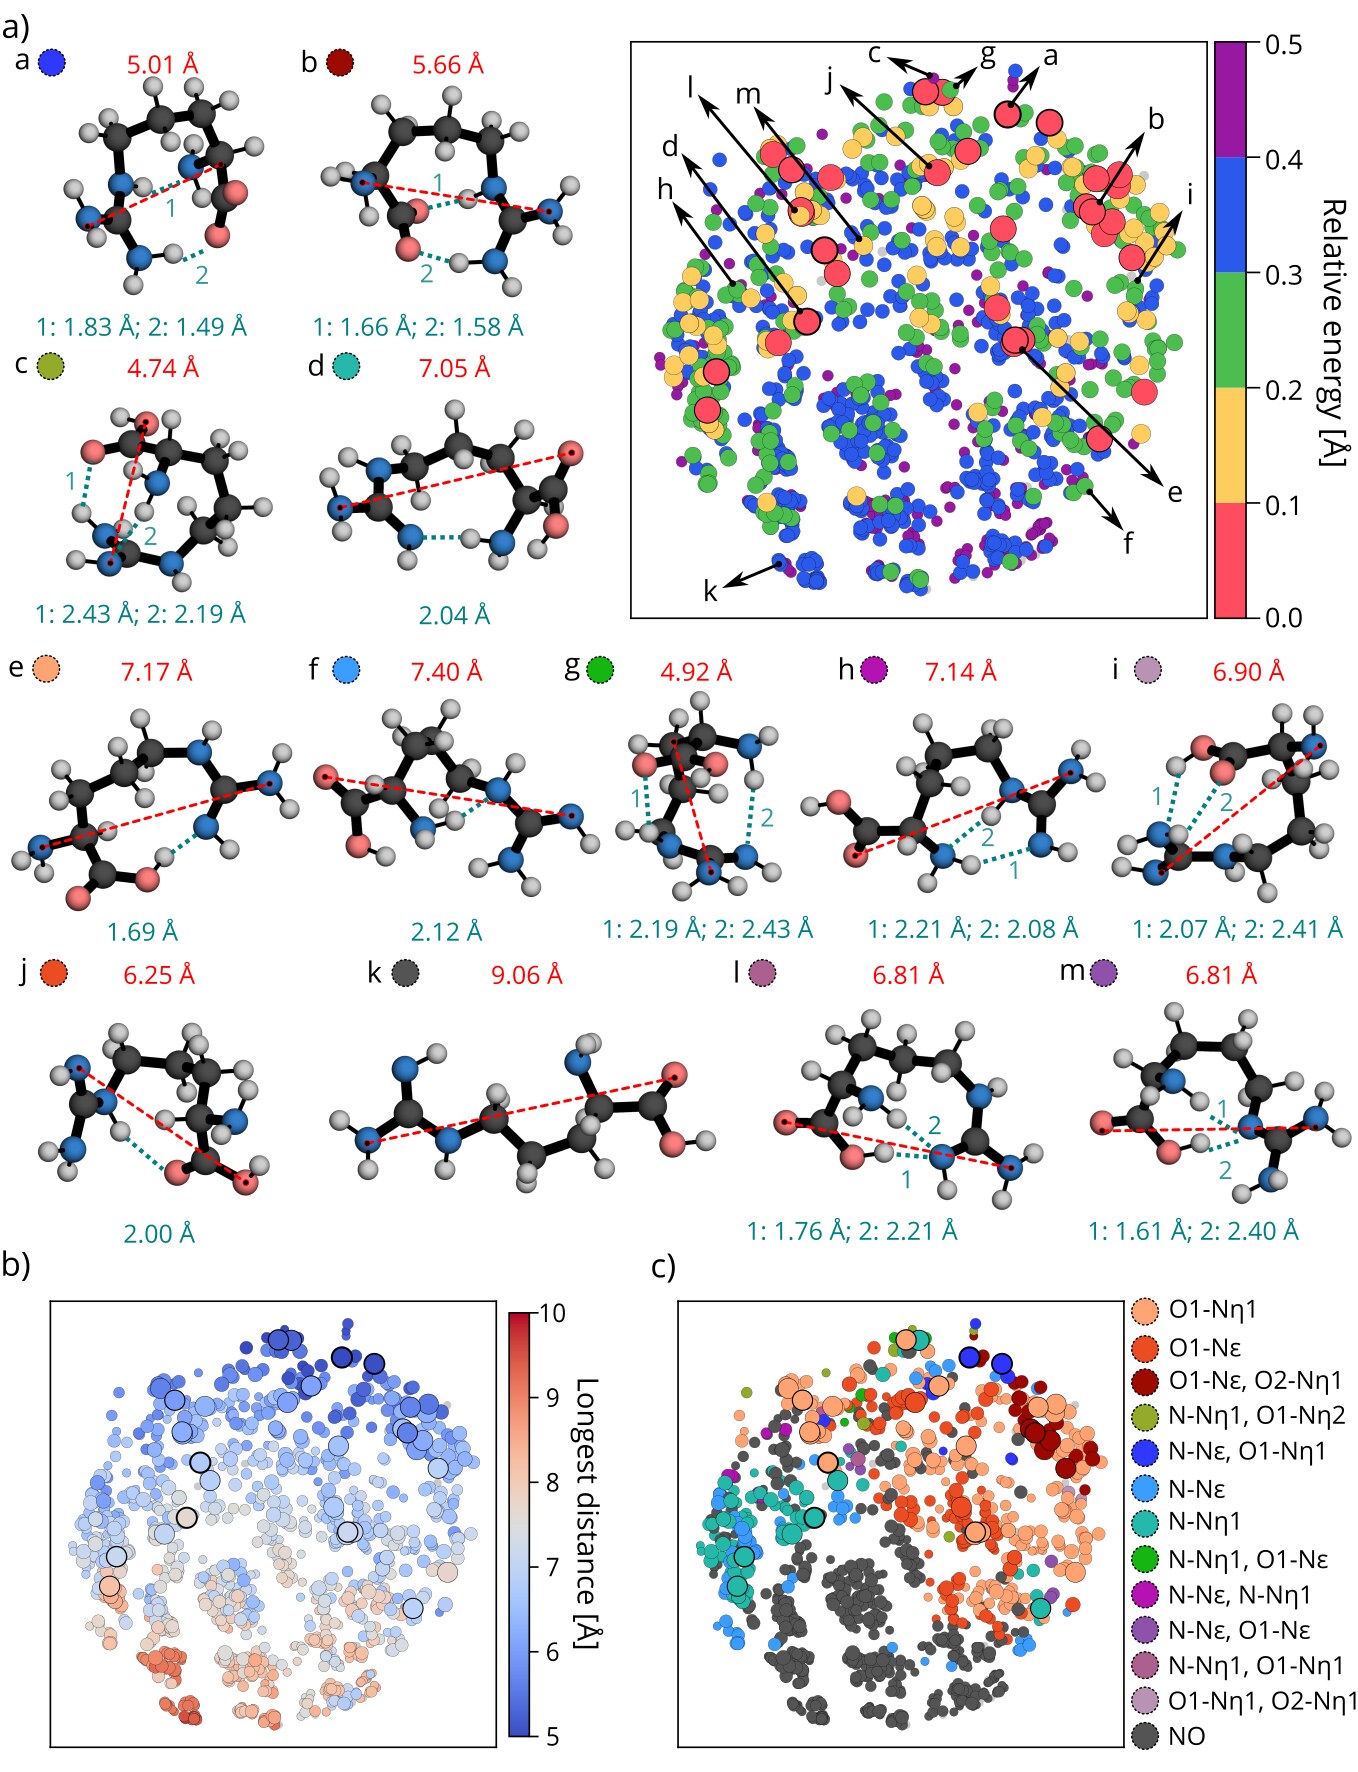
We start by analysing the unconstrained conformational space of Arg in isolation, which is formed by more than 1200 local stationary states Ropo et al. (2016b, a). In order to rationalize different structural arrangements in this space, we utilize the dimensionality-reduction algorithm discussed in Section II.2 and build a two-dimensional map. On this map, shown in Figure 3(a), each dot represents one structure. A close proximity of the dots implies similarities of the heavy-atom arrangement between the conformations. This is the low-dimensional map that is taken as a reference for comparison throughout this manuscript.
We proceed to color-code the dots on the map according to different properties. In Fig. 3(a) we show the map colored by the relative energy of each structure with respect to the global minimum . We only color structures with eV. The region with eV is colored red and is represented by 32 different structures that occupy different parts of the map. The dominant protomer (98.6%) among these conformers is the one labeled P1 in Fig. 1, i.e. non-zwitterionic. However, the lowest energy structure, labeled a in panel (a) of Fig. 3, is protomer P3, with a shared proton between the carboxylic and the guanidino group. This structure is compact, with the longest distance within the molecule of only 5.01 Å and presenting two strong intramolecular H-bonds. Zwitterionic protomers, denoted as P4 and P5 in Fig. 1, do not appear in the gas-phase.
Inspecting the map in Fig. 3(a), it is clear that low-energy conformers are almost exclusively present in the upper hemisphere of the plot. This can be rationalized in terms of the structural motifs that occupy these two halves of conformational space: In Fig. 3(b), we color-code the dots in terms of the longest extension of the conformers. While the upper hemisphere features compact structures, the lower hemisphere of the map is populated by extended conformers (with longest extensions between 7.5 Å and 10.0 Å). Many of them do not contain any H-bond or contain only one H-bond between the carboxyl and amino group. Extended conformers of Arg are energetically unfavoured in the gas-phase as the formation of strong H-bonds is crucial for the stabilization of Arg in isolation. Comparing the different plots in Figure 3, we see that all low-energy structures with eV are indeed compact with one or two H-bonds.
In Fig. 3(c), we identify in total 13 different families with respect to the number and character of H-bonds in the molecule, with eV. Representative structures of all families are shown in panel (a). This family classification helps us understand why in Fig. 3(a) there are structures of higher energies at similar regions as structures with lower energies. Even though these structures are typically in the same protomeric state and have a similar arrangement of the heavy-atoms, the carboxyl group can rotate, giving rise to different H-bond patterns. These different arrangements can give rise to energy differences of up to 0.2 eV, as exemplified in Fig. S4 in the SI. Including hydrogens in the SOAP descriptors used to build the 2D map could provide a better energy separation, but it would prevent us from comparing different protonation states, as shown in the next section.
III.2 Adding a proton: Arg-H+ in isolation
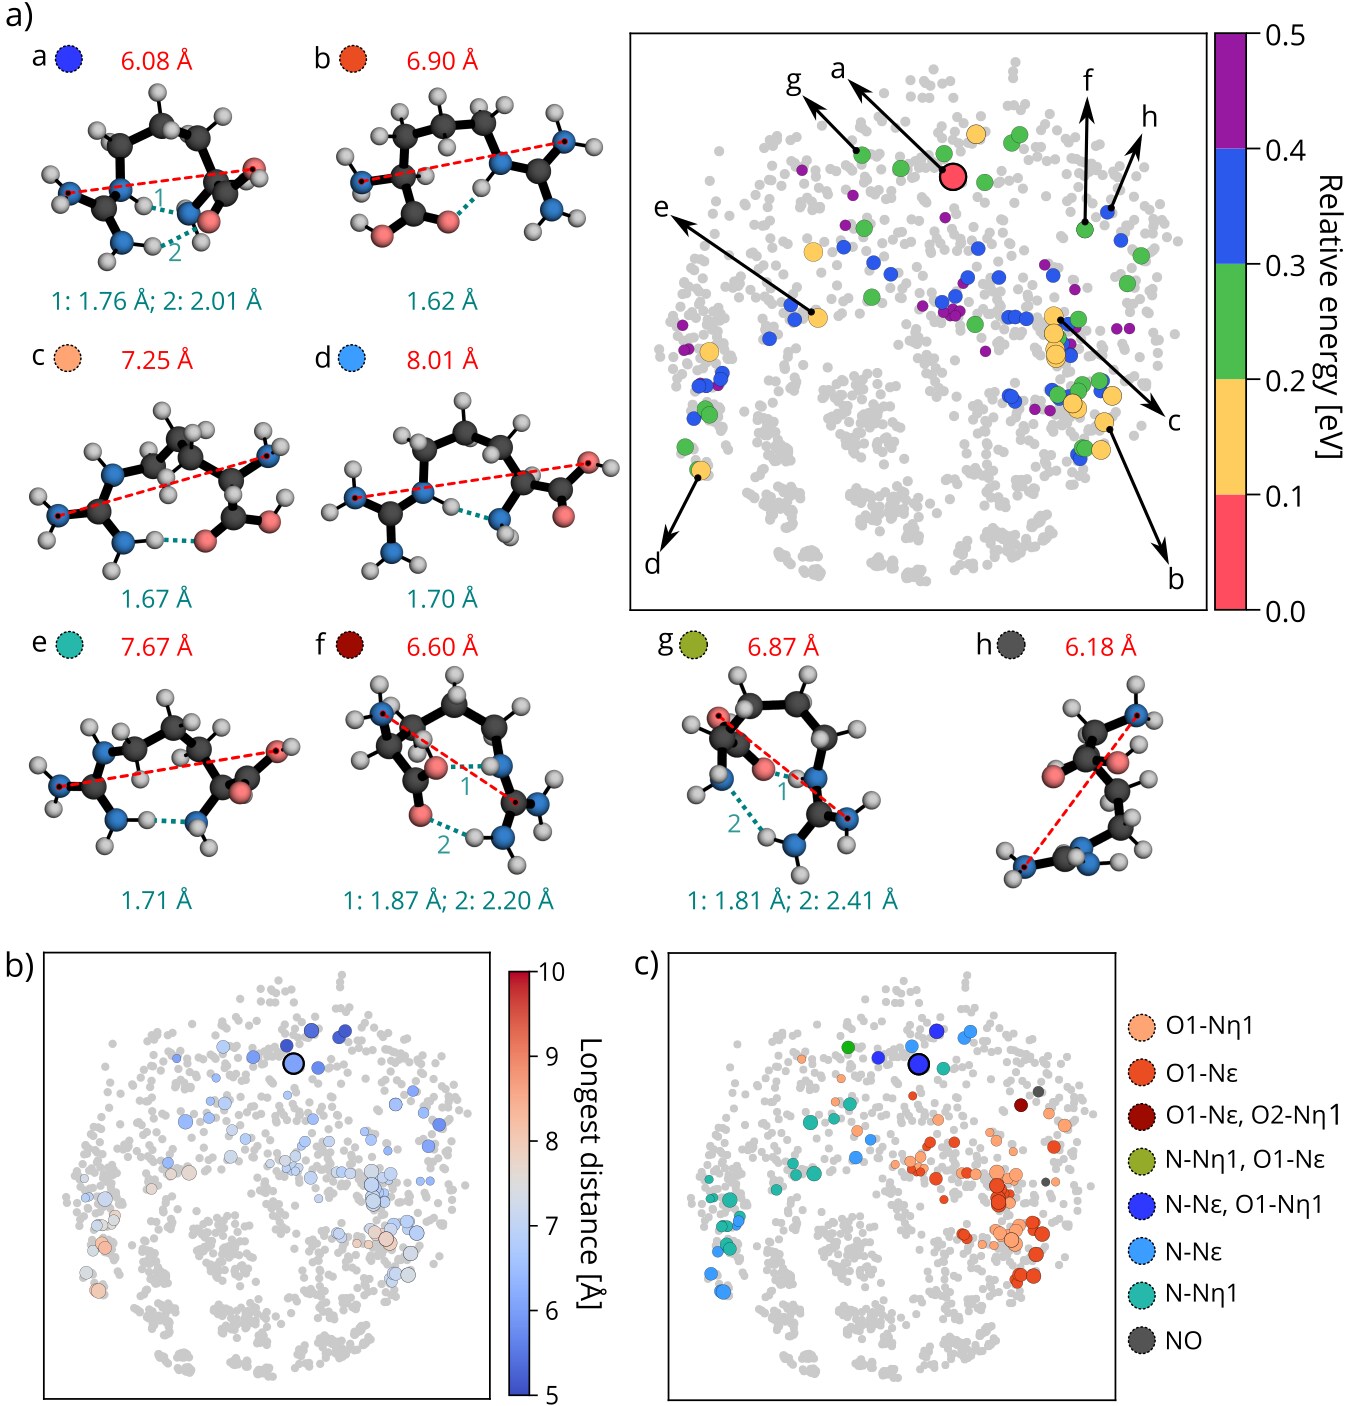
Arg-H+ is of particular interest as it is the most abundant form of this amino acid under physiological pH conditions Bolger (1995), and we thus investigate changes of the conformational space introduced by the addition of a proton to the Arg amino-acid. To that end, we plot a projection of all stationary points of the Arg-H+ PES with eV (referenced to its own global minimum) onto the map that was previously created for Arg. In Fig. 4(a), we color the dots in the map according to , in Fig. 4(b) according to the longest distance between heavy atoms in the molecule, and in Fig. 4(c) according to the H-bond pattern. The grey dots in the maps represent all points in the Arg map of Figure 3 and are shown for ease of comparison.
The unique conformation types of Arg-H+ can be grouped into 8 different families in this energy range, which are represented in Fig. 4(a). Most families only have one H-bond and there are no zwitterionic protomers. This means that in isolation only the protomer P6 is populated. It is worth noting that under physiological conditions (in solution), the zwitterionic protomer P7 is preferred.
There are only two very similar structures (same family) with eV in this case. The global minimum, labeled a in Fig. 4(a), contains two H-bonds within the molecule, between atoms N-N and O1-N (see Fig. 1). This particular structure resembles the lowest-energy structure of Arg with a proton added to the carboxyl group. This protonation results in an extension of the molecule by around 1 Å. That correlates with the location of the lowest-energy structure being slightly shifted on the map towards the region containing more extended structures.
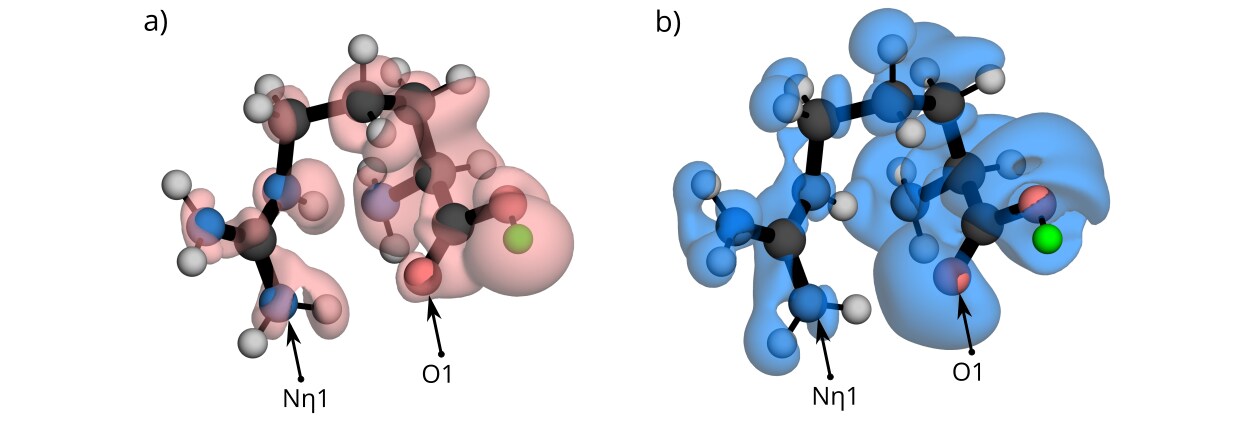
We note that the structure space of Arg-H+ is contained within the conformational space of Arg and also drastically reduced in numbers if compared to Arg: There are only 108 structures with eV, compared to 1179 structures in the Arg case. In this energy range, regions of the map with very compact and very extended structures are not populated in this protonation state. This can be traced to the constraint imposed by the addition of the proton, that make extended structures less stable due to the strong driving force to neutralize the charge imbalance created by the proton on the guanidino group. To rationalize why the most compact conformers are also less populated, we show in Fig. 5 the electron-density differences between the lowest energy Arg-H+ conformer and an Arg conformer created by fixing the same Arg-H+ structure, but neutralizing the charge and removing the hydrogen connected to the carboxyl group. This modification yields the same covalent connectivity observed in the global minimum of Arg. We show isosurfaces corresponding to electron accumulation in Arg-H+ in red and electron depletion in Arg-H+ (accumulation in Arg) in blue. We observe a density surplus between the O1 and N atoms in Arg, favoring the formation of a stronger H-bond leading to a more compact structure.
III.3 Adsorption of Arg on Cu, Ag, Au (111) surfaces
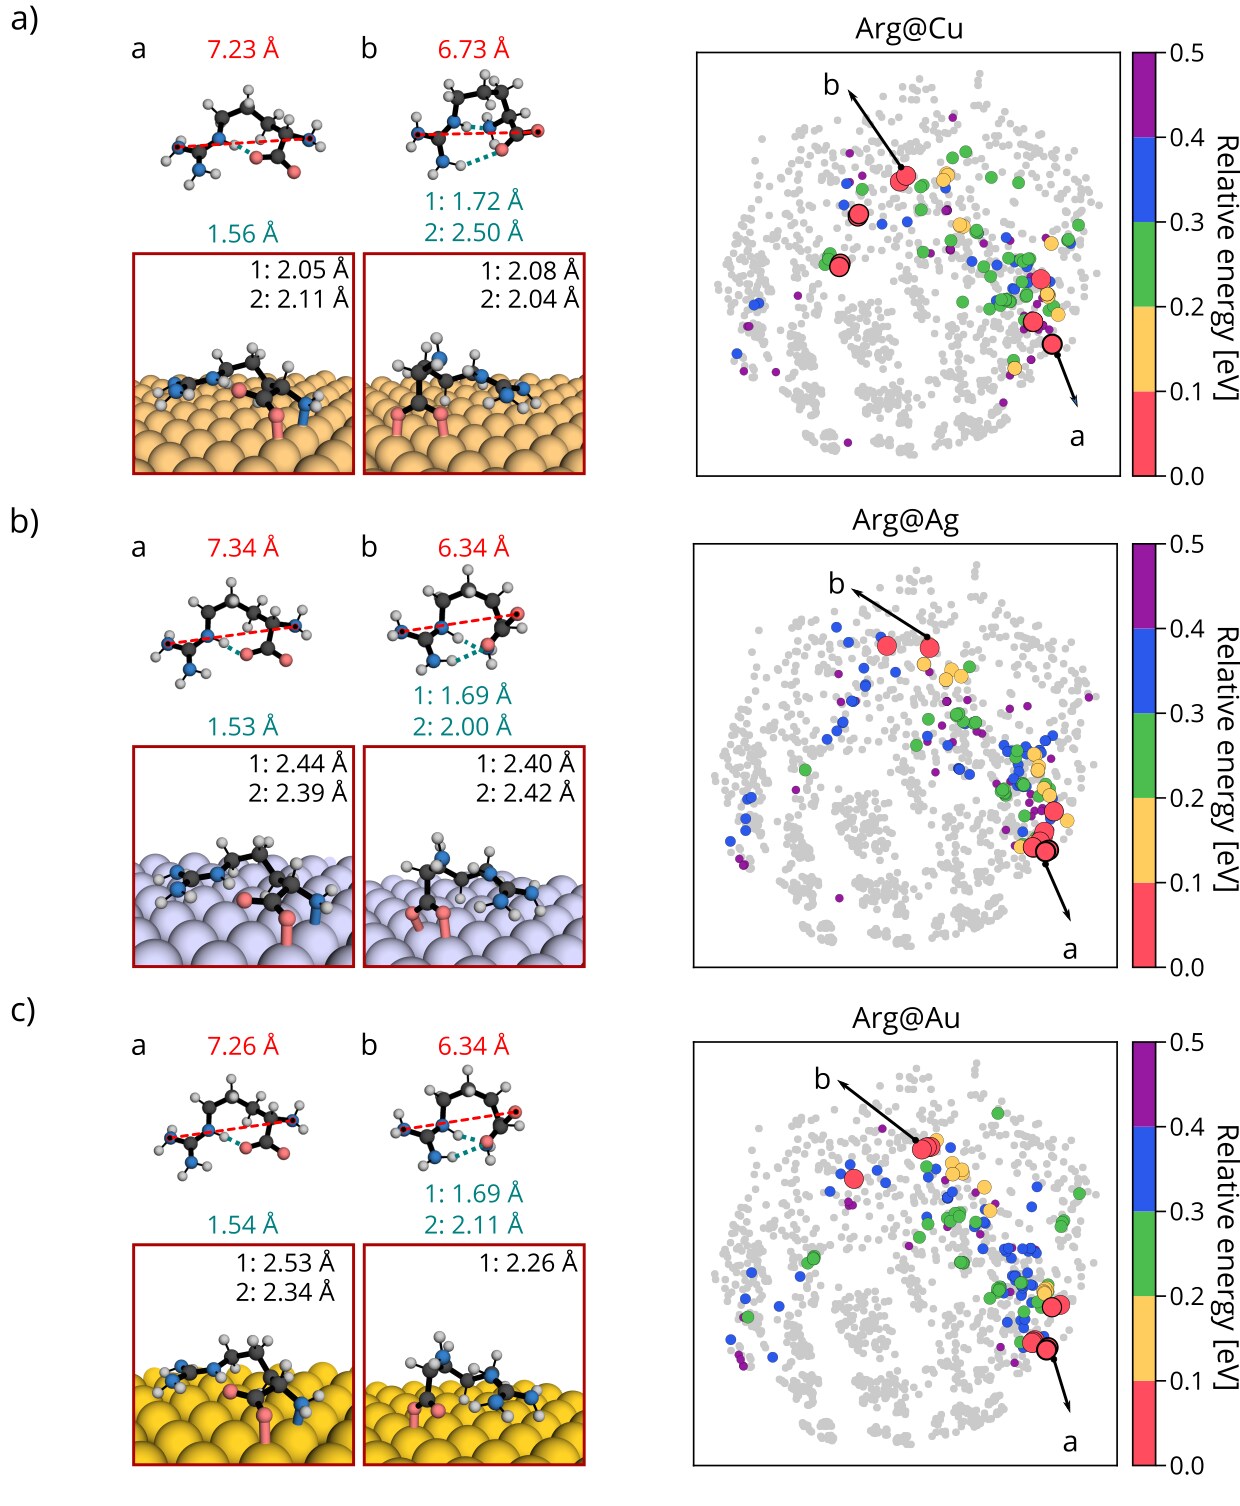
We now turn to the analysis of the conformational space of Arg when in contact with metal surfaces, namely Cu(111), Ag(111), and Au(111). In Figure 6, we show map-projections of the stationary points with eV (referenced to each respective global minimum) of Arg adsorbed on the three surfaces. The conformational space of Arg upon adsorption is reduced and the conformers occupy similar regions of the map as the ones from Arg-H+. We will learn in the following that this is mainly due to the formation of strong bonds with the surface that result in steric constraints of the space and also partially due to electron donation from the molecule to the metallic surfaces.
The lowest energy structure lies on the same part of the map on all surfaces, which is different from the area where the gas-phase global minimum of Arg was located. These conformers, labeled a in Figure 6(a), (b) and (c) form a strong H-bond between atoms O1 and N. The longest distance within molecule lies between 7.20-7.35 Å. This structure binds most strongly to all three surfaces through its amino and carboxyl groups.
Other low-energy structures in all surfaces form strong bonds to the surfaces only through the carboxyl group, as exemplified by the structure labeled b in all panels of Fig. 6. These bonds are formed most favorably on top positions, i.e. vertically on top of a surface metal atom. In particular for Cu(111), the atomic spacing of the Cu atoms on the surface favors both oxygens to bind on top positions simultaneously.
The favorable formation of these bonds is connected with the fact that all conformers with eV are in the protomeric state P3, in which the carboxyl group is deprotonated. The bonds to the surface and a favorable vdW attraction effectively flatten the molecular conformation, thus energetically favoring more elongated structures. Protomers of type P1, which was dominant in the gas-phase, only appear with eV on Cu and Ag, and with eV on Au. Protomers P4 and P5 are again not observed. Regarding the intramolecular H-bond patterns, within 0.5 eV from the global minimum we can identify 7 different families on Cu(111), and 6 families on both Ag(111) and Au(111). These families contain H-bonds where the carboxyl group predominantly participates. All families are represented in Table S4 in the SI.
III.4 Adsorption of Arg-H+ on Cu, Ag, Au (111) surfaces
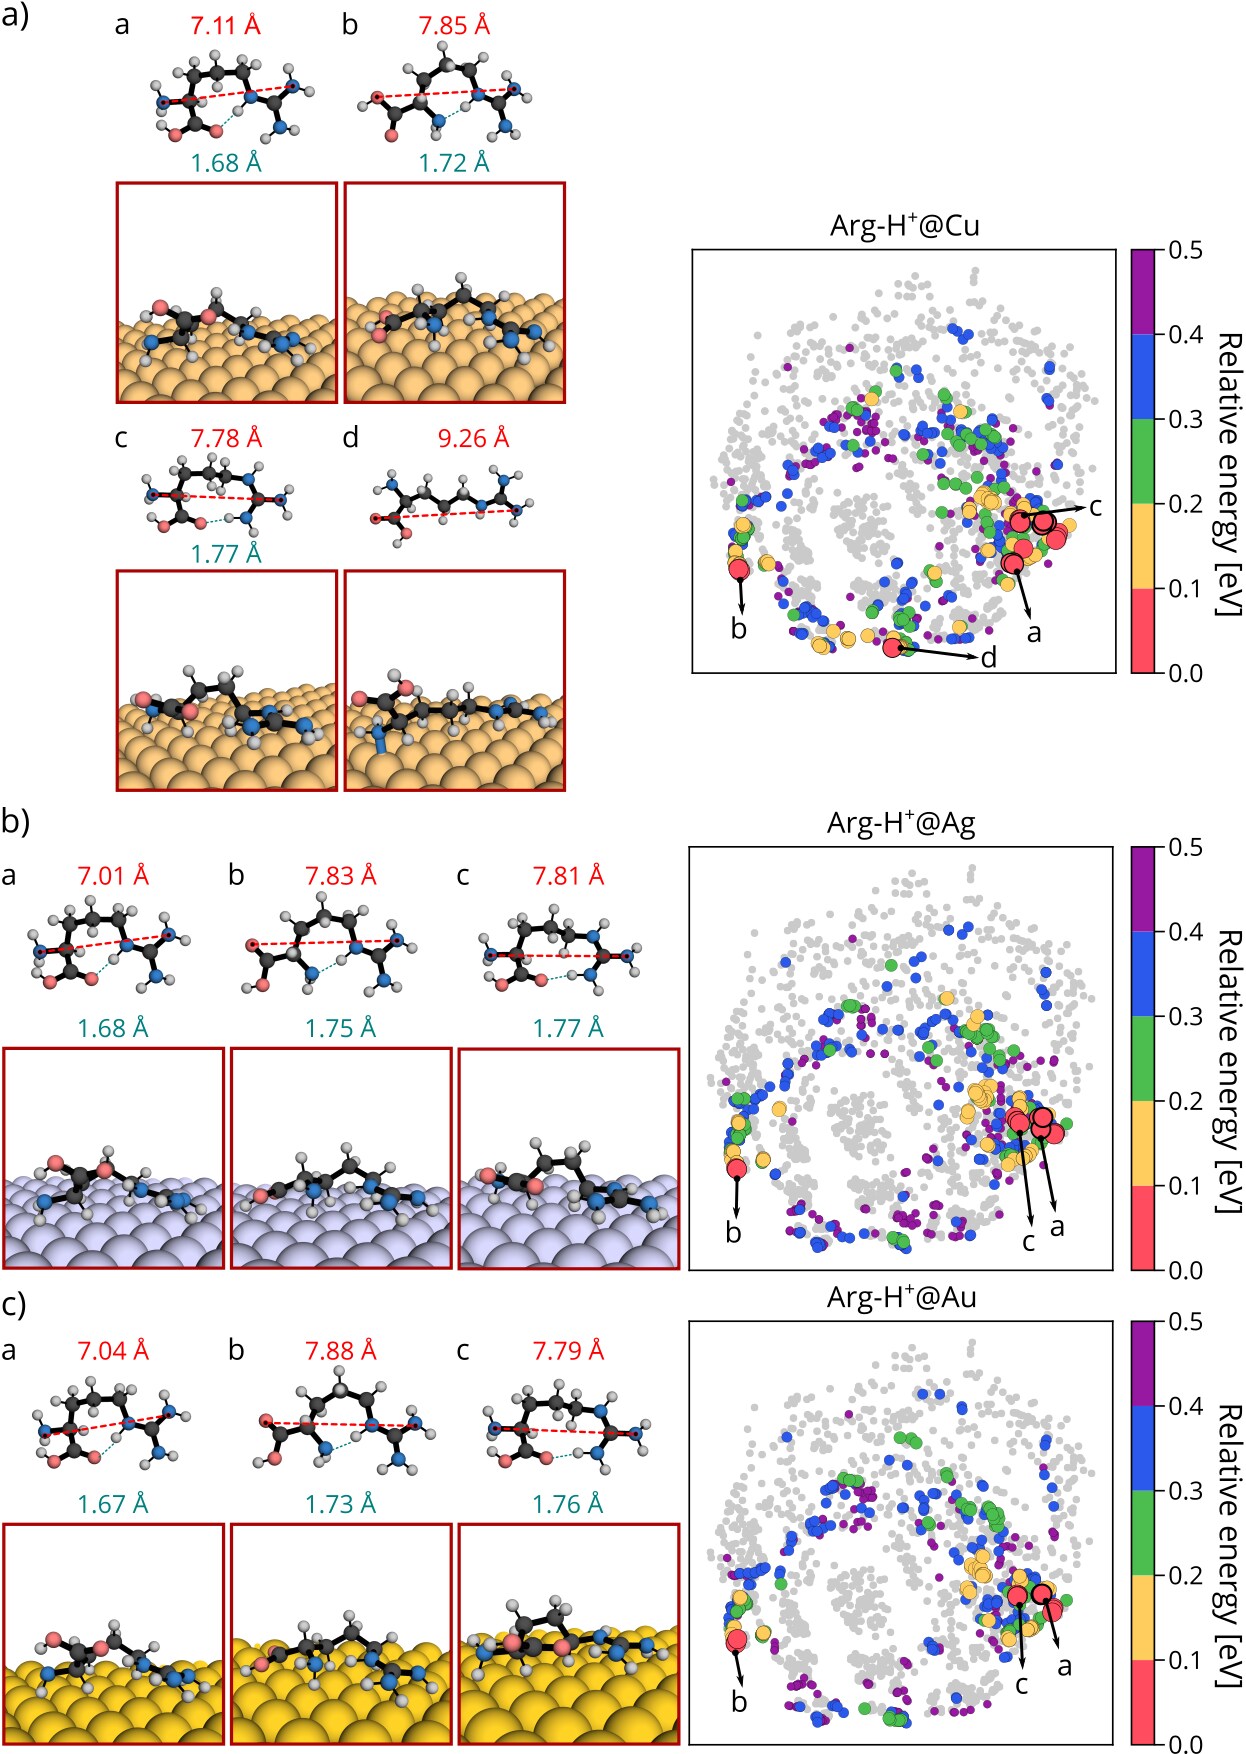
Finally, we characterize the conformational-space changes arising from the simultaneous addition of a proton and the adsorption onto metallic surfaces. In Figure 7, we show the projection of Arg-H+ conformers adsorbed on Cu, Ag, and Au(111) onto the map of isolated Arg. These projections, in particular the comparison of the plots in Figs. 6 and 7, reveal that the conformational space of adsorbed Arg-H+ is larger than the one of adsorbed Arg. While Arg-H+ features more than 500 conformers within eV, Arg only counts about 150 conformers in the same energy range. Interestingly, the adsorption of Arg-H+ to a metal surface also results in an increase of the occupied structure space in comparison to isolated Arg-H+ (108 structures with eV), shown in Fig. 4. In fact, the structures occupy similar regions of the map as the ones occupied by Arg-H+, with the addition of extended structures that are located in the bottom of the map.
We identify 4 different families on Cu(111) and 3 on Ag(111) and Au(111) with eV. Representative conformers of these families are shown in Fig. 7. The lowest energy conformer, labeled a in Fig. 7(a)-(c), appears on all surfaces at the same region of the map as for adsorbed Arg. The largest distance within the molecule lies around 7 Å and it also has a strong H-bond linking the carboxyl-O and the N atoms. The structure, however, does not present the same orientation to the surface as compared to the lowest energy conformer of Arg, and does not form strong bonds with the surface. With the exception of the extended structure on Cu(111), labeled d in Fig. 7(a), all conformers with eV on all surfaces contain one intramolecular H-bond involving either carboxyl-O and N atom (labeled a), backbone N and N atoms (labeled b) or carboxyl O and a N atom (labeled c). Compared to adsorbed Arg, adsorbed Arg-H+ structures become on average 1.0 Å more extended (see SI). The guanidino and carboxyl groups often lie parallel to the surface. The protomer P6, the only one present in the gas-phase, is dominantly populated also on the surfaces. However, we do observe very few conformers in the zwitterionic P7 state. These structures are at least 0.2 eV higher in energy than than the global minimum.
With respect to the number of bonds that Arg-H+ forms with the surface, the picture is very different from adsorbed Arg. Within the lower 0.15 eV, we do not observe short (strong) bonds of O or N atoms to the surfaces. This lack of constraint by the surface contributes to the increased structure space of adsorbed Arg-H+. In addition, the molecule accepts electrons from the surface, becoming less positively charged, as we discuss in detail in the next section. We conclude that Arg-H+ interacts with the metallic surfaces mostly through van der Waals and electrostatic interactions.
III.5 Electronic structure and trends across surfaces
In the previous sections we focused on structural aspects of the adsorbed molecules and the most prominent bonds the molecules make with the metallic surfaces. In the following, we will discuss different aspects of the molecule-surface interactions with the goal of identifying trends across these systems.
The binding energies for all surfaces were calculated as discussed in Section II.3. The larger negative values in Fig. 2(d) correspond to stronger binding of the molecule to the surface. In the case of adsorbed Arg, many conformers bind to Cu more strongly than to Ag and Au. As mentioned previously, Arg forms strong bonds to the surfaces, but the binding of the deprotonated carboxyl group of Arg to the Cu(111) surface is geometrically favored as discussed above. In the case of adsorbed Arg-H+, there is no pronounced difference in binding strengths to the surfaces and the values are comparable to binding energies obtained for Arg adsorbed on Cu(111). This correlates with the observation that the interaction of Arg-H+ to the surfaces happens mostly through dispersion and electrostatic interactions. Despite the strong binding to the surface, it is also visible in Fig. 2(a) that the interaction of Arg-H+ with the surface does not strongly template the conformations of this molecule, implying a low corrugation (i.e. homogeneity) of the molecule-surface interaction and allowing for a larger variety of conformers with similiar energies. This is in contrast to the molecule-surface interation of Arg, that is more inhomogeneous due to the formation of bonds through specific chemical groups. Additionally, we have estimated harmonic vibrational free energies for all conformers with eV in each surface. In contrast to what has been reported for longer helical peptides Rossi et al. (2013); Schubert et al. (2015), the global minimum remains the same in all cases, as reported in Fig. S6 in the SI. For Arg-H+ we observe relative energy rearrangements of up to 50 meV at 300 K, which changes the relative energy hierarchy of conformers less stable than the global minimum.
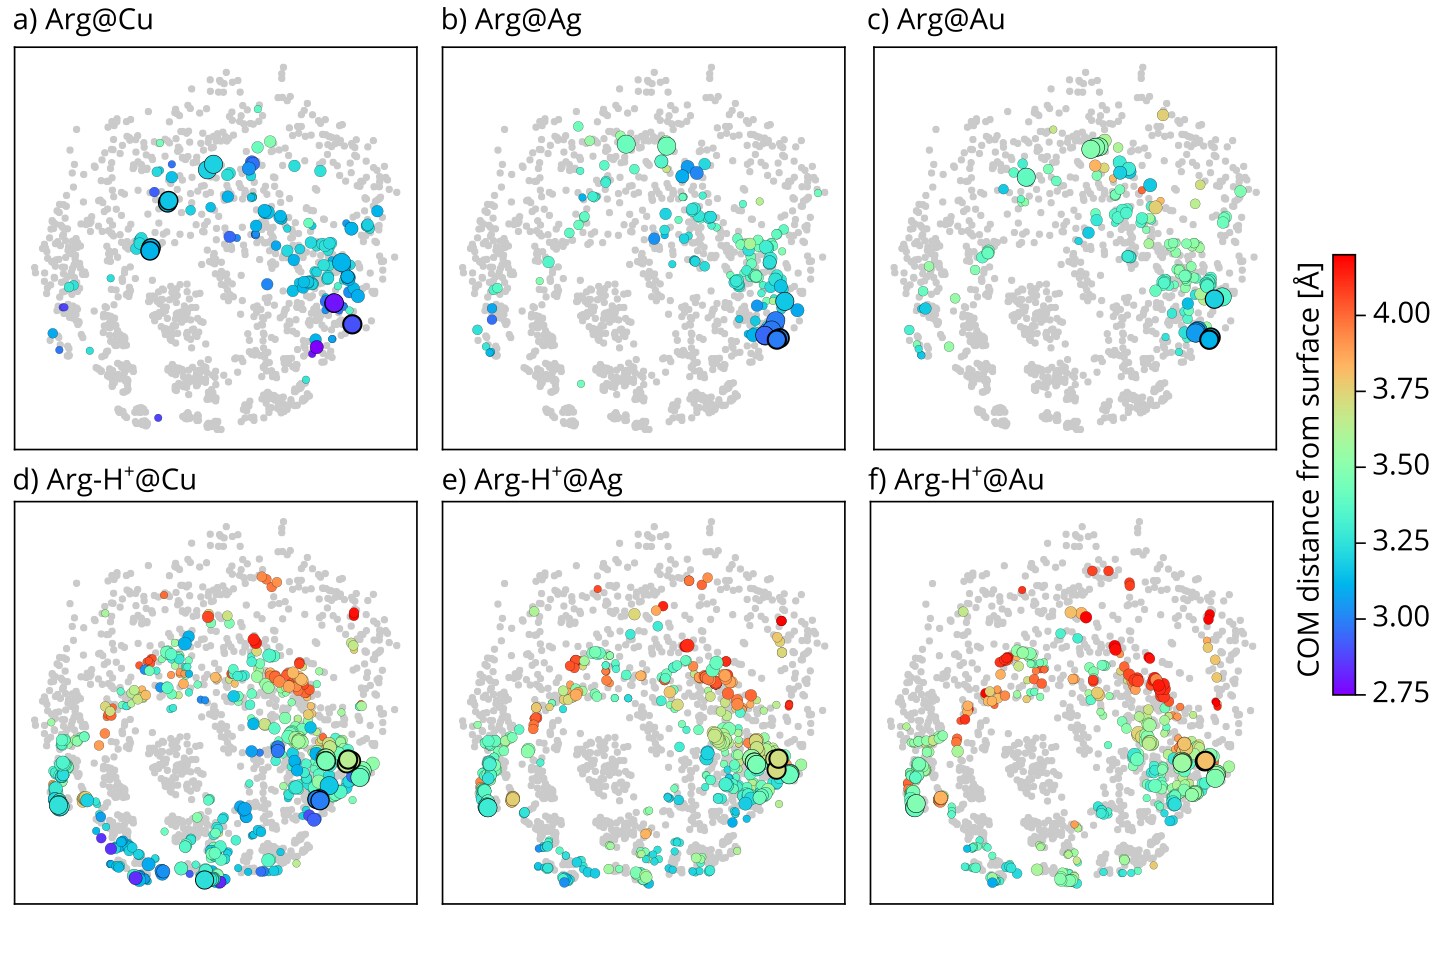
We then focus on the distance between the molecule and the surfaces. We define this quantity by measuring the distance of the center of mass (COM) of the molecule with respect to the surface plane defined by the top layer of surface atoms. These distances are collected in Fig. 8. The COM is closer to Cu(111) than to Ag(111) and Au(111) for both Arg and Arg-H+. In addition, in all surfaces, Arg lies closer than Arg-H+, in agreement with the observation that Arg forms stronger bonds to the surface. The extended structures of Arg-H+, at the bottom of the maps, tend to be closer to the surface than those that have H-bonds within the molecule, likely due to the stronger vdW attraction to the surface by extended conformations.
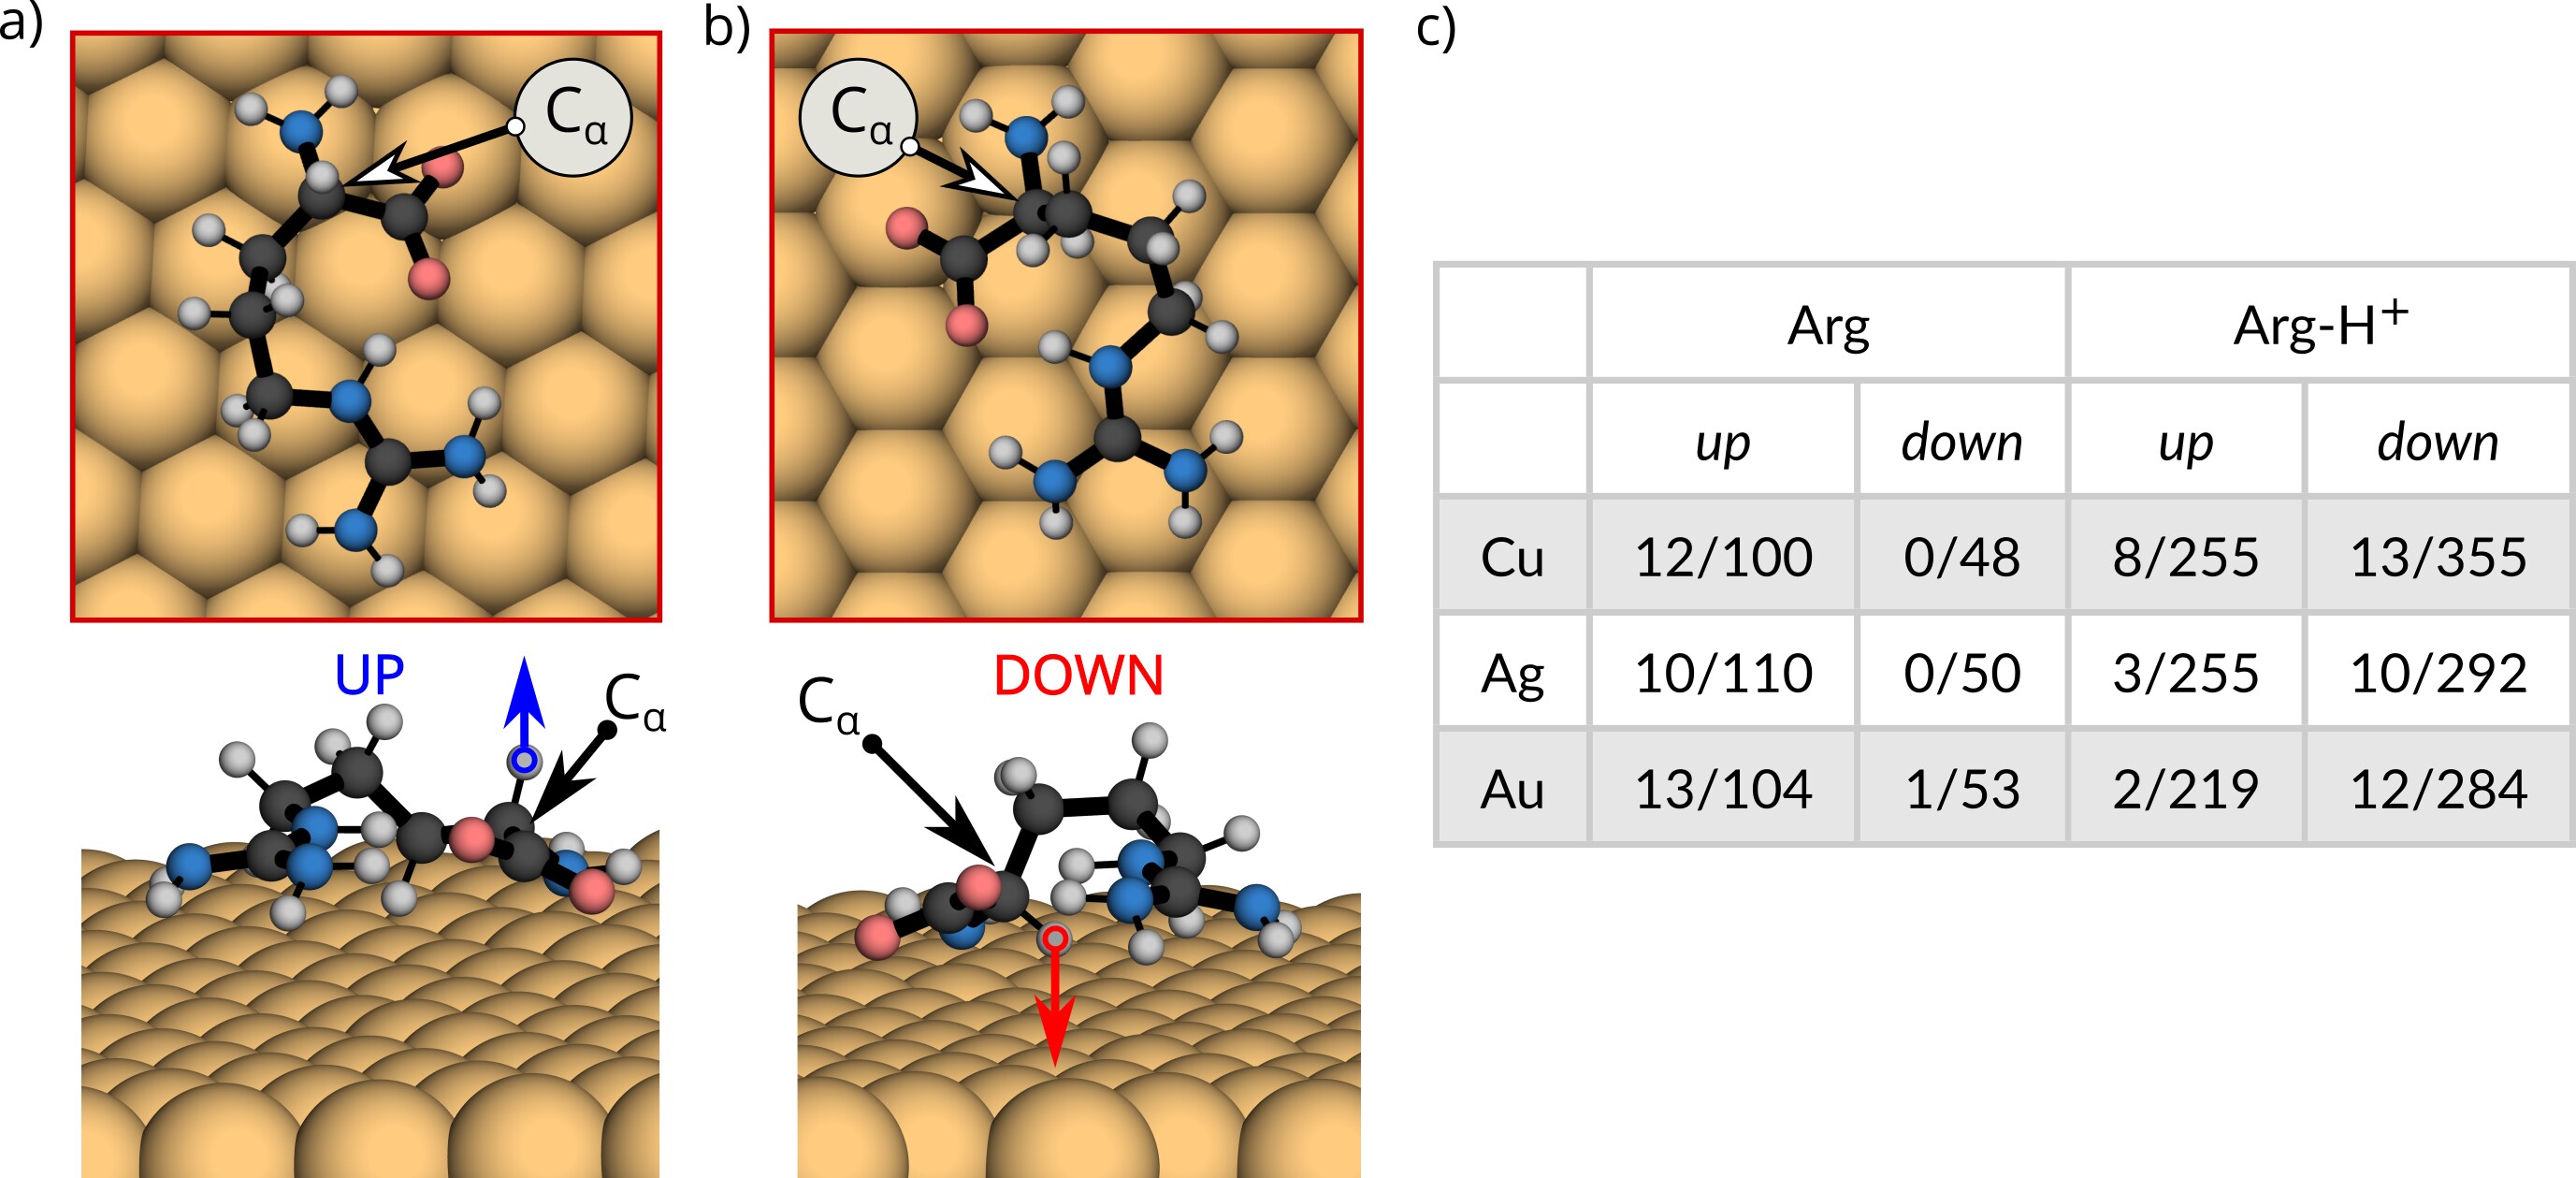
The differences in COM distance to the surfaces between Arg and Arg-H+ are apparently related to the preferred orientation of the chiral center of the molecule to the surface. The chiral Cα carbon can point its bonded hydrogen towards the surface (labeled down in the following), or towards the vacuum region (labeled up in the following). Examples of different molecular orientation are shown in Fig. 9(a). The dominant orientation with respect to the surface is different in the cases of Arg and Arg-H+, as evidenced by the numbers presented in Fig. 9(b). The lower energy structures are mostly in the up orientation for Arg and mostly in the down orientation for Arg-H+ (see also map in Fig. S7). As discussed in the previous sections, despite showing different orientations of their CαH groups, the lowest energy structures for both molecules adsorbed on each surface have very similar conformations. Since the addition or removal of a proton can apparently alter the preference of the chiral-center orientation, we propose that it could template different chiralities of self-assembled super-structures on the surface Lingenfelder (2008).
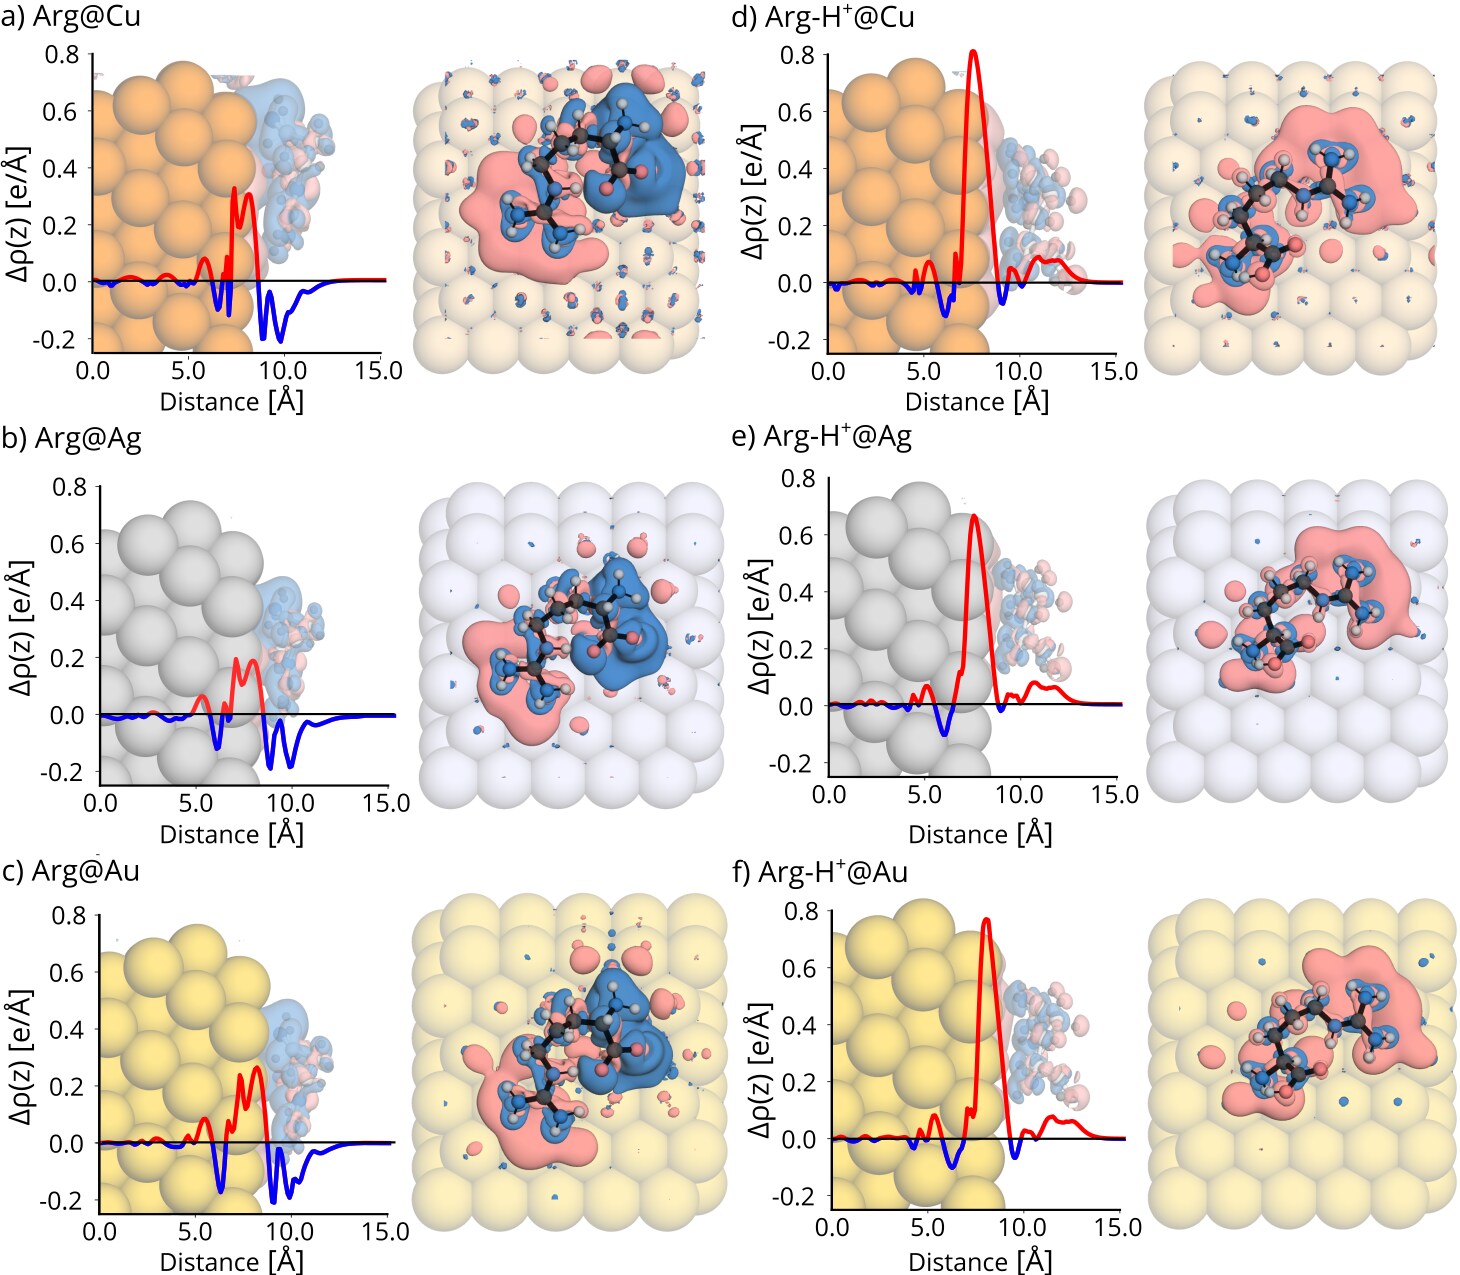
We then investigated the rearrangement of the electronic density upon binding of the molecules to the different surfaces. In Fig. 10 we show the electronic density rearrangement created by the lowest energy conformer at each surface, integrated over the axis parallel to the surface, overlaid on the side-view of the 3D density rearrangement. In addition, we show a top view of the density rearrangement in each case. Examples of further conformers are summarized in the SI, Figs. S8-S13. The data shows that Arg donates electrons to the surface, while Arg-H+ accepts electrons from the surface. We have checked this propensity for selected conformers by integration of the electronic density rearrangement around the molecule and by calculating the Hirshfeld charge remaining on the molecule for the full database (see SI, Table S6). When comparing Hirshfeld charges on the molecule and those obtained from the electronic density rearrangement, we observe that Hirshfeld charges are always 0.3-0.5 e underestimated. In addition, we observe that the depletion and accumulation of charge is not uniform through the lateral extension of the molecule. This behavior is consistent with the level alignment predicted by the PBE Kohn-Sham energy levels, as shown in Fig. S14 in the SI. However, we note that quantitative values of charge transfer are often inaccurate at this level of theory, as characterized in Refs. Egger et al. (2015); Liu et al. (2017). Optimally tuned range-separated hybrid functionals would yield more accurate values, but their computational cost is prohibitive for the use in this whole database. Nevertheless, hybrid-functional calculations of selected conformers (see SI, Fig. S15) confirm the qualitative trend. Therefore, we conclude that the protonation state again critically impacts these systems, in this case by qualitatively changing the redistribution of electronic charge.
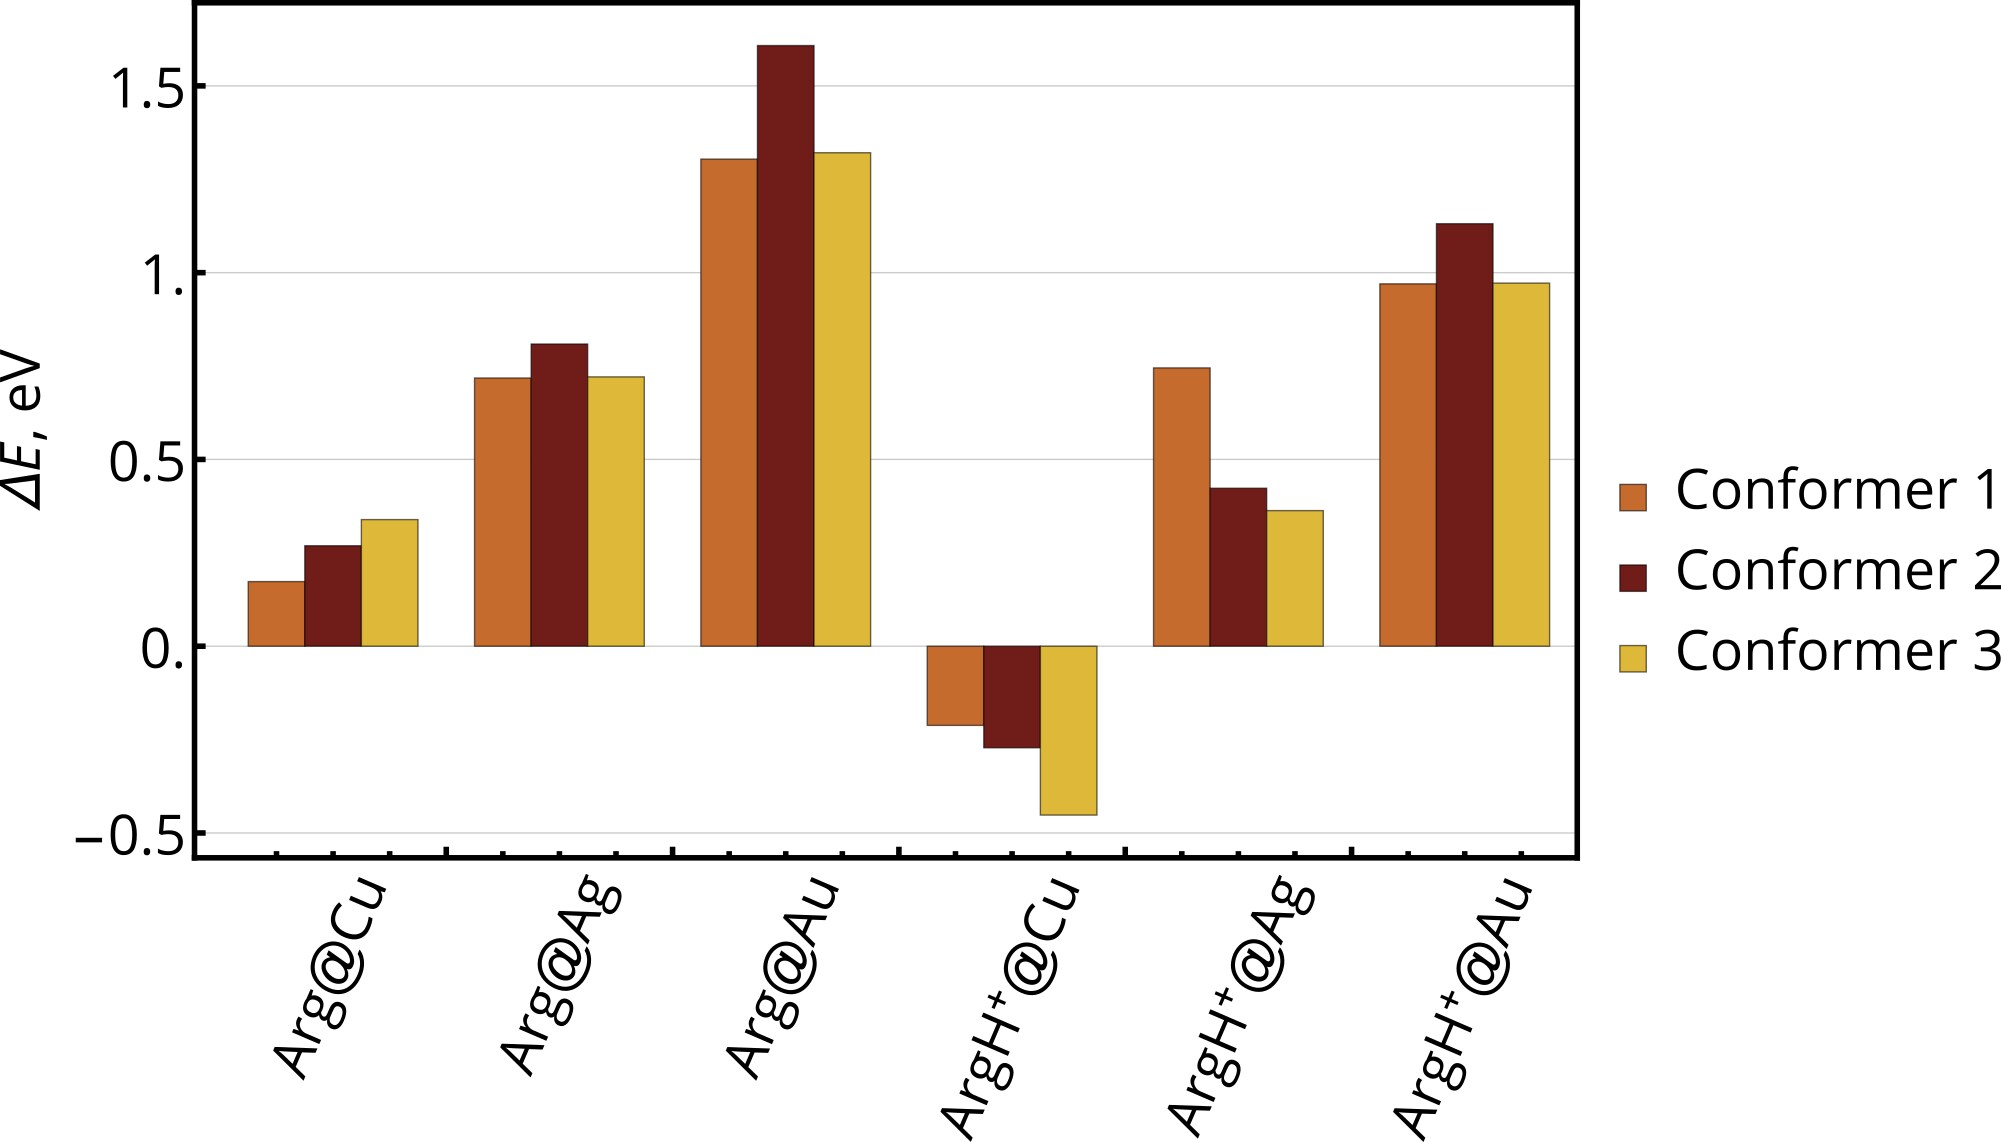
It was observed experimentally that amino acids can undergo deprotonation on reactive surfaces Barlow et al. (1998, 2004); Méthivier et al. (2015); Marti et al. (2002, 2004); Eralp et al. (2010). Here we also investigated whether deprotonation of Arg and Arg-H+ was favorable on any of the surfaces studied here, the details of the procedure can be found in the SI. The results are summarized in Fig. 11. They show that deprotonation of Arg-H+ is favorable in Cu(111), such that Arg-H+ would be predominantely deprotonated. The population of deprotonated Arg on Cu(111) could reach about 0.1% of the molecules at room temperature, from a simple Arrhenius estimation. Given that we have not observed any spontaneous dissociation upon optimization of Arg-H+ on Cu(111), we conclude that, although favorable, this dissociation of H does not occur without a barrier. In all other surfaces, the barrier for dissociation would be rather high for both molecules.
IV Conclusions
In this paper, we have characterized the conformational space of the arginine amino acid in its neutral and protonated form in different non-biological environments, i.e. in isolation and in contact with metallic surfaces. In particular, we have analyzed how and why different parts of the conformational space become accessible or excluded depending on the protonation state and the environment, showing the importance of bond formation and charge rearrangement in these systems.
This study included the construction of a database based on thousands of structures optimized by density-functional theory including dispersion interactions. The construction of this database is a result in itself. We found, for example, that it is advantageous to start from a comprehensive sampling of the conformational space of the least-constrained molecular form, which in our case was the neutral Arg amino acid in the gas-phase. This is evidenced by the fact that in our low-dimensional projections, all low-energy conformers we observe on the surfaces, for both Arg and Arg-H+ lie among structural conformations that were already present in the gas-phase sampling of Arg, albeit often with high relative energies. In addition, we find that within Cu, Ag, and Au surfaces, relative energies between different conformers are largely preserved when changing the substrate.
In recent years much effort has been invested in developing and improving classical force fields (FF) for simulation of organic-inorganic interfaces, including peptides on surfaces Iori et al. (2009); Wright et al. (2013); Heinz et al. (2013). However, as we discuss in the SI, the existing force fields are not accurate for these scenarios where amino acids are in contact with metal surfaces and under vacuum conditions. Nevertheless, these situations are extremely relevant for scanning tunneling microscopy experiments Rauschenbach et al. (2017, 2016); Abb et al. (2016); Koslowski (2017) and other technological applications Wang et al. (2013); Guo et al. (2016). As we illustrate in the SI, even though these force-fields can sample the relevant areas of conformational space, they are not able to capture consistent energy hierarchies. Additionally, the molecular chemical groups show a preference to adsorb on different surface sites, which could have considerable impact on self-assembly studies. Databases such as this one will serve as an important source of data for further parametrization and improvement of these potentials.
Regarding the structural space of Arg and Arg-H+ adsorbed on (111) surfaces of Cu, Ag and Au, we have learned the following: The adsorption of Arg leads to the formation of strong bonds to the surface that involve mostly the carboxyl and amino groups. This stabilizes the protomer that we label P3 in this work, where the carboxyl group is deprotonated and the side chain is protonated. This is different to the dominant protomer in the gas phase P1. The bonds to the surface sterically constrain the conformations of this molecule, thus decreasing the amount of structures with respect to the numbers observed in the gas phase. The molecule also donates electrons to the surface, becoming slightly positively charged. We do not observe fully extended structures lying on the surface and most conformers exhibit intramolecular H-bonds. The majority of conformers of Arg in the low-energy region adsorbs with the CαH chiral center pointing the hydrogen atom away from the surfaces.
Arginine in its protonated form, i.e. Arg-H+ is the most abundant form of this amino-acid in biological environments, where it typically adopts the zwitterionic protomer P7. In the gas-phase, we observe that the non-zwitterionic state P6 is dominant and that the addition of the proton decreases the number of allowed conformations with respect to isolated Arg due to the added electrostatic interactions, and the passivation of the carboxyl group that would otherwise be involved in intramolecular H-bonds. Upon adsorption to the metallic surfaces, we observe that the protomer P6 is still dominant and that there are no strong bonds formed to the surface. In addition, this molecule receives electrons from the surface, thus becoming less positively charged. Both effects conspire to yield a homogeneous (flat) molecule-surface interaction and a relatively high population of different structures in the low-energy range. Contrary to Arg, most low-energy conformers of Arg-H+ adsorb with the Cα-H chiral center pointing the hydrogen atom towards to the surfaces. Finally, through the calculation of dissociation energies, we also conclude that the deprotonation of Arg-H+ is energetically favorable only on Cu(111).
Our observations regarding the preferred protomers and deprotonation propensities discussed above are consistent with the observations in the literature that the adsorption of amino acids in their anionic and deprotonated form is common on reactive metals like Cu(111) Costa et al. (2015). One pronounced difference that we find among surfaces is the average adsorption height of the molecules: They follow the trend Cu(111) Ag(111) Au(111), and Arg is always closer than Arg-H+ to the same respective surface.
The set of electronic-structure calculations presented here show that a flexible amino-acid like Arginine presents a rich conformational space involving different protomeric states and molecule orientations with respect to the surface, allied to a complex charge rearrangement. Going forward, it is clear that the likes of this study based solely on DFT cannot become a routine method due to the elevated computational cost. Addressing the whole breadth of amino acids as well as self assembly of these structures on surfaces will profit from this study as a benchmark and a means to develop models, possibly based on different machine-learning techniques Todorović et al. (2019); Schönborn et al. (2009); Dieterich and Hartke (2010); Supady et al. (2015); Tom et al. (2020); Hörmann et al. (2019); Olsson et al. (2017), that can bypass the cost of thousands of DFT structure optimizations.
Availability of the data
The data presented here is has been uploaded to the NOMAD repository Maksimov et al. .
Acknowledgements
This work was supported by the Max Planck-EPFL Center for Molecular Nanoscience and Technology. We acknowledge Michele Ceriotti for insightful discussions and critical comments to the manuscript. We also acknowledge fruitful discussions with Yair Litman, Stephan Rauschenbach and Sabine Abb. MR also acknowledges support from the Max Planck Research Network on Big-Data-Driven Science (BigMAX).
References
- Wang et al. (2013) Y. Wang, M. Lingenfelder, S. Fabris, G. Fratesi, R. Ferrando, T. Classen, K. Kern, and G. Costantini, The Journal of Physical Chemistry C 117, 3440 (2013).
- Guo et al. (2016) C. Guo, X. Yu, S. Refaely-Abramson, L. Sepunaru, T. Bendikov, I. Pecht, L. Kronik, A. Vilan, M. Sheves, and D. Cahen, Proceedings of the National Academy of Sciences 113, 10785 (2016).
- Khatayevich et al. (2014) D. Khatayevich, T. Page, C. Gresswell, Y. Hayamizu, W. Grady, and M. Sarikaya, Small 10, 1505 (2014).
- Mannoor et al. (2012) M. S. Mannoor, H. Tao, J. D. Clayton, A. Sengupta, D. L. Kaplan, R. R. Naik, N. Verma, F. G. Omenetto, and M. C. McAlpine, Nature Communications 3, 763 (2012).
- Guy et al. (2012) O. J. Guy, G. Burwell, Z. Tehrani, A. Castaing, K. A. Walker, and S. Doak, Materials Science Forum 711, 246 (2012).
- Zhao et al. (2008) X. Zhao, F. Pan, and J. R. Lu, Progress in Natural Science 18, 653 (2008).
- Sarikaya et al. (2003) M. Sarikaya, C. Tamerler, A. K. Jen, K. Schulten, and F. Baneyx, Nature Materials 2, 577 (2003).
- Costa et al. (2015) D. Costa, C.-M. Pradier, F. Tielens, and L. Savio, Surface Science Reports 70, 449 (2015).
- Heinz and Ramezani-Dakhel (2016) H. Heinz and H. Ramezani-Dakhel, Chem. Soc. Rev. 45, 412 (2016).
- Walsh and Knecht (2017) T. R. Walsh and M. R. Knecht, Chemical Reviews 117, 12641 (2017).
- Rauschenbach et al. (2017) S. Rauschenbach, G. Rinke, R. Gutzler, S. Abb, A. Albarghash, D. Le, T. S. Rahman, M. Duy, L. Harnau, and K. Kern, ACS Nano 11, 2420 (2017).
- Rauschenbach et al. (2016) S. Rauschenbach, M. Ternes, L. Harnau, and K. Kern, Annual Review of Analytical Chemistry 9, 473 (2016).
- Abb et al. (2016) S. Abb, L. Harnau, R. Gutzler, S. Rauschenbach, and K. Kern, Nature Communications 7, 10335 (2016).
- Méthivier et al. (2016) C. Méthivier, H. Cruguel, D. Costa, C.-M. Pradier, and V. Humblot, Langmuir 32, 13759 (2016).
- Di Felice et al. (2003) R. Di Felice, A. Selloni, and E. Molinari, The Journal of Physical Chemistry B 107, 1151 (2003).
- Di Felice and Selloni (2004) R. Di Felice and A. Selloni, The Journal of Chemical Physics 120, 4906 (2004).
- Ghiringhelli et al. (2006) L. M. Ghiringhelli, P. Schravendijk, and L. Delle Site, Phys. Rev. B 74, 35437 (2006).
- Arrouvel et al. (2007) C. Arrouvel, B. Diawara, D. Costa, and P. Marcus, The Journal of Physical Chemistry C 111, 18164 (2007).
- Iori et al. (2008) F. Iori, S. Corni, and R. Di Felice, The Journal of Physical Chemistry C 112, 13540 (2008).
- Hong et al. (2009) G. Hong, H. Heinz, R. R. Naik, B. L. Farmer, and R. Pachter, ACS Applied Materials & Interfaces 1, 388 (2009).
- Ropo et al. (2016a) M. Ropo, V. Blum, and C. Baldauf, Scientific Reports 6, 35772 (2016a).
- Rossi et al. (2013) M. Rossi, M. Scheffler, and V. Blum, Journal Of Physical Chemistry B 117, 5574 (2013).
- Rossi et al. (2014) M. Rossi, S. Chutia, M. Scheffler, and V. Blum, Journal Of Physical Chemistry A 118, 7349 (2014).
- Schubert et al. (2015) F. Schubert, M. Rossi, C. Baldauf, K. Pagel, S. Warnke, G. von Helden, F. Filsinger, P. Kupser, G. Meijer, M. Salwiczek, B. Koksch, M. Scheffler, and V. Blum, Physical Chemistry Chemical Physics 17, 7373 (2015).
- Baldauf and Rossi (2015) C. Baldauf and M. Rossi, Journal of Physics: Condensed Matter 27, 493002 (2015).
- Ceriotti et al. (2011) M. Ceriotti, G. A. Tribello, and M. Parrinello, Proceedings of the National Academy of Sciences 108, 13023 (2011).
- Tribello et al. (2012) G. A. Tribello, M. Ceriotti, and M. Parrinello, Proceedings of the National Academy of Sciences of the United States of America 109, 5196 (2012).
- Ceriotti et al. (2013) M. Ceriotti, G. A. Tribello, and M. Parrinello, Journal of Chemical Theory and Computation 9, 1521 (2013).
- De et al. (2016) S. De, A. P. Bartók, G. Csányi, and M. Ceriotti, Phys. Chem. Chem. Phys. 18, 13754 (2016).
- Bartók et al. (2017) A. P. Bartók, S. De, C. Poelking, N. Bernstein, J. R. Kermode, G. Csányi, and M. Ceriotti, Science Advances 3 (2017), 10.1126/sciadv.1701816.
- De et al. (2017) S. De, F. Musil, T. Ingram, C. Baldauf, and M. Ceriotti, Journal of Cheminformatics 9, 6 (2017).
- (32) D. Maksimov, C. Baldauf, and M. Rossi, “Database of arg and arg-h+ adsorbed on cu(111), ag(111) and au(111) in the NOMAD repository.” .
- Blum et al. (2009) V. Blum, R. Gehrke, F. Hanke, P. Havu, V. Havu, X. Ren, K. Reuter, and M. Scheffler, Computer Physics Communications 180, 2175 (2009).
- Havu et al. (2009) V. Havu, V. Blum, P. Havu, and M. Scheffler, Journal of Computational Physics 228, 8367 (2009).
- Hermann and Tkatchenko (2019) J. Hermann and A. Tkatchenko, arXiv e-prints , arXiv:1910.03073 (2019).
- Ruiz et al. (2016) V. G. Ruiz, W. Liu, and A. Tkatchenko, Physical Review B 93, 035118 (2016).
- Ruiz Lopez (2016) V. G. Ruiz Lopez, Adsorption of atoms and molecules on surfaces : density-functional theory with screened van der Waals interactions, Doctoral thesis, Technische Universitaet Berlin, Berlin (2016).
- Liu et al. (2013) W. Liu, V. G. Ruiz, G.-X. Zhang, B. Santra, X. Ren, M. Scheffler, and A. Tkatchenko, New Journal of Physics 15, 53046 (2013).
- Liu et al. (2012) W. Liu, J. Carrasco, B. Santra, A. Michaelides, M. Scheffler, and A. Tkatchenko, Phys. Rev. B 86, 245405 (2012).
- Al-Saidi et al. (2012) W. A. Al-Saidi, H. Feng, and K. A. Fichthorn, Nano Letters 12, 997 (2012).
- van Ruitenbeek (2012) J. van Ruitenbeek, Nature Materials 11, 834 (2012).
- Wagner et al. (2012) C. Wagner, N. Fournier, F. S. Tautz, and R. Temirov, Phys. Rev. Lett. 109, 076102 (2012).
- Carrasco et al. (2014) J. Carrasco, W. Liu, A. Michaelides, and A. Tkatchenko, The Journal of Chemical Physics 140, 84704 (2014).
- Ropo et al. (2016b) M. Ropo, M. Schneider, C. Baldauf, and V. Blum, Scientific Data 3, 160009 (2016b).
- (45) M. Ceriotti, S. De, and F. Musil, “Glosim package,” Code assessed in 2020-01-01.
- Pedregosa et al. (2011) F. Pedregosa, G. Varoquaux, A. Gramfort, V. Michel, B. Thirion, O. Grisel, M. Blondel, P. Prettenhofer, R. Weiss, V. Dubourg, J. Vanderplas, A. Passos, D. Cournapeau, M. Brucher, M. Perrot, and E. Duchesnay, Journal of Machine Learning Research 12, 2825 (2011).
- McQuarrie (2000) D. A. McQuarrie, Statistical Mechanics (University Science Books, 2000).
- Fultz (2010) B. Fultz, Progress in Materials Science 55, 247 (2010).
- Bolger (1995) M. B. Bolger, in Introduction to Biophysical Methods for Protein and Nucleic Acid Research, edited by J. A. Glasel, M. P. Deutscher, and M. P. Deutscher (Academic Press, San Diego, 1995) pp. 433–490.
- Lingenfelder (2008) M. Lingenfelder, Chiral recognition and supramolecular self-assembly of adsorbed amino acids and dipeptides at the submolecular level, Ph.D. thesis, École Polytechnique Fédèrale de Lausanne (2008).
- Egger et al. (2015) D. A. Egger, Z.-F. Liu, J. B. Neaton, and L. Kronik, Nano Letters 15, 2448 (2015).
- Liu et al. (2017) Z.-F. Liu, D. A. Egger, S. Refaely-Abramson, L. Kronik, and J. B. Neaton, The Journal of Chemical Physics 146, 092326 (2017).
- Barlow et al. (1998) S. Barlow, K. Kitching, S. Haq, and N. Richardson, Surface Science 401, 322 (1998).
- Barlow et al. (2004) S. M. Barlow, S. Louafi, D. Le Roux, J. Williams, C. Muryn, S. Haq, and R. Raval, Langmuir 20, 7171 (2004).
- Méthivier et al. (2015) C. Méthivier, V. Humblot, and C.-M. Pradier, Surface Science 632, 88 (2015).
- Marti et al. (2002) E. M. Marti, S. Barlow, S. Haq, and R. Raval, Surface Science 501, 191 (2002).
- Marti et al. (2004) E. M. Marti, A. Quash, C. Methivier, P. Dubot, and C. Pradier, Colloids and Surfaces A: Physicochemical and Engineering Aspects 249, 85 (2004).
- Eralp et al. (2010) T. Eralp, A. Shavorskiy, Z. V. Zheleva, G. Held, N. Kalashnyk, Y. Ning, and T. R. Linderoth, Langmuir 26, 18841 (2010).
- Iori et al. (2009) F. Iori, R. Di Felice, E. Molinari, and S. Corni, Journal of Computational Chemistry 30, 1465 (2009).
- Wright et al. (2013) L. B. Wright, P. M. Rodger, S. Corni, and T. R. Walsh, Journal of Chemical Theory and Computation 9, 1616 (2013).
- Heinz et al. (2013) H. Heinz, T.-J. Lin, R. Kishore Mishra, and F. S. Emami, Langmuir 29, 1754 (2013).
- Koslowski (2017) S. Koslowski, Scanning tunneling microscopy on large bio-molecular systems on surfaces, Ph.D. thesis, École Polytechnique Fédèrale de Lausanne (2017).
- Todorović et al. (2019) M. Todorović, M. U. Gutmann, J. Corander, and P. Rinke, npj Computational Materials 5, 35 (2019).
- Schönborn et al. (2009) S. E. Schönborn, S. Goedecker, S. Roy, and A. R. Oganov, The Journal of Chemical Physics 130, 144108 (2009).
- Dieterich and Hartke (2010) J. M. Dieterich and B. Hartke, Molecular Physics 108, 279 (2010).
- Supady et al. (2015) A. Supady, V. Blum, and C. Baldauf, Journal of Chemical Information and Modeling 55, 2338 (2015).
- Tom et al. (2020) R. Tom, T. Rose, I. Bier, H. O’Brien, Álvaro Vázquez-Mayagoitia, and N. Marom, Computer Physics Communications 250, 107170 (2020).
- Hörmann et al. (2019) L. Hörmann, A. Jeindl, A. T. Egger, M. Scherbela, and O. T. Hofmann, Computer Physics Communications 244, 143 (2019).
- Olsson et al. (2017) S. Olsson, H. Wu, F. Paul, C. Clementi, and F. Noé, Proceedings of the National Academy of Sciences 114, 8265 (2017).