A kinematic view of NGC 1261: structural parameters, internal dispersion, absolute proper motion and Blue Straggler Stars
Abstract
We constructed a Hubble Space Telescope (HST) astro-photometric catalog of the central region of the Galactic globular cluster NGC 1261. This catalog, complemented with Gaia DR2 data sampling the external regions, has been used to estimate the structural parameters of the system (i.e., core, half-mass, tidal radii and concentration) from its resolved star density profile. We computed high-precision proper motions thanks to multi-epoch HST data and derived the cluster velocity dispersion profile in the plane of the sky for the innermost region, finding that the system is isotropic. The combination with line-of-sight information collected from spectroscopy in the external regions provided us with the cluster velocity dispersion profile along the entire radial extension. We also measured the absolute proper motion of NGC 1261 using a few background galaxies as a reference. The radial distribution of the Blue Straggler Star population shows that the cluster is in a low/intermediate phase of dynamical evolution.
1 Introduction
Globular clusters (GCs) are fundamental laboratories to test stellar dynamics. Their internal dynamical evolution is mainly led by two body encounters, during which stars exchange energy and progressively lose memory of their initial conditions (e.g., Binney, & Tremaine 1987; Meylan & Heggie 1997). In general, in GCs the relaxation timescale is shorter than the age of the system, and therefore the effects of dynamics can be directly observed.
In this respect, we are carrying on a long-term project aimed at the accurate characterization of the internal structure, kinematics and stage of dynamical evolution of GCs, by using (1) star density profiles (Lanzoni et al. 2007a, b, c, 2010, 2019; Miocchi et al. 2013) to derive the cluster structural parameters, (2) velocity dispersion profiles from line-of-sight (LOS) velocities and proper motions (PMs) of individual stars (see Lanzoni et al. 2013, 2018a, 2018b; Ferraro et al. 2018b and Bellini et al. 2015; Libralato et al. 2018b, respectively for LOS velocities and PMs), and (3) the properties of Blue Stragglers Stars (BSSs), a particular class of exotic objects that have been found to be powerful tracers of the internal dynamical evolution of stellar systems (see Ferraro et al. 2009, 2012, 2018a, 2019; Lanzoni et al. 2016; Dalessandro et al. 2013; Beccari et al. 2019).
In particular: (1) we are using number counts, instead of surface brightness distributions, to determine the cluster gravitational centers and the structural and kinematical parameters. This approach allows us to avoid the so-called “shot-noise bias” that is known to affect the surface brightness distribution in case of resolved stellar populations. In fact the presence of a few luminous stars can significantly alter the correct localization of the center of gravity and the shape of the star density profile (e.g., Calzetti et al. 1993; Lugger et al. 1995; Montegriffo et al. 1995).
(2) We are using a combination of LOS velocities and PMs of individual stars to derive the velocity dispersion profile of star clusters (Lanzoni et al. 2013, 2018a, 2018b; Ferraro et al. 2018b; Bellini et al. 2015, 2018; Libralato et al. 2018b). This approach has been found to bring much more solid pieces of information in the case of resolved stellar populations than present-day integrated-light spectroscopy, (i.e., measuring the line broadening and Doppler shift from integrated light spectra), which is again prone to a severe “shot noise bias”, since the spectra can be dominated by the light of just a few bright stars (e.g., Dubath et al. 1997).
(3) In order to complete the physical characterization of high density stellar systems, we are using the observational properties of BSSs, which are powerful tracers of GC internal dynamics (Ferraro et al. 2012, 2018a). BSSs are a peculiar stellar population, placed in the color-magnitude diagram (CMD) along an extension of the main sequence (MS), at brighter and bluer magnitudes with respect to the turn-off (TO; see Ferraro et al. 1992, 1993, 1997, 2004, 2018a; Piotto et al. 2004; Lanzoni et al. 2007a, b; Dalessandro et al. 2008; Moretti et al. 2008; Beccari et al. 2011, 2012; Leigh et al. 2011; Simunovic & Puzia 2016). Their position in the CMD and direct measurements suggest that they are more massive than the TO mass (Shara et al. 1997; Gilliland et al. 1998; De Marco et al. 2005; Ferraro et al. 2006; Fiorentino et al. 2014; Baldwin et al. 2016; Libralato et al. 2018b, 2019; Raso et al. 2019), and for this reason they are subject to dynamical friction, which progressively makes them sink towards the cluster center (e.g., Mapelli et al. 2004, 2006). Therefore, the BSS radial distribution is expected to be modified as a function of the cluster dynamical age, and, based on this, Ferraro et al. (2012) first defined the concept of the so-called “dynamical clock”. More recently, Alessandrini et al. (2016); Lanzoni et al. (2016); Ferraro et al. (2018a, 2019) refined this tool and applied it to rank stellar systems in the Galaxy and in the Large Magellanic Cloud as a function of their dynamical age (see also Raso et al. 2017; Ferraro et al. 2019; Li et al. 2019; Singh & Yadav 2019; Sollima & Ferraro 2019).
The present paper is devoted to compute the structural, kinematical and dynamical properties of the Galactic GC NGC 1261. This is an intermediate-metallicity GC, with very low extinction ([Fe/H]=1.27 and E()=0.01, Harris 1996, 2010 edition). It is a halo GC, with a distance modulus (Ferraro et al. 1999), corresponding to a distance from the Sun of 15.7 kpc. It is located farther from the Sun with respect to GCs studied in most of the previous works dealing with internal kinematics from HST PMs, which all have distances in the range 510 kpc (Bellini et al. 2014, 2015, 2018; Libralato et al. 2018b, 2019). However, its extremely low extinction and its expected low contamination from field stars (due to its low Galactic latitude, B=, and its relatively large distance from the Galactic center, D=18.1 kpc, Harris 1996), make it a suitable candidate for PM studies and to test the validity of PM measurements in a less favourable (more distant) case. Simunovic et al. (2014) proposed the presence of an interesting BSS population, with two separate sequences in the CMD. In addition, NGC 1261 is suspected to have an extra-tidal structure, in the form of an outer envelope (Kuzma et al. 2018; Shipp et al. 2018), and to be associated to the Gaia-Enceladus structure (Massari et al. 2019).
The paper is organized as follows: in Section 2 we describe the dataset and the data reduction procedure; in Section 3 we derive the structural parameters of the cluster from resolved stellar counts; in Section 4 we construct and study the velocity dispersion profiles from PMs; in Section 5 we study the BSS population; in Section 6 we discuss our results and summarize our conclusions.
2 Dataset and Data Reduction
In this work we considered all the images from the Ultraviolet and Visible (UVIS) channel of the Wide Field Camera 3 (WFC3) and from the Wide Field Channel (WFC) of the Advanced Camera for Surveys (ACS) currently available in the HST archive, covering the central regions of the cluster. The details of the observations are listed in Table 1.
| Program ID | PI | Epoch | Camera | Filter | Exposures |
| (yyyy/mm) | N | ||||
| GO-10775 | A. Sarajedini | 2006/03 | ACS/WFC | F606W | |
| F814W | |||||
| GO-13297 | G. Piotto | 2013/08 - 2014/06 | WFC3/UVIS | F275W | |
| F336W | |||||
| F438W | |||||
| GO-14235 | T. Sohn | 2017/03 | ACS/WFC | F606W | |
We performed a photometric reduction of the _flc images, following the prescriptions given in Bellini et al. (2017a, 2018). We used _flc images because the un-resampled pixel data for stellar profile fitting is preserved. These images have also been corrected to remove charge-transfer efficiency (CTE) defects, as described in Anderson & Bedin (2010). In the following, we briefly describe the reduction procedure, which consists of two main steps.
First, we performed a one-pass photometry, a single finding procedure without neighbour subtraction, to identify and measure all bright stars. We made use of spatially-variable point-spread-function (PSF) models tailored to each image starting from the publicly available library PSFs of the HST detectors111Available at http://www.stsci.edu/~jayander/STDPSFs/ (e.g., Anderson & King 2006) by using a set of bright, relatively isolated and unsaturated stars in each exposure. These PSFs were used to measure stellar positions and fluxes in each exposure. Stellar positions were corrected for geometric distortion using the solutions provided in Anderson & King (2006); Bellini & Bedin (2009); Bellini et al. (2011).
Next, we run a multi-pass photometry using the software KS2 (see Bellini et al. 2017a for details), which simultaneously performs the finding procedures on all the images and it is able to perform neighbor subtraction. This second step is necessary due to the high level of crowding in the central regions of GCs. KS2 is able to simultaneously analyze multiple images taken with different filters, combining the results of the one-pass photometry transformed into a common reference frame. As an astrometric reference system, we used the stellar positions in the Gaia Data Release 2 (DR2) catalog (Gaia Collaboration et al. 2016, 2018). We defined a common, pixel-based reference system, based on these Right Ascension (R.A.) and Declination (Dec.) positions, with X and Y increasing toward West and North, respectively, and with a pixel scale of 40 mas pixel-1. We transformed the stellar positions as measured in each exposure onto this common reference frame system by means of six-parameter linear transformations. KS2 performs the finding procedure through multiple iterations. For each iteration, it finds and subtracts stars that are present in a combination of filters chosen by the user, and then iteratively repeats this procedure for fainter stars that were not subtracted in the previous iteration, together with an improved fit and subtraction of already found stars. In this work, we applied an approach similar to that used in Nardiello et al. (2018): we performed the first four finding iterations on the F606W and F814W exposures, while the fifth, sixth and seventh iterations were performed on the F438W, F336W and F275W images, respectively, to enhance the detection of blue stars that are too faint to be detected in the F606W and F814W exposures. The instrumental magnitudes of each exposure were rescaled to that of the longest available exposure acquired with the same filter.
We calibrated our magnitudes to the VEGAMAG photometric system using the stars in common with the public catalog of NGC 1261 from the HST UV Globular cluster Survey222Available at http://groups.dfa.unipd.it/ESPG/treasury.php. (Piotto et al. 2015; Nardiello et al. 2018).
We measured PMs using the technique developed by Bellini et al. (2014) and improved in Bellini et al. (2018) and Libralato et al. (2018b). We refer to those papers for a complete description of this procedure, which we briefly summarize in the following. This iterative procedure uses the stellar positions in each single exposure obtained from the multi-pass photometry. We transformed the KS2-based positions of each star in each image onto a common reference frame system. We fit these transformed positions as a function of the epoch with a least-square straight line. The slope of the straight line is a direct estimate of the PMs. The transformations to obtain master-frame positions are based on cluster member stars, therefore the PMs thus obtained are relative to the cluster bulk motion. For this procedure we used all the catalogs available in our dataset (see Table 1), except for those in the F275W filter, which suffer from color-dependent systematic effects (Bellini et al. 2011), and therefore are not suitable to measure PMs.
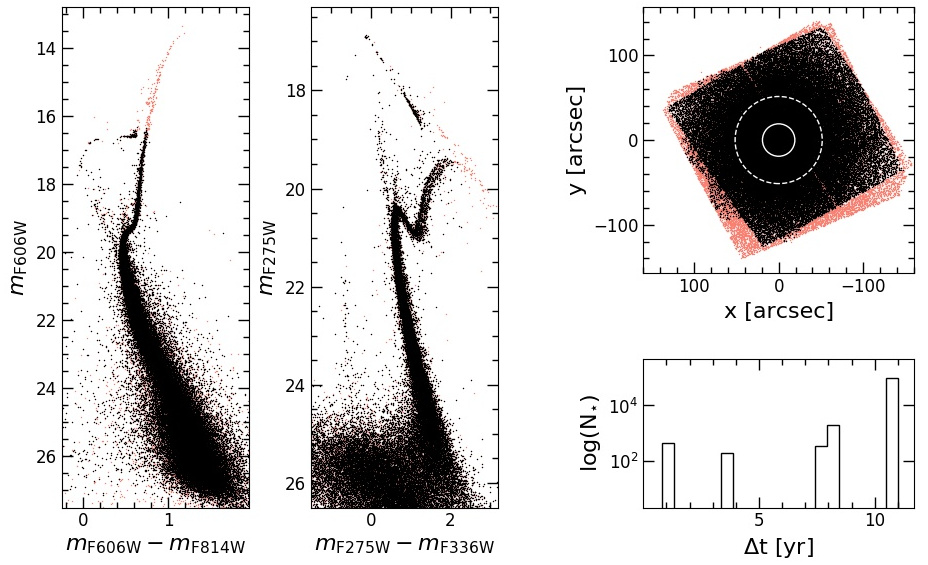
In Figure 1, we show an overview of the NGC 1261 catalog obtained in this work. Black/red dots correspond to stars with/without a PM measurement. In the left and central panels we show the optical and UV-blue CMDs of NGC 1261. In the upper right panel we show the field of view (FOV) covered by our dataset, showing also the core and the half-mass radii ( and ), obtained in Sect. 3, as white circles. In the lower right panel we show the number of objects (in a log scale) in our PM catalog, as a function of the temporal baseline of the observations used to determine their PMs.
3 Structural parameters
In order to derive the structural parameters of NGC 1261, we determined the center of gravity () and the star density profile.
For the determination of , we followed the iterative procedure described in Montegriffo et al. (1995), and later used in Lanzoni et al. (2010, 2019); Miocchi et al. (2013); Raso et al. (2017). We measured as the average of the projected x and y positions of stars brighter than a given magnitude and within a given distance from the (first-guess) center. We chose an appropriate limiting magnitude around the TO level, to avoid incompleteness effects while maintaining a sufficient statistics. We assumed as a first-guess center the value of Goldsbury et al. (2010), and iteratively recomputed the center, using each time the center obtained in the previous iteration, until the difference between two consecutive iterations was negligible. The resulting is located at R.A., with uncertainties equal to: rms and rms. The distance between the Goldsbury et al. (2010) center and the value of estimated in this work is equal to .
The available HST data sample a region of roughly centered on the cluster center. This region is smaller than the tidal radius of NGC 1261 derived from the Harris catalog (, Harris 1996). Therefore, in order to obtain a complete star density profile along the entire extension of the cluster, we combined the HST data with Gaia DR2 data. We constructed the star density profile as in Miocchi et al. (2013, see also ). We divided the sample into 23 concentric annuli33312 annuli for the HST data, 13 for the Gaia DR2 data, with 2 annuli in common between the two datasets. We used this region (70r), where the Gaia DR2 data do not suffer yet from incompleteness at the considered magnitude level, to normalize the Gaia DR2 and HST profiles., centered on , considering only stars brighter than (equivalent to for Gaia), to avoid incompleteness effects and to properly combine the density profile obtained from HST data with that determined from the Gaia observations. Each annulus was divided into four sectors, and the density in each sector was measured as the ratio between the number of stars within the sector and the area of the sector itself. The final density for each annulus corresponds to the mean of the four sector densities, and the density uncertainty is estimated from the variance among the sectors. The final, combined density profile is shown in the upper panels of Figure 2. The open circles represent the observed density profile, while the black circles represent the profile after background subtraction (measured as the average of the five rightmost points of the observed profile).
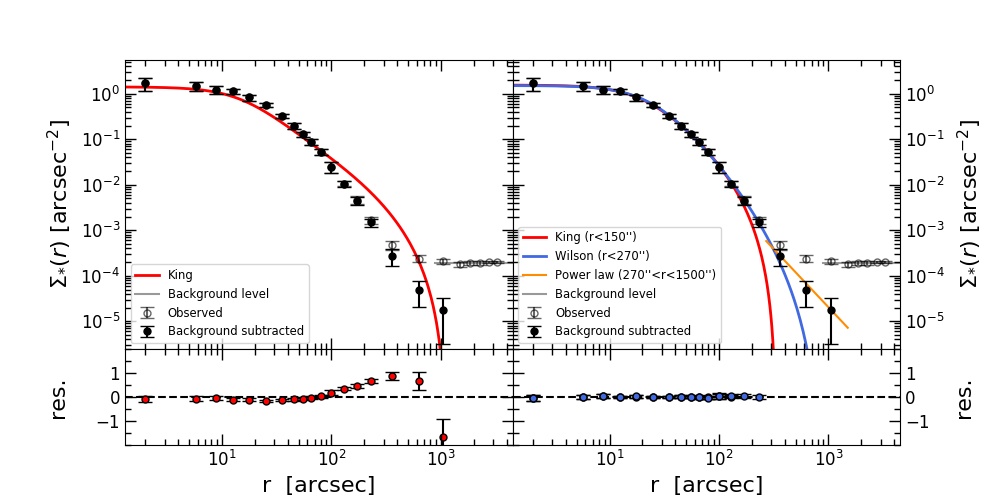
The density profile presented in Figure 2 has been obtained using only stars brighter than the TO, i.e., stars with approximately the same mass. For this reason, the cluster structural parameters have been derived by fitting the density profile with single-mass, spherical and isotropic King models (King 1966). We performed the fit using a Markov Chain Monte Carlo (MCMC) approach, using the emcee algorithm (Foreman-Mackey et al. 2013). We assumed uniform priors on the parameters of the fit, therefore the posterior probability distribution functions (PDFs) are proportional to the likelihood .
The result of this fit is shown in the left panel of Figure 2. While the agreement is satisfactory for , the outer regions display significant deviations from the model. The disagreement between observations and best-fit model seems to be less severe in Figure E1 of Baumgardt & Hilker (2018). However, this is because their density profile extends to just from the center, while the deviation from the King model distribution increases at large radii. This is consistent with the findings by Kuzma et al. (2018), who detected the possible presence of an extended halo in the outer regions of this cluster.
| Parameter | King model | Wilson model |
|---|---|---|
| ()′′ | ()′′ | |
| ()′′ | ()′′ | |
| ()′′ | ()′′ |
In order to further explore this topic, we limited the fit of the King models to the innermost region () and considered also Wilson models (Wilson 1975; see the right panels of Figure 2), which are more radially extended with respect to the King ones. As expected, Wilson models are able to reproduce the observed profile over a more extended radial portion (out to ) with respect to the King family. However, an excess of stars is still observed at , suggesting the existence of an extended halo, in agreement with what found by Kuzma et al. (2018). We highlight this feature with a power law with a slope of (yellow line in the right panel of Figure 2). The power law we adopt is less steep than the one found by Kuzma et al. (2018), however we do not intend here to analyze the characteristics of the outer envelope, but just to qualitatively highlight the presence of the envelope in the Figure. We refer to the aforementioned paper for an extensive analysis of the outer envelope of NGC 1261.
In Table 2 we list the best fit structural parameters (corresponding to the median of the PDF) and the uncertainties (68% confidence interval) for the King and Wilson models. It is interesting to note that both the core radius and the half-mass radius agree between the two models at better than one arcsecond. Our results are comparable, within the uncertainties, to the values obtained in Kuzma et al. (2018). The only exception is the core radius, for which we obtain slightly smaller values for both the King and Wilson models. However, this is not concerning, since the difference is very small (), and in general the agreement is good.
4 Internal kinematics
4.1 Proper motion selections
We selected stars for the kinematic analysis according to the following criteria: (i) at a given magnitude, they have a QFIT parameter (quality of the PSF fit, ranging from 0 to 1; larger values of QFIT indicates better quality of the PSF fit) larger than the 95-th percentile; (ii) their parameter (fraction of neighbour flux within the fitting radius before neighbour subtraction in the multi-pass photometry) is lower than 1; (iii) they were measured in at least 80% of the images; (iv) at any given magnitude, the absolute value of their RADXS parameter (residual fractional source flux outside the fitting radius with respect to PSF predictions) is within from its median value; (v) their reduced , obtained from the PM fit, is lower than 3; (vi) the fraction of measurements rejected in the PM fit procedure is less than 15%; (vii) they are within 90′′ from the cluster center (i.e. we excluded the edges of the FOV of the PM catalog, which is slightly smaller than the total FOV - see Figure 1); (viii) their PM error is smaller than 50% the local (both in distance and in magnitude) intrinsic PM dispersion.
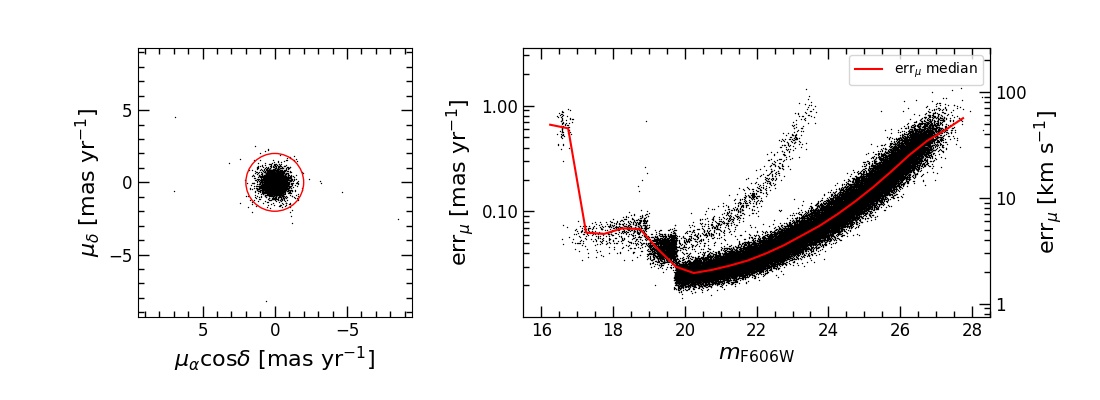
The vector-point diagram (VPD, see the left panel of Figure 3) shows no prominent sign of field contamination, as expected from the Galactic latitude of this halo cluster (B=, Harris 1996). However, we applied a mild cut to exclude likely field stars, rejecting stars with a relative PM larger than 2 mas yr-1 (i.e., more than 10 times the observed PM dispersion of the faintest stars detected; see the red circle in the left panel of Figure 3).
In the right panel of Figure 3 we show the 1D PM error as a function of for the stars satisfying criteria (i) to (vii). The red line corresponds to the median of the distribution, measured in bins 0.5 mag wide. The different temporal baselines and number of images used to compute the PMs in our project cause the multiple sequences of PM errors clearly visible in the right panel of Figure 3.
The observed velocity dispersion obtained from PMs is the combination of the true velocity dispersion of the cluster and the scatter due to PM errors, which must be subtracted in quadrature in order to obtain the true dispersion. Thanks to state-of-the-art reduction techniques, as the ones used in this work and in Bellini et al. (2014, 2015, 2018); Libralato et al. (2018b, 2019), we are able to keep the PM errors as low as possible. However, for such a distant GC, stellar PMs are small compared to the PM uncertainty and in some cases we were unable to derive meaningful velocity dispersions, even after the subtraction of the PM uncertainty. Hence, for the kinematic analysis presented in Section 4.2, we restricted our sample to the magnitude range . This condition has the double benefit of allowing us to study the kinematics of stars of comparable masses, while using the stars with PM errors as low as possible.
4.2 Velocity dispersion profiles
In this section we present and discuss the velocity dispersion profiles of NGC 1261 over its entire radial extension, derived by combining the kinematical information in the plane of the sky, obtained from PMs, for the cluster central regions with LOS velocities of individual stars, measured in the external regions from the MIKiS survey (Ferraro et al. 2018b).
The radial and tangential velocity dispersion profiles in the plane of the sky, obtained from our PMs, were measured maximizing the following likelihood in different radial bins:
| (1) |
where and are the radial and tangential components of the velocity of each star in the considered bin, and are the observed errors on the radial and tangential velocity components, and and are the radial and tangential velocity dispersions, respectively. We used again a MCMC approach, based on the emcee algorithm (Foreman-Mackey et al. 2013), obtaining the posterior probability distribution functions (PDFs) for and . The best-fit values correspond to the PDF median, while the resulting uncertainties correspond to the 68% confidence interval.
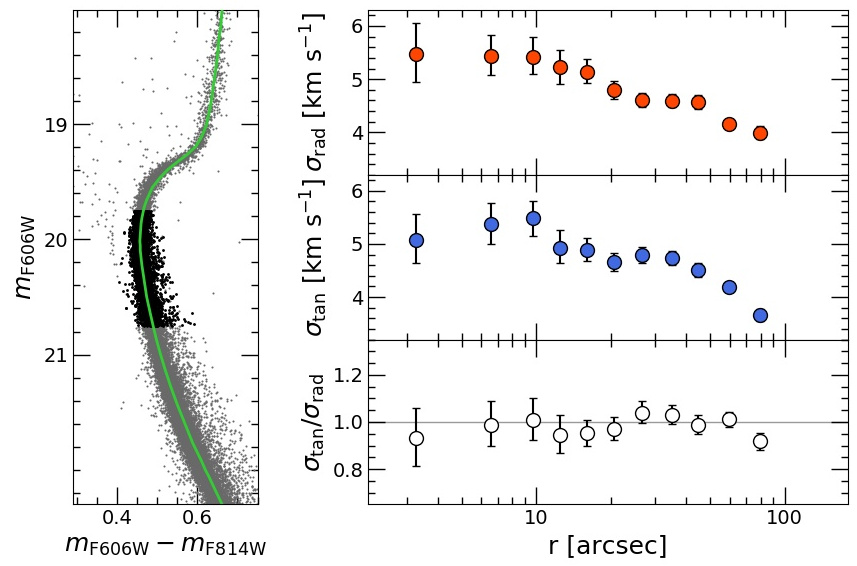
In order to allow a comparison between the velocity dispersion profiles presented here with previously published profiles, mainly obtained from radial velocities from spectroscopy (therefore measured for a sample of bright stars, with a mass comparable to the TO mass), we must only consider the kinematics of stars of similar mass, because of the effects of energy equipartition. The restriction of our sample to the stars in the range between 19.75 and 20.75, discussed in the previous section and made to select only stars with the lowest PM errors, serves also this purpose. We excluded stars brighter than =19.75 because, as it can be seen in the right panel of Figure 3, at brighter magnitudes the PM errors increase significantly, due to the smaller number of images available for the PM computation (the longest exposures are saturated above this magnitude value). We chose =20.75 as our faint limit to include in our sample only stars with masses comparable to the TO mass. The masses in this magnitude interval, estimated from a PARSEC isochrone (Marigo et al. 2017) with an age of 11.5 Gyr and [Fe/H]=1.35 (green line in the left panel of Figure 4; age and metallicity are taken from Dotter et al. 2010), range from 0.75 M⊙ to 0.8 M⊙, while bright stars (e.g., Red Giant Branch stars) in NGC 1261, according to the same isochrone, have masses up to 0.82 M⊙. Therefore, even if velocity dispersion decreases when mass increases due to energy equipartition (), in such a small mass range the velocity dispersion difference is expected to be negligible. Even in the extreme case of full energy equipartition (=0.5), which is not expected to be reached (e.g., Trenti & van der Marel 2013; Bianchini et al. 2016), the difference in velocity dispersion for the considered mass range is at most a few tenths of km s-1. We also used a mild color cut () to exclude the most obvious outliers. This mild color cut does not exclude binaries, which have a different kinematics with respect to single stars. However, the binary fraction of NGC 1261 is lower than 5% (Milone et al. 2012), therefore their contribution should be negligible.
Figure 4 summarizes our results on the kinematics of MS-TO stars in NGC 1261. In the left panel we show as grey points the CMD of stars in NGC 1261 that have a PM measurement and pass our quality selections (see Section 4.1). The MS-TO stars selected for the kinematical analysis (5410 stars) are shown as black points. In the right panels of Figure 4 we show the velocity dispersion profiles444PMs in mas yr-1 have been converted into km s-1, through the equation (e.g., van de Ven et al. 2006). obtained in this work. From top to bottom, we show the radial velocity dispersion profile (, red circles), the tangential velocity dispersion profile (, blue circles), and the anisotropy profile (, white circles).
The central region of NGC 1261 appears to be isotropic (); the only point in the anisotropy profile that deviates significantly from isotropy is the most external one, at a distance from the center of about 80′′, where the cluster appears to be mildly radially anisotropic. Although this trend is consistent with both simulations and observations, which find that some GCs are isotropic in the central regions and radially anisotropic at larger radii (see e.g., Vesperini et al. 2014; Tiongco et al. 2016 for simulations and Bellini et al. 2014, 2017b; Watkins et al. 2015 for observational results), this concerns only one point at the edge of the FOV sampled by our observations, corresponding to from the center. Hence, from now on we make the conservative assumption of an overall isotropy for NGC 1261.
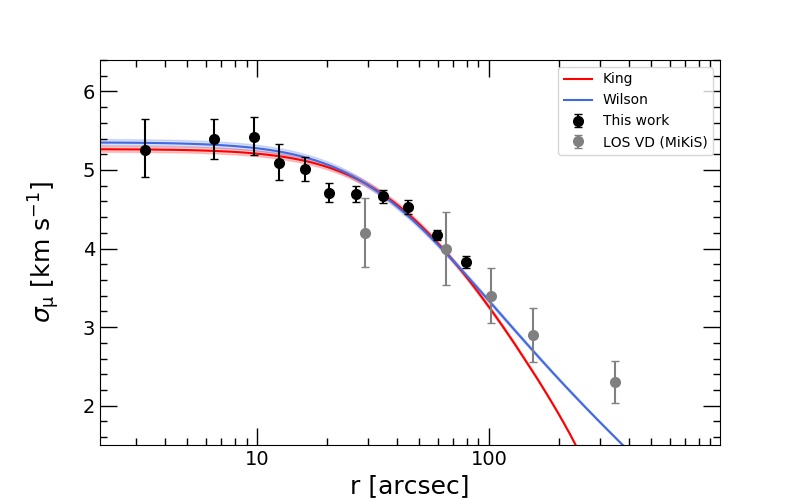
Given the overall isotropy of the sampled region, we determined the global velocity dispersion profile in the plane of the sky (), shown in Figure 5 (black circles). This has been obtained with the same procedure described above, but imposing in the likelihood. We combined the global velocity dispersion profile in the plane of the sky with the LOS velocity dispersion profile from Ferraro et al. (2018b). As previously discussed, the two velocity dispersion profiles can be compared because they are obtained from stars that are roughly in the same mass range. As shown in the Figure, the two profiles nicely connect in the radial region in common, with no need for arbitrary vertical shifts.
We then fitted the combined (PMs+LOS) velocity profile with King and Wilson models. We used a MCMC fitting procedure equivalent to the one described previously. We kept the structural parameters obtained in Sect. 3 fixed and we adopted only the central velocity dispersion, , as a free parameter555We want to point out that the fit can be performed also without fixing the structural parameters to the values obtained from the density profile fit. However, the determination of the structural parameters from the velocity dispersion profile is more uncertain than using the density profile, due to the smaller number of points and higher probability of systematics.. For consistency with the density profile fitting procedure (see Section 3), we excluded the regions beyond and for the King and Wilson models, respectively. The observed velocity dispersion profile is reasonably well reproduced by the adopted models (red and blue lines in Figure 5), with central dispersion values of km s-1 and km s-1, respectively. These values are comparable to previous estimates based only on radial velocities (thus limited to more external regions of the cluster), e.g., Baumgardt & Hilker (2018) obtain =5.6 km s-1; Ferraro et al. (2018b) obtain =5.50.4 km s-1.
The central velocity dispersion measurements can be used to estimate the total mass of NGC 1261, by properly rescaling and integrating the best fit King and Wilson density profiles. We obtained from the King model and from the Wilson model. Although these values formally underestimate the total mass of the system (since they have been derived from the King/Wilson models), the contribution of the stars populating the halo surrounding the cluster is likely negligible. Indeed, the two estimates are very similar (in spite of a larger extension of the Wilson model, with respect to the King one), and also consistent with the value quoted in Ferraro et al. (2018b, ).
4.3 Absolute proper motion
As already mentioned, the PMs presented here are relative to the bulk motion of the cluster. Its absolute motion is consequently transferred, with the opposite sign, to background objects that, in reality, are essentially not moving with respect to it (e.g., distant galaxies; see, e.g., Massari et al. 2013; Cadelano et al. 2017; Libralato et al. 2018a).
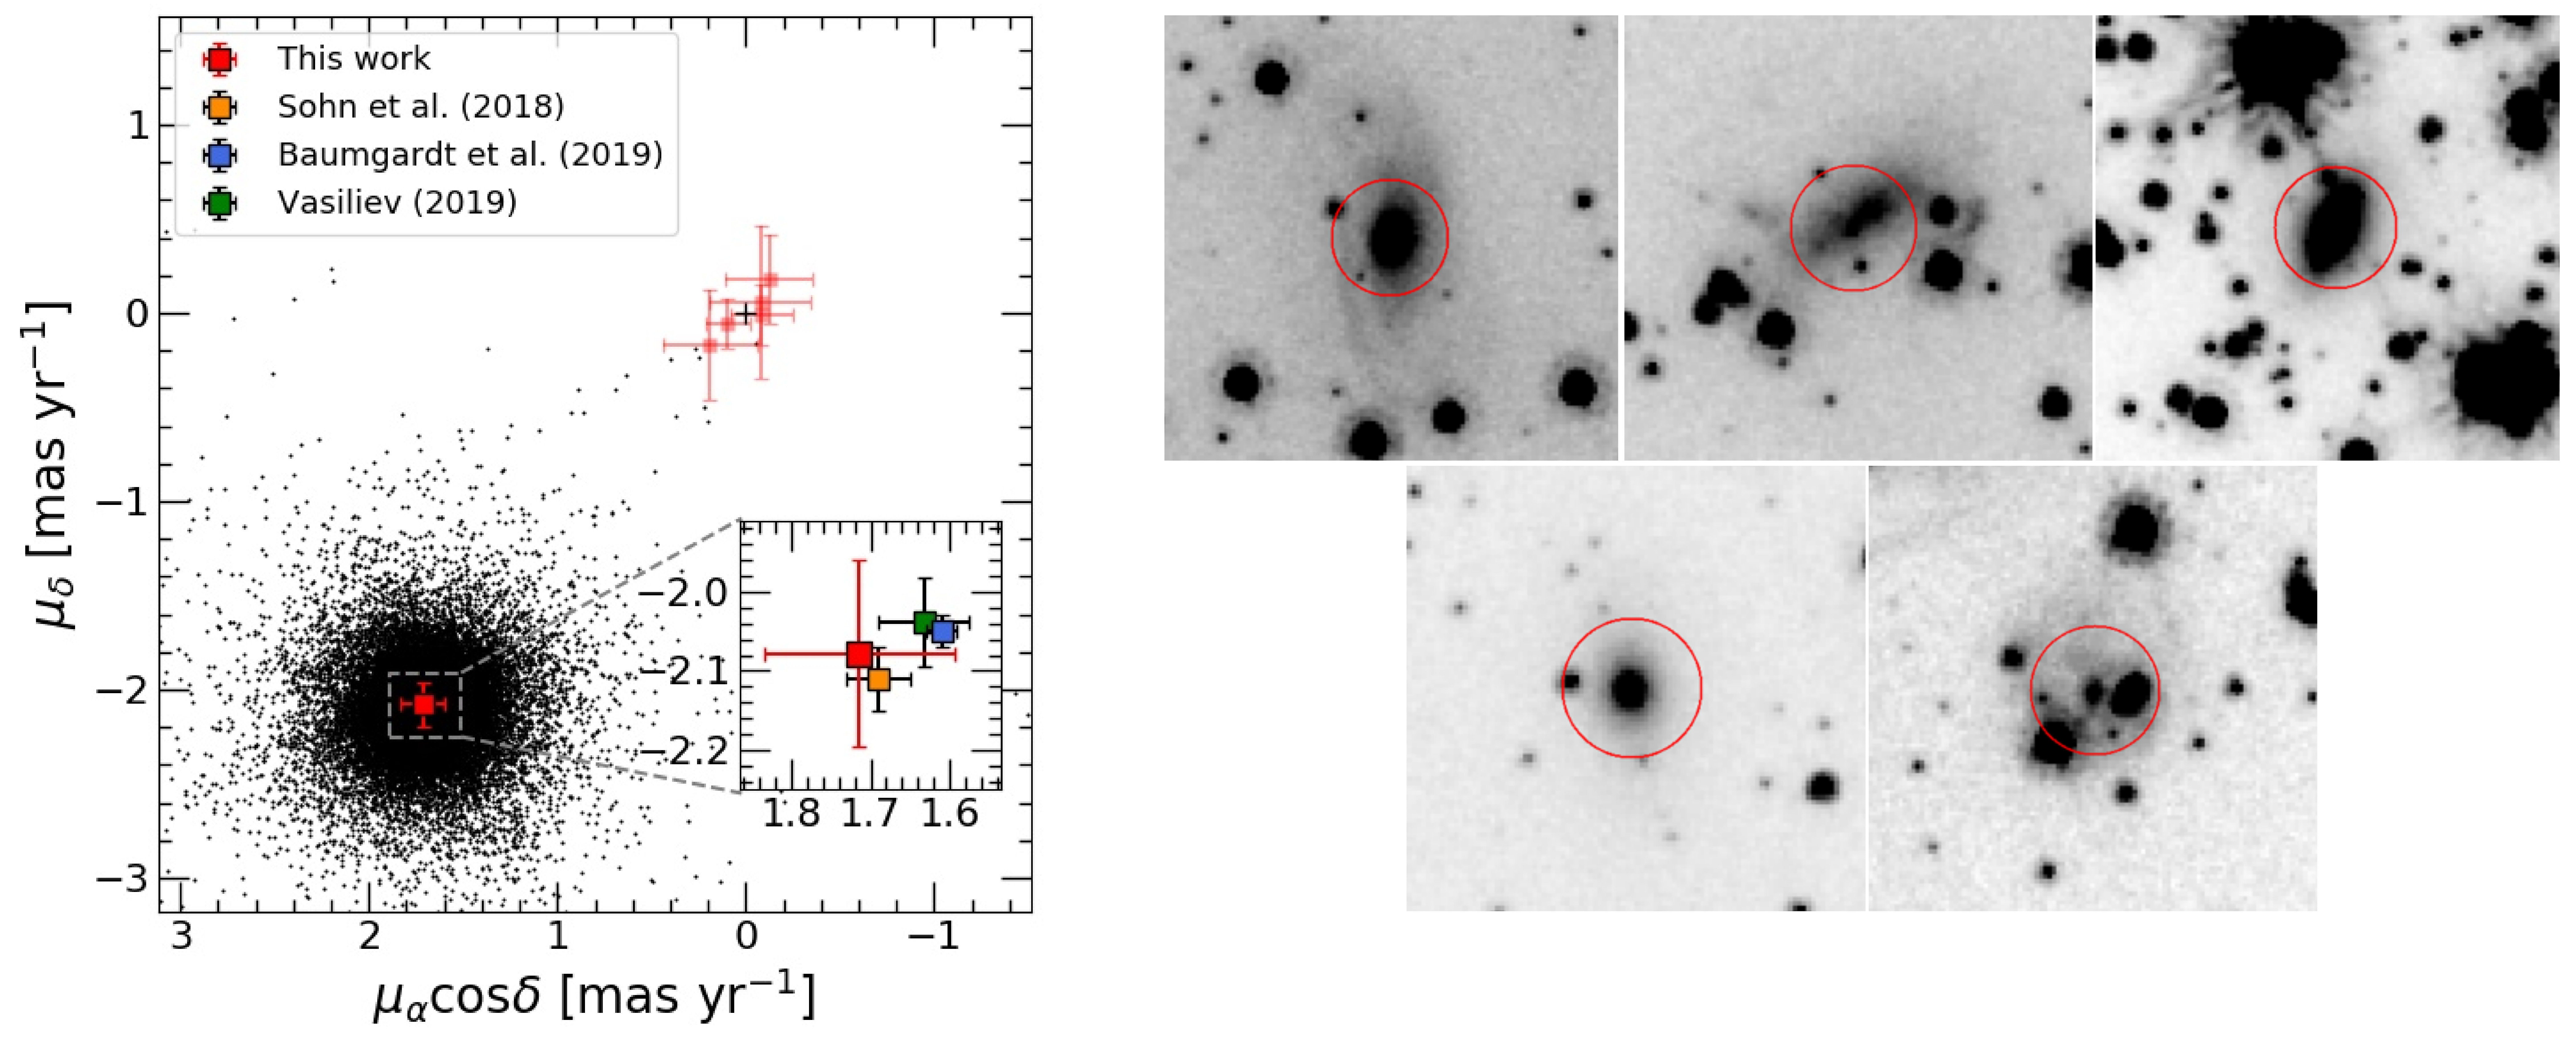
We visually inspected the images in our dataset, looking for background galaxies with sharp nuclei, in order to be able to obtain a meaningful photometry and astrometry with a stellar PSF. We found 5 background galaxies with reliable PMs. Their finding charts are shown in the right panel of Figure 6. These galaxies are distributed within the entire field of view, which minimizes the effects of cluster rotation, if present. We were not able to directly study cluster rotation from our PMs, because, during the PM computing procedure, we use six-parameter linear transformation to transform each star position into a given reference frame. These transformation also solve for rotation, therefore we cannot study rotation from cluster-member PMs. Any possible sign of rotation is transferred, with the opposite sign, to non-cluster objects in the field. Therefore, we can in principle use this property to study cluster rotation (see, e.g., Massari et al. 2013; Bellini et al. 2017b; Libralato et al. 2018b), however no suitable field object can be found in this particular case to properly perform a rotation analysis.
The absolute PMs of the 5 galaxies that we found are shown in the left panel of Figure 6 as light red squares. The absolute proper motion of NGC 1261, shown as a dark red square in Figure 6, that we consequently obtain is:
| (2) |
This result is consistent, within the errors, with the results of Sohn et al. (2018), obtained from HST data and a data reduction technique specifically designed to well measure the position of galaxies, and Baumgardt et al. (2019) and Vasiliev (2019), obtained from Gaia DR2 data.
Their results are shown in the inset of Figure 6 as yellow, blue and green squares, respectively.
5 Blue Straggler Stars
5.1 BSS Selection
As already discussed in Raso et al. (2017, see also ), a purely UV CMD (e.g., vs. ) is the ideal diagram to select BSSs. In this diagram, BSSs define an almost vertical sequence, clearly distinguishable from other evolutionary sequences. Also, at these wavelengths, the cooler stellar populations (e.g., Red Giant Branch, Asymptotic Giant Branch), which can severely limit our capability of detecting complete samples of BSSs (see Figures 4, 5 and 6 in Raso et al. 2017), are significantly fainter, while BSSs are among the brightest objects.
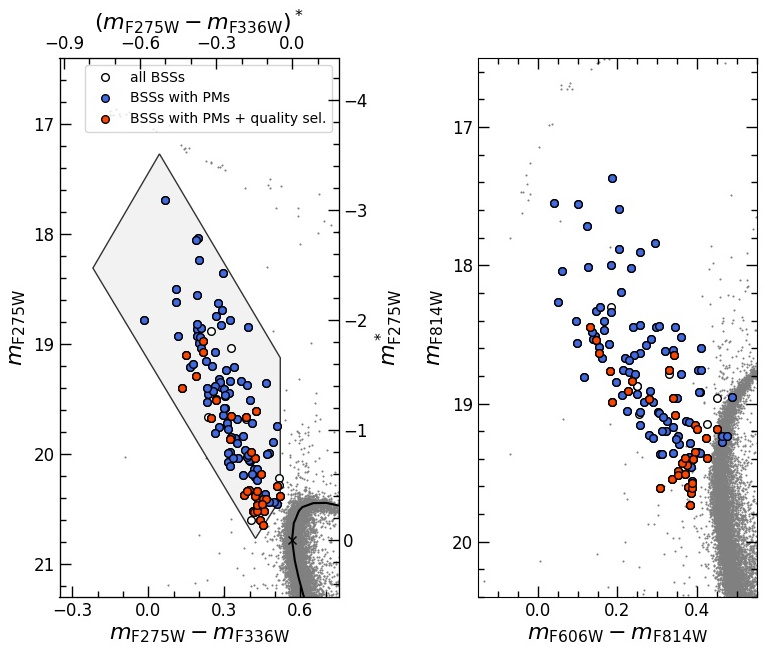
Therefore, we used the equations reported in Section 3 of Raso et al. (2017) to define the BSS selection box in the normalized CMD (n-CMD)666The n-CMD is a CMD where the stellar magnitudes and colors have been rigidly shifted so that the MS-TO is at and . This is useful when comparing GCs of different metallicity, as in Raso et al. (2017) and Ferraro et al. (2018a), because the BSS sequence is always located in the same region of the n-CMD. For consistency, here we adopt the same procedure, even if we are analyzing a single GC. of NGC 1261. In the left panel of Figure 7 we show the selection box (black thick line and shaded area) and the selected BSSs in the UV CMD (large circles). We also highlight the BSSs that have a measured PM (blue circles) and BSSs with PMs that pass our selection criteria for kinematics, discussed in Section 4.1 (red circles). In total, we selected 132 BSSs; 122 BSSs have a PM measurement, 32 of which pass the kinematic selection criteria. In the right panel of the Figure we show the selected BSSs in an optical CMD, with the same color code as in the left panel. As already discussed in Raso et al. (2017), the BSS selection performed in the UV CMD allows us to also safely select very faint BSSs, which in an optical CMD are extremely close to the MS-TO or even overlapping the MS-TO/Sub-Giant Branch cluster population.
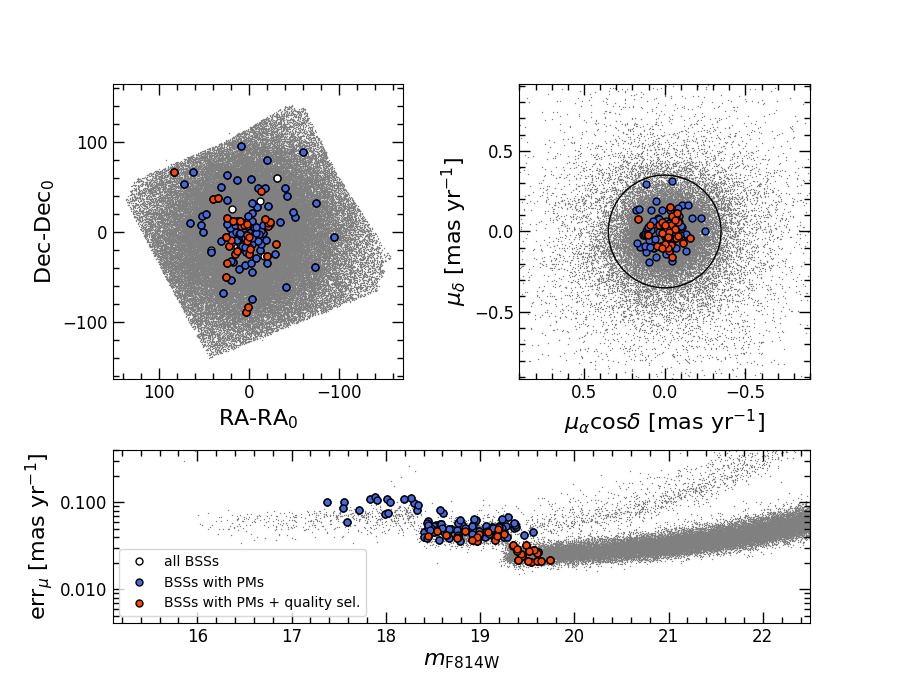
In the top left panel of Figure 8 we show the map of the FOV analyzed in this work, with selected BSSs highlighted with the same color code as in Figure 7. As expected, BSSs are found to preferentially populate the central regions of the cluster. In the top right panel of Figure 8, we show a zoomed version of the VPD plotted in Figure 3. The black circle corresponds to three times the standard deviation of the PM distribution of all stars with magnitude comparable to that of BSSs (roughly, ). From this plot, it appears clear that the selected BSSs are members of NGC 1261. In the bottom panel of Figure 8 we show the 1D PM error as a function of the F814W magnitude. BSSs are located exactly where the PM errors worsen. This is because the brightest BSSs are saturated in most of the deep optical exposures, and for this reason they have been measured only in a sub-sample of the available images. This reduced the temporal baseline of the PM measurements and the quality of the derived PMs. Only the faintest BSSs have high quality PMs; therefore, when using the BSSs sample selected with the kinematic quality criteria (see Section 5.4; red circles in Figure 8) we must keep in mind that we are preferentially selecting faint BSSs, i.e., low mass BSSs (see Raso et al. 2019).
5.2 BSS radial distribution
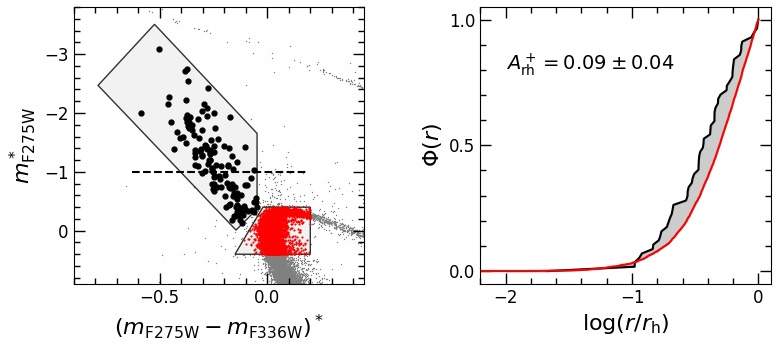
As already mentioned, BSSs are a population of heavy stars (with an average mass of ; see Shara et al. 1997; Gilliland et al. 1998; Ferraro et al. 2006; Fiorentino et al. 2014; Baldwin et al. 2016; Raso et al. 2019), while the average stellar mass in GCs is significantly smaller, . Therefore, BSSs are subject to dynamical friction, which progressively makes them sink toward the cluster center. For this reason, the BSS radial distribution is a fundamental tool to measure the dynamical evolution of GCs. In particular, Alessandrini et al. (2016) and Lanzoni et al. (2016) introduced the indicator , able to quantify the level of dynamical evolution of a cluster. This indicator is defined as the area enclosed between the cumulative radial distribution of BSSs and the one of a reference population of lighter stars. The distance from the center is expressed in logarithmic units in order to maximize the sensitivity of the indicator in the central regions, where dynamical friction accumulates most of the BSSs. The value of depends on the adopted distance from the cluster center. Thus, in order to perform meaningful comparisons among different clusters, Lanzoni et al. (2016) measured this parameter within one half-mass radius (). Recently, Ferraro et al. (2018a) investigated a sample of 48 Galactic GCs and found a strong correlation between and the number of central relaxation times experienced by the host star cluster. This result confirms the efficiency of as a tool to measure the dynamical evolution of GCs. Furthermore, Ferraro et al. (2019), explored a sample of 5 old Large Magellanic Cloud GCs, probing the presence of a correlation between and the number of central relaxation times also in stellar systems outside the Milky Way.
NGC 1261 is included in the sample discussed by Ferraro et al. (2018a), who found for this cluster. However, here we re-determine its value using the new center and half-mass radius obtained in this work. Both quantities can have a significant impact on the determination of , and, in particular, the half-mass radius adopted by Ferraro et al. (2018a, , from ) is significantly smaller than the value obtained here (, see Table 2).
For consistency with previous estimates, to measure we used BSSs brighter than in the n-CMD (see the dashed horizontal line in the left panel of Figure 9). This way, we select only the heaviest BSSs, for which the effect of dynamical friction is stronger, and we exclude the part of the BSS sequence where there could be a contamination from MS-TO stars or blends. As reference population, we used MS-TO stars, highlighted in red in the left panel of Figure 9. In the right panel we show the cumulative radial distributions of BSSs (black line) and MS-TO reference stars (red line). The shaded grey area between the two curves corresponds to the measured value of , equal to . The errors on have been estimated by combining the uncertainties due to small-number statistics, and the uncertainties on the half-mass radius and the position of the center. The former, which turned out to be the primary source of uncertainty, has been estimated with a jackknife bootstraping tecnique (Lupton 1993), as in Ferraro et al. (2018a). The latter has been estimated by repeating the measure of 1000 times, each time randomly extracting the values of the center and half-mass radius from a Gaussian distribution with mean and dispersion equal to the estimates obtained in this work.
The derived value of is in very good agreement with that quoted by Ferraro et al. (2018a), and indicates that NGC 1261 experienced a moderate level of BSS central sedimentation, thus suggesting a moderate level of dynamical evolution. In particular, by using Eq. (2) in Ferraro et al. (2018a), we obtain , corresponding to a relatively large central relaxation time: Gyr. For comparison, the most dynamically evolved clusters in the sample analyzed by Ferraro et al. (2018a), display values of as large as 0.4, with . These considerations suggest that NGC 1261 is not in an advanced stage of dynamical evolution (see also Dalessandro et al. 2019).
5.3 A double sequence in NGC 1261?
The BSS population of NGC 1261 has been studied by Simunovic et al. (2014), from the analysis of a subset of the dataset used in this work (the F606W and F814W images from GO-10775, and the F336W images from GO-13297 - see Table 1 for details). They found that BSSs in this cluster define at least two sequences. In Galactic GCs, this feature has been observed in M30 (Ferraro et al. 2009) and NGC 362 (Dalessandro et al. 2013; Libralato et al. 2018b), and recently also in M15 (Beccari et al. 2019).
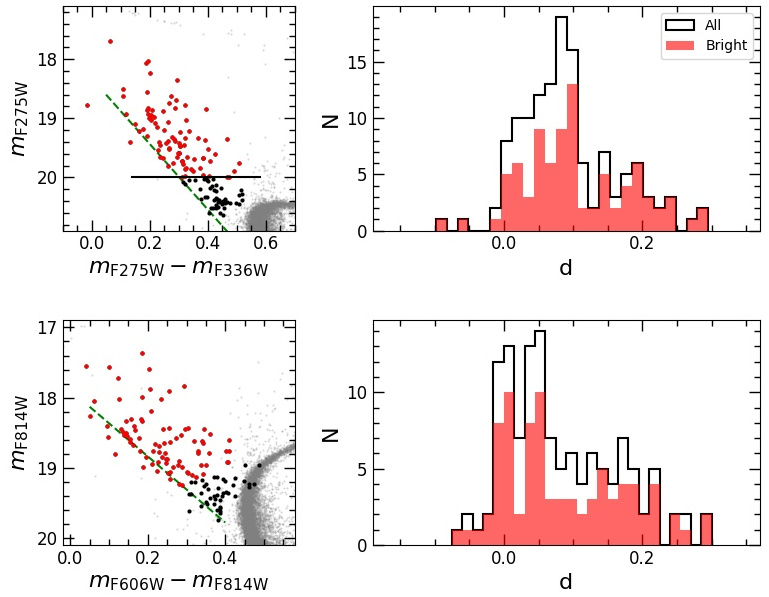
The main characteristic of this feature is the presence of a narrow blue BSS sequence, separated by a clear gap from a broader red BSS sequence. As first suggested by Ferraro et al. (2009), the narrowness of the blue sequence and its impressive agreement with the locus of BSS collisional isochrones (Sills et al. 2009) point towards a simultaneous and collisional origin of these BSSs, possibly related to the cluster core collapse (CC), with the possibility of even dating the epoch of such event (see also Portegies Zwart 2019).
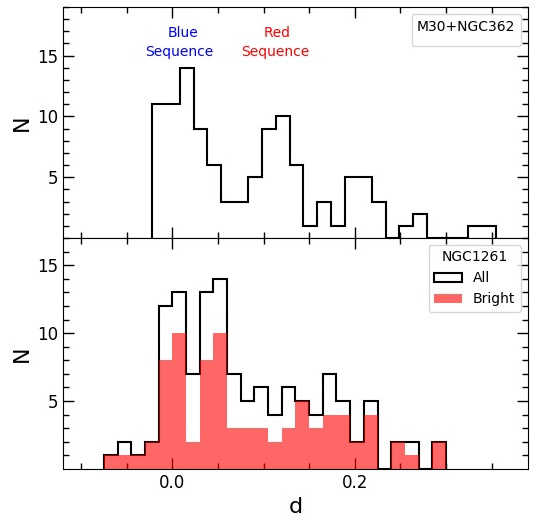
We checked our photometry for this feature. In Figure 11 we show both the UV CMD used for the BSS selection (top left panel, see Section 5.1), and the optical CMD (bottom left panel). The optical CMD is remarkably similar to that published by Simunovic et al. (2014), and a vague hint of a bimodal distribution can be distinguished by eye, especially if the faintest portion of the BSS sequence is not considered. In order to quantify this impression, in both diagrams, we draw a straight line roughly corresponding to the blue edge of the BSS sequence (green, dashed lines in Figure 11), excluding just a few scattered, blue objects, and we compute the distance of each BSS from those lines (perpendicularly to the line itself). The distributions of the resulting BSS distances is plotted in the right panels of Figure 11, both for the complete sample of BSSs (black histogram) and for a selected sample, excluding faint BSSs (, red histogram). As can be seen, no evidence of bimodal distribution is visible in the distribution of BSS distances computed in the UV CMD. Instead, the optical CMD shows a double peak, very similar to that discussed by Simunovic et al. (2014).
This is found, however, only if quite narrow bins are adopted, while using wider bins reduces or completely erases the feature. Moreover, the bin width ( mag) necessary to highlight two distinct peaks in the distribution is comparable to the average photometric error of the BSS population ( mag). This clearly casts doubts about the real existence of a double BSS sequence in NGC 1261. We also highlight that the distance between the two BSS peaks detected in M30 and NGC 362 ( mag) is several times larger than in NGC 1261. This is clearly appreciable in Figure 11, where the combined distribution of the BSS distances for M30 and NGC 362 (upper panel) is compared to that obtained in NGC 1261 (lower panel). Indeed, the bimodal feature detected in NGC 1261 seems to be morphologically different from those discovered in M30 and NGC 362: the two peaks identified in NGC 1261 are essentially located within the “collisional peak” of the other two clusters. On the other hand, the measure of the BSS sedimentation level, obtained in Section 5.2, suggests that NGC 1261 is still far from its CC phase, quite differently from M30 and NGC 362, which are both in very advanced stages of dynamical evolution. This comparison thus poses questions about the similarity of these features: even if confirmed by future observations with higher photometric accuracy, the double BSS sequence in NGC 1261 might have a different origin from that suggested for M30 and NGC 362 (Ferraro et al. 2009; Portegies Zwart 2019).
5.4 BSS kinematics
GCs tend to evolve towards a state of energy equipartition, i.e., energy exchanges among stars of different masses redistribute kinetic energy. As a consequence, lighter stars increase their velocity, while heavier stars (like BSSs) tend to slow down. Therefore, it is interesting to compare the velocity dispersion profile of “normal” stars (e.g., MS-TO stars, which have a mass of ; see Section 4), with the one of BSSs, having larger masses, on average (Raso et al. 2019).
Using the same technique presented in Section 4.2, here we obtain the combined velocity dispersion profile for BSSs in the plane of the sky. As discussed above, most of the analyzed BSSs have PM errors larger than MS-TO stars. Indeed, the PM quality selection described in Section 4.1 causes a strong reduction of the BSS sample suitable for a kinematical study (see Figure 8). Quantitatively, we are left with only 32 BSSs, i.e., less than 25% of the total sample. Moreover, due to the shape of the PM error distribution, this selection preferentially rejects bright BSSs, which correspond to the most massive ones (Raso et al. 2019). Therefore, applying this selection would imply a study limited only to BSSs with masses (and therefore kinematics) very similar to those of TO stars. With the aim of mitigating this mass selection effect, and to maintain a large enough statistics, we thus dropped the (viii) selection criterion. With this selection, the BSS sample used for the kinematic analysis contains 76 stars, represented as black solid squares in Figure 12. In this way, we cover almost the entire magnitude (hence, mass) extension of the BSS sequence, excluding only the brightest 0.5 mag, in which case the PM errors are too large to provide meaningful information about kinematics.
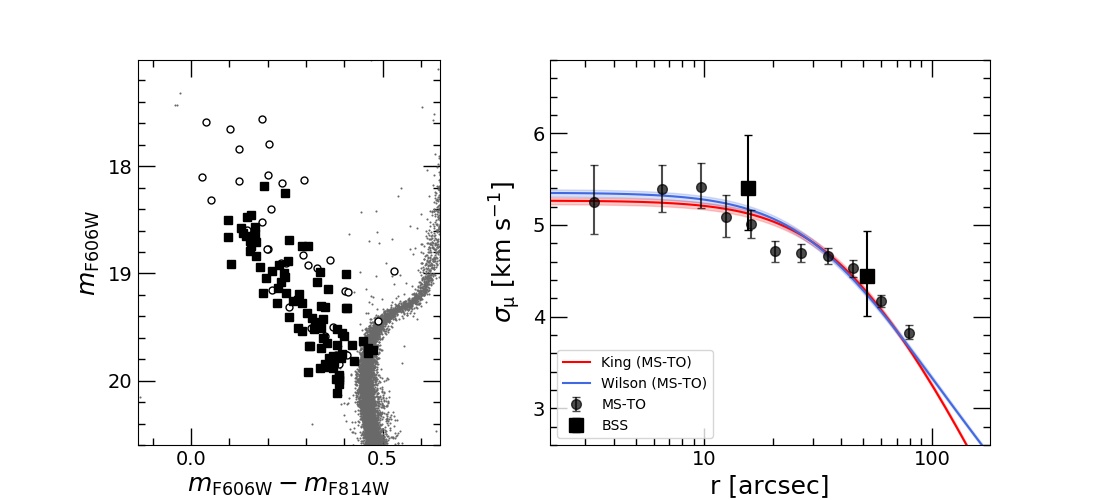
We divided the sample into two equally populated radial bins (38 stars each), and measured the velocity dispersion in each bin with the same method described in Section 4.2. The combined BSS velocity dispersion profile is shown in the right panel of Figure 12. As apparent, it is consistent with the MS-TO velocity dispersion profile. This is somehow expected from the derived value of , which suggests a low level of dynamical evolution. Indeed, Baldwin et al. (2016) measured the ratio between the BSS and the MS-TO velocity dispersions () in 19 GCs and Ferraro et al. (2018a) compared with the dynamical ages estimated through the parameter for 14 GCs in common between the two samples. They found an anticorrelation between the two parameters, where clusters with lower values of (i.e., less dynamically evolved) show larger values of (see Figure 11 in Ferraro et al. 2018a). By inserting the value of determined above for NGC 1261 into Equation 3 of Ferraro et al. (2018a), we expect , which is fully compatible with what found from the comparison between the BSS and the TO velocity dispersion profiles. This result further confirms that NGC 1261 is poorly dynamically evolved.
6 Summary and conclusions
We constructed a high-precision HST astro-photometric catalog of the central regions of NGC 1261, a relatively distant (D⊙=15.7 kpc) Galactic GC with intermediate metallicity and low extinction ([Fe/H]=1.27 and E()=0.01, Harris 1996).
We determined the center of gravity and density profile of the system from resolved star counts, also complementing the HST catalog with Gaia DR2 data to cover the entire radial extension, out to deg. We found that the density profile shows a significant deviation from both a King and a Wilson profile in the outer regions (for and , respectively). This confirms the existence of a diffuse stellar halo around the system, as previously shown by Kuzma et al. (2018).
We measured the HST PMs of thousands of individual stars and used them to construct the velocity dispersion and anisotropy profiles in the plane of the sky of NGC 1261. We show that the central regions of the cluster (within r) are isotropic. The central velocity dispersion from PMs is consistent with previous determinations from radial velocities. Hence, under the assumption of global orbital isotropy, we combined the PM and LOS measurements and built the most extended velocity dispersion profile of NGC 1261 so far, covering a radial range from the very center, out to . Adopting the structural parameters estimated from the observed density profile and the central velocity dispersion obtained from PMs (), we find a total mass of for NGC 1261.
We also found that this GC hosts a quite large BSS population, composed of 132 stars. We measured the dynamical age of the system, by means of the parameter (Alessandrini et al. 2016; Lanzoni et al. 2016; Ferraro et al. 2018a), finding comparable results with previous estimates and confirming that it is relatively young from the point of view of dynamical evolution. We also found a hint of a split BSS sequence observed by Simunovic et al. (2014), although the detectability of the feature is critically dependent on binning. The HST PM measurements allowed us to also perform a kinematic study of the BSS population. In spite of large uncertainties due to small statistics, this confirms that NGC 1261 is in a moderate stage of dynamical evolution.
References
- Alessandrini et al. (2016) Alessandrini, E., Lanzoni, B., Miocchi, P., Ferraro, F. R., & Vesperini, E. 2016, ApJ, 833, 252
- Anderson & King (2006) Anderson, J., & King, I. R. 2006, ACS/ISR 2006-01 (Baltimore, MD: STScI), available online at http://www.stsci.edu/hst/acs/documents/isrs
- Anderson & Bedin (2010) Anderson, J., & Bedin, L. R. 2010, PASP, 122, 1035
- Baldwin et al. (2016) Baldwin, A. T., Watkins, L. L., van der Marel, R. P., et al. 2016, ApJ, 827, 12
- Baumgardt & Hilker (2018) Baumgardt, H., & Hilker, M. 2018, MNRAS, 478, 1520
- Baumgardt et al. (2019) Baumgardt, H., Hilker, M., Sollima, A., et al. 2019, MNRAS, 482, 5138
- Beccari et al. (2011) Beccari, G., Sollima, A., Ferraro, F. R., et al. 2011, ApJ, 737, 3
- Beccari et al. (2012) Beccari, G., Lützgendorf, N., Olczak, C., et al. 2012, ApJ, 754, 108
- Beccari et al. (2019) Beccari, G., Ferraro, F. R., Dalessandro, E., et al. 2019, ApJ, 876, 87
- Bellini & Bedin (2009) Bellini, A., & Bedin, L. R. 2009, PASP, 121, 1419
- Bellini et al. (2011) Bellini, A., Anderson, J., & Bedin, L. R. 2011, PASP, 123, 622
- Bellini et al. (2014) Bellini, A., Anderson, J., van der Marel, R. P., et al. 2014, ApJ, 797, 115
- Bellini et al. (2015) Bellini, A., Vesperini, E., Piotto, G., et al. 2015, ApJ, 810, L13
- Bellini et al. (2017a) Bellini, A., Anderson, J., Bedin, L. R., et al. 2017a, ApJ, 842, 6
- Bellini et al. (2017b) Bellini, A., Bianchini, P., Varri, A. L., et al. 2017b, ApJ, 844, 167
- Bellini et al. (2018) Bellini, A., Libralato, M., Bedin, L. R., et al. 2018, ApJ, 853, 86
- Bianchini et al. (2016) Bianchini, P., van de Ven, G., Norris, M. A., Schinnerer, E., & Varri, A. L. 2016, MNRAS, 458, 3644
- Binney, & Tremaine (1987) Binney, J., & Tremaine, S. 1987, Princeton
- Cadelano et al. (2017) Cadelano, M., Dalessandro, E., Ferraro, F. R., et al. 2017, ApJ, 836, 170
- Calzetti et al. (1993) Calzetti, D., de Marchi, G., Paresce, F., et al. 1993, ApJ, 402, L1
- Dalessandro et al. (2008) Dalessandro, E., Lanzoni, B., Ferraro, F. R., et al. 2008, ApJ, 681, 311
- Dalessandro et al. (2013) Dalessandro, E., Ferraro, F. R., Massari, D., et al. 2013, ApJ, 778, 135
- Dalessandro et al. (2019) Dalessandro, E., Cadelano, M., Vesperini, E., et al. 2019, ApJ, 884, L24
- De Marco et al. (2005) De Marco, O., Shara, M. M., Zurek, D., et al. 2005, ApJ, 632, 894
- Dotter et al. (2010) Dotter, A., Sarajedini, A., Anderson, J., et al. 2010, ApJ, 708, 698
- Dubath et al. (1997) Dubath, P., Meylan, G., & Mayor, M. 1997, A&A, 324, 505
- Ferraro et al. (1992) Ferraro, F. R., Fusi Pecci, F., & Buonanno, R. 1992, MNRAS, 256, 376
- Ferraro et al. (1993) Ferraro, F. R., Fusi Pecci, F., & Cacciari, C. 1993, AJ, 106, 2324
- Ferraro et al. (1997) Ferraro, F. R., Paltrinieri, B., Fusi Pecci, F., et al. 1997, A&A, 324, 915
- Ferraro et al. (1999) Ferraro, F. R., Messineo, M., Fusi Pecci, F., et al. 1999, AJ, 118, 1738
- Ferraro et al. (2004) Ferraro, F. R., Beccari, G., & Rood, R. T. 2004, ApJ, 603, 127
- Ferraro et al. (2006) Ferraro, F. R., Sabbi, E., Gratton, R., et al. 2006, ApJ, 647, L53
- Ferraro et al. (2009) Ferraro, F. R., Beccari, G., Dalessandro, E., et al. 2009, Nature, 462, 1028
- Ferraro et al. (2012) Ferraro, F. R., Lanzoni, B., Dalessandro, E., et al. 2012, Nature, 492, 393
- Ferraro et al. (2018a) Ferraro, F. R., Lanzoni, B, Raso, S., et al. 2018a, ApJ, 860, 36
- Ferraro et al. (2018b) Ferraro, F. R., Mucciarelli, A., Lanzoni, B., et al. 2018b, ApJ, 860, 50
- Ferraro et al. (2019) Ferraro, F. R., Lanzoni, B., Dalessandro, E., et al. 2019, Nature Astronomy, 3, 1149
- Fiorentino et al. (2014) Fiorentino, G., Lanzoni, B., Dalessandro, E., et al. 2014, ApJ, 783, 29
- Foreman-Mackey et al. (2013) Foreman-Mackey, D., Hogg, D. W., Lang, D., Goodman, J. 2013, PASP, 125, 306
- Gaia Collaboration et al. (2016) Gaia Collaboration, Prusti, T., de Bruijne, J. H. J., et al. 2016, A&A, 595, A1
- Gaia Collaboration et al. (2018) Gaia Collaboration, Brown, A. G. A., Vallenari, A., et al. 2018, A&A, 616, A1
- Gilliland et al. (1998) Gilliland, R. L., Bono, G., Edmonds, P. D., et al. 1998, ApJ, 507, 818
- Goldsbury et al. (2010) Goldsbury, R., Richer, H. B., Anderson, J., et al. 2010, AJ, 140, 1830
- Harris (1996) Harris, W. E. 1996, AJ, 112, 1487, 2010 edition
- Hunter (2007) Hunter, J. D., 2007, Computing in Science & Engineering, 9, 90
- King (1966) King, I. R. 1966, AJ, 71, 64
- Kuzma et al. (2018) Kuzma, P. B., Da Costa, G. S., & Mackey, A. D. 2018, MNRAS, 473, 2881
- Lanzoni et al. (2007a) Lanzoni, B., Dalessandro, E., Ferraro, F. R., et al. 2007a, ApJ, 663, 267
- Lanzoni et al. (2007b) Lanzoni, B., Sanna, N., Ferraro, F. R., et al. 2007b, ApJ, 663, 1040
- Lanzoni et al. (2007c) Lanzoni, B., Dalessandro, E., Ferraro, F. R., et al. 2007c, ApJ, 668, L139
- Lanzoni et al. (2010) Lanzoni, B., Ferraro, F. R., Dalessandro, E., et al. 2010, ApJ, 717, 653
- Lanzoni et al. (2013) Lanzoni, B., Mucciarelli, A., Origlia, L., et al. 2013, ApJ, 769, 107
- Lanzoni et al. (2016) Lanzoni, B., Ferraro, F. R., Alessandrini, E., et al. 2016, ApJ, 833, L29
- Lanzoni et al. (2018a) Lanzoni, B., Ferraro, F. R., Mucciarelli, A., et al. 2018a, ApJ, 861, 16
- Lanzoni et al. (2018b) Lanzoni, B., Ferraro, F. R., Mucciarelli, A., et al. 2018b, ApJ, 865, 11
- Lanzoni et al. (2019) Lanzoni, B., Ferraro, F. R., Dalessandro, E., et al. 2019, ApJ, 887, 176
- Leigh et al. (2011) Leigh, N., Sills, A., & Knigge, C. 2011, MNRAS, 415, 3771
- Li et al. (2019) Li, C., Sun, W., Hong, J., et al. 2019, ApJ, 871, 171
- Libralato et al. (2018a) Libralato, M., Bellini, A., Bedin, L. R., et al. 2018a, ApJ, 854, 45
- Libralato et al. (2018b) Libralato, M., Bellini, A., van der Marel, R. P., et al. 2018b, ApJ, 861, 99
- Libralato et al. (2019) Libralato, M., Bellini, A., Piotto, G., et al. 2019, ApJ, 873, 109
- Lugger et al. (1995) Lugger, P. M., Cohn, H. N., & Grindlay, J. E. 1995, ApJ, 439, 191
- Lupton (1993) Lupton, R. 1993, Princeton
- Mapelli et al. (2004) Mapelli, M., Sigurdsson, S., Colpi, M., et al. 2004, ApJ, 605, L29
- Mapelli et al. (2006) Mapelli, M., Sigurdsson, S., Ferraro, F. R., et al. 2006, MNRAS, 373, 361
- Marigo et al. (2017) Marigo, P., Girardi, L., Bressan, A., et al. 2017, ApJ, 835, 77
- Massari et al. (2013) Massari, D., Bellini, A., Ferraro, F. R., et al. 2013, ApJ, 779, 81
- Massari et al. (2019) Massari, D., Koppelman, H. H., & Helmi, A. 2019, A&A, 630, L4
- Meylan & Heggie (1997) Meylan, G. & Heggie, D. C. 1997, A&A Rev., 8, 1
- Milone et al. (2012) Milone, A. P., Piotto, G., Bedin, L. R., et al. 2012, A&A, 540, A16
- Miocchi et al. (2013) Miocchi, P., Lanzoni, B., Ferraro, F. R., et al. 2013, ApJ, 774, 151
- Montegriffo et al. (1995) Montegriffo, P., Ferraro, F. R., Fusi Pecci, F., & Origlia, L., 1995, MNRAS, 276, 739
- Moretti et al. (2008) Moretti, A., De Angeli, F., & Piotto, G. 2008, A&A, 483, 183
- Nardiello et al. (2018) Nardiello, D., Libralato, M., Piotto, G. et al. 2018, MNRAS, 481, 3382
- Oliphant (2006) Oliphant T. E. 2006, Trelgol Publishing
- Piotto et al. (2004) Piotto, G., De Angeli, F., King, I. R., et al. 2004, ApJ, 604, L109
- Piotto et al. (2015) Piotto, G., Milone, A. P., Bedin, L. R., et al. 2015, AJ, 149, 91
- Portegies Zwart (2019) Portegies Zwart, S. 2019, A&A, 621, L10
- Raso et al. (2017) Raso, S., Ferraro, F. R., Dalessandro, E., et al. 2017, ApJ, 839, 64
- Raso et al. (2019) Raso, S., Pallanca, C., Ferraro, F. R., et al. 2019, ApJ, 879, 56
- Shara et al. (1997) Shara, M. M., Saffer, R. A., & Livio, M. 1997, ApJ, 489, L59
- Shipp et al. (2018) Shipp, N., Drlica-Wagner, A., Balbinot, E., et al. 2018, ApJ, 862, 114
- Sills et al. (2009) Sills, A., Karakas, A., & Lattanzio, J. 2009, ApJ, 692, 1411
- Simunovic et al. (2014) Simunovic, M., Puzia, T. H., & Sills, A. 2014, ApJ, 795, L10
- Simunovic & Puzia (2016) Simunovic, M., & Puzia, T. H. 2016, MNRAS, 462, 3401
- Singh & Yadav (2019) Singh, G., & Yadav, R. K. S. 2019, MNRAS, 482, 4874
- Sohn et al. (2018) Sohn, S. T., Watkins, L. L., Fardal, M. A., et al. 2018, ApJ, 862, 52
- Sollima & Ferraro (2019) Sollima, A., & Ferraro, F. R. 2019, MNRAS, 483, 1523
- Tiongco et al. (2016) Tiongco, M. A., Vesperini, E., & Varri, A. L. 2016, MNRAS, 455, 3693
- Trenti & van der Marel (2013) Trenti, M., & van der Marel, R. 2013, MNRAS, 435, 3272
- van de Ven et al. (2006) van de Ven, G., van den Bosch, R. C. E., Verolme, E. K., et al. 2006, A&A, 445, 513
- Vasiliev (2019) Vasiliev, E. 2019, MNRAS, 484, 2832
- Vesperini et al. (2014) Vesperini, E., Varri, A. L., McMillan, S. L. W., et al. 2014, MNRAS, 443, L79
- Watkins et al. (2015) Watkins, L. L., van der Marel, R. P., Bellini, A. & Anderson, J. 2015, ApJ, 803, 29
- Wilson (1975) Wilson, C. P. 1975, AJ, 80, 175