NIHAO XXIV: Rotation or pressure supported systems?
Simulated Ultra Diffuse Galaxies show a broad distribution in their stellar kinematics
Abstract
In recent years a new window on galaxy evolution opened, thanks to the increasing discovery of galaxies with a low surface brightness, such as Ultra Diffuse Galaxies (UDGs). The formation mechanism of these systems is still a much debated question, and so are their kinematical properties. In this work, we address this topic by analyzing the stellar kinematics of isolated UDGs formed in the hydrodynamical simulation suite NIHAO. We construct projected line-of-sight velocity and velocity dispersion maps to compute the projected specific angular momentum, , to characterize the kinematical support of the stars in these galaxies. We found that UDGs cover a broad distribution, ranging from dispersion to rotation supported galaxies, with similar abundances in both regimes. The degree of rotation support of simulated UDGs correlates with several properties such as galaxy morphology, higher HI fractions and larger effective radii with respect to the dispersion supported group, while the dark matter halo spin and mass accretion history are similar amongst the two populations. We demonstrate that the alignment of the infalling baryons into the protogalaxy at early is the principal driver of the =0 stellar kinematic state: pressure supported isolated UDGs form via mis-aligned gas accretion while rotation supported ones build-up their baryons in an ordered manner. Accounting for random inclination effects, we predict that a comprehensive survey will find nearly half of field UDGs to have rotationally supported stellar disks, when selecting UDGs with effective radius larger than kpc.
keywords:
dwarf galaxies– dark matter – low surface brightness1 Introduction
During the latter part of the 1980s, astronomers began to find galaxies so faint and diffuse that they were barely distinguishable from the sky background (e.g Bothun et al., 1987, 1985; Schombert & Bothun, 1988; Impey et al., 1988). The discovery of such galaxies, known as Low Surface Brightness galaxies (LSB) implied a challenge to the standard CDM paradigm of galaxy formation (see Bothun et al., 1997). In recent years, improvements in instrumentation and the development of new reduction techniques have allowed to reach much lower magnitude and surface brightness limits (Merritt et al., 2014; van Dokkum et al., 2015; Fliri & Trujillo, 2016; Trujillo & Fliri, 2016; Martínez-Delgado et al., 2010), opening a new window on the low surface brightness universe and leading to the discovery of Ultra Diffuse Galaxies (UDGs, van Dokkum et al. 2015 see, however, de Blok et al. 1996 for earlier references to galaxies with similar properties). UDGs have been found in low redshift clusters (van der Burg et al., 2016; Mancera Piña et al., 2018) such as Virgo (Mihos et al., 2005; Beasley et al., 2016), Fornax (Muñoz et al., 2015) and the Coma cluster (Koda et al., 2015; Beasley & Trujillo, 2016; van Dokkum et al., 2015), in which more than such galaxies have been identified. Nevertheless, they have started to be found in less dense environments: Martínez-Delgado et al. (2016) have found a UDG in a filament at the outskirts of the Piscis-Perseus super-cluster, Prole et al. (2019) have used the Kilo-Degree Survey (KiDs) to look for field UDGs, and Román et al. (2019) identified a red UDG in a void using the IAC Stripe82 Legacy Survey (Fliri & Trujillo, 2016) . It is not clear if the large difference between the number of field UDGs and in-cluster UDGs is due to a mechanism the makes UDGs more likely to form in high density environments or rather it is related to an observational bias, since it is easier to infer the distance to these systems in denser regions, and thus to identify them as UDGs (Román & Trujillo, 2017a).
In general, UDG properties are related to the environment they live in: Román & Trujillo (2017a) have studied the UDG population in Abell cluster and find that bluer UDGs live in the outskirts of the cluster. Román & Trujillo (2017b) using UDGs in Hickson Compact Groups, presented a possible evolution mechanism that links blue HI rich isolated systems with the redder and HI poor UDGs that are found in clusters (see also Trujillo et al., 2017). Spekkens & Karunakaran (2018) used the same sample and showed that these blue UDGs have huge reservoirs of HI gas.
As suggested by their stellar and globular cluster kinematics, UDGs seem to be dark matter dominated galaxies, which in general follow the stellar to halo mass relation (see Beasley et al., 2016; Toloba et al., 2018; van Dokkum et al., 2019).
The most astonishing property of UDGs is that, despite having stellar masses of small dwarfs (), they have effective radii greater than , similar to the ones of large spirals. These two aspects combined are the reason for which UDGs have such low effective surface brightness, reaching (e.g. Yagi et al., 2016). As discussed in Trujillo et al. (2020), however, the effective radius is strongly dependent on a galaxy’s profile, and interpreting it as the size of the galaxy should be done carefully. Indeed, they introduced a new parameter, i.e. the radius at which the stellar density decreases under , which seems to be more closely related to the physical size of a galaxy: applying this parameter to UDGs, (Chamba et al., 2020) found no evidence for them to be abnormally large compared with other dwarfs. The question that arises from their work, thus, is not about their sizes, but rather on why UDGs have such a lack of central cusp in their surface brightness profiles, unlike other dwarfs of similar stellar masses.
As of today, there is no consensus amongst the scientific community regarding the formation mechanisms of UDGs. We can distinguish two groups of proposed formation mechanisms:
-
1.
the ones that require UDGs to live in high density regions, in which case environmental effects like ram-pressure stripping at early times due to the galaxy infalling into the cluster (Yozin & Bekki, 2015; Tremmel et al., 2019, 2020; Sales et al., 2020), tidal heating (Carleton et al., 2018), or two body encounters (Baushev, 2018) may explain the properties of in-cluster UDGs;
-
2.
the ones that invoke internal mechanisms within the UDGs themselves, and which allow such galaxies to form also in the field. The high-spin scenario (initially proposed by Amorisco & Loeb 2016, see also Rong et al. 2017; Liao et al. 2019) suggests that UDGs may be the natural extension of the dwarf population that live into high-spin dark matter haloes, whilst the feedback-driven scenario, proposed by Di Cintio et al. (2017) and later supported by Chan et al. (2018), using the NIHAO simulation suite (Wang et al., 2015) and FIRE simulation (Hopkins et al., 2014) respectively, shows that successive supernovae events generate feedback-driven outflows that flatten the density profiles of both dark matter and stars, leading to the low surface brightness characteristic of UDGs.
The formation mechanisms mentioned above are not mutually exclusive and they can conspire together in order to form the whole population of UDGs (see Chilingarian et al. 2019).
It is challenging to understand the emergence of UDGs in a cosmological context. In particular, it is difficult to simulate such small systems, which require high resolution to resolve sub-grid physics, within dense environments that include many more massive galaxies (although see the recent work by Tremmel et al., 2019, 2020; Sales et al., 2020). By contrast, zoom-in simulations can resolve low mass systems within less dense field environments, and such simulations have been able to reproduce populations of UDGs, as shown in Di Cintio et al. (2017) and Jiang et al. (2019) using the NIHAO simulation suite (Wang et al., 2015), in Chan et al. (2018) using the FIRE simulations (Hopkins et al., 2014) or Liao et al. (2019) using AURIGA simulations (Grand et al., 2017).
Due to the diffuse nature of these systems there are only few and recent attempts to try to measure velocity gradients: Mancera Piña et al. (2019) analyzed the kinematics of the HI component of UDGs, finding lower circular velocity than the expected from their baryonic Tully-Fisher relation; Sengupta et al. (2019) identified a velocity gradient in the HI disk of UGC 2162 compatible with what expected from dwarfs of similar masses; Leisman et al. (2017) made a systematic analysis of the HI rich sources form the ALFALFA catalog (Giovanelli et al., 2005); Ruiz-Lara et al. (2018) studied, via spectroscopic analysis of their stars, UDGs in the Coma Cluster providing upper limits to the stellar rotation of these systems, showing that they are compatible with being dwarfs; Chilingarian et al. (2019) measured, via intermediate-resolution spectra, the kinematics of UDGs in the Coma cluster, finding signals of major axis rotation in of them; Emsellem et al. (2019), using MUSE integral field spectroscopy, detected a signal of prolate rotation in the stellar field NGC1052-DF2 (see van Dokkum et al. 2018; Trujillo et al. 2019; Ruiz-Lara et al. 2019 for a detailed discussion about the physical properties of this galaxy), Collins et al. (2020) analyzed the And XIX extreme diffuse galaxy finding a marginal velocity gradient using giant branch stars, and van Dokkum et al. (2019) used spatially resolved stellar kinematics of the DF44 UDG to show that there is no evidence of rotation along its major axis.
In this manuscript we use the NIHAO simulation suite in order to identify the kinematical support of the stellar component of simulated field UDGs, and we study the evolution of these systems as a function of redshift in order to identify the mechanisms that induce rotation versus dispersion support in UDGs.
This work is structured as follows: in section 2 we will explain the details of the NIHAO simulations and the galaxy selection criteria; in section 3 we will present the stellar kinematic maps of our simulated UDGs, determine a criterion to distinguish between rotation and dispersion support of their stellar component, and show that the existence of two kinematically different populations can be related to the gas accretion alignment across cosmic time. Finally in section 4 we will make a summary of the results and present our main conclusions, offering observational predictions for how many rotation vs. pressure supported UDGs are expected in the sky.
2 Simulations
2.1 NIHAO simulation suite

We use a set of zoom-in simulated galaxies from the Numerical Investigation of a Hundred astrophysical Objects (NIHAO project, Wang et al., 2015). This project uses the N-body smooth particle hydrodynamics (SPH) code known as Gasoline2 (Wadsley et al., 2017) and has been run using Planck Cosmology (Planck Collaboration et al., 2014).
These simulations include three types of particles: dark matter, stars and gas. The way the gas particles form stars has been fixed in order to reproduce a Kenicutt-Schmidth law. Cool and dense enough gas particles, with density and temperature thresholds being and respectively, are eligible to form stars, and the cooling mechanisms include Hydrogen, Helium and Metal lines as well as Compton cooling (Shen et al., 2010).
Each star particle represents a population of stars. The number of stars of a given mass follows a Chabrier Initial Mass Function (Chabrier, 2003). This type of IMF sets the number of massive stars formed in star formation events, which fixes the number of supernova (SN) events. These massive stars heat up the surrounding gas particles through stellar winds and radiation (Stinson et al., 2006). This type of feedback is referred to as "early stellar feedback", and it has been shown to be essential in order to reproduce galaxies that follow the correct scaling relations (Brook et al., 2012; Stinson et al., 2013). Later on, these massive stars explode as SN injecting energy and metals into the surrounding gas via shock waves as described in Stinson et al. (2006). In general, these SN events occur in high density environments where the details of the interstellar medium are not resolved, which leads to rapid over-cooling. In order to avoid this numerical issue, cooling is disabled within the blast-wave radius.
Besides the heating through early stellar feedback and SNe feedback, the gas particles are also heated by a redshift dependent UV background (Haardt & Madau, 2012).
The metals injected to the ISM via SN (type II and type Ia) follow the classical yields from the literature (Thielemann et al. 1986 for SNe Ia and Woosley & Weaver 1995 for type II SNe) and their diffusion through the ISM is described in Shen et al. (2010).
For each galaxy the resolution has been set to resolve the mass profile down to the of the virial radius (Wang et al., 2015), in order to resolve it inside the galaxy half -light radius, which is typically of that order of magnitude (see Kravtsov, 2013). The galaxies from NIHAO are central isolated galaxies (this is a requirement for the zoom-in technique, see Wang et al., 2015) that agree with the abundance matching predictions from Moster et al. (2013).
2.2 Galaxy selection
Our sample is a collection of simulated dwarf galaxies, all in isolation, with stellar masses lower than and effective radii larger than . We have checked that the selected galaxies are all well resolved, having at least stellar particles each. With this selection the low-surface brightness nature of these galaxies is ensured; in practice, we are only selecting objects with effective surface brightness lower than , where is defined as :
| (1) |
being the sun’s absolute magnitude; half the total luminosity of the galaxy (i.e. the luminosity enclosed inside an effective radius), and the circularized effective radius. Both the effective radius and the effective surface brightness have been computed in -band and in face-on projection111We define face-on projection as the inclination at which the vector of the stellar angular momentum is parallel to the line of sight..
From the full sample of NIHAO galaxies, objects meet these criteria, and we further excluded one galaxy which visually appears to be undergoing a merger at .
We are therefore left with a final sample of simulated low surface brightness, ultra-diffuse galaxies. Note that the selection criteria used in this work is a less restrictive version of the one used in Di Cintio et al. (2017), that followed the original UDG definition of van Dokkum et al. (2015): in Di Cintio et al. (2017) the authors selected galaxies only up to , therefore leading to a smaller sample than what reported here.
In Fig. 1 we show the distribution of magnitude, effective radii and effective surface brightness for the full NIHAO sample (white histograms) and for the UDG-like galaxies (red histograms).
3 Rotation or pressure supported UDGs
3.1 Stellar kinematic Maps
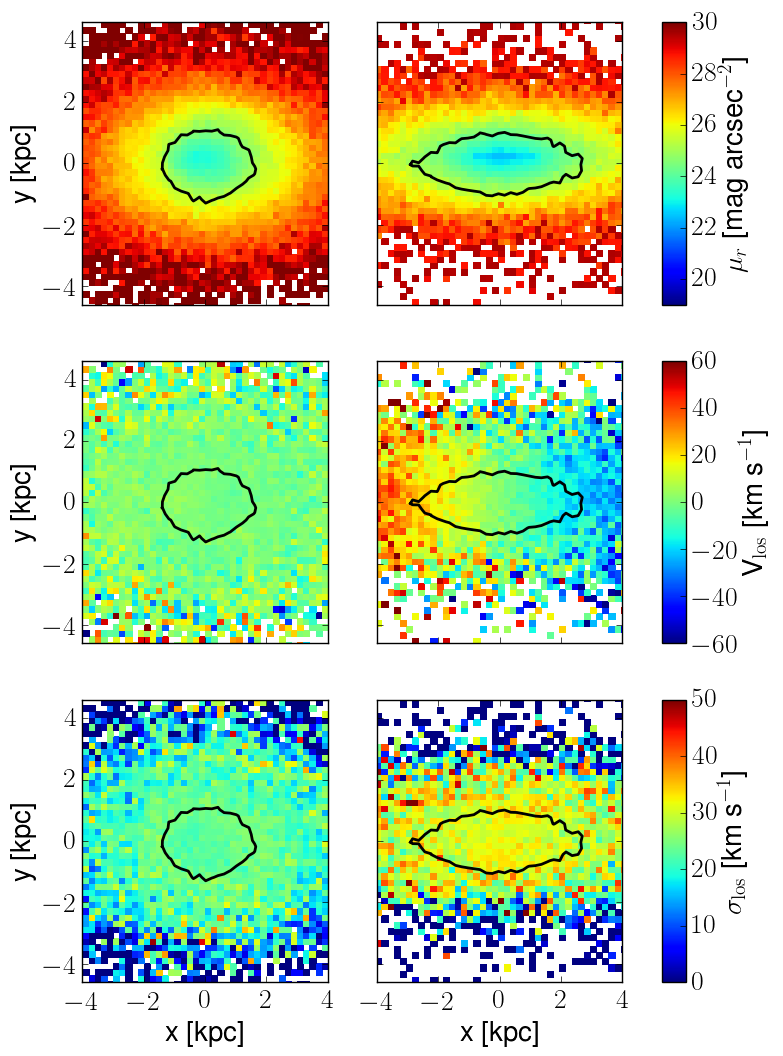
To characterize the stellar kinematic of our sample of UDGs, we have constructed maps of stellar flux, line-of-sight velocity and velocity dispersion for each galaxy at different projections, from edge-on view (i.e. stellar angular momentum perpendicular to the los velocity) to face-on view (i.e. stellar angular momentum parallel to the los velocity) in steps of . These maps have been constructed using an homogeneous grid with square bins of side of kpc.
The flux of each bin is the sum of the flux of all the star particles within it. The fluxes have been computed using the python module pynbody, which uses the Padova’s library of isochrones of single stellar populations222http://stev.oapd.inaf.it/cgi-bin/cmd inferred from Girardi et al. (2010) and Marigo et al. (2008). The line of sight velocity, , and velocity dispersion, , are the mean and standard deviation of the velocities of the stellar particles within the bin:
| (2) |
where is the number of particles inside the -th bin and is the line-of-sight velocity of the -th particle in the -th bin.
In Fig. 2 we present an example of maps constructed with this method for two of the UDG galaxies in our sample, shown edge-on. The black lines represent the isophote that encloses the same area as a circle with radius equal to Reff: we will use the stars within such isophotes to compute the stellar kinematic properties.
It can be appreciated how the galaxy on the right shows a clear rotation component while the galaxy on the left is essentially dispersion-supported. Indeed, as we will quantify in the next Section, within our simulated UDGs we found examples of both rotation as well as dispersion supported systems.
3.2 Rotation vs Dispersion support of the stellar component
In order to quantify the rotation of the UDGs stellar component, we use two parameters, namely and .
The projected specific angular momentum, , is defined as follows (see Emsellem et al., 2007):
| (3) |
where is the projected distance of each bin to the galaxy center and denotes the flux weighted average over the galaxy map. The dependence of from the physical distance to the center makes this parameter dependent on the aperture used: we follow the prescription of Cappellari et al. (2007) and limit the summation to the isophote that encloses the same area as a circle with radius equal to the effective radius, i.e. .
Furthermore, we also use the classical criteria for rotation, where is the los velocity dispersion inside a circular aperture of half effective radius (see Binney, 2005) and is the maximum los velocity inside the isophote defined above. We decided to use this aperture limit to compute in order to avoid more external bins with less star particles, insufficient statistics and therefore unrealistic values of .
It is common to study the rotation support of a galaxy as a function of its shape. For this, we have computed the mean ellipticity as proposed by Cappellari et al. (2007):
| (4) |
where , , are the flux and the distance of the -th bin to the galactic center along the minor and major axes respectively, and the calculation has been performed using only particles within the isophote defined above.
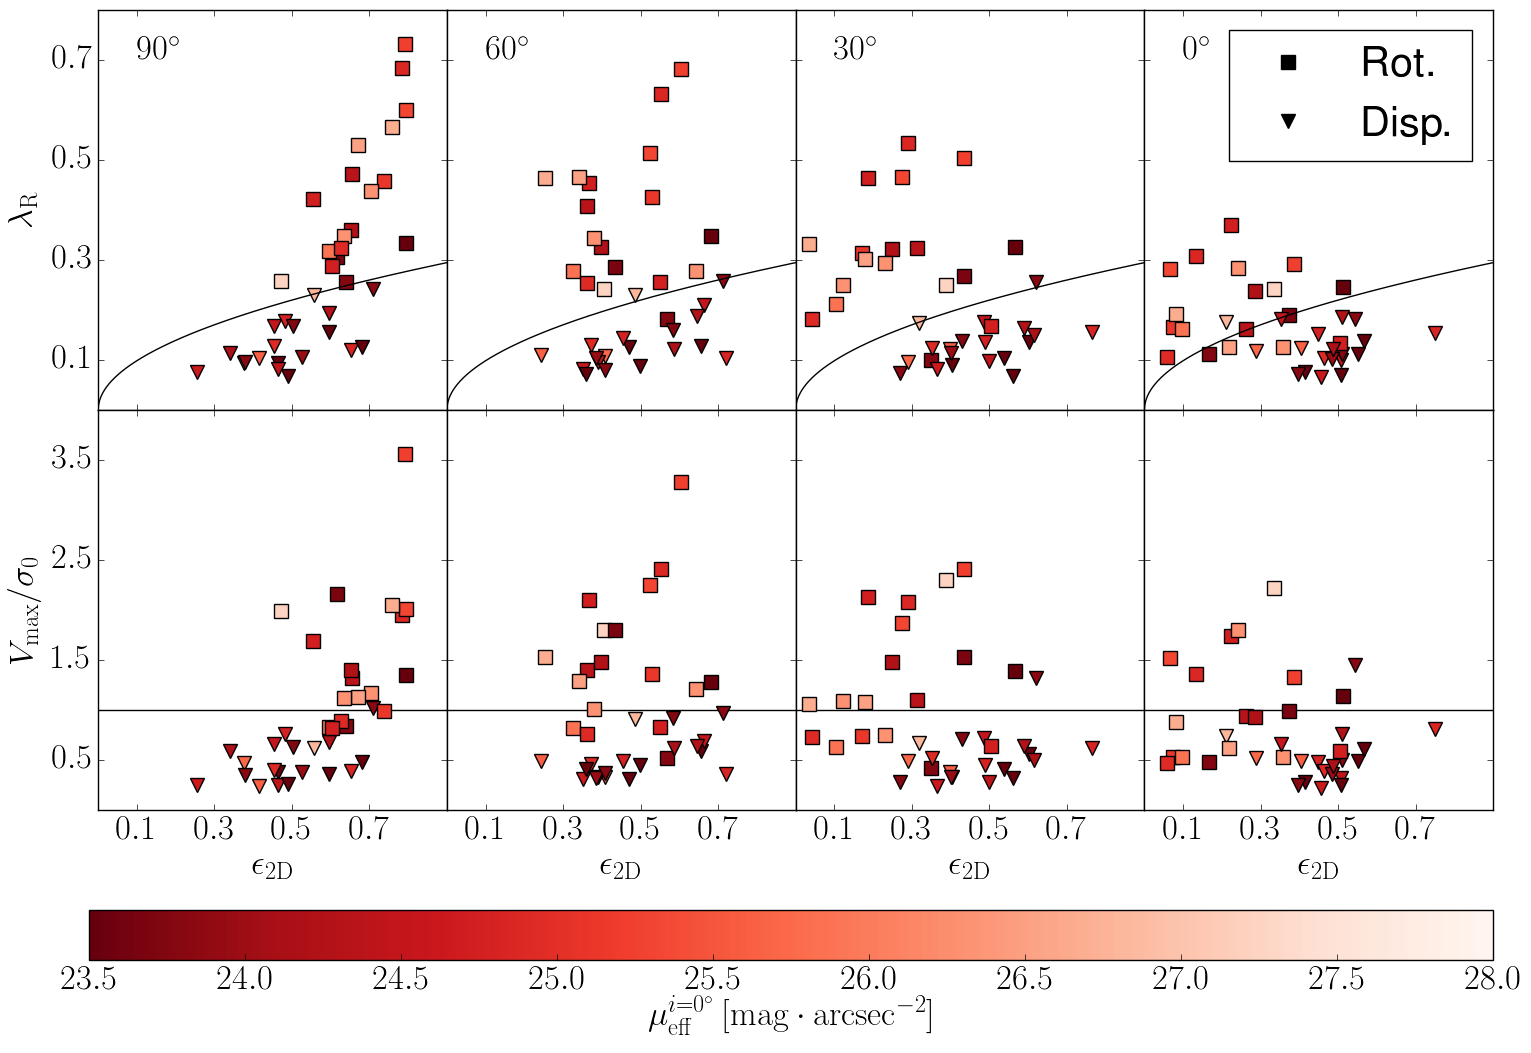
In order to distinguish between rotation and dispersion supported systems we have followed Emsellem et al. (2011), being those galaxies with rotation supported systems, while those with lower dispersion supported ones. Since this criterion has been calibrated for more massive galaxies, we have compared such a selection with a visual inspection of the kinematic maps of our galaxies, finding a reasonable match.
In Fig. 3 we show the and planes for our sample of UDGs at different projections, from edge-on view to face-on view (left to right panels), color coded by the effective surface brightness in face-on configuration. The black solid lines () split rotation (above the line) vs dispersion (below the line) dominated galaxies, although we note that our simulated UDGs follow a continuous distribution from dispersion to rotation supported systems, rather than showing two distinct populations.
As it can be seen in Fig. 3 comparing the top and bottom panels, both methods provide similar results: a high value of corresponds to a high value of , and the evident correlation between the amount of rotation and the ellipticity of a galaxy vanishes when we move from edge-on to face-on projection.
The most reliable measurement of the galaxy rotation is the one made in edge-on projection: using this configuration as a proxy for the intrinsic rotation, we found that out of the simulated UDGs are rotation supported systems (). Rotation supported UDGs seem to be disky-like galaxies with large ellipticities when seen edge-on () but much lower when seen face-on ().
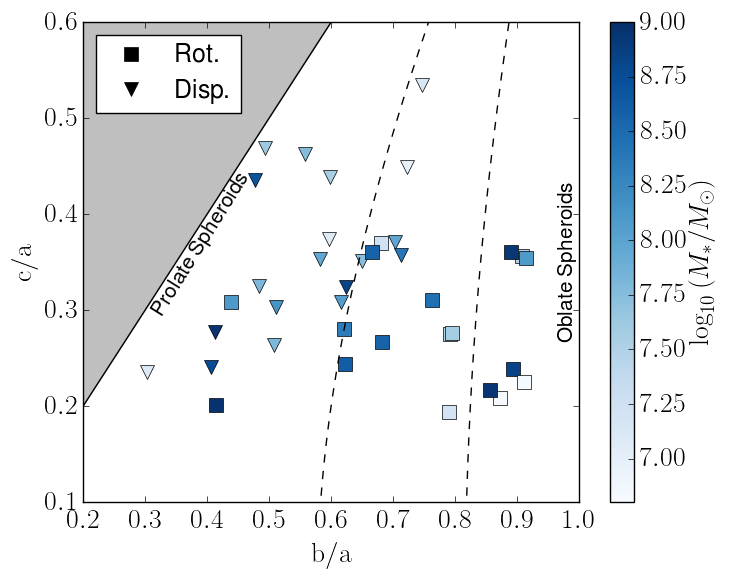
Regarding dispersion supported UDGs, we note that their ellipticity, which is always different form zero, appears to be more or less constant with the inclination: this can only be explained if those galaxies are triaxial or even prolate spheroids.
We have checked this by computing the axes ratios of our sample, shown in Fig. 4. There, dispersion supported galaxies are indicated as triangles while rotation supported ones as squares, and the color code refers to their stellar mass. We start by selecting a spherical aperture of radius equal to the half light radius of the galaxy and computing the flux weighted inertia tensor of the stars; we then use such eigenvalues to define new axes ratios and we keep iterating until the variation in the semi-axes is smaller than pc. The dashed lines show fixed values of the triaxiality parameter, defined as , such that from left to right we move from prolate to oblate objects, while in-between values are completely triaxial galaxies.
In the dwarf regime the galaxies tend to be triaxial (Sánchez Almeida & Filho, 2019; Putko et al., 2019; Roychowdhury et al., 2013) and, as can be seen in Fig. 4, UDGs are not an exception. In general, Fig. 4 highlights the relation between the morphologies of these galaxies and the kinematical support of their stellar population, being the dispersion supported UDGs very triaxial or prolate spheroids, while rotation supported UDGs are more oblate galaxies.
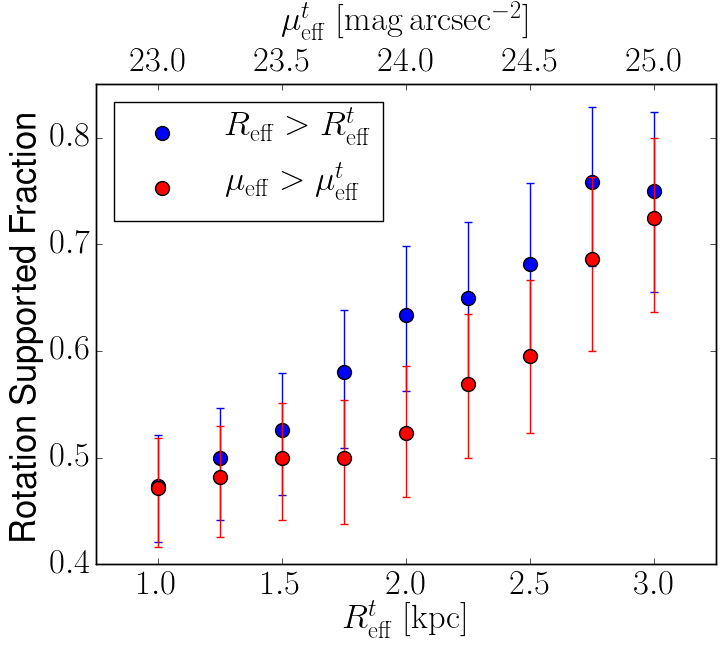
As we stated before, with our selection criteria, half of our UDGs ( out of ) can be classified as intrinsic rotation supported (i.e. in edge-on). We would now like to compute the expected fraction of rotation (or dispersion) supported UDGs assuming random orientations. To do so, we firstly generated inclinations for each of our galaxies, in order to obtain galaxies with different viewing angles. We have taken into account the fact that because of projection effects some UDGs do not meet our selection criteria (i.e. ). From this sample, we then randomly selected galaxies and compute the fraction of rotation vs. dispersion supported objects, and we repeated the procedure times. Thus, if the NIHAO UDGs are a representative sample of the population of field UDGs we predict that an observational survey will find a fraction of rotationally supported UDGs.
We are also interested in exploring how different selection criteria will affect this fraction. As is shown in Fig 5, selecting more diffuse galaxies, either filtering by larger effective radius (e.g. Koda et al. 2015 select galaxies with kpc) or by higher surface brightness, will bias the sample towards larger fraction of rotationally supported UDGs. As an example, using in our sample a selection criteria of kpc ( mag arcsec-2) will lead to a rotation supported fraction of (). In Fig. 5 the point that corresponds to our selection criteria is kpc which gives a value of fraction of rotation supported galaxies.
3.3 Gas fraction and halo spin
In this section we are going to explore the difference in the physical properties of UDGs as a function of their kinematical support; in particular, we will study their HI gas fraction, stellar mass and halo spin, to investigate how these quantities correlate with the parameter.
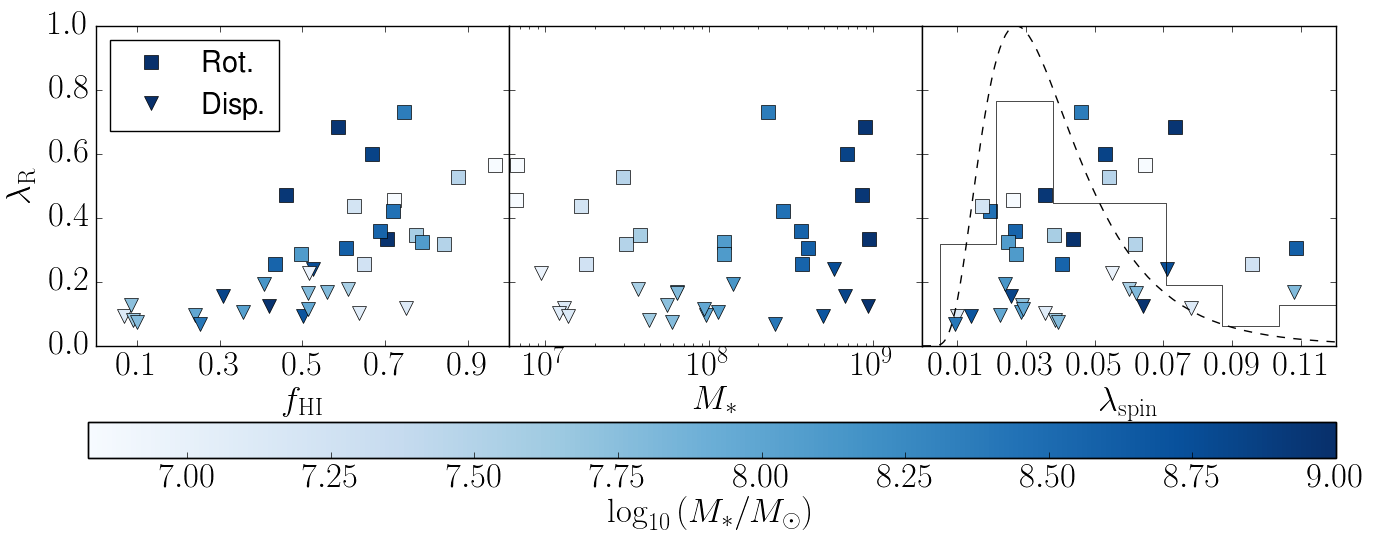
In the left panel of Fig. 6 we present the rotation parameter vs the HI gas fraction, , for dispersion supported (inverted triangles) and rotation supported (squares) UDGs. While it was already shown in Di Cintio et al. (2017) that NIHAO UDGs are on average HI gas rich galaxies, here we further demonstrate that rotation supported UDGs are the HI rich-most galaxies, with a median HI fraction of , while dispersion supported UDGs, despite having on average , present a tail in HI fraction distribution that extends towards HI poor galaxies.
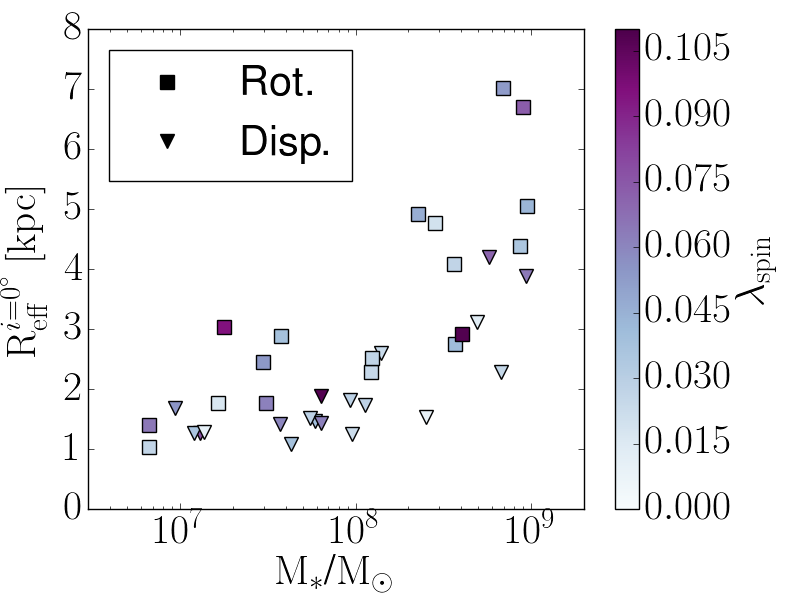
In the central panel of Fig. 6 we explore the possibility that the stellar kinematical properties of UDGs depend on their stellar mass: we found no appreciable differences between the two populations, being both rotation and dispersion supported UDGs present at every stellar mass considered here. Nevertheless we note, as expected, that at fixed stellar mass rotation supported galaxies have a larger effective radius than dispersion supported ones, as depicted in Fig. 7. On the other hand, this plot also explains the behaviour shown in Fig 5. When using a larger effective radius as a selection criteria, we are removing a large fraction of dispersion supported galaxies (independently of their inclination) and we are left with intrinsically rotation supported ones.
We remind that, as shown in Di Cintio et al. (2014), the stellar mass range (107) is where SN-driven core formation processes are most efficient, and that these processes of expansion have been shown to be a viable formation mechanism for forming field UDGs. However, it seems that the contribution of SN feedback plays only a secondary role in generating differences in the stellar kinematic distribution of rotation and dispersion supported UDGs. Despite the fact that all of these galaxies undergo through strong supernova feedback, some of them end up being dispersion and some other rotation supported systems, and we will explore in the next Section which is the mechanism responsible for this.
Finally, we explored the possibility that rotationally supported galaxies live in high-spin haloes, by representing the parameter as a function of the dark matter halo spin (Bullock et al., 2001), in the right-side panel of Fig. 6. The has been obtained using the equivalent dark matter only simulations. We see no differences between the rotation supported galaxies and dispersion supported ones in their halo spin distribution. Moreover, for both populations, the spin distribution follows the expected distribution from CDM cosmology 333We verified this by performing a Kolmogorov-Smirnov test., shown as solid and dashed histograms, respectively: this means that our UDGs do not live into high-spin haloes, as proposed by Amorisco & Loeb (2016), even thought this seems to be the case for more massive low-surface brightness galaxies, which show a clear correlation between their and (see Di Cintio et al., 2019).
3.4 Origin of the two kinematically distinct populations
In this section we explore the evolution of NIHAO UDGs to determine the conditions that lead to their different stellar kinematics.
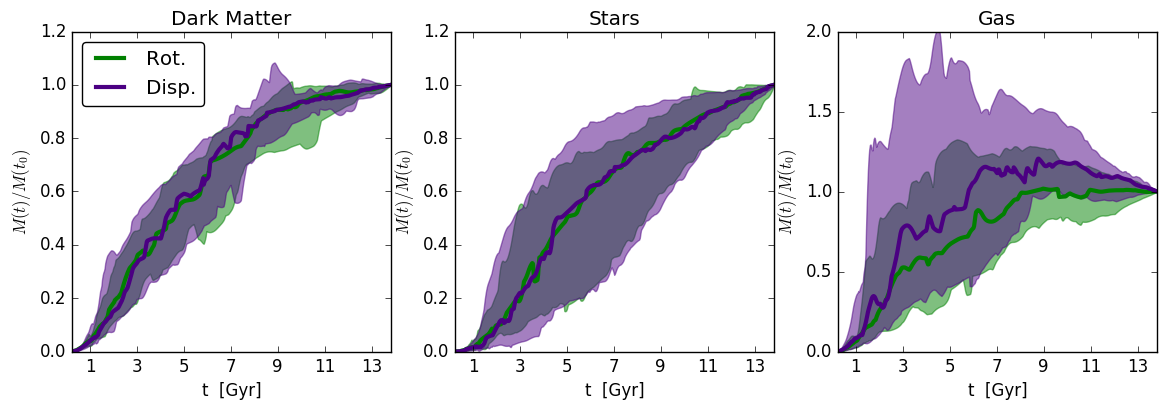
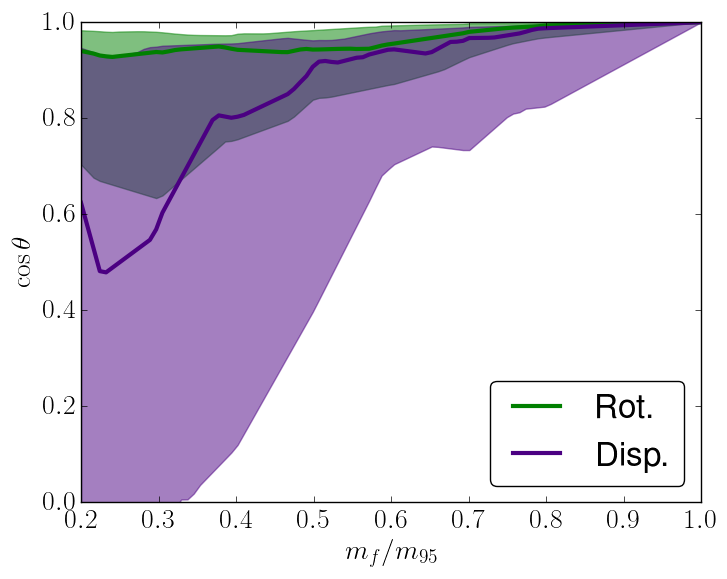
First we focus on the galaxies’ mass accretion history in Fig. 8, where we show, from left to right, the dark matter halo, stellar mass and gas mass accretion over cosmic time. We indicated rotation supported systems in green and dispersion supported ones in violet, and show the normalized mass accretion to its z=0 value (i.e. ). As shown in the two left-most panels of Fig. 8, there is no difference between the dark matter and the stellar mass accretion histories of the two populations: both rotation and dispersion supported systems form at a similar time, specifically their half mass formation time is about t4 Gyrs for their dark matter haloes and t5 Gyrs for their stellar mass.
Nevertheless, it can be appreciated in the gas accretion history (right panel of Fig. 8) that the dispersion supported population acquires on average its gas mass earlier than the rotation supported population, and that by t6 Gyrs its total gas mass has already reached its value at z=0: that is, the dispersion supported UDGs accrete gas mass fast and they then decrease it via strong outflows driven by SNae feedback. The large variation in the gas accretion history of the dispersion supported population is dominated by the less HI-gas rich galaxies (): these galaxies have early gas injections, a consequently initial burst of star formation, and then evolve passively loosing its gas due to strong stellar feedback.
We found that rotation supported UDGs retain a factor of 1.5 to 2 times more baryons than dispersion supported ones, taking into account the dependence of baryon fraction on total mass. Moreover, the gas in the dispersion supported UDGs is mostly in hot-warm phase: indeed, we verified that in the dispersion supported cases, the temperature of the gas is hotter than the one of the rotationally supported galaxies at z=0, by about K at 10 kpc (and as we go to outer radii the temperature difference increases even more), a sign of the chaotic state of the gas in these systems. In addition, as we saw in Fig 6, dispersion supported UDGs have almost an order of magnitude less HI gas than rotation ones. We summarize the results of average baryonic, HI and total mass in Table 1.
| Rotation Supported | Dispersion Supported | |
|---|---|---|
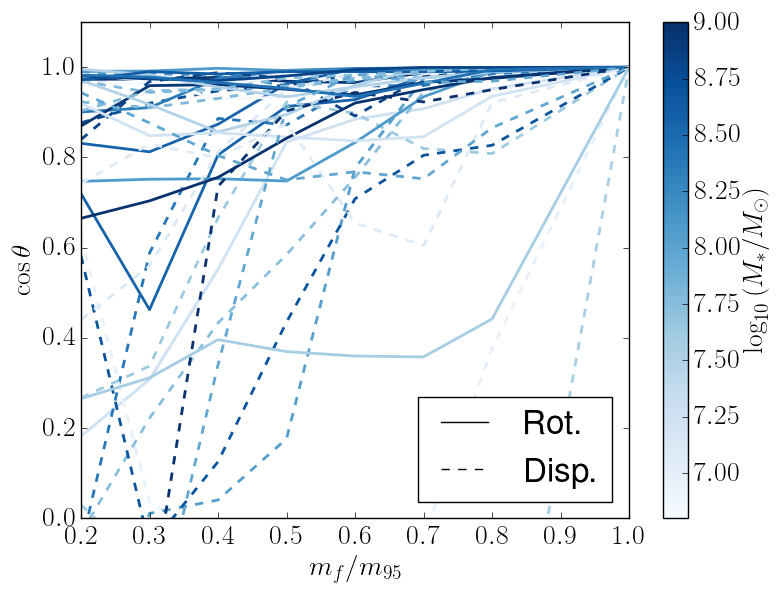
To further investigate the link between gas accretion and the final kinematic state of the stars, we explore the alignment of such accretion. For more massive systems it has already been shown that the orientation of the baryons at early times tightly correlates with the morphology of the galaxy at =0 (see Sales et al. 2012 and references therein). Here, we followed the same procedure described in Di Cintio et al. (2019): we first identify all the cold gas and star particles that belong to the galaxy at , we then trace them back to the redshift of half stellar formation time of the galaxy, and we finally compute the angular momentum of this baryonic component in spherical shells that enclose different percentages of the baryonic mass (, where is the percent of the mass). The largest shell we have considered encloses the of the tracked-back baryonic mass. The alignment is then defined as the angle between the angular momentum of each shell and the angular momentum of the most massive shell, at the galaxy’s half-stellar mass formation time:
| (5) |
In Fig. 9 we show the alignment of the different accreting shells for all our NIHAO UDGs. We can clearly see that the rotation supported UDGs have their infalling baryons already well aligned with the angular momentum of the proto-galaxy at half stellar mass formation time, which means that during the accretion process the baryons keep adding angular momentum to the proto-galaxy, eventually forming the rotation supported stellar component. The dispersion supported UDGs, instead, experience a more chaotic gas accretion: such mis-aligned gas build-up will lead to a dispersion supported stellar system.
We would like to remark that both kinematic groups experience strong SNae feedback, which is indeed the main formation mechanism for UDGs in our simulations; the signatures of aligned vs. chaotic gas accretion at early times, however, are still visible in the UDGs stellar kinematics today. In other words, the memory of the past ordered gas accretion is retained in nowadays stellar kinematic, implying that in general SNae feedback does not destroy the rotation acquired via aligned accretion of baryons.
4 Conclusions
In this work we have studied a simulated sample of Ultra Diffuse Galaxies (UDGs) from the NIHAO project with stellar masses between . This set of zoom-in simulations have already been shown to be able to create UDGs via supernova-feedback-driven gas outflows (e.g. Di Cintio et al., 2017) in galaxies with stellar mass lower than .
In order to study the stellar kinematics of these systems we have constructed line-of-sight stellar velocity and velocity dispersion maps (Fig. 2), and used the projected specific angular momentum of their stellar component, , to quantify their kinematical support: we found that our simulated UDGs are continuously distributed from dispersion to rotation supported systems (Fig. 3). We made a comprehensive study of the evolution of these systems to understand whether the different stellar kinematics arise from different evolutionary paths, and in doing so we defined a UDG to be rotationally supported if , where is the galaxy ellipticity (see also Emsellem
et al. 2011).
The results of this paper can be summarized as follows:
-
•
nearly half of our isolated simulated UDGs ( ) has a rotationally supported stellar disk, while the remaining UDGs show a dispersion dominated stellar component (Fig. 3);
-
•
the morphology of these galaxies is related to the kinematical support of their stellar population: the dispersion supported UDGs are triaxial or prolate spheroids, while rotation supported UDGs are more oblate (Fig. 4);
-
•
accounting for random inclinations effects, we expect that a future survey of field UDGs would be able to find about of these galaxies to be rotation supported when selecting them by effective radius larger than kpc, while more restrictive selection criteria will lead to larger fractions of rotation supported UDGs (Fig. 5);
- •
-
•
on average, simulated UDGs are HI rich galaxies, whose HI gas fraction correlates with their stellar kinematics, being the rotation supported UDGs the HI richest galaxies (Fig. 6);
-
•
dispersion supported UDGs have, by z=0, a factor of 2 lower baryon fraction and hotter gas within their virial radius, than rotation supported ones (Table 1);
-
•
the alignment of the infalling baryons at early times plays a fundamental role in determining the final kinematics of the stellar component of UDGs at z=0: galaxies that accrete their gas in an ordered manner will end up having rotation supported stellar disks, while mis-aligned accretion will result in dispersion supported UDGs (Fig. 9).
The importance of the alignment of accreted gas in determining the formation of a rotating disk is in agreement with previous results that focused on more massive galaxies (see Sales et al. 2012; Di Cintio et al. 2019 and references therein).
We remark that all our UDGs in the stellar mass range of go through strong outflows via SN feedback, which is the main formation mechanism of UDGs in our simulations, as presented in Di Cintio et al. (2017). However ,we should also note that some UDGs approach the transition regime () between feedback-dominated and angular-momentum-dominated formation scenarios for NIHAO low surface brightnes galaxies (see Di Cintio et al., 2019). Indeed, about of the UDGs presented in the current manuscript are in between the two ranges, such that the combined effect of SN feedback and aligned acccretion of gas can be expected to play a substantial role in forming them. In any case we show here that feedback is not strong enough to destroy the ordered rotation of the stellar component, which indeed retains its memory of the way the baryons have fallen into the protogalaxy. The aligned accretion of baryons at early times translates into an additional angular momentum in the baryonic component, which give rise to even larger stellar distributions (Fig. 7) and defines the resulting morphology of the galaxy (Fig. 4).
5 Acknowledgements
We thank the anonymous referee for their useful report. This research was carried out on the High Performance Computing resources at New York University Abu Dhabi (UAE) and at the LaPalma supercomputer (Spain). We made use of the programming language Python444https://www.python.org/. Data analysis was partially performed using the module pynbody (Pontzen et al., 2013). We thank Ignacio Trujillo for fruitful discussions. SCB is supported by a FPI MINECO studentship. ADC acknowledges financial support from a MSCIF grant, H2020-MSCA-IF-2016 Grant agreement 748213, DIGESTIVO. CBB thanks MINECO/FEDER grant AYA2015-63810-P and the Ramon y Cajal fellowship program. JFB and MAB acknowledges support through the RAVET project by the grant AYA2016-77237-C3-1-P from the Spanish MCIU. MAB gratefully acknowledges support from the Severo Ochoa excellence pro-gramme (SEV-2015-0548) TRL acknowledges financial support through the grants (AEI/FEDER,UE) AYA2017-89076-P, AYA2016-77237-C3-1-P, and AYA2015-63810-P, as well as MCIU, through the State Budget, and MCIU Juan de la Cierva - Formación grant (FJCI-2016-30342). JFB, TRL and MAB are grateful to the Consejería de Economía, Industria, Comercio y Conocimiento of the Canary Islands Autonomous Community, through the Regional Budget (including IAC project TRACES).
6 DATA AVAILABILITY
The data underlying this article will be shared on reasonable request to the corresponding author.
References
- Amorisco & Loeb (2016) Amorisco N. C., Loeb A., 2016, MNRAS, 459, L51
- Baushev (2018) Baushev A. N., 2018, New Astron., 60, 69
- Beasley & Trujillo (2016) Beasley M. A., Trujillo I., 2016, ApJ, 830, 23
- Beasley et al. (2016) Beasley M. A., Romanowsky A. J., Pota V., Navarro I. M., Martinez Delgado D., Neyer F., Deich A. L., 2016, ApJ, 819, L20
- Binney (2005) Binney J., 2005, MNRAS, 363, 937
- Bothun et al. (1985) Bothun G. D., Beers T. C., Mould J. R., Huchra J. P., 1985, AJ, 90, 2487
- Bothun et al. (1987) Bothun G. D., Impey C. D., Malin D. F., Mould J. R., 1987, AJ, 94, 23
- Bothun et al. (1997) Bothun G., Impey C., McGaugh S., 1997, PASP, 109, 745
- Brook et al. (2012) Brook C. B., Stinson G., Gibson B. K., Wadsley J., Quinn T., 2012, MNRAS, 424, 1275
- Bullock et al. (2001) Bullock J. S., Dekel A., Kolatt T. S., Kravtsov A. V., Klypin A. A., Porciani C., Primack J. R., 2001, ApJ, 555, 240
- Cappellari et al. (2007) Cappellari M., et al., 2007, MNRAS, 379, 418
- Carleton et al. (2018) Carleton T., Cooper M., Kaplinghat M., Errani R., Penarrubia J., 2018, in American Astronomical Society Meeting Abstracts #231. p. 412.05
- Chabrier (2003) Chabrier G., 2003, PASP, 115, 763
- Chamba et al. (2020) Chamba N., Trujillo I., Knapen J. H., 2020, A&A, 633, L3
- Chan et al. (2018) Chan T. K., Kereš D., Wetzel A., Hopkins P. F., Faucher-Giguère C. A., El-Badry K., Garrison-Kimmel S., Boylan-Kolchin M., 2018, MNRAS, 478, 906
- Chilingarian et al. (2019) Chilingarian I. V., Afanasiev A. V., Grishin K. A., Fabricant D., Moran S., 2019, ApJ, 884, 79
- Collins et al. (2020) Collins M. L. M., Tollerud E. J., Rich R. M., Ibata R. A., Martin N. F., Chapman S. C., Gilbert K. M., Preston J., 2020, MNRAS, 491, 3496
- Deibel et al. (2011) Deibel A. T., Valluri M., Merritt D., 2011, ApJ, 728, 128
- Di Cintio et al. (2014) Di Cintio A., Brook C. B., Macciò A. V., Stinson G. S., Knebe A., Dutton A. A., Wadsley J., 2014, MNRAS, 437, 415
- Di Cintio et al. (2017) Di Cintio A., Brook C. B., Dutton A. A., Macciò A. V., Obreja A., Dekel A., 2017, MNRAS, 466, L1
- Di Cintio et al. (2019) Di Cintio A., Brook C. B., Macciò A. V., Dutton A. A., Cardona-Barrero S., 2019, MNRAS, 486, 2535
- Emsellem et al. (2007) Emsellem E., et al., 2007, MNRAS, 379, 401
- Emsellem et al. (2011) Emsellem E., et al., 2011, MNRAS, 414, 888
- Emsellem et al. (2019) Emsellem E., et al., 2019, A&A, 625, A76
- Fliri & Trujillo (2016) Fliri J., Trujillo I., 2016, MNRAS, 456, 1359
- Gill et al. (2004) Gill S. P. D., Knebe A., Gibson B. K., 2004, MNRAS, 351, 399
- Giovanelli et al. (2005) Giovanelli R., et al., 2005, AJ, 130, 2598
- Girardi et al. (2010) Girardi L., et al., 2010, ApJ, 724, 1030
- Grand et al. (2017) Grand R. J. J., et al., 2017, MNRAS, 467, 179
- Haardt & Madau (2012) Haardt F., Madau P., 2012, ApJ, 746, 125
- Hopkins et al. (2014) Hopkins P. F., Kereš D., Oñorbe J., Faucher-Giguère C.-A., Quataert E., Murray N., Bullock J. S., 2014, MNRAS, 445, 581
- Impey et al. (1988) Impey C., Bothun G., Malin D., 1988, ApJ, 330, 634
- Jiang et al. (2019) Jiang F., Dekel A., Freundlich J., Romanowsky A. J., Dutton A. A., Macciò A. V., Di Cintio A., 2019, MNRAS, 487, 5272
- Knollmann & Knebe (2009) Knollmann S. R., Knebe A., 2009, ApJS, 182, 608
- Koda et al. (2015) Koda J., Yagi M., Yamanoi H., Komiyama Y., 2015, ApJ, 807, L2
- Kravtsov (2013) Kravtsov A. V., 2013, ApJ, 764, L31
- Leisman et al. (2017) Leisman L., et al., 2017, ApJ, 842, 133
- Liao et al. (2019) Liao S., et al., 2019, MNRAS, 490, 5182
- Mancera Piña et al. (2018) Mancera Piña P. E., Peletier R. F., Aguerri J. A. L., Venhola A., Trager S., Choque Challapa N., 2018, MNRAS, 481, 4381
- Mancera Piña et al. (2019) Mancera Piña P. E., et al., 2019, ApJ, 883, L33
- Marigo et al. (2008) Marigo P., Girardi L., Bressan A., Groenewegen M. A. T., Silva L., Granato G. L., 2008, A&A, 482, 883
- Martínez-Delgado et al. (2010) Martínez-Delgado D., et al., 2010, AJ, 140, 962
- Martínez-Delgado et al. (2016) Martínez-Delgado D., et al., 2016, AJ, 151, 96
- Merritt et al. (2014) Merritt A., van Dokkum P., Abraham R., 2014, ApJ, 787, L37
- Mihos et al. (2005) Mihos J. C., Harding P., Feldmeier J., Morrison H., 2005, ApJ, 631, L41
- Moster et al. (2013) Moster B. P., Naab T., White S. D. M., 2013, MNRAS, 428, 3121
- Muñoz et al. (2015) Muñoz R. P., et al., 2015, ApJ, 813, L15
- Planck Collaboration et al. (2014) Planck Collaboration et al., 2014, A&A, 571, A16
- Pontzen et al. (2013) Pontzen A., Roškar R., Stinson G. S., Woods R., Reed D. M., Coles J., Quinn T. R., 2013, pynbody: Astrophysics Simulation Analysis for Python
- Prole et al. (2019) Prole D. J., van der Burg R. F. J., Hilker M., Davies J. I., 2019, MNRAS, 488, 2143
- Putko et al. (2019) Putko J., Sánchez Almeida J., Muñoz-Tuñón C., Asensio Ramos A., Elmegreen B. G., Elmegreen D. M., 2019, ApJ, 883, 10
- Román & Trujillo (2017a) Román J., Trujillo I., 2017a, MNRAS, 468, 703
- Román & Trujillo (2017b) Román J., Trujillo I., 2017b, MNRAS, 468, 4039
- Román et al. (2019) Román J., Beasley M. A., Ruiz-Lara T., Valls-Gabaud D., 2019, MNRAS, 486, 823
- Rong et al. (2017) Rong Y., Guo Q., Gao L., Liao S., Xie L., Puzia T. H., Sun S., Pan J., 2017, MNRAS, 470, 4231
- Roychowdhury et al. (2013) Roychowdhury S., Chengalur J. N., Karachentsev I. D., Kaisina E. I., 2013, MNRAS, 436, L104
- Ruiz-Lara et al. (2018) Ruiz-Lara T., et al., 2018, MNRAS, 478, 2034
- Ruiz-Lara et al. (2019) Ruiz-Lara T., et al., 2019, MNRAS, 486, 5670
- Sales et al. (2012) Sales L. V., Navarro J. F., Theuns T., Schaye J., White S. D. M., Frenk C. S., Crain R. A., Dalla Vecchia C., 2012, MNRAS, 423, 1544
- Sales et al. (2020) Sales L. V., Navarro J. F., Peñafiel L., Peng E. W., Lim S., Hernquist L., 2020, MNRAS,
- Sánchez Almeida & Filho (2019) Sánchez Almeida J., Filho M., 2019, Research Notes of the American Astronomical Society, 3, 191
- Schombert & Bothun (1988) Schombert J. M., Bothun G. D., 1988, AJ, 95, 1389
- Sengupta et al. (2019) Sengupta C., Scott T. C., Chung A., Wong O. I., 2019, MNRAS, 488, 3222
- Shen et al. (2010) Shen S., Wadsley J., Stinson G., 2010, MNRAS, 407, 1581
- Spekkens & Karunakaran (2018) Spekkens K., Karunakaran A., 2018, ApJ, 855, 28
- Stinson et al. (2006) Stinson G., Seth A., Katz N., Wadsley J., Governato F., Quinn T., 2006, MNRAS, 373, 1074
- Stinson et al. (2013) Stinson G. S., Brook C., Macciò A. V., Wadsley J., Quinn T. R., Couchman H. M. P., 2013, MNRAS, 428, 129
- Thielemann et al. (1986) Thielemann F. K., Nomoto K., Yokoi K., 1986, A&A, 158, 17
- Toloba et al. (2018) Toloba E., et al., 2018, ApJ, 856, L31
- Tremmel et al. (2019) Tremmel M., Wright A. C., Brooks A. M., Munshi F., Nagai D., Quinn T. R., 2019, arXiv e-prints, p. arXiv:1908.05684
- Tremmel et al. (2020) Tremmel M., Wright A., Brooks A., Munshi F., Nagai D., Quinn T., 2020, in American Astronomical Society Meeting Abstracts. American Astronomical Society Meeting Abstracts. p. 316.02
- Trujillo & Fliri (2016) Trujillo I., Fliri J., 2016, ApJ, 823, 123
- Trujillo et al. (2017) Trujillo I., Roman J., Filho M., Sánchez Almeida J., 2017, ApJ, 836, 191
- Trujillo et al. (2019) Trujillo I., et al., 2019, MNRAS, 486, 1192
- Trujillo et al. (2020) Trujillo I., Chamba N., Knapen J. H., 2020, MNRAS, 493, 87
- Wadsley et al. (2017) Wadsley J. W., Keller B. W., Quinn T. R., 2017, MNRAS, 471, 2357
- Wang et al. (2015) Wang L., Dutton A. A., Stinson G. S., Macciò A. V., Penzo C., Kang X., Keller B. W., Wadsley J., 2015, MNRAS, 454, 83
- Woosley & Weaver (1995) Woosley S. E., Weaver T. A., 1995, ApJS, 101, 181
- Yagi et al. (2016) Yagi M., Koda J., Komiyama Y., Yamanoi H., 2016, ApJS, 225, 11
- Yozin & Bekki (2015) Yozin C., Bekki K., 2015, MNRAS, 452, 937
- de Blok et al. (1996) de Blok W. J. G., McGaugh S. S., van der Hulst J. M., 1996, MNRAS, 283, 18
- van Dokkum et al. (2015) van Dokkum P. G., Abraham R., Merritt A., Zhang J., Geha M., Conroy C., 2015, ApJ, 798, L45
- van Dokkum et al. (2018) van Dokkum P., et al., 2018, Nature, 555, 629
- van Dokkum et al. (2019) van Dokkum P., et al., 2019, ApJ, 880, 91
- van der Burg et al. (2016) van der Burg R. F. J., Muzzin A., Hoekstra H., 2016, A&A, 590, A20