Detecting the Cosmic Web: Ly Emission from Simulated Filaments at z=3
Abstract
The standard cosmological model (CDM) predicts the existence of the cosmic web: a distribution of matter into sheets and filaments connecting massive halos. However, observational evidence has been elusive due to the low surface brightness levels of the filaments. Recent deep MUSE/VLT data and upcoming observations offer a promising avenue for Ly detection, motivating the development of modern theoretical predictions. We use hydrodynamical cosmological simulations run with the AREPO code to investigate the potential detectability of large-scale filaments, excluding contributions from the halos embedded in them. We focus on filaments connecting massive () halos at , and compare different simulation resolutions, feedback levels, and mock image pixel sizes. We find increasing simulation resolution does not substantially improve detectability notwithstanding the intrinsic enhancement of internal filament structure. By contrast, for a MUSE integration of 31 hours, including feedback increases the detectable area by a factor of on average compared with simulations without feedback, implying that even the non-bound components of the filaments have substantial sensitivity to feedback. Degrading the image resolution from the native MUSE scale of per pixel to apertures has the strongest effect, increasing the detectable area by a median factor of 200 and is most effective when the size of the pixel roughly matches the width of the filament. Finally, we find the majority of Ly emission is due to electron impact collisional excitations, as opposed to radiative recombination.
keywords:
large-scale structure of the Universe – intergalactic medium – diffuse radiation –methods: numerical1 Introduction
Cosmological simulations have long suggested the presence of diffuse filaments of both dark and baryonic matter between galaxies (Peebles and Groth, 1975; Klypin and Shandarin, 1983; Haider et al., 2016; Mandelker et al., 2019). However, it is only recently that the contribution of the cosmic web to galactic evolution has been fully appreciated. Specifically, at z2, the primary mode of gas accretion for massive galaxies may be through streams of cold ( K) gas that feed the dark matter halo from cosmic web filaments (Furlanetto et al., 2003; Katz et al., 2003; Keres et al., 2005; Dekel and Birnboim, 2006; Ocvirk et al., 2008; Dekel et al., 2009; van de Voort et al., 2011; Nelson et al., 2016).
The low density of the filaments prohibits star formation, making observation extremely challenging. However, Ly emission originating from the diffuse gas in the filaments is theoretically predicted (Hogan and Weymann, 1987; Gould and Weinberg, 1996; Cantalupo et al., 2005; Laursen et al., 2009; Faucher-Giguere et al., 2010; Goerdt et al., 2012; Rosdahl and Blaizot, 2012). If the only source of ionizing radiation is the UV background, which Bolton et al. (2005) and Faucher-Giguere et al. (2008) find to have a hydrogen photoionization rate at z=3 (), respectively, the Ly emission from filaments is expected to be faint, on the order of SB for optically thick clouds. This is well below most modern detection limits and accounts for the large number of non-detections reported (Lowenthal et al., 1990; Martinez-Gonzalez et al., 1995; Cantalupo et al., 2005; Rauch et al., 2008). The difficulty of detection towards lower redshifts is exacerbated by the expansion of the universe, which stretches the filaments, decreasing their density, and towards higher redshifts by the higher degree of homogeneity and less pronounced features of the cosmic web.
Even in a new era of deeper observations, a statistically robust sample of detections remains elusive. Gallego et al. (2018) stack 390 subcubes of the deepest MUSE/VLT data (30 hrs of exposure, reaching a 2 surface brightness levels of in an aperture of 6.25 Å) oriented according to the positions of Ly emitters and their neighbors. They find no detectable Ly emission in the intergalactic medium.
However, when gaseous filaments are illuminated by more energetic sources such as quasars, the Ly signal is boosted and detection is made easier. Recently, Ly blobs have been detected around several high-redshift quasars (Martin et al., 2014; Cantalupo et al., 2014; Swinbank et al., 2015; Borisova et al., 2016; Kikuta et al., 2019). These blobs may extend out to several hundred physical kpc and well beyond the virial radius of the host halo, suggesting that they are instead tracing the filaments of the cosmic web. When the quasars illuminating the gas are clustered, even larger extended Ly nebulae (ELANe) have been detected (Hennawi et al., 2015; Battaia et al., 2018). A recent observation of filamentary Ly structures between two quasars has signaled that this technique is effective for detecting more extended gaseous filaments (Battaia et al., 2019). Feedback from other energy sources, such as star formation and supermassive black hole activity may also illuminate the gas surrounding these sources above the detection threshold (Umehata et al., 2019).
Simulations have also indicated that the Ly emission induced by the ultraviolet background is too faint to be currently detectable. For example, Kollmeier et al. (2010) predict that only Ly emission from gas illuminated from energetic sources such as quasars should be detectable like the Ly blobs mentioned above (see also Cantalupo et al. (2005)). Rosdahl and Blaizot (2012) investigate the detectability of extended Ly emission using cosmological zoom simulations and find that the Ly luminosity is concentrated in the central 20 of the halo radius, making detection even more difficult. However, others are more optimistic. Bertone and Schaye (2012); Corlies et al. (2018); Smith et al. (2019) model Ly radiative transfer in large cosmological hydrodynamical simulations to predict features of the Ly emission line arising from gas in the IGM and find that MUSE and future projects such as the Square Kilometer Array (SKA) (Kooistra et al., 2019),the James Webb Space Telescope and CETUS Probe Mission (Hull et al., 2018) should be able to detect the brightest filaments.
In preparation for this upcoming observational revolution, our paper aims to investigate detectability of Ly emission from cold gas filaments using large volume cosmological hydrodynamical simulations. In Section 2.1 we detail the simulations used, in Section 2.2 we describe the Ly emission processes, in Section 3 we focus on sources of Ly emission, in Section 4 we present our main results by investigating the effects of resolution, feedback, and pixel size on the detectability of gaseous filaments, and in Section 5 we state the conclusions of the project.
2 Methods
2.1 Simulations and Halo Selection
| Simulations | ||||||
|---|---|---|---|---|---|---|
| Name | Volume | Particle | Feedback | mDM | mgas | Softening length |
| [(cMpc/h)3] | Number | [] | [] | [ckpc/h] | ||
| L17n1024NF | 173 | No | 0.39 | |||
| L17n512NF | 173 | No | 0.78 | |||
| L25n1024NF | 253 | No | 0.5 | |||
| L25n512NF | 253 | No | 1 | |||
| L25n1024TNG | 253 | Yes | 0.5 | |||
| L25n512TNG | 253 | Yes | 1 | |||
Six main simulations were used for the analysis and are described in Table 1. The simulations vary in resolution, volume, and feedback implementation. They are run with the moving mesh code arepo (Springel, 2010), and are consistent with WMAP-9 standard cosmology, with =0.2726, =0.0456, =0.7274, and =70.4km/s/Mpc (Hinshaw et al., 2013). Gas cooling and heating as well as star-formation follow the prescriptions given in Vogelsberger et al. (2012) and Pillepich et al. (2018), for simulations without and with feedback, respectively. In all simulations, gas above a density threshold of follows an equation of state that is used to implicitly treat the multiphase structure of the ISM (Springel and Hernquist, 2003). Cold and dense gas above this threshold becomes eligible for star formation with a timescale that depends on the local density. In the simulations used in this analysis that include stellar and supermassive black hole feedback, denoted by ’TNG’ in the simulation name, it is implemented as in IllustrisTNG (Weinberger et al., 2017; Pillepich et al., 2018). Groups are identified based only on particle positions using the Friends of Friends algorithm.
For our analysis, we choose to focus on the 12 most massive halos in the large-volume, high-resolution simulation (L25n1024NF) and the 4 most massive halos in the small-volume, high-resolution simulation (L17n1024NF) for a total of 16 halos. All halos are analyzed at redshift . We focus on these massive halos, which span a virial mass range of , reasoning that larger halos may be more likely to reside in larger filaments.
2.2 Modeling Ly Emission
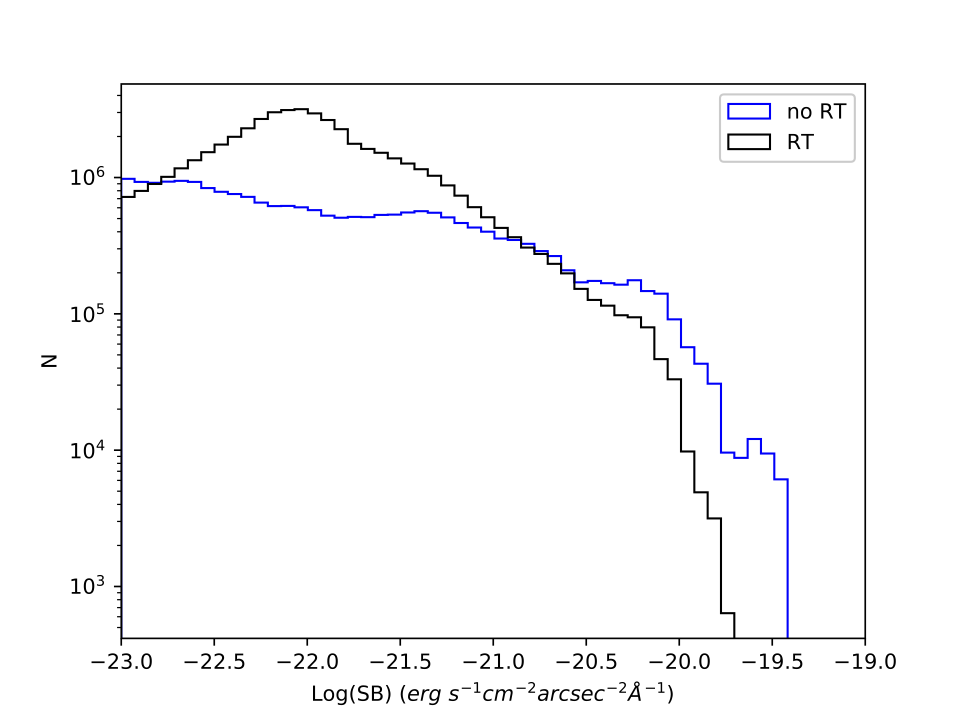
Ly emission can originate from two main processes: electron impact collisional excitation and radiative recombination. We assume the optically-thin limit as we are interested in detections from diffuse filaments outside of halos. In particular, we do not consider resonant scattering or dust absorption of the Ly photons. One might expect this scattering to smear out bright spots in our simulated Lya maps, reducing their intensity. We have explored this possibility by performing radiative transfer on a test box of side length 1.25Mpc centered on the most massive halo in the simulations. The results of this validation test are summarized in Appendix A. In the case of 5.3" pixels, we find the impact of scattering to be relatively modest. The brightest pixels are reduced in intensity by a factor of 2.
Ly photons are emitted following electron impact excitation of neutral hydrogen atoms at a rate per unit volume () given by
| (1) |
where is the collisional excitation rate coefficient, and and are the electron and neutral hydrogen volume number densities respectively. We adopt (Dijkstra, 2017) where is the gas temperature in Kelvin, =10.19 eV is the energy of the Ly transition, and is the Boltzmann constant.
For radiative recombination we assume the optically thin case A, for which the Ly emission rate per unit volume is
| (2) |
where is the effective Ly case A recombination coefficient, is the proton volume number density and is the electron volume number density. For Ly emission, where is the total case A recombination coefficient for HII and is the fraction of recombination that results in emission of a Ly photon. We adopt from Hui and Gnedin (1997),
| (3) |
where , and from Dijkstra (2017),
| (4) |
Eq. 4 is a fit to a non-analytic expression of frec for Case A that is valid out to T=4 K (see Eq.15 in Dijkstra (2017)). Therefore, beyond this temperature we adopt a constant .
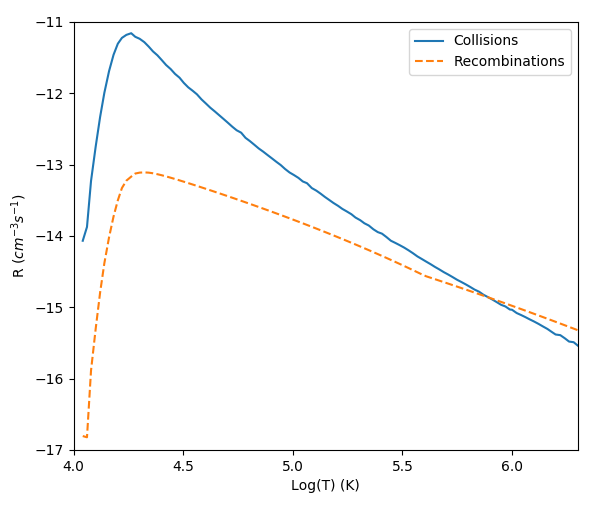
The temperature dependence of collisional and recombination emissivity is shown in Fig. 1 assuming the hydrogen is in collisional ionization equilibrium and ignoring photoionization (e.g Gnat and Sternberg (2007)). At higher temperatures, the gas becomes completely ionized and recombinations dominate, while at low temperatures the neutral fraction increases and collisional excitation dominates. The total Ly luminosity from every simulation gas cell (without photoionizations), in units of , equals , where is the volume of the cell.
2.3 Image Generation
To create our final surface brightness images of filaments we first remove any particles identified by FoF to be within a halo, both to avoid regions that are expected to be optically-thick and because we do not resolve the multi-phase structure of the interstellar medium inside galaxies. Since we are focused on exploring the detection of the cosmic web outside of dark matter halos, this excision is not expected to affect our results.
We then cut out a comoving region ( in physical units) centered on each halo. In the ‘line of sight’ direction (which we arbitrarily choose to be the complete z axis of the simulation box) we make a velocity-based cut such that only gas cells with galacto-centric velocities in a range of km are included. This velocity range is chosen to be consistent with the narrow band wavelength width of the images in Gallego et al. (2018), which are composed of 5 stacked voxels, each of width 1.25 Å to reach a total wavelength width of Å. We convert the wavelength width into a velocity range via Eq. 5:
| (5) |
where c is the speed of light, is the wavelength width of the stacked image, and is the Ly rest wavelength. This volume shows the extent of the filaments while not being so large so as to increase the likelihood of contamination from other massive centrals.
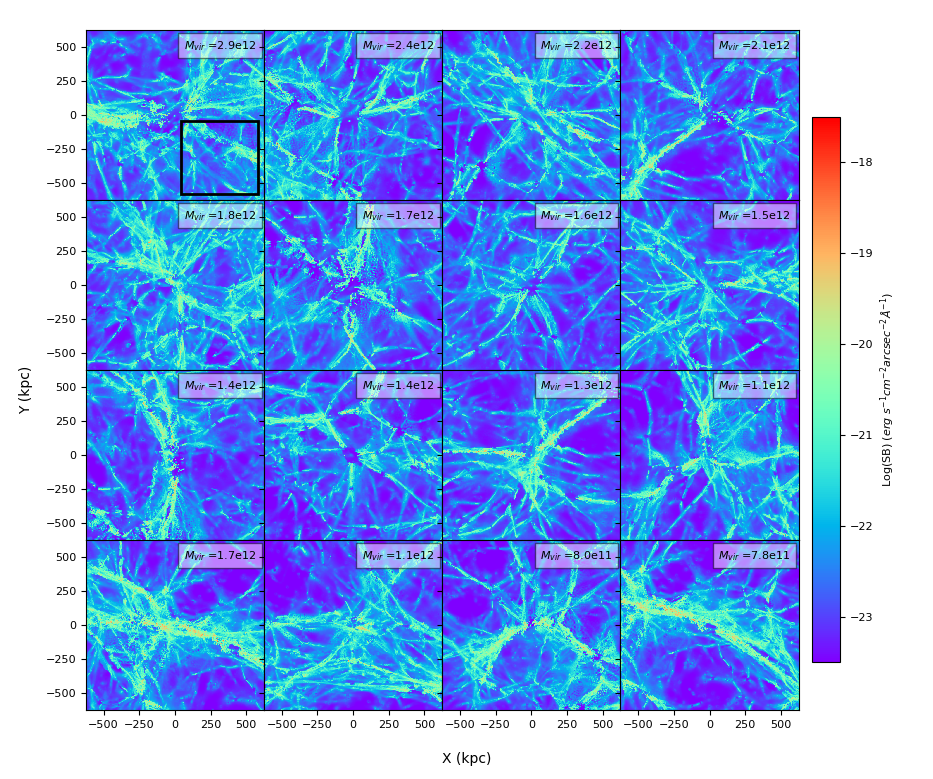
Since we have removed subhalos from our analysis, all surface brightnesses reported here are lower limits for detection. We create maps of Ly surface brightness (Fig. 3) by summing the Ly signal along the 6.25Å width in the spectral or z direction and dividing by 6.25Å so as to obtain an averaged flux density in units of .
Finally, in order to account for the numerical effects of particle resolution, we use the smoothing code swiftsimio111https://pypi.org/project/swiftsimio/ to smooth the gas particles with a 2D Wendland C2 kernel whose FWHM is equal to the distance to the 15th nearest neighboring gas particle. We choose 15 for the number of neighbors as it is the typical number of faces of a Voronoi cell given a pseudo-random distribution of mesh-generating points in 3D. To test the validity of this choice, we also try smoothing with kernel FWHM values equal to the distance to the 30th and 60th neighbor. We find that the results are converged, and therefore adopt the distance to 15th nearest neighbor as the FWHM of the smoothing kernel for the remainder of the analysis.
2.4 Detection Limit
MUSE is a panoramic, integral-field spectograph currently operating on the Very Large Telescope (VLT) of the European Southern Observatory (ESO). The MUSE Hubble Ultra Deep Field survey includes an ultra deep, 30.8 hour exposure of a 1.15 arcmin2 field. The field has a propagated noise standard deviation of for a sampling voxel. In Wide Field Mode, MUSE has a spatial sampling of 0.2"0.2" and a spectral line resolution of 1.25Å. (Bacon et al., 2017)222Note the inconsistency between the values shown in Figures 18 and 19 of Bacon et al. (2017), which is a result of an incorrect conversion of the raw measurements shown in Figure 18 into the quantity shown in Figure 19 (Bacon R., private communication). In this work, we use only the width of the histogram shown in their Figure 18 to derive the appropriate surface brightness limit directly from the pixel noise.. Voxels in our analysis have the same area as the sampling voxels, but a spectral line width of 6.25Å (consistent with Gallego et al. (2018)). To obtain the surface brightness limit for our voxels, we first convert the noise to units of :
Our voxels have the equivalent depth of 5 Wide Field Mode sampling voxels. Since noise scales as the square root of the number of voxels, the noise for a single voxel of area 0.2"0.2" and depth 6.25Å level is:
| (6) | ||||
Finally we convert this value to units of surface brightness. Our surface brightness detection limit for a Wide Field Mode sampling voxel at the 5 level is:
| (7) | ||||
3 Results: Sources of Ly
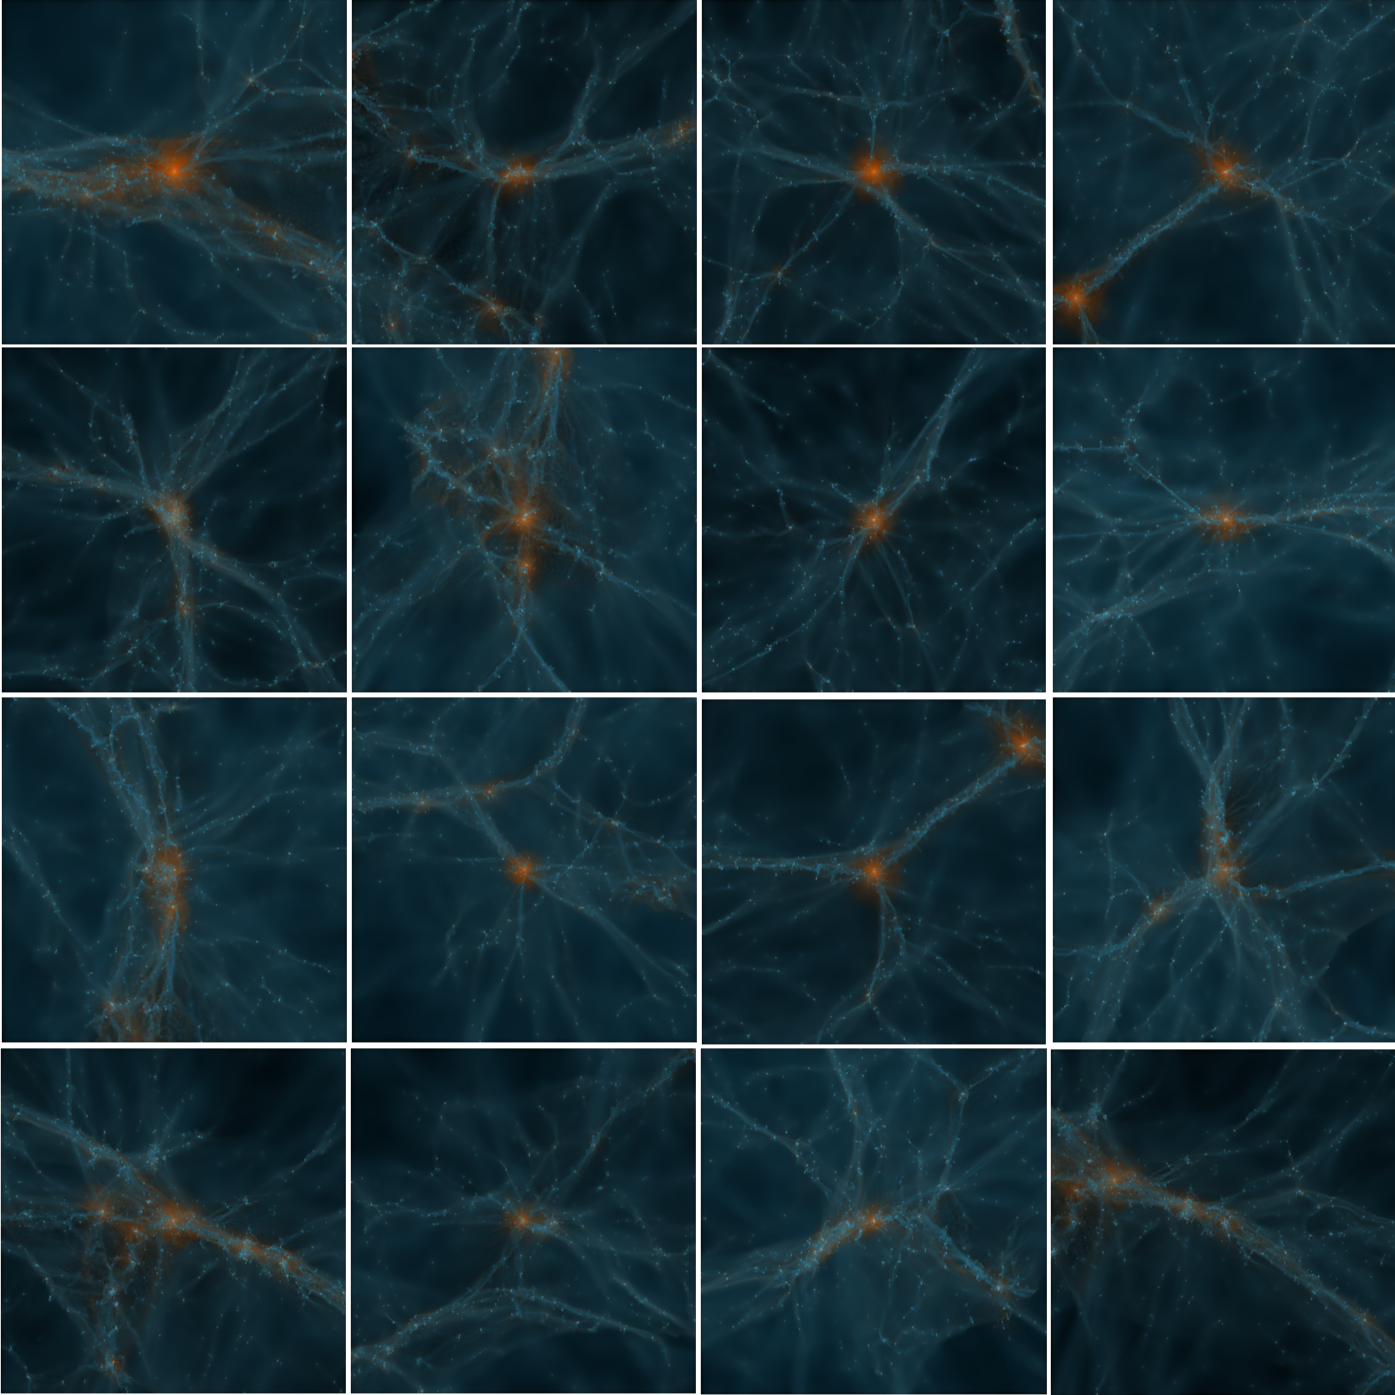
Images of the halos in temperature and density are shown in Fig. 2, and in total Ly surface brightness in Fig. 3. The areas of high density (shown in light blue) in Fig. 2 correspond to the highest Ly emission in Fig. 3. Areas of high temperature (shown in orange) in Fig. 2 are mostly confined to halos which are excised in Fig. 3 and thereafter, as described in Section 2.2.
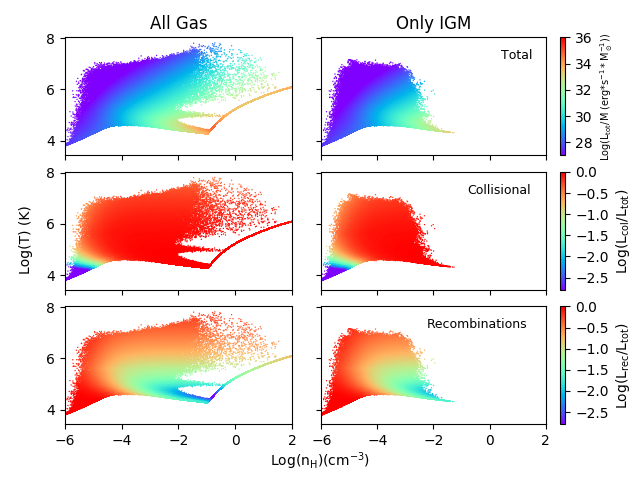
To explore the dependence of the total Ly luminosity on the physical conditions of the gas and discern the contributions of collisional excitation vs. recombination, we investigate the phase diagram of the gas within the spatial and velocity bounds mentioned above. Since in this context the results are essentially invariant between different halos, we focus here on the most massive halo, the one that is shown in the top left panel of Fig. 2 and Fig. 3. We begin with Fig. 4, which presents the intrinsic dependence of the luminosity on density and temperature irrespective of the actual mass distribution of gas in the phase diagram. The left column was created including subhalos while for the right column the subhalos have been excised. The color in the first row indicates the total Ly emission (from both processes) per unit mass as a function of gas density and temperature. The second row is colored by the fraction of total emission due to collisional excitation, and the third by the fraction of total emission due to recombinations. Until this point we have assumed collisional ionization equilibrium, which only considers collision and recombination processes. The luminosity from both is only dependent on temperature. However, in the simulation, photoionizations are also possible, which creates an implicit dependence of ionization fraction on density. The ionization fraction of the gas decreases with density and increases with temperature, reducing and increasing and . This relation is reflected in Fig. 4 which shows recombination dominating the total emission at low densities and high temperatures, while the contribution of collisional excitation is largest at low temperatures. Above almost all emission is due to collisional excitation . 333The ‘tail’ feature in the plots in the left column reflects the polytropic equation of state assumed in the simulations to prevent artificial fragmentation at high densities (Springel and Hernquist, 2003).
From Fig. 4 alone, it is impossible to tell which process is responsible for the majority of total emission that is potentially detectable, since it presents the luminosity per unit mass.
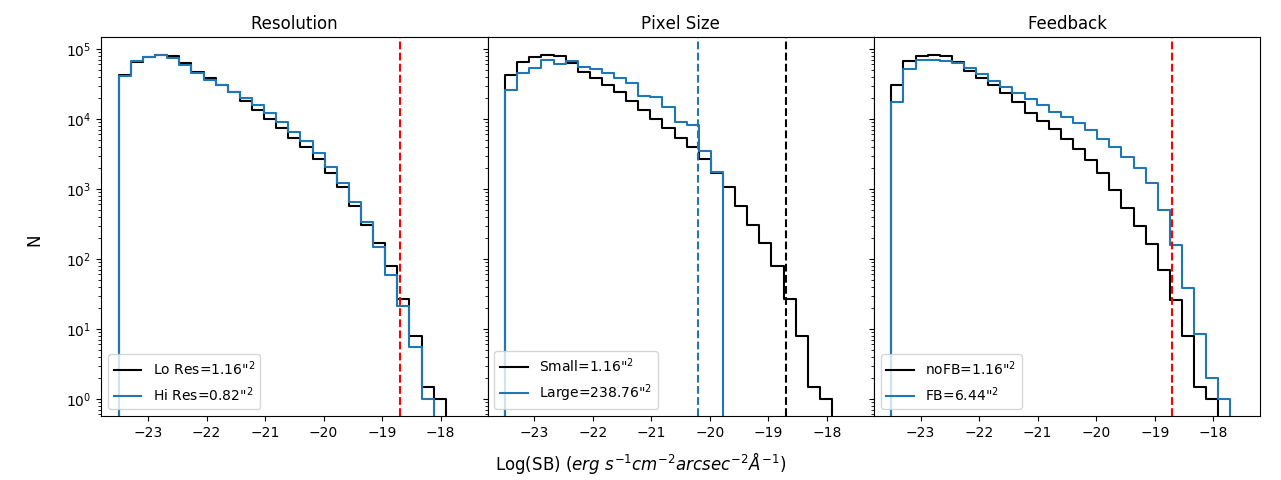
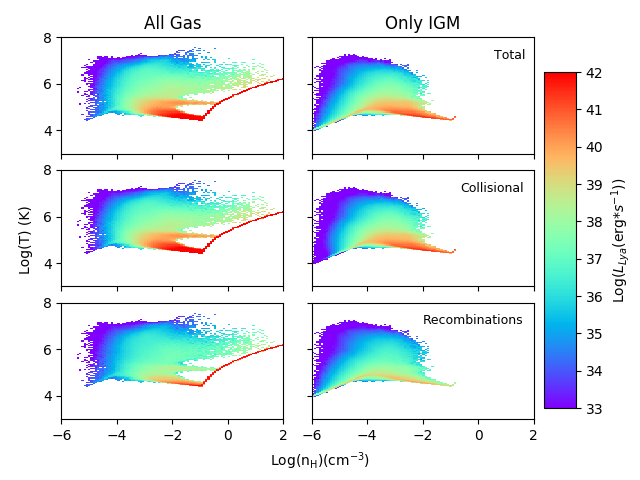
Fig. 5 addresses this by showing the distributions in phase space of total, collisional excitation, and recombination emission (from top to bottom), averaged over all 16 halos in Fig. 2 and Fig. 3. The resulting areas of high and low emission are a reflection of both the luminosity per unit mass and the mass distribution on the phase diagram.Fig. 5 clearly shows the largest total amount of Ly emission is due to gas with temperature below K and density above . At these temperatures and densities, collisional excitation dominates over recombination (see Fig. 4, second row). Although detection of Ly emission is dependent on the spatial distribution of the gas, our results suggest that collisional excitation is a more likely source of detectable emission than recombination. In fact, it is responsible for 95 of the total emission, on average, assuming no additional sources of photoionization. 444We note that this result is unchanged whether the analysis is performed with data from the low- or high-resolution simulation.
4 Results: Improving Detectability
We now focus on the detectability of the gaseous filaments surrounding massive halos with the MUSE instrument. We describe the effect of varying simulation resolution (Section 4.1), pixel resolution (Section 4.2), and feedback models (Section 4.3) in order to optimize detection.
4.1 Simulation Resolution
A natural step towards boosting the signal is to increase the resolution of the simulation to reveal substructure within the filaments. Since the emissivity scales as density squared, small variations of the gas in phase space could be amplified in Ly emission. Gas at higher densities will increase the total Ly emission, making the filament more detectable.
To quantify the expected signal boost, the left panel of Fig. 6 compares the median distribution of total Ly surface brightness per pixel for all 16 halos from the low (black) and high (blue) resolution simulations with no feedback (L25n512NF and L25n1024NF, respectively). The red vertical line represents the MUSE detection limit, while the number in the bottom left corners represent the median combined angular area of pixels above the MUSE detection limit.
The size of the MUSE pixel is 1.5 kpc on a side - small enough to probe fine substructure. It is therefore surprising that at most surface brightness levels, the images created with higher resolution simulations are consistent with their low resolution counterparts, suggesting that any overdensities that are resolved by increasing resolution are not significant enough to boost the Ly surface brightness. Small differences occur between the two simulation resolutions at mid-range surface brightnesses (Log(SB)-21) and at the high surface brightness tail.In this regime, which represents the detectable pixels, the images created with a low resolution simulation have a factor of 1.5 more detectable area than images from the high resolution simulation, on average. The differences between the two resolutions are a numerical artefact of the low resolution creating dense ‘clumps’ of particles that are spread more continuously over neighboring pixels at higher resolution. The numerical effect is dependent on both pixel resolution and feedback, which will be discussed in Sec. 4.2 and Sec. 4.3, respectively. Observations, of course, are free from numerical resolution effects. Overall our findings suggest, somewhat counterintuitively, that the degree of substructure within the filaments is not a strong indicator of their detectability.
4.2 Pixel Resolution
Observationally, detecting filaments has proven difficult and has often relied on stacking techniques (Steidel et al., 2000; Matsuda et al., 2004, 2011). Stacking images containing filaments is challenging to do observationally because it requires the images to be stacked in such a way that the filaments align, but their geometry is not known a priori (e.g. Steidel et al., 2010). Gallego et al. (2018) attempt to overcome this limitation by using positions of nearby Ly galaxies and assuming they are connected by a filament to orient subcubes before stacking, but are not able to make a detection even with 390 ‘oriented’ stacks of MUSE data. They thus suggest that 2/3 of their cubes may not contain filaments.
We hence turn to a different image processing technique: pixel degradation. The effects of artificially resizing pixels on detectability have been addressed in similar contexts (see, e.g Bertone and Schaye, 2012; Hani et al., 2020). We note that Gallego et al. (2018) effectively use pixel degradation in their analysis by ’resampling’ so that the area of their pixels increases by a factor of two in order to avoid empty ones. Here we suggest a more extreme resampling. By decreasing the number of pixels in an image (effectively combining them), the number of Ly photons per pixel is increased, thus increasing the signal by a factor of , where is the factor by which the angular area of a pixel is increased, and the noise by a factor of , thereby increasing the signal-to-noise ratio by a factor of . The drawback to this technique is that the continuum of the sources needs to be removed to high accuracy, and of course the lost information on smaller substructures within the filaments. However, if our main aim is simply to detect a filament, degrading is sufficient for this purpose.
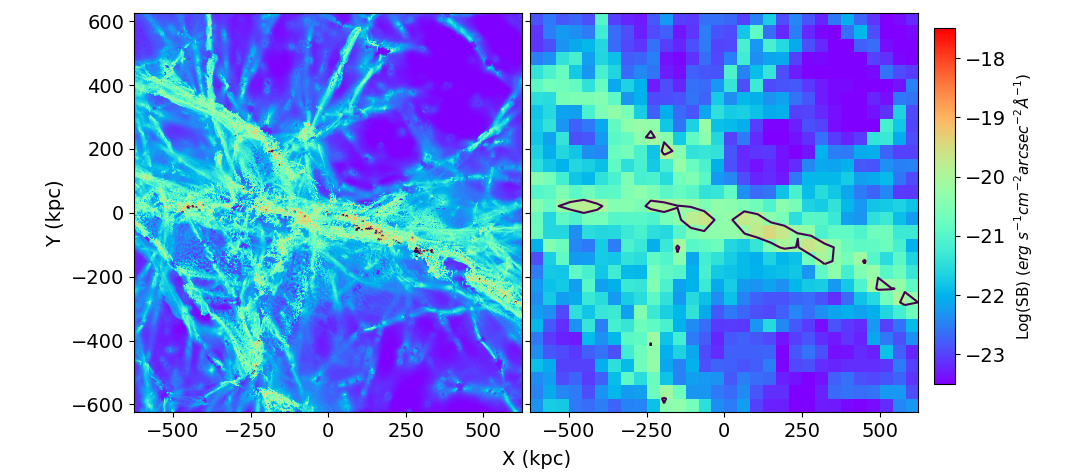
Fig. 7 shows an example for the results of the degrading technique. The area of each pixel in the right panel is larger than the area of each MUSE-like pixel in the left panel. Changing the pixel size has also changed the detection limit, which scales as where n is the ratio of the area of the pixel to the area of a pixel of MUSE sampling size. Several pixels are now above the threshold for detection by MUSE, and begin to delineate the filaments. For example, the filament that extends below the main horizontal one is now detected, whereas with the MUSE pixel size an observer would never have known of its presence. In order to maximize the effectiveness of this technique, the area of the pixel should be chosen to minimize contamination from nearby pixels with low S/N values. We have therefore chosen the size of pixel to roughly match the width of a typical filament (not the largest filament).
The middle panel of Fig. 6 better quantifies the effect of pixel degradation by binning the Ly luminosities in images of both pixel sizes. Blue and black histograms are derived from images of pixel area and , respectively, and dashed lines illustrate corresponding detection limits. The total detected image area is clearly greater when using large pixels. On average, the detectable area is over two orders of magnitude larger for the degraded images. However, in most cases, more pixels are detectable with a small pixel size. For example, for the second-most massive galaxy (top row, second from left galaxy in Fig. 3), only one large pixel is detected, compared to 4 small pixels. This suggests that either all of the small detected pixels are located in an area encompassed by the large detected pixel, or, far more likely, they are more spread out but the degree of degradation is too large, such that when they are combined with nearby pixels of lower luminosities, potentially located in a void, the signal is diluted. However, in most cases, such as for the halo in the bottom left of Fig. 3, combining pixels allows for a clear detection. In this case, instead of detecting many smaller pixels that may lie in several different filaments, pixel degradation facilitates detection of fewer, larger pixels that trace filaments more reliably. Our technique is not new, however, to our knowledge, this is the first time degrading to such an extent has been suggested for use on deep MUSE data.
4.3 Feedback
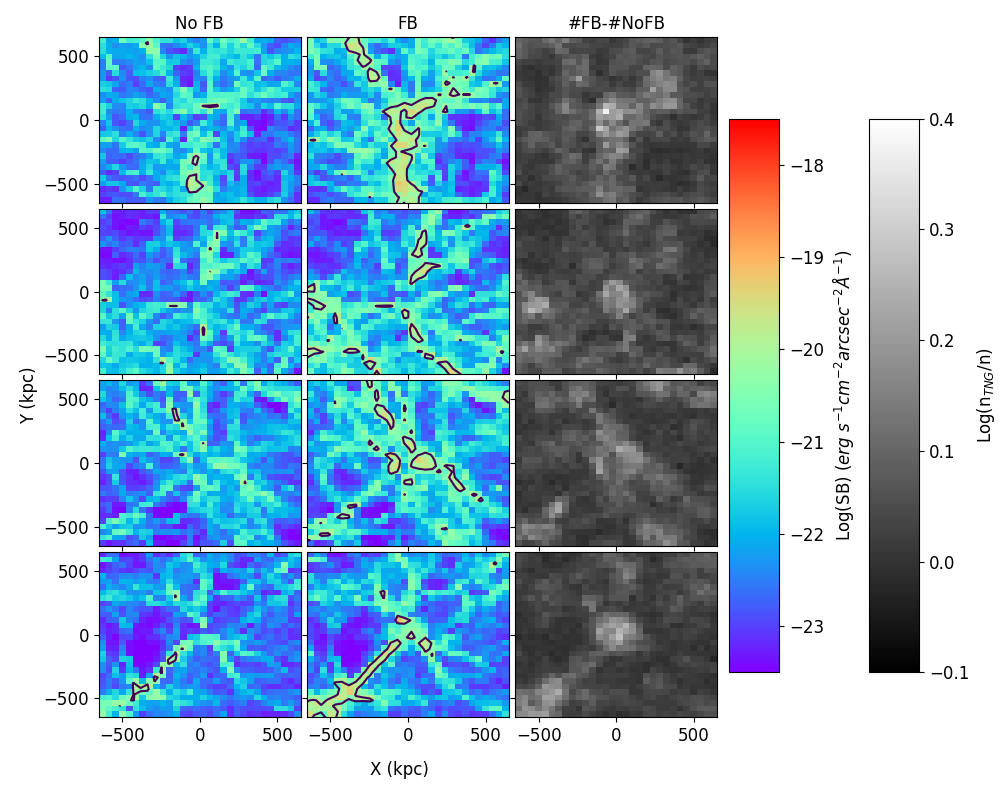
Until this point all results have been derived using simulations without feedback. We now investigate the effects of feedback on the detectability of filaments using the identical initial conditions but with supernovae and black hole feedback modeled in the same way as in IllustrisTNG. The right panel of Fig. 6 compares the average total Ly surface brightness histograms for the 12 halos from the low resolution, (25cMpc/h)3 box simulation with (blue, L25n512TNG) and without (black, L25n512NF) feedback. The four halos from the high resolution, (17cMpc/h)3 box are not included as we do not have available an equivalent simulation with feedback.
The right panel of Fig. 6 clearly demonstrates the strong effect of feedback on detectability. We find that feedback increases the number of detected pixels by a factor of 5.5 on average. That such a substantial signal boost should occur is not obvious. Black hole-driven winds have been shown to destroy galactic disks and other structures (Beckman et al., 2019; Grand et al., 2017). Gas filaments, which have low densities and are not bound, are especially susceptible to disruption through feedback processes. However, we find that the amount of gas that is blown out of the filaments due to feedback is negligible when compared with the amount of gas blown from the central halo into them.
Fig. 8 shows the increase in number of gas cells in each pixel between the feedback and no-feedback simulations, coupled with the effect of pixel degradation, for the four halos in the top row of Fig. 2 and Fig, 3. The third column illustrates the difference between the number of gas cells occupying each pixel in the images of the first and second columns. Boosts in number of gas cells (shown in white) are preferentially located along existing filaments, while voids experience almost no change. This is consistent with our understanding of the feedback model. Filaments are populated by small halos whose galactic winds travel at velocities that scale with local dark matter velocity dispersion (Pillepich et al., 2018). The wind velocities do not allow gas to easily escape their potential wells. Thus, most feedback is localized to the halo, while any gas that escapes the halo is not likely to have a high enough velocity to escape the filament. Therefore, although we excise the halos, traces of feedback are mostly confined to the filaments.
The TNG feedback model is so effective that filaments are detectable even at the MUSE pixel size. That we have not yet observed a filament with MUSE suggests that the model is ejecting too much gas from subhalos into filaments. One possible reason for this could be the speed of the galactic winds. The TNG feedback model relies on strong ejective feedback instead of preventative feedback to regulate gas. For low mass galaxies, the TNG model predominantly consists of galactic winds that are faster, warmer, and more efficient than the previous Illustris model (Pillepich et al., 2018). The speeds of the TNG galactic winds are fast enough to escape the halo, but not the filament it resides in, resulting in an excess of gas within the filaments. While this results in a better match to observational constraints such as galaxy size and stellar content at the low mass end, it may not lead to a realistic gas distribution at larger radii.
5 Conclusions
Our standard cosmological model, CDM, predicts that gas in the intergalactic medium is distributed in filaments linking massive halos. Furthermore, cosmological simulations suggest that these filaments trace underlying dark matter filaments that make up the cosmic web. Recombinations and collisional excitation processes result in faint Ly emission from the gaseous filaments, allowing for possible detection by deep imaging instruments such as MUSE. In this study we have used six simulations of differing resolutions and physics models to investigate the detectability of the filaments feeding 16 massive () halos at z=3 with the MUSE/VLT instrument. We summarize our findings below:
-
•
Assuming an optically thin limit, we map total Ly emission (collisional excitation and recombination) and find it correlates with the temperature and density of the filaments as expected. That is, collisional excitation (recombination) channels dominate at high (low) densities and low (high) temperatures.
-
•
The vast majority of the Ly emission from gas (excluding that in halos) is caused by collisional excitations which dominate in low temperature, high density regions. It is not entirely surprising that most emission arises from cool clumps instead of hot, ionized streams of gas. Furlanetto et al. (2005) find a similar domination of collisonal processes in a similar redshift, temperature, and density regime. Witstok et al. (2019) analyze Ly emission at z=5.76 using the Sherwood simulation suite and, assuming an optically thin limit, find that while collisional processes dominate in high density areas, recombinations dominate at lower densities common in filaments. Finally, Rosdahl and Blaizot (2012) compute Ly emission from filaments surrounding a halo of the same virial mass as the most massive halo in this study (2.9) and find that 95 of the total Ly emission is contributed through collisional channels. However, we note that their analysis focuses on the inner regions of the halo (r<rvir), thus excluding the gas from the long, extended filaments. Furthermore, we have removed any particles associated to any halo via subfind, while Rosdahl and Blaizot (2012) employ radiative transfer and self-shielding models to these regions. However, it is worth noting that for observations, additional sources of photoionization could enhance recombination emission, especially at large distances from dense subhalos.
-
•
Changing the resolution of the simulation does not result in a significant signal boost. This suggests that filaments with a higher degree of substructure will not be significantly more detectable.
-
•
By degrading the pixel resolution of the original mock image by a factor of in pixel area, the area of the image above the detection limit is boosted by a factor of on average. Although we have lost information about small scale structure we are easily able to detect diffuse gaseous filaments at to the 5 level.
-
•
Implementing feedback increases the detectable area by a factor of on average in filaments. Furthermore, the effect is focused along the filaments: gas is blown out from the halos lying along the filaments, increasing filament densities and thus boosting Ly emission. When combined with the effect of pixel degradation, filaments are clearly detected. Even using the MUSE pixel size, employing the TNG feedback model boosts a considerable number of pixels beyond the detection threshold, suggesting that filaments should be observable. The fact that we have not observed them yet indicates that the TNG model is most likely overpopulating the filaments with gas.
Acknowledgements
We would like to thank the referee for improving our work with their helpful comments and insights. This work was initiated as a project for the Kavli Summer Program in Astrophysics held at the Center for Computational Astrophysics of the Flatiron Institute in 2018. The program was co-funded by the Kavli Foundation and the Simons Foundation. We thank them for their generous support. AS thanks the German Science Foundation for support via DFG/DIP grant STE 1869/2-1 GE/625-17-1 at Tel Aviv University.
References
- Battaia et al. (2018) Arrigoni Battaia F. et al., 2018, MNRAS, 473, 3907
- Battaia et al. (2019) Arrigoni Battaia F. et al., 2019, https://arxiv.org/pdf/1909.00829.pdf
- Bacon et al. (2017) Bacon R. et al., 2017, A&A, 608, A1
- Beckman et al. (2019) Beckmann, R.S. et al., 2019, A&A, 631, A60
- Bertone and Schaye (2012) Bertone, S. and Schaye, J., 2012, MNRAS, 419, 780
- Bolton et al. (2005) Bolton J.S. et al., 2005, MNRAS, 357, 1178
- Borisova et al. (2016) Borisova E. et al., 2016, ApJ, 831, 39
- Cantalupo et al. (2005) Cantalupo S. et al., 2005, ApJ, 628, 61
- Cantalupo et al. (2014) Cantalupo S. et al., 2014, Nature, 506, 63
- Corlies et al. (2018) Corlies L. et al., 2018, https://arxiv.org/pdf/1811.05060.pdf
- Dekel et al. (2009) Dekel A. et al., 2009, Nature, 475, 451
- Dekel and Birnboim (2006) Dekel A. and Birnboim, Y., 2006, MNRAS, 368, 2
- Dijkstra (2017) Dijkstra M., 2017, https://arxiv.org/pdf/1704.03416.pdf
- Dijkstra (2006) Dijkstra M. et al., 2006, ApJ, 649, 14
- Fardal et al. (2001) Fardal M. A. et al., 2001, ApJ, 562, 605
- Faucher-Giguere et al. (2008) Faucher-Giguere C. et al., 2008, ApJ, 688, 85
- Faucher-Giguere et al. (2010) Faucher-Giguere C. et al., 2010, ApJ, 725, 633
- Furlanetto et al. (2003) Furlanetto S.R. et al., 2003, ApJ, 599, L1
- Furlanetto et al. (2005) Furlanetto S.R. et al., 2005, ApJ, 622, 7
- Gallego et al. (2018) Gallego S. et al., 2018, MNRAS, 475, 3854
- Gnat and Sternberg (2007) Gnat O. and Sternberg A., 2007, ApJ, 168, 213
- Goerdt et al. (2012) Goerdt T. et al., 2012, MNRAS, 424, 2292
- Gould and Weinberg (1996) Gould A. and Weinberg D.H., 1996, ApJ, 468, 462
- Grand et al. (2017) Grand, R.J.J. et al., 2017, MNRAS, 467, 179
- Hogan and Weymann (1987) Hogan C.J. and Weymann R.J., 1987, MNRAS, 225, 1P
- Haider et al. (2016) Haider M. et al., 2016, MNRAS, 457, 3024
- Hani et al. (2020) Hani M. et al., 2020, MNRAS, 493, L87
- Hennawi et al. (2013) Hennawi J. F. et al., 2013, ApJ, 766, 58
- Hennawi et al. (2015) Hennawi J. F. et al., 2015, Science, 348, 779
- Hinshaw et al. (2013) Hinshaw G. et al., 2013, ApJ, 208, 19
- Hui and Gnedin (1997) Hui, L. and Gnedin, N. Y., 1997, MNRAS, 293, 27
- Hull et al. (2018) Hull A. et al., 2018, AAS, 231, 140.13
- Katz et al. (2003) Katz N. et al., 2003, ASSL, 281, 185
- Keres et al. (2005) Keres D. et al., 2005, MNRAS, 363, 2
- Kikuta et al. (2019) Kikuta S. et al., 2019, https://arxiv.org/pdf/1904.07747.pdf
- Klypin and Shandarin (1983) Klypin A. A. and Shandarin S. F. , 1983, MNRAS, 204, 891
- Kollmeier et al. (2010) Kollmeier, J. et al., 2010, ApJ, 708, 1048
- Kooistra et al. (2019) Kooistra, R. et al., 2019, MNRAS, 490, 1415
- Laursen and Sommer-Larsen (2007) Laursen, P. and Sommer-Larsen,J. , 2007, ApJ, 657, L69
- Laursen et al. (2009) Laursen, P. et al. , 2009, ApJ, 696, 853
- Lowenthal et al. (1990) Lowenthal J.D. et al. , 1990, ApJ, 357, 3
- Mandelker et al. (2019) Mandelker N. et al. , 2019, ApJ, 881, 20
- Martin et al. (2014) Martin D. C. et al. , 2014, AJ, 786, 107
- Martinez-Gonzalez et al. (1995) Martinez-Gonzalez E. et al. , 1995, A&A, 303, 379
- Matsuda et al. (2004) Matsuda Y. et al. , 2004, AJ, 128, 569
- Matsuda et al. (2011) Matsuda Y. et al. , 2011, MNRAS, 410, L13
- Nelson et al. (2016) Nelson D. et al., 2016, MNRAS, 460, 2881
- Osterbrock and Ferland (2006) Osterbrock D.E and Ferland G. J., 2006, Astrophysics of Gas Nebulae and Active Galactic Nuclei, University Science Books
- Ocvirk et al. (2008) Ocvirk P., Pichon C., and Teyssier, R., 2008, MNRAS, 390, 1326
- Peebles and Groth (1975) Peebles P. J. E., Groth E. J., 1975, ApJ, 196,1
- Pillepich et al. (2018) Pillepich A. et al., 2018, MNRAS, 473, 4077
- Rauch et al. (2008) Rauch M. et al., 2008, ApJ, 681, 856
- Rosdahl and Blaizot (2012) Rosdahl J. and Blaizot J., 2012, MNRAS, 423, 344
- Smith et al. (2019) Smith A. et al., 2019, MNRAS, 484, 39
- Springel et al. (2001) Springel V. et al., 2001, MNRAS, 328, 726
- Springel and Hernquist (2003) Springel V. and Hernquist, L., 2003, MNRAS, 339, 289
- Springel (2010) Springel V., 2010, MNRAS, 401, 791
- Steidel et al. (2000) Steidel C C. et al., 2000, ApJ, 532, 170
- Steidel et al. (2010) Steidel C C. et al., 2010, ApJ, 717, 289
- Swinbank et al. (2015) Swinbank A. M. et al., 2015, MNRAS, 449, 1298
- Umehata et al. (2019) Umehata H. et al., 2019, Science, 366, 6461, 97
- van de Voort et al. (2011) van de Voort F. et al., 2011, MNRAS, 414, 2458
- Visbal and McQuinn (2018) Visbal, E. and McQuinn, M., 2018, ApJ, 863, L6
- Vogelsberger et al. (2012) Vogelsberger M. et al., 2012, MNRAS, 425, 3024
- Vogelsberger et al. (2014a) Vogelsberger M. et al., 2014, MNRAS, 444, 1518
- Weinberger et al. (2017) Weinberger R. et al., 2017, MNRAS, 465, 3291
- Witstok et al. (2019) Witstok J. et al., 2019, https://arxiv.org/pdf/1905.06954.pdf
- Zheng et al. (2002) Zheng Z. and Miralda-Escudé, J., 2002, ApJ, 578, 33
Appendix A
To compute the impact of Ly scattering, we have used a parallelized 3D Monte Carlo Ly radiative transfer code, which was originally developed for line-intensity mapping predictions (Visbal and McQuinn, 2018). This code is similar to the one described in Faucher-Giguere et al. (2010) (see also Zheng et al., 2002; Cantalupo et al., 2005; Dijkstra, 2006; Laursen and Sommer-Larsen, 2007). For a detailed description see Appendix C in Faucher-Giguere et al. (2010). To generate a distant-observer image, the code follows the paths of Ly photons packets as they scatter throughout the simulated neutral gas field.
For the radiative transfer calculation, the neutral hydrogen density, temperature, Ly emissivity, and gas velocity in a (1250 kpc)3 volume centered on our most massive galaxy (top left in Fig. 2 and Fig. 3) were smoothed over a cubic grid using a gaussian kernel whose width depends on the local density such that it is smaller in denser regions. We then follow Ly photons packets, distributed proportionally to the filaments’ Ly emission to estimate the distant-observer image cube (two spatial dimensions and one frequency dimensions). We also utilize the “accelerated scheme” described in Appendix C of Faucher-Giguere et al. (2010) with , which greatly speeds up our calculation without significantly impacting the results.
We have checked convergence for the number of packets, , the grid resolution, and the integration of packets’ paths through the simulation. Our results are summarized in Fig.A1 where we plot the histogram of observed Ly intensities with and without performing radiative transfer. Here we have convolved our resolution image cube with a top-hat window function with dimensions to 5.3" x 5.3" x 6.25 Angstroms. This corresponds to the degraded resolution used in Section 4.2. We see that the smearing of the signal due to radiative transfer reduces the intensity of the brightest pixels by a factor of compared to ignoring this effect. Shifting the surface brightness distributions in Fig. 6 lower by a factor of would alter the detectable area, particularly for the large pixel size, which has a steep cutoff at the high surface brightness end. We have not checked how radiative transfer affects surface brightness at different pixel sizes, simulation resolutions, or feedback implementations. Given the above calculations, we expect the impact to be relatively modest (particularly in the large pixel size case).
