A perspective on correlation-based financial networks and entropy measures
Abstract
In this brief review, we critically examine the recent work done on correlation-based networks in financial systems. The structure of empirical correlation matrices constructed from the financial market data changes as the individual stock prices fluctuate with time, showing interesting evolutionary patterns, especially during critical events such as market crashes, bubbles, etc. We show that the study of correlation-based networks and their evolution with time is useful for extracting important information of the underlying market dynamics. We, also, present our perspective on the use of recently developed entropy measures such as structural entropy and eigen-entropy for continuous monitoring of correlation-based networks.
keywords:
econophysics random matrix theory correlation networks minimum spanning trees clustering financial networksINTRODUCTION
There has been a growing interest in understanding the dynamics of complex systems in the real world. Network science has emerged as an important tool and convenient framework for analyzing a wide variety of social, financial, biological and informative complex systems [1, 2, 3]. Network science began with the seminal papers of Erdős and Rényi [4, 5], who proposed random graphs in 1959-60. Random graphs have been used to compare real-world complex networks, since the late 1990s, when a number of scientists started using networks in physical, social, and biological domains. Watts and Strogatz [6] renewed the modeling of networks with “small world” properties – random graphs with small diameter but highly clustered like regular lattices. Barabási and Albert investigated the properties of vertex connectivity of large networks with “scale-free” power-law distributions [7]. These were followed by a flood of papers (see, e.g., [8, 9, 10, 11, 12, 13, 14, 15, 16, 17]). Thus, network science emerged as an important tool for studying different phenomena – spread of infectious diseases [18], economic development [19, 20], detection, characterisation, identification of long-term precursors to financial crashes [21, 22, 23], construction of robust sustainable infrastructure and technological networks [24], etc.
Here, we briefly review the role of network science in understanding complex financial markets. Firstly, for uncovering the structure of complex interactions among stocks at a particular instant of time (static picture). For this purpose, one starts with the cross-correlations among stocks returns and then uses various methods of network analysis, such as threshold networks, Minimum Spanning Tree (MST) [25, 26], Planar Maximally Filtered Graph (PMFG) [27], etc. Using these methods, one can identify stocks (or sectors) that are strongly or weakly correlated and also study their hierarchy in the network structures. Correlations among stocks change with time, and the underlying dynamics of the market becomes very intriguing. Secondly, a continuous monitoring of financial market becomes very useful and necessary [28], since there are sizable fluctuations during crashes and bubbles. Thus, we discuss here the role of entropy measures in continuous monitoring of the financial market (dynamic picture).
CORRELATION-BASED NETWORKS
Mantegna studied the hierarchical structures of correlation-based networks in financial markets [25, 26]. Later similar studies of correlation-based networks were made (see, e.g., [29, 30, 31, 32, 33]). These correlation-based networks provide easy visual representation of multivariate time series and extract meaningful information about the complex market dynamics. The analysis of evolution of correlation-based networks provides a deep understanding of the underlying market trends, especially during periods of crisis [34, 35]. We briefly discuss a few methods to construct correlation-based networks from empirical correlation matrix (ECM): MST, threshold network and PMFG.
Minimum Spanning Tree
MST is constructed by using the distances [36, 37, 38], where s are the elements of ECM (correlations between pairs of stocks in a market for a specific time window), such that all vertices (stocks) are connected with exactly edges under the constraint that total distance is minimum. Algorithms of Kruskal and Prim are generally utilized to obtain MST from a distance matrix. For a non-degenerate distance matrix, the MST is uniquely determined. Two of the main advantages of MST are that: (i) it produces a network structure without putting any arbitrary threshold, and (ii) it has property of inherent hierarchical clustering. There have been many papers with applications of MST in equity markets [34, 39], currency exchange rates [40], global foreign exchange dynamics [41]. Among disadvantages, there is the fact that the order and classification of nodes in a cluster of MST is not robust, and often sensitive to minor changes in correlations or spurious correlations. Therefore, for improvement of results, either noise suppression techniques like Random Matrix Theory (RMT) [42] and power mapping [23] have been used, or alternative algorithms such as PMFG, Triangulated Maximally Filtered Graph (TMFG), Average Linkage Minimum Spanning Tree (ALMST), Directed Bubble Hierarchical Tree (DBHT) [43, 44, 45, 46, 47] have been proposed. Instead of using pair-wise Pearson correlations, partial correlations and mutual information have also been computed for some studies [48, 49].
A
B
C
D
E
F
G
H
I
J
K
L
MST is useful for studying the taxonomy or the sector classification [50], with potential applications in portfolio optimization. Researchers have also carried out analysis of dynamical correlations using MST [51]. This type of dynamical studies has the potential of catching important changes and continuous monitoring of the market. By calculating correlation using rolling window of different lengths, one could construct and analyze the temporal networks. From such analyses, it has been found that configuration of MST structure changes during crisis and there exist strong correlations between normalized tree length and the investment diversification potential [52].
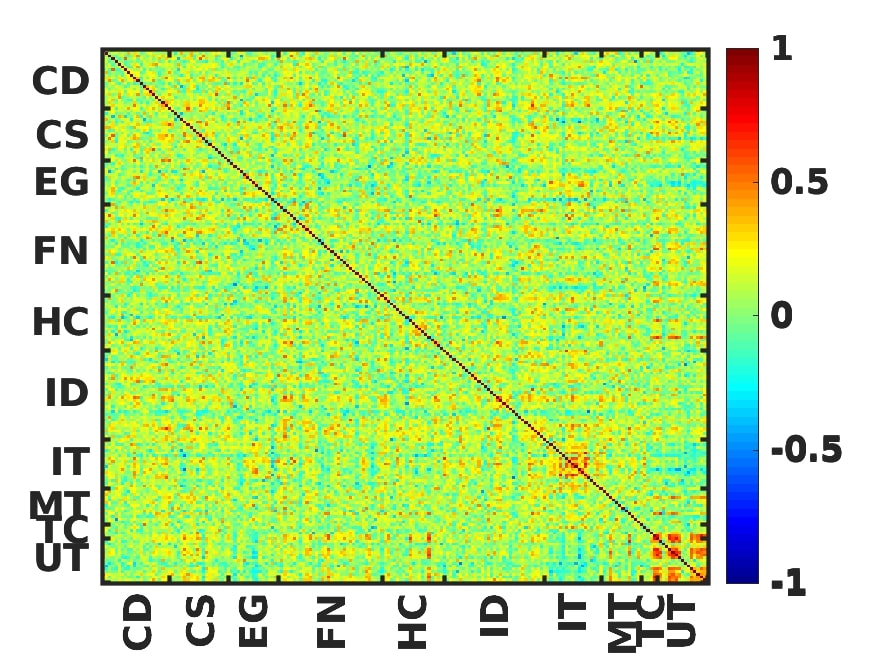
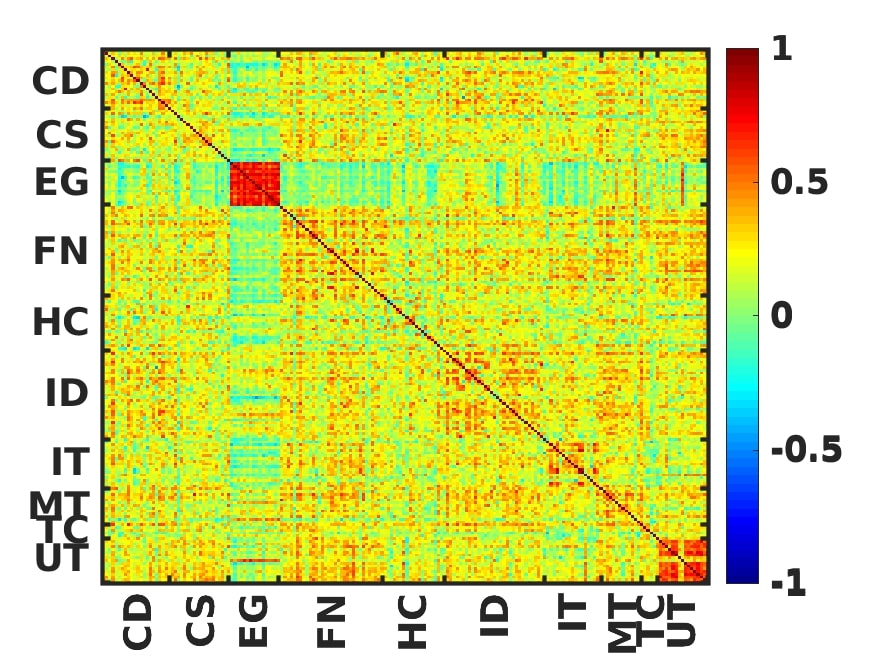
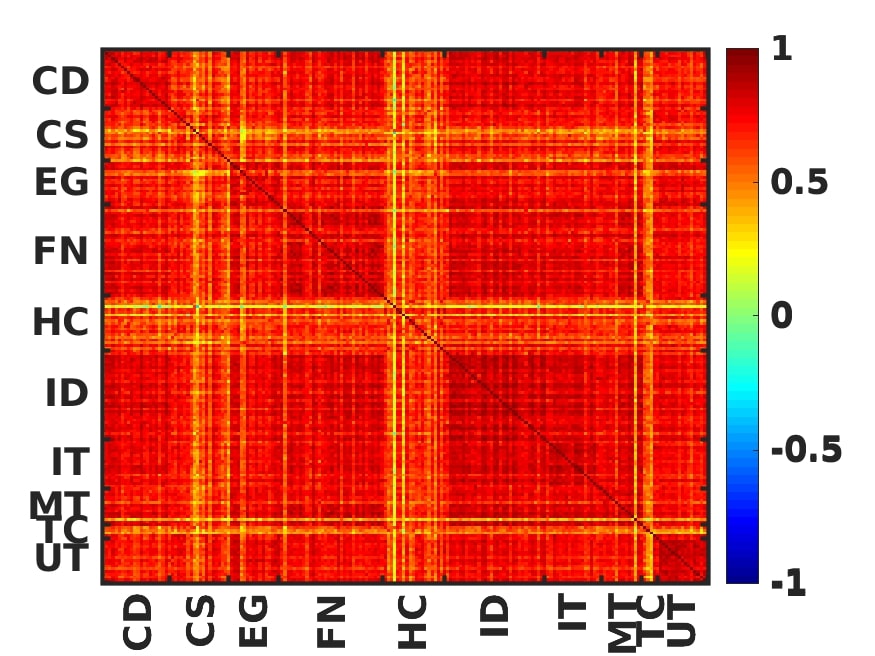
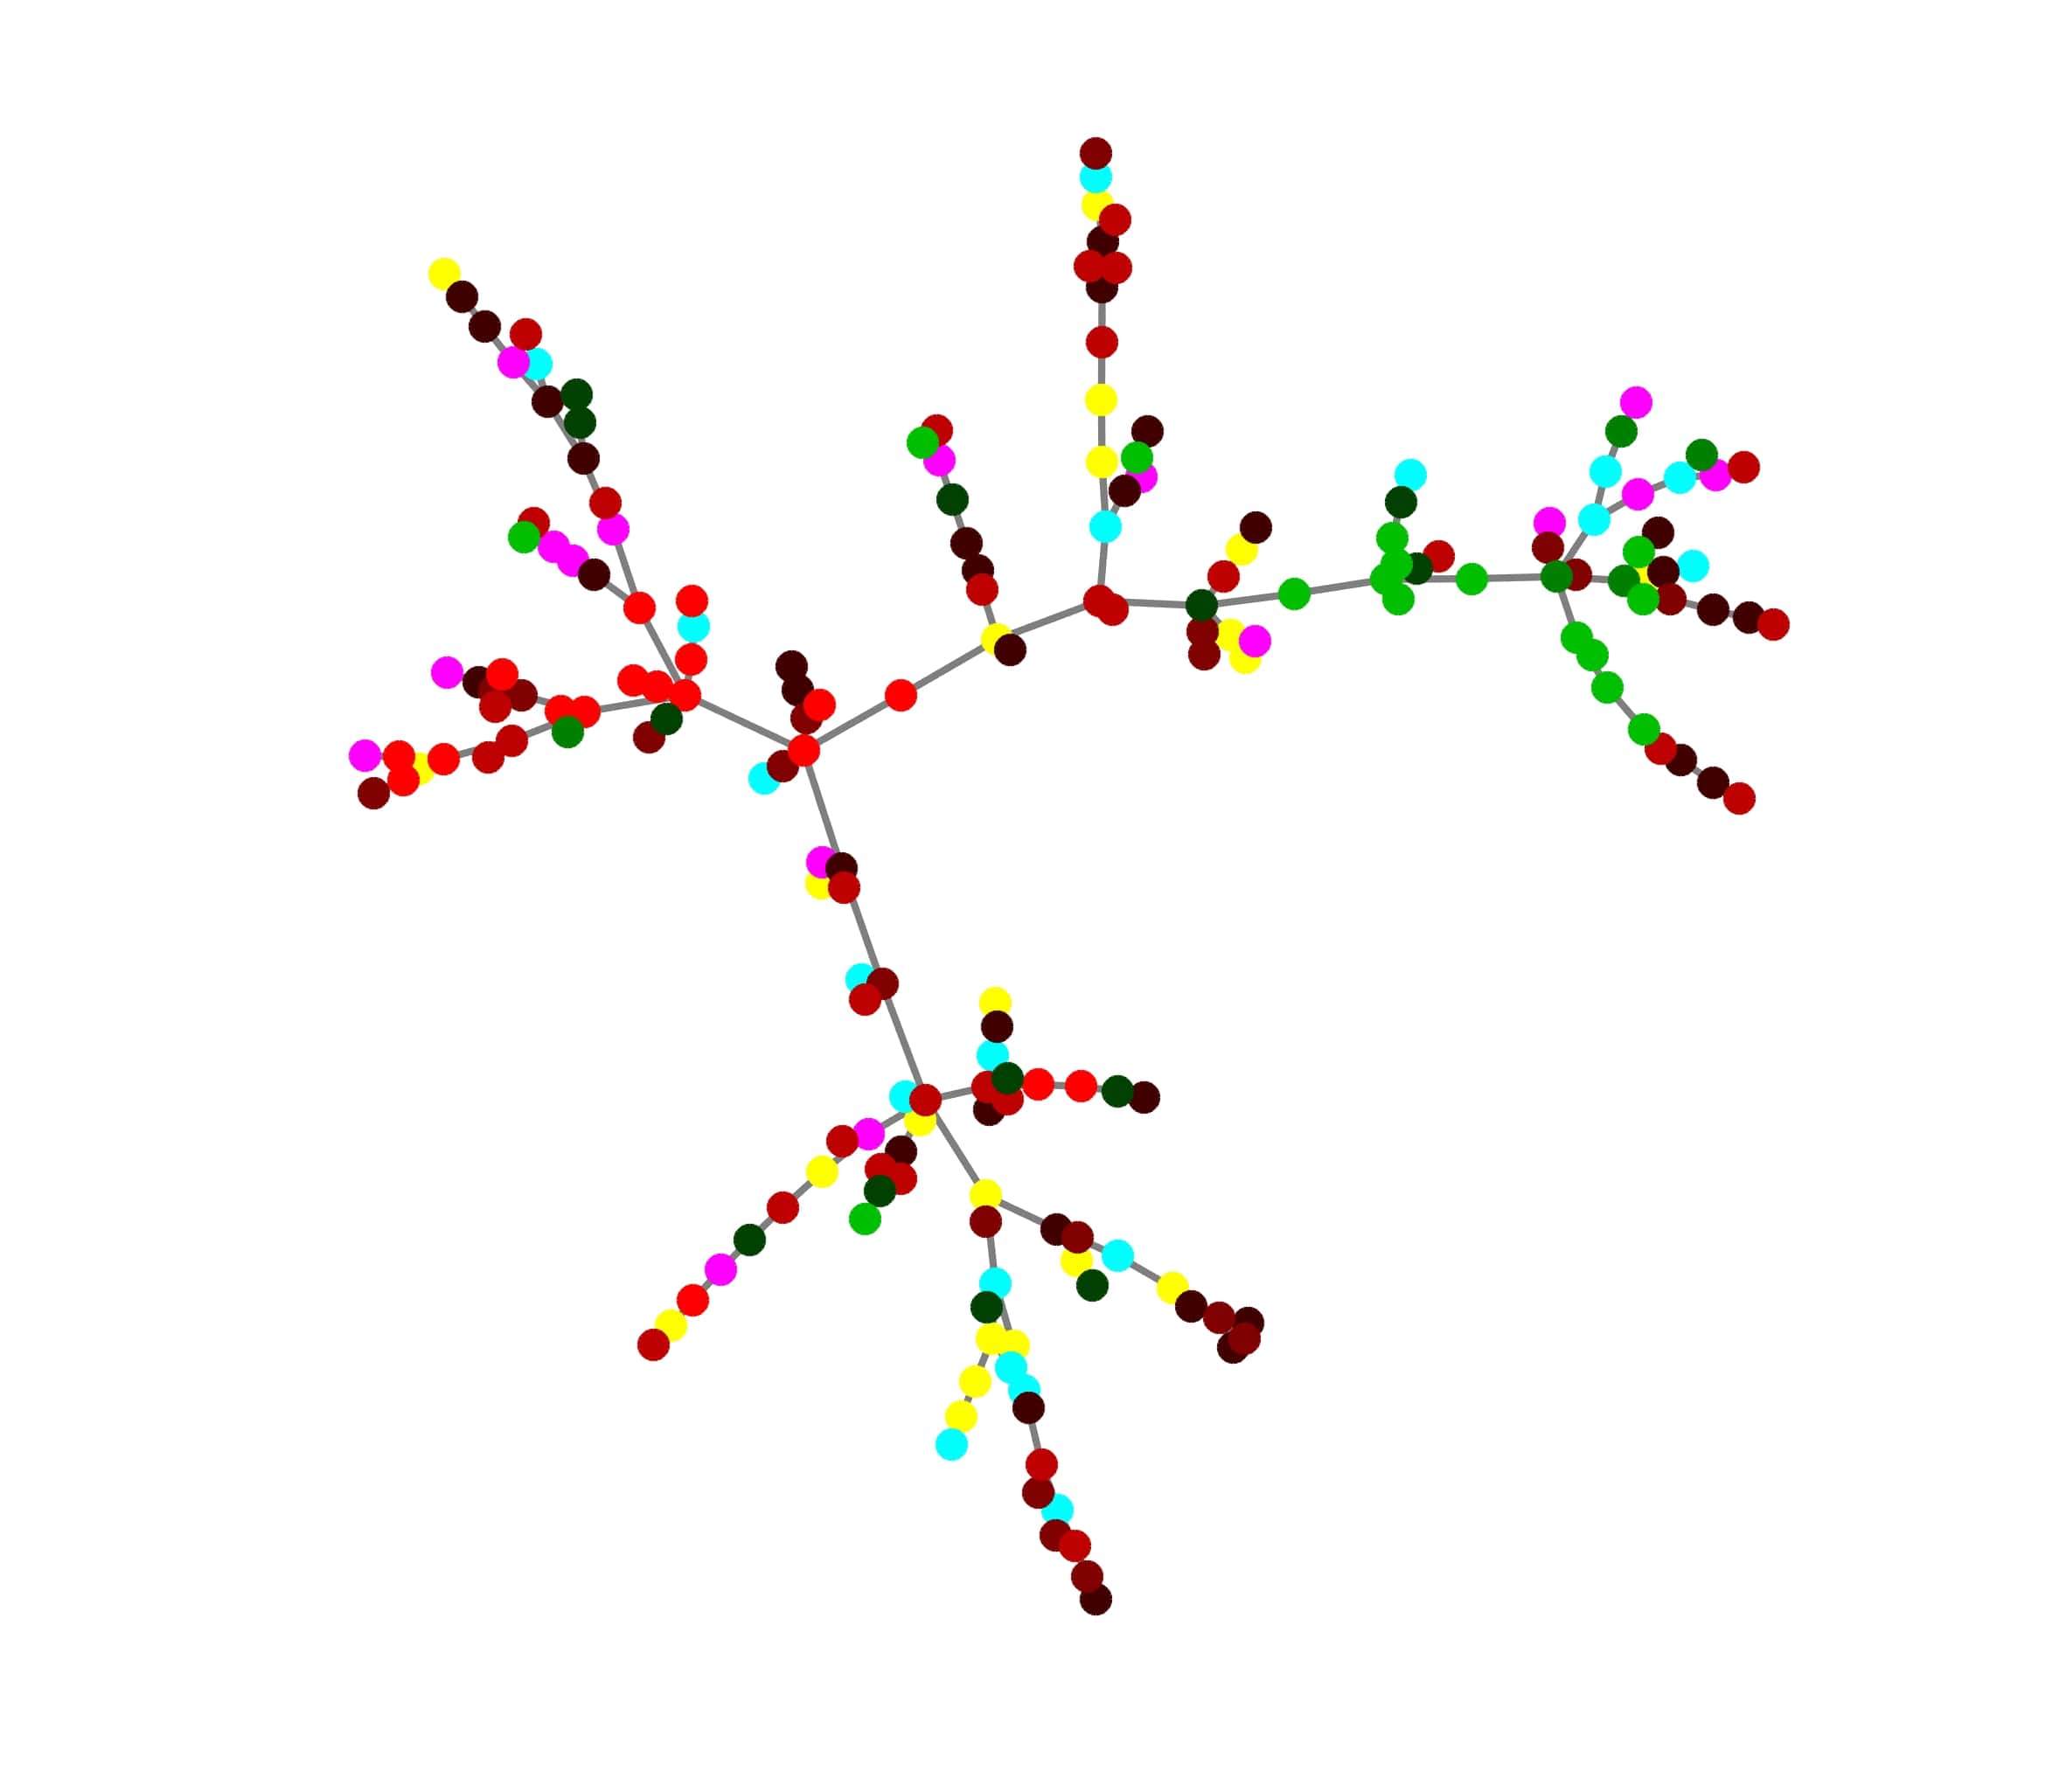
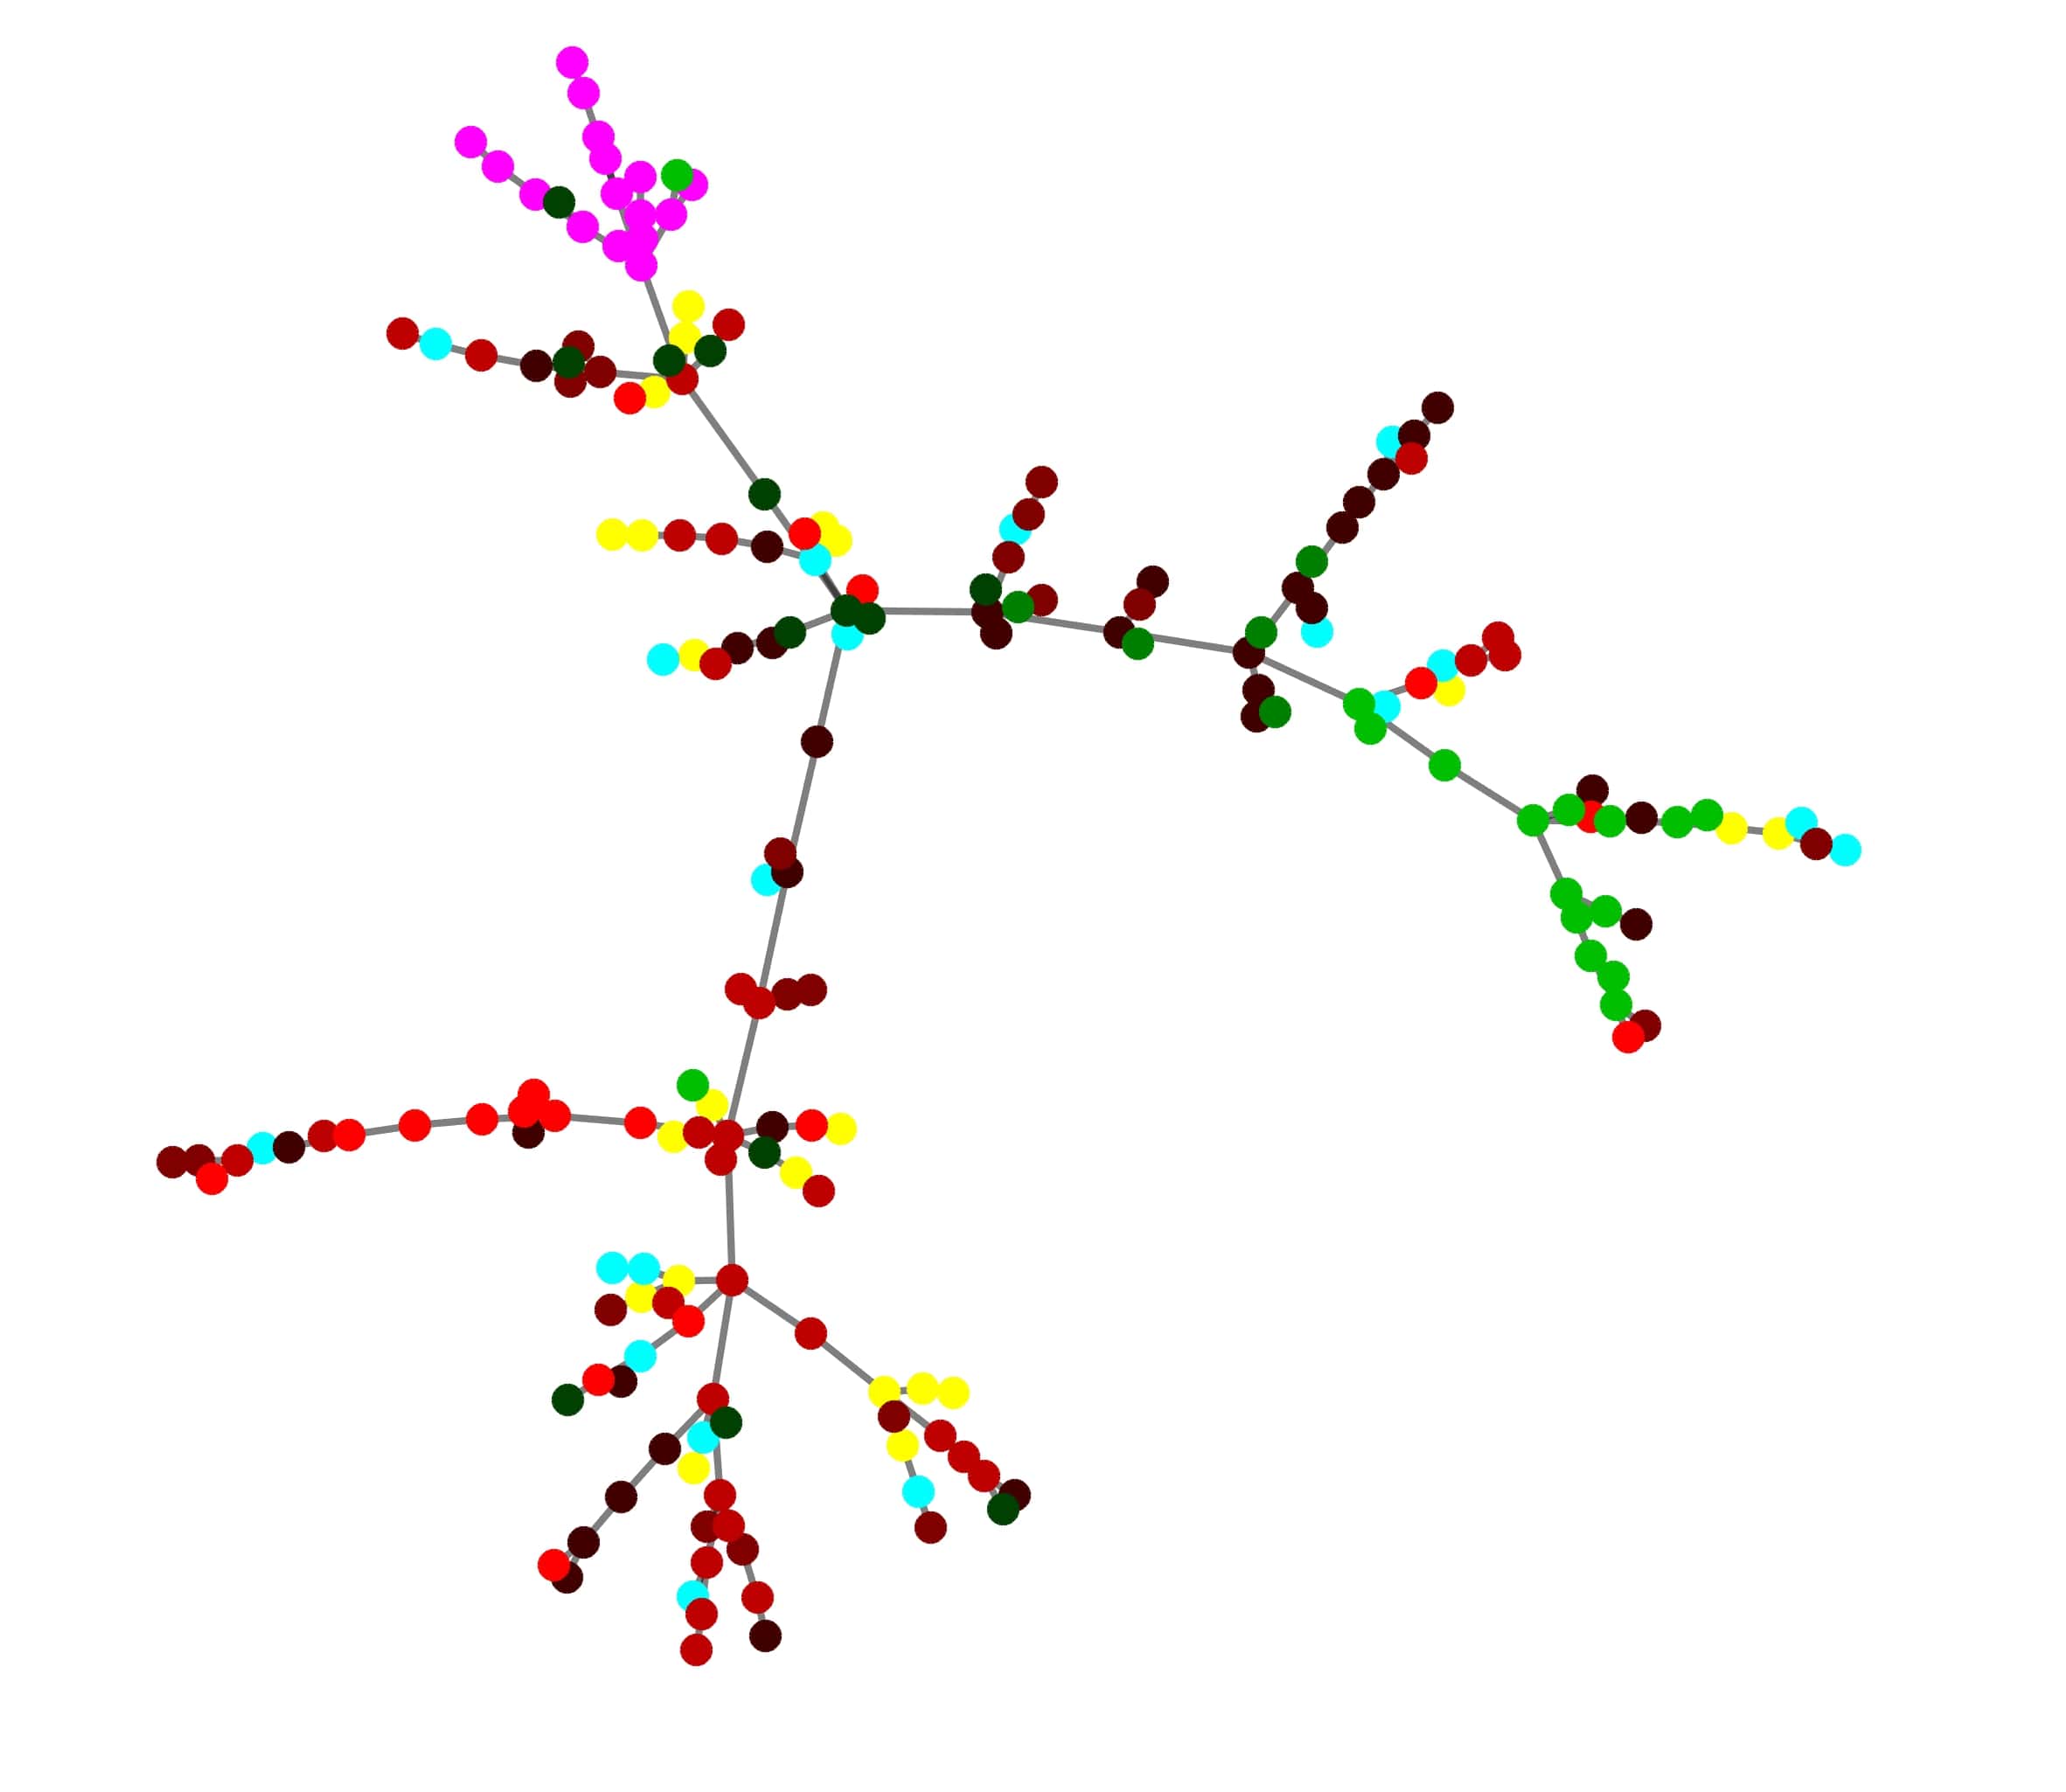
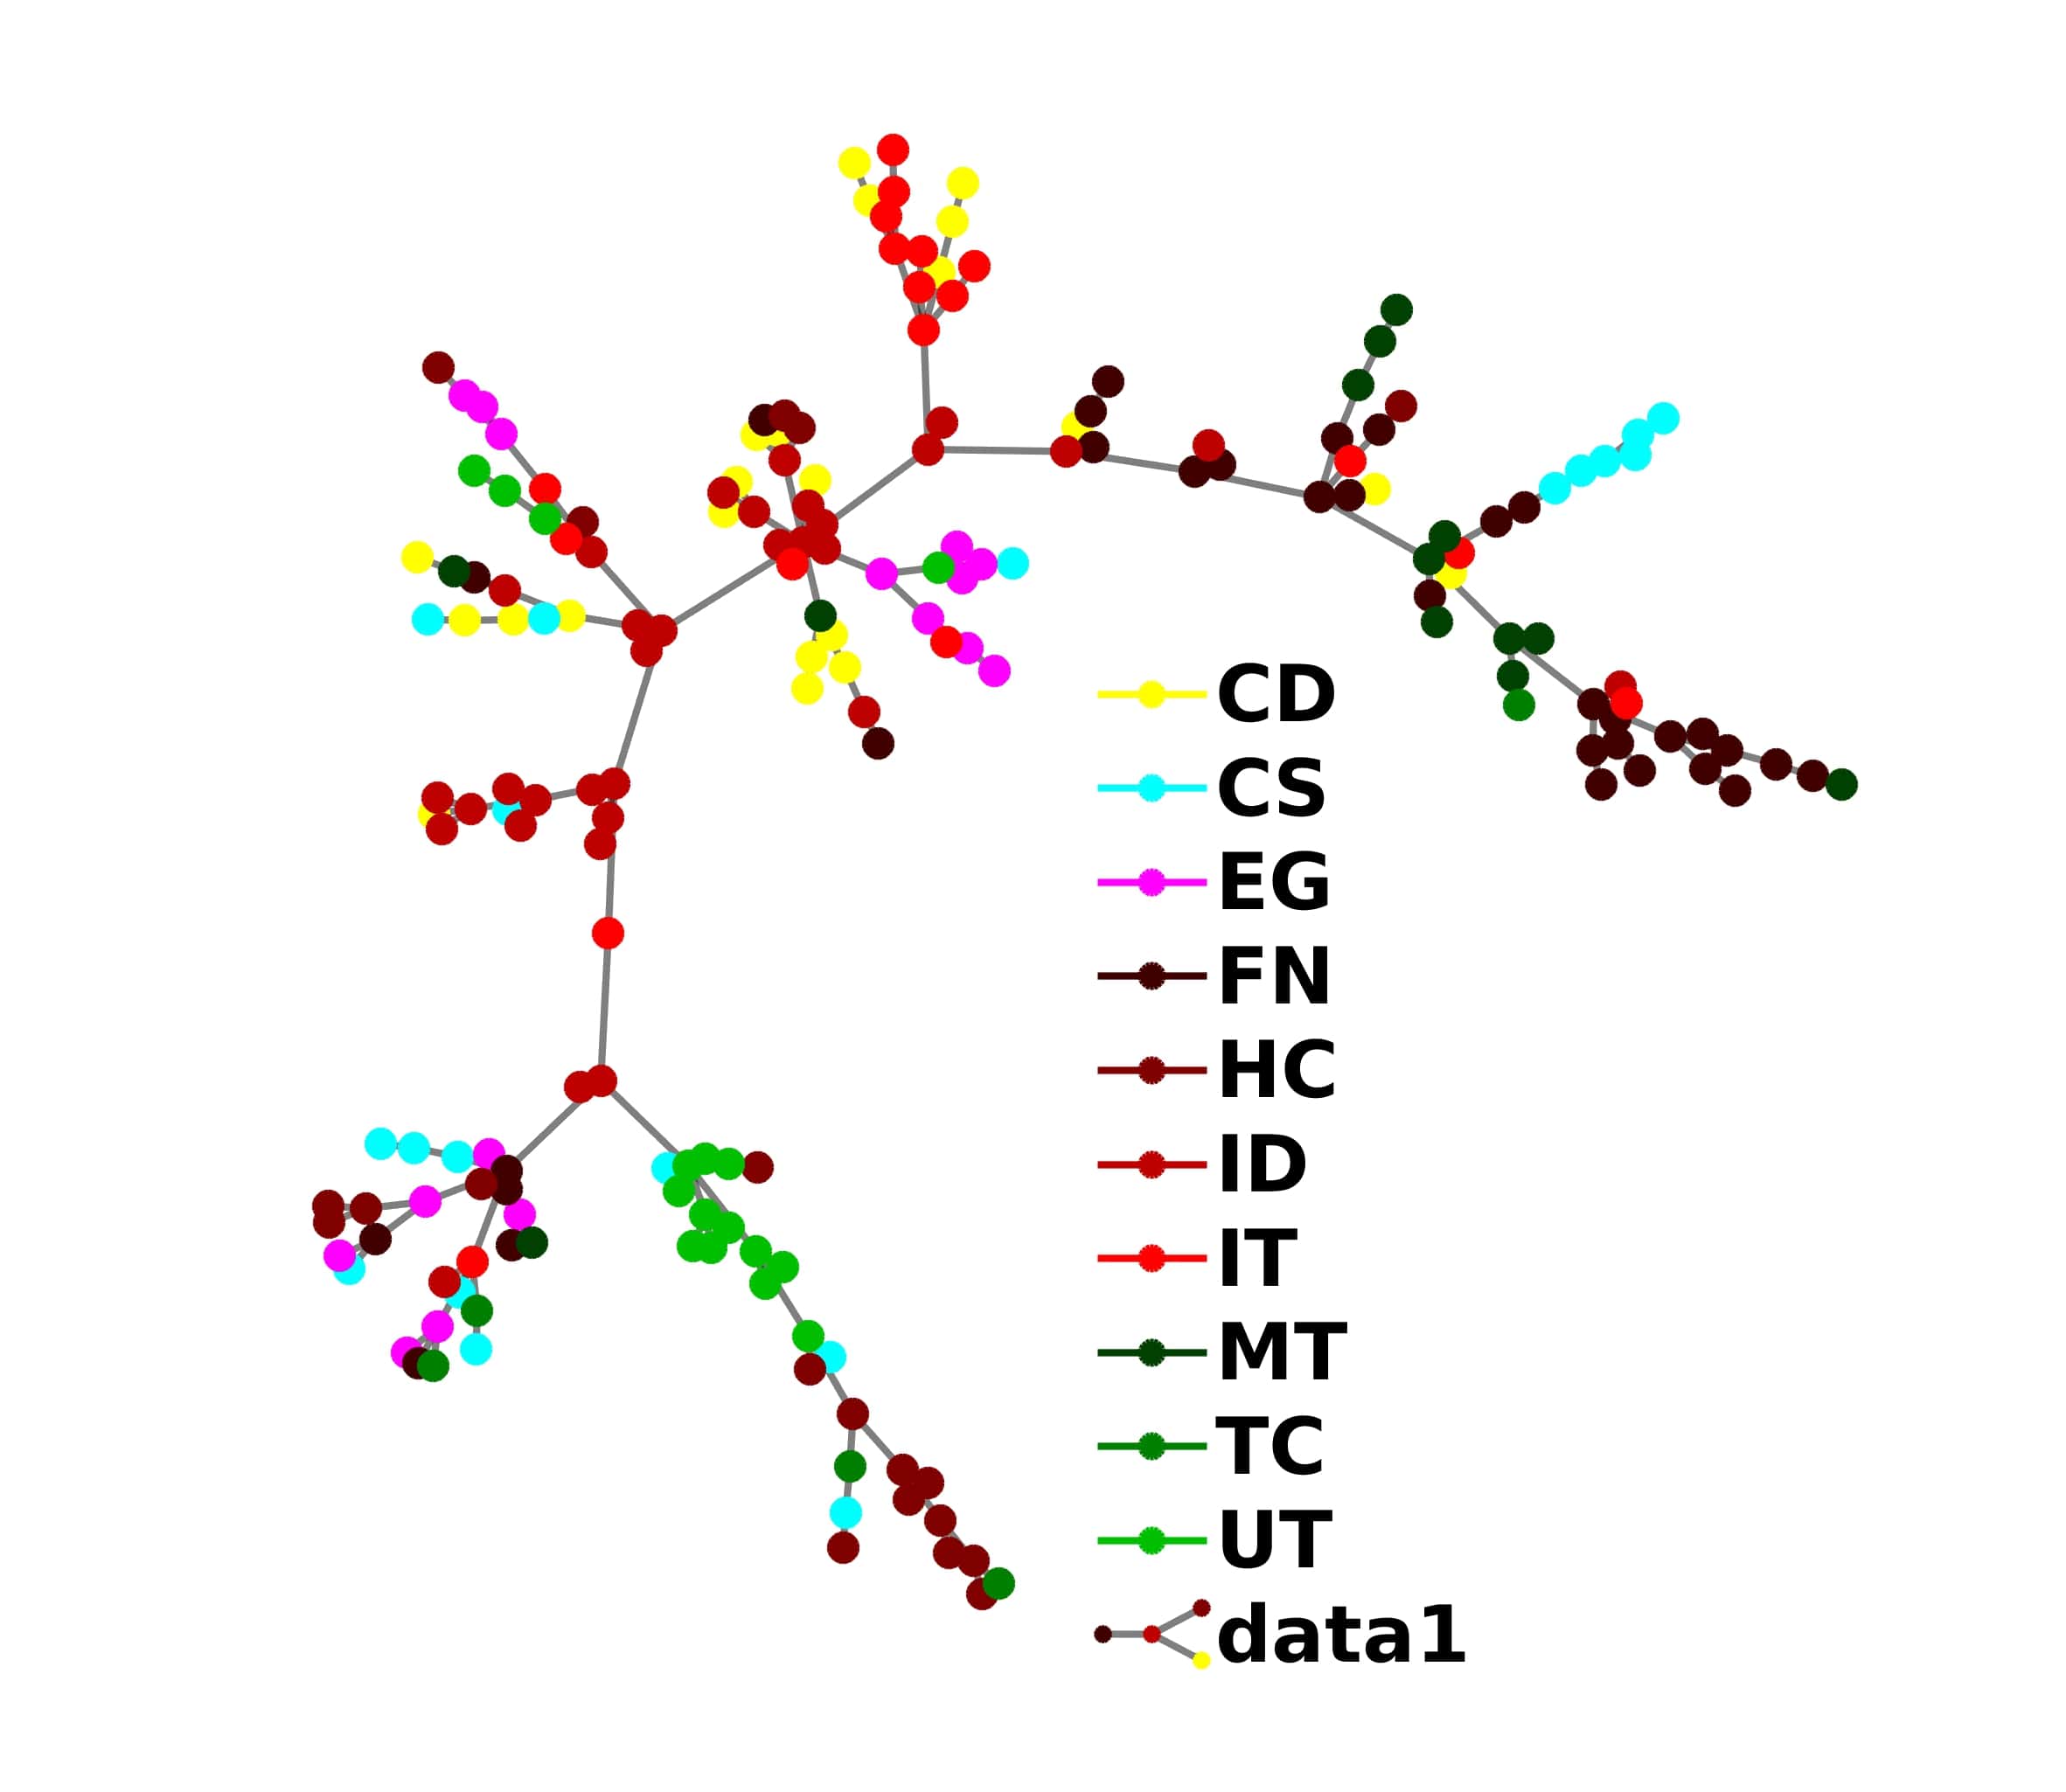
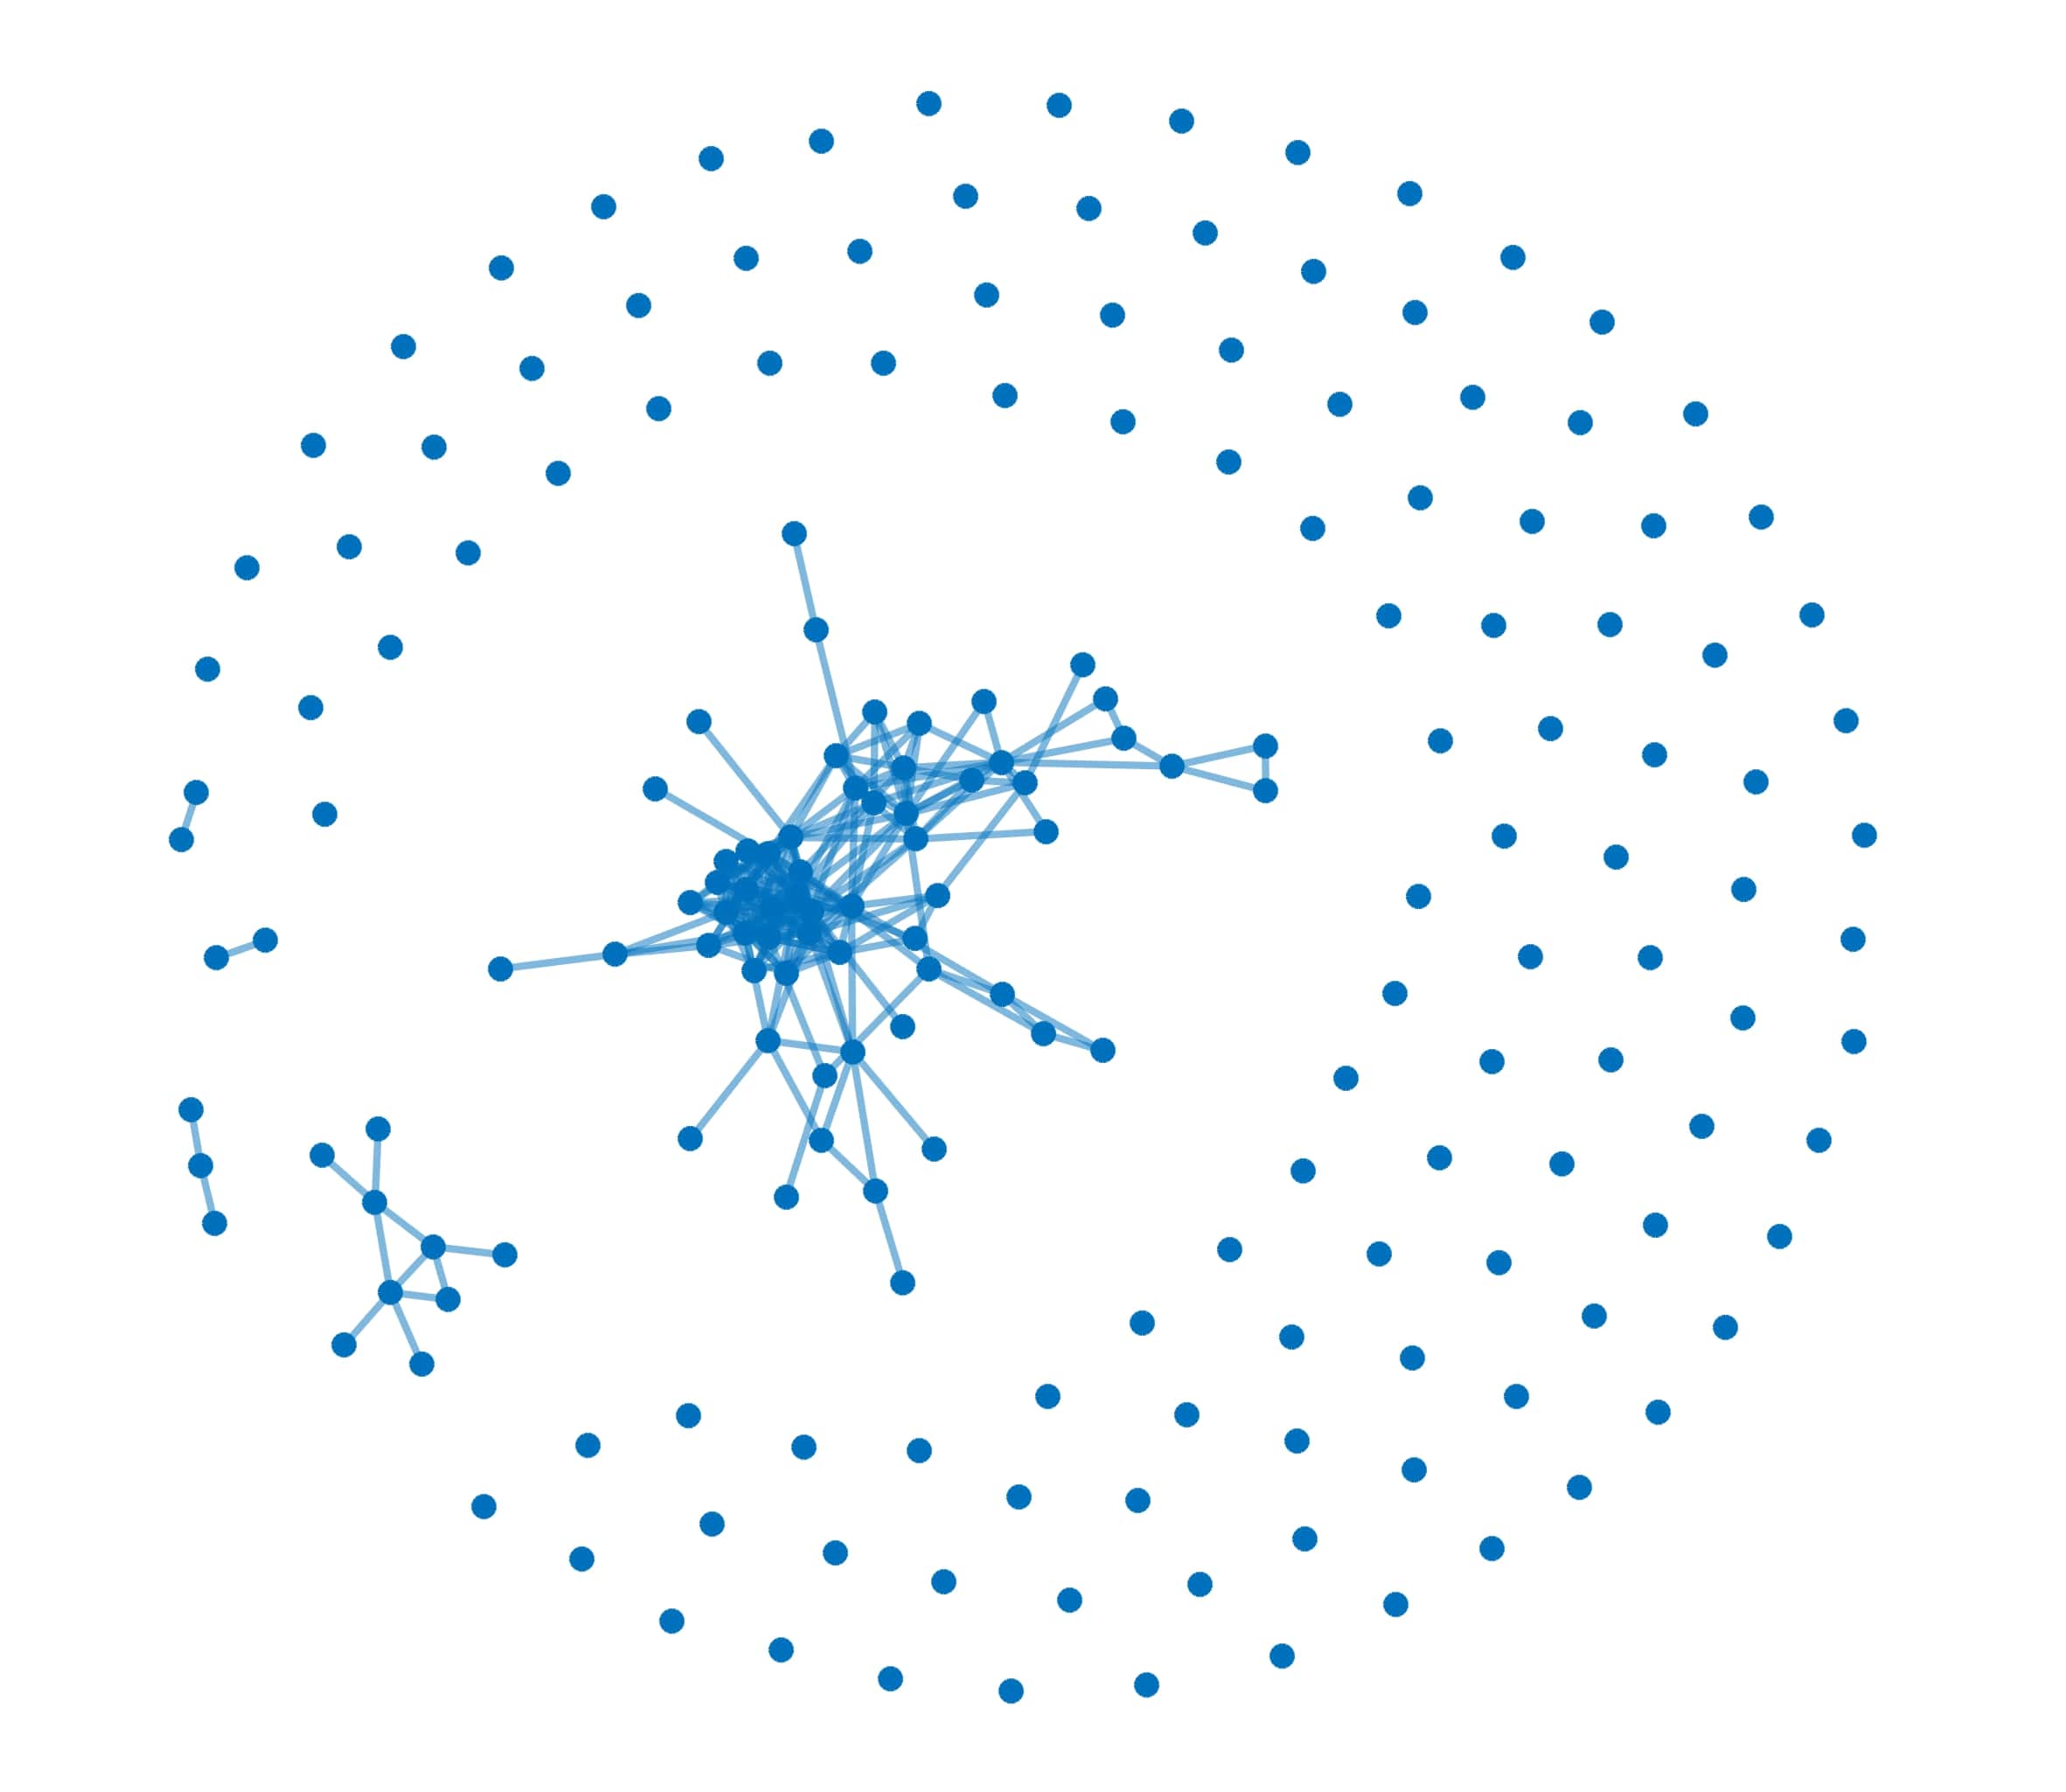
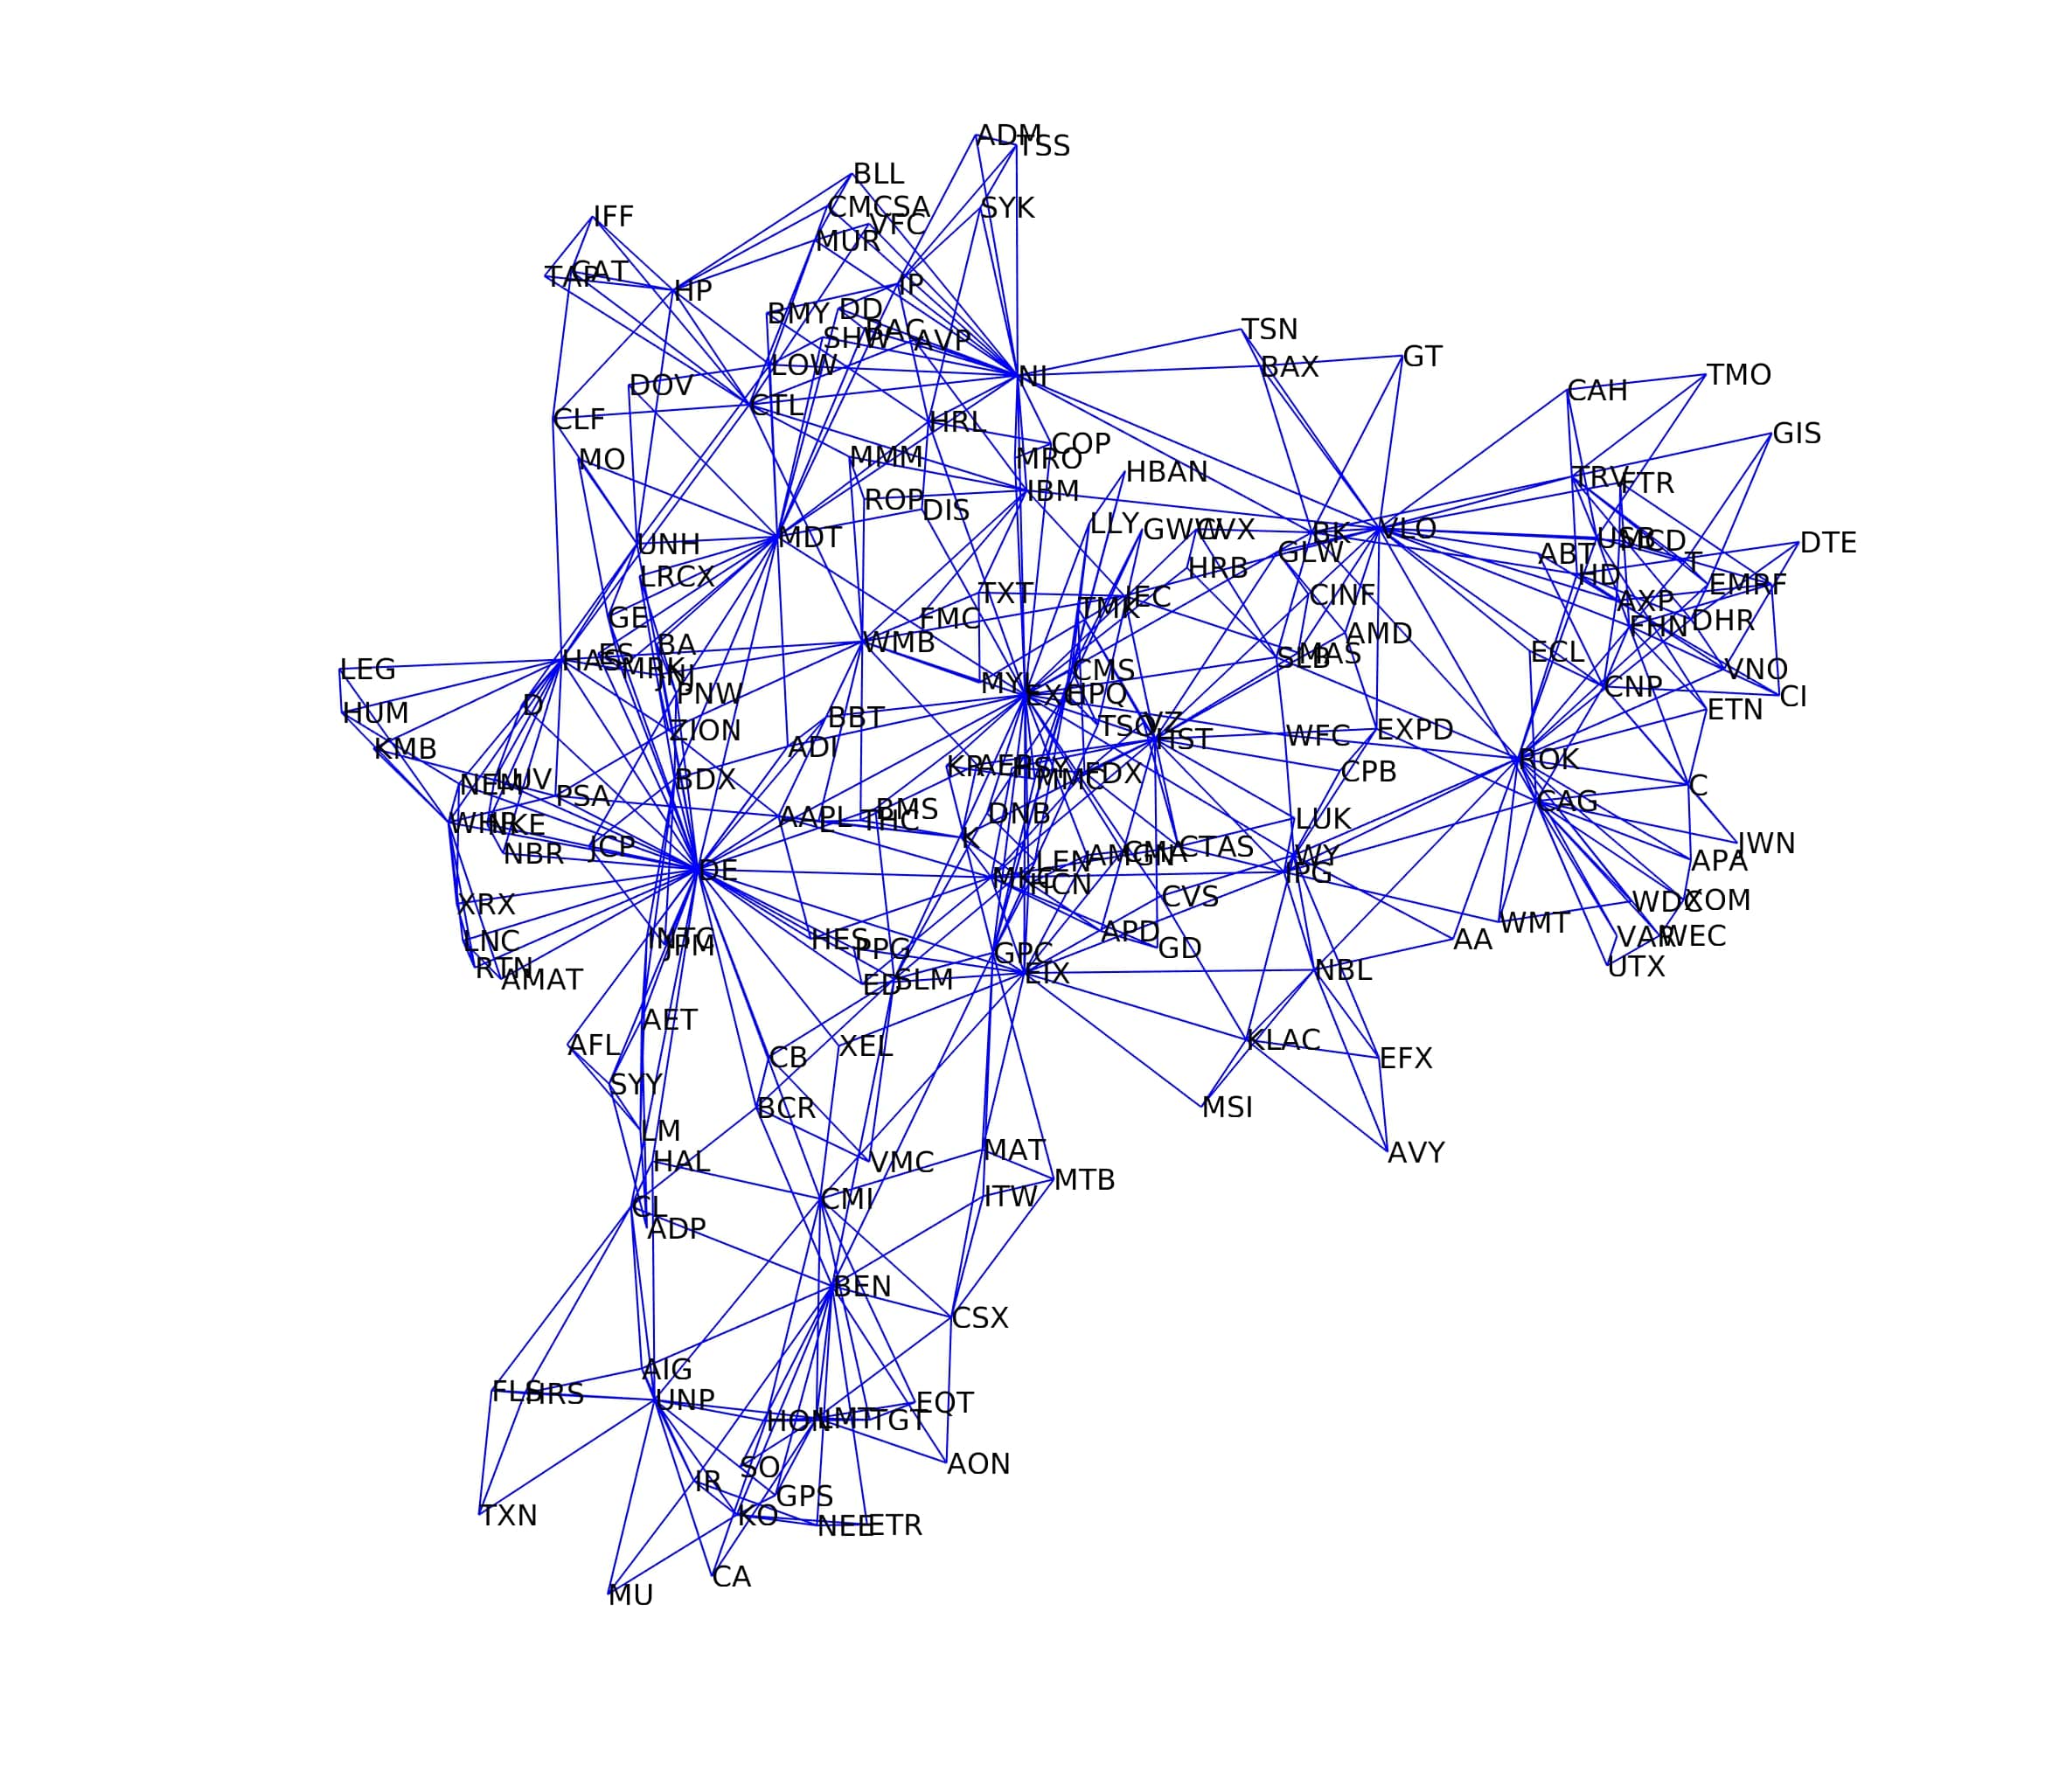
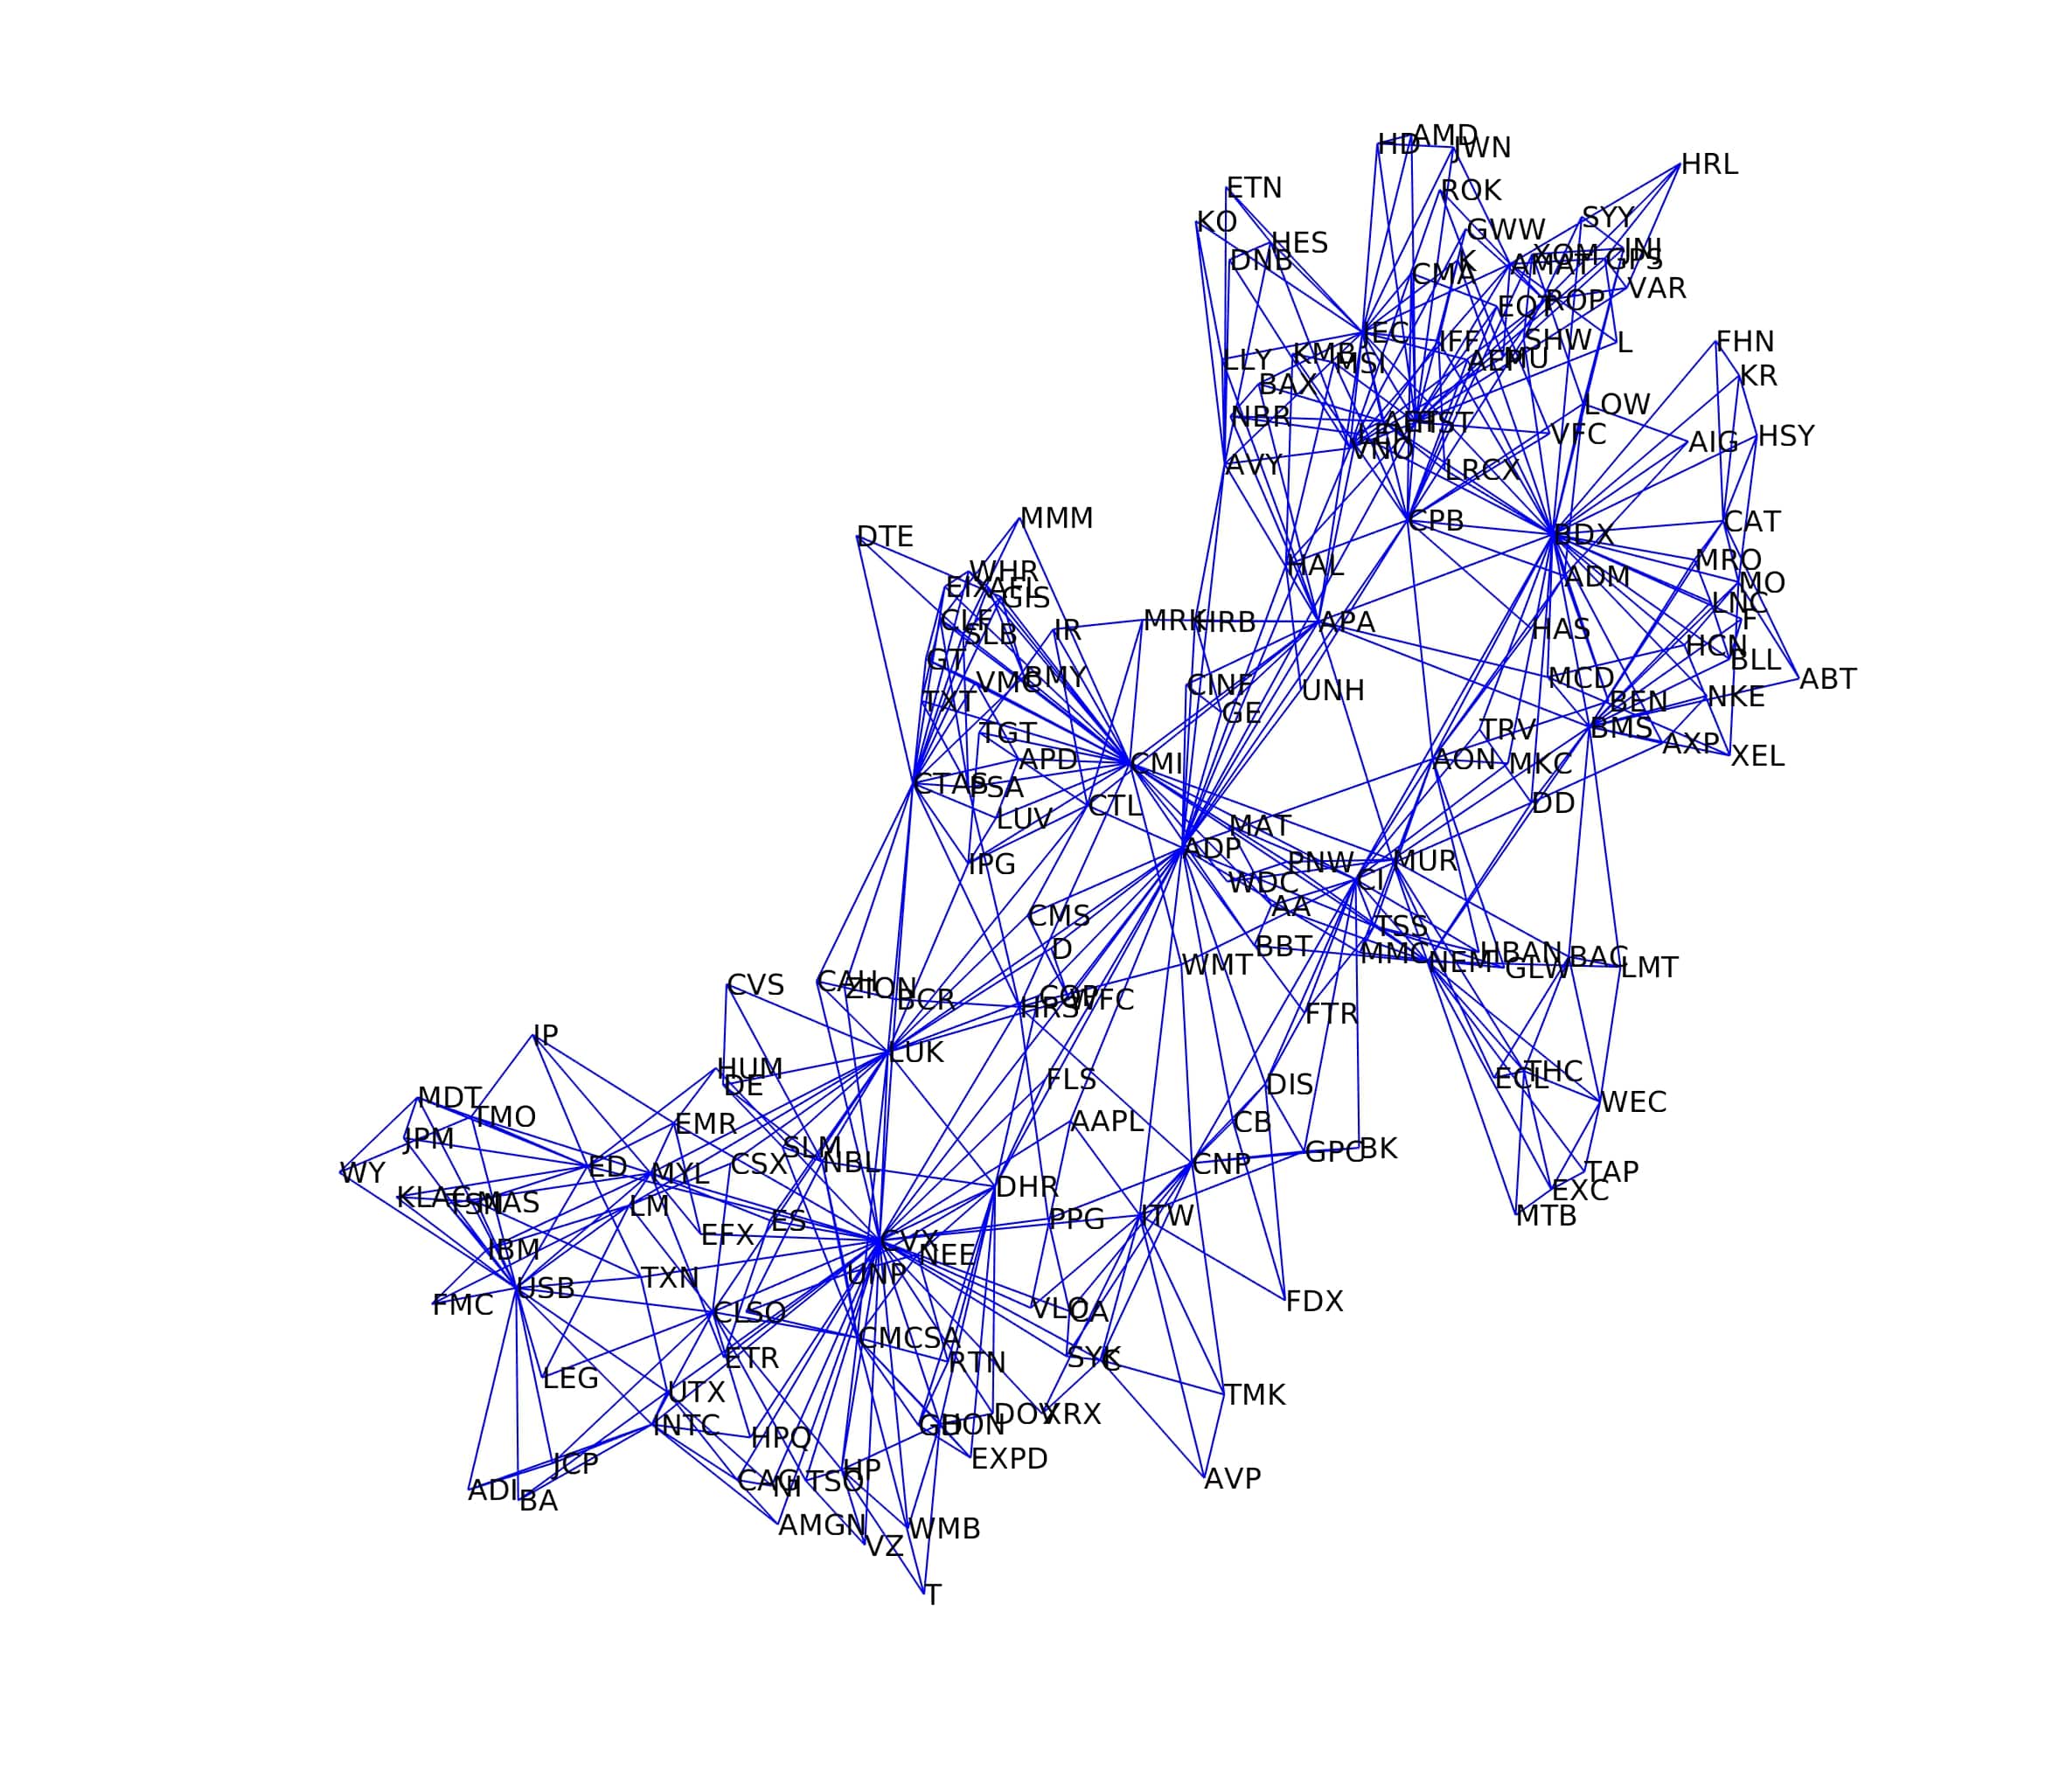
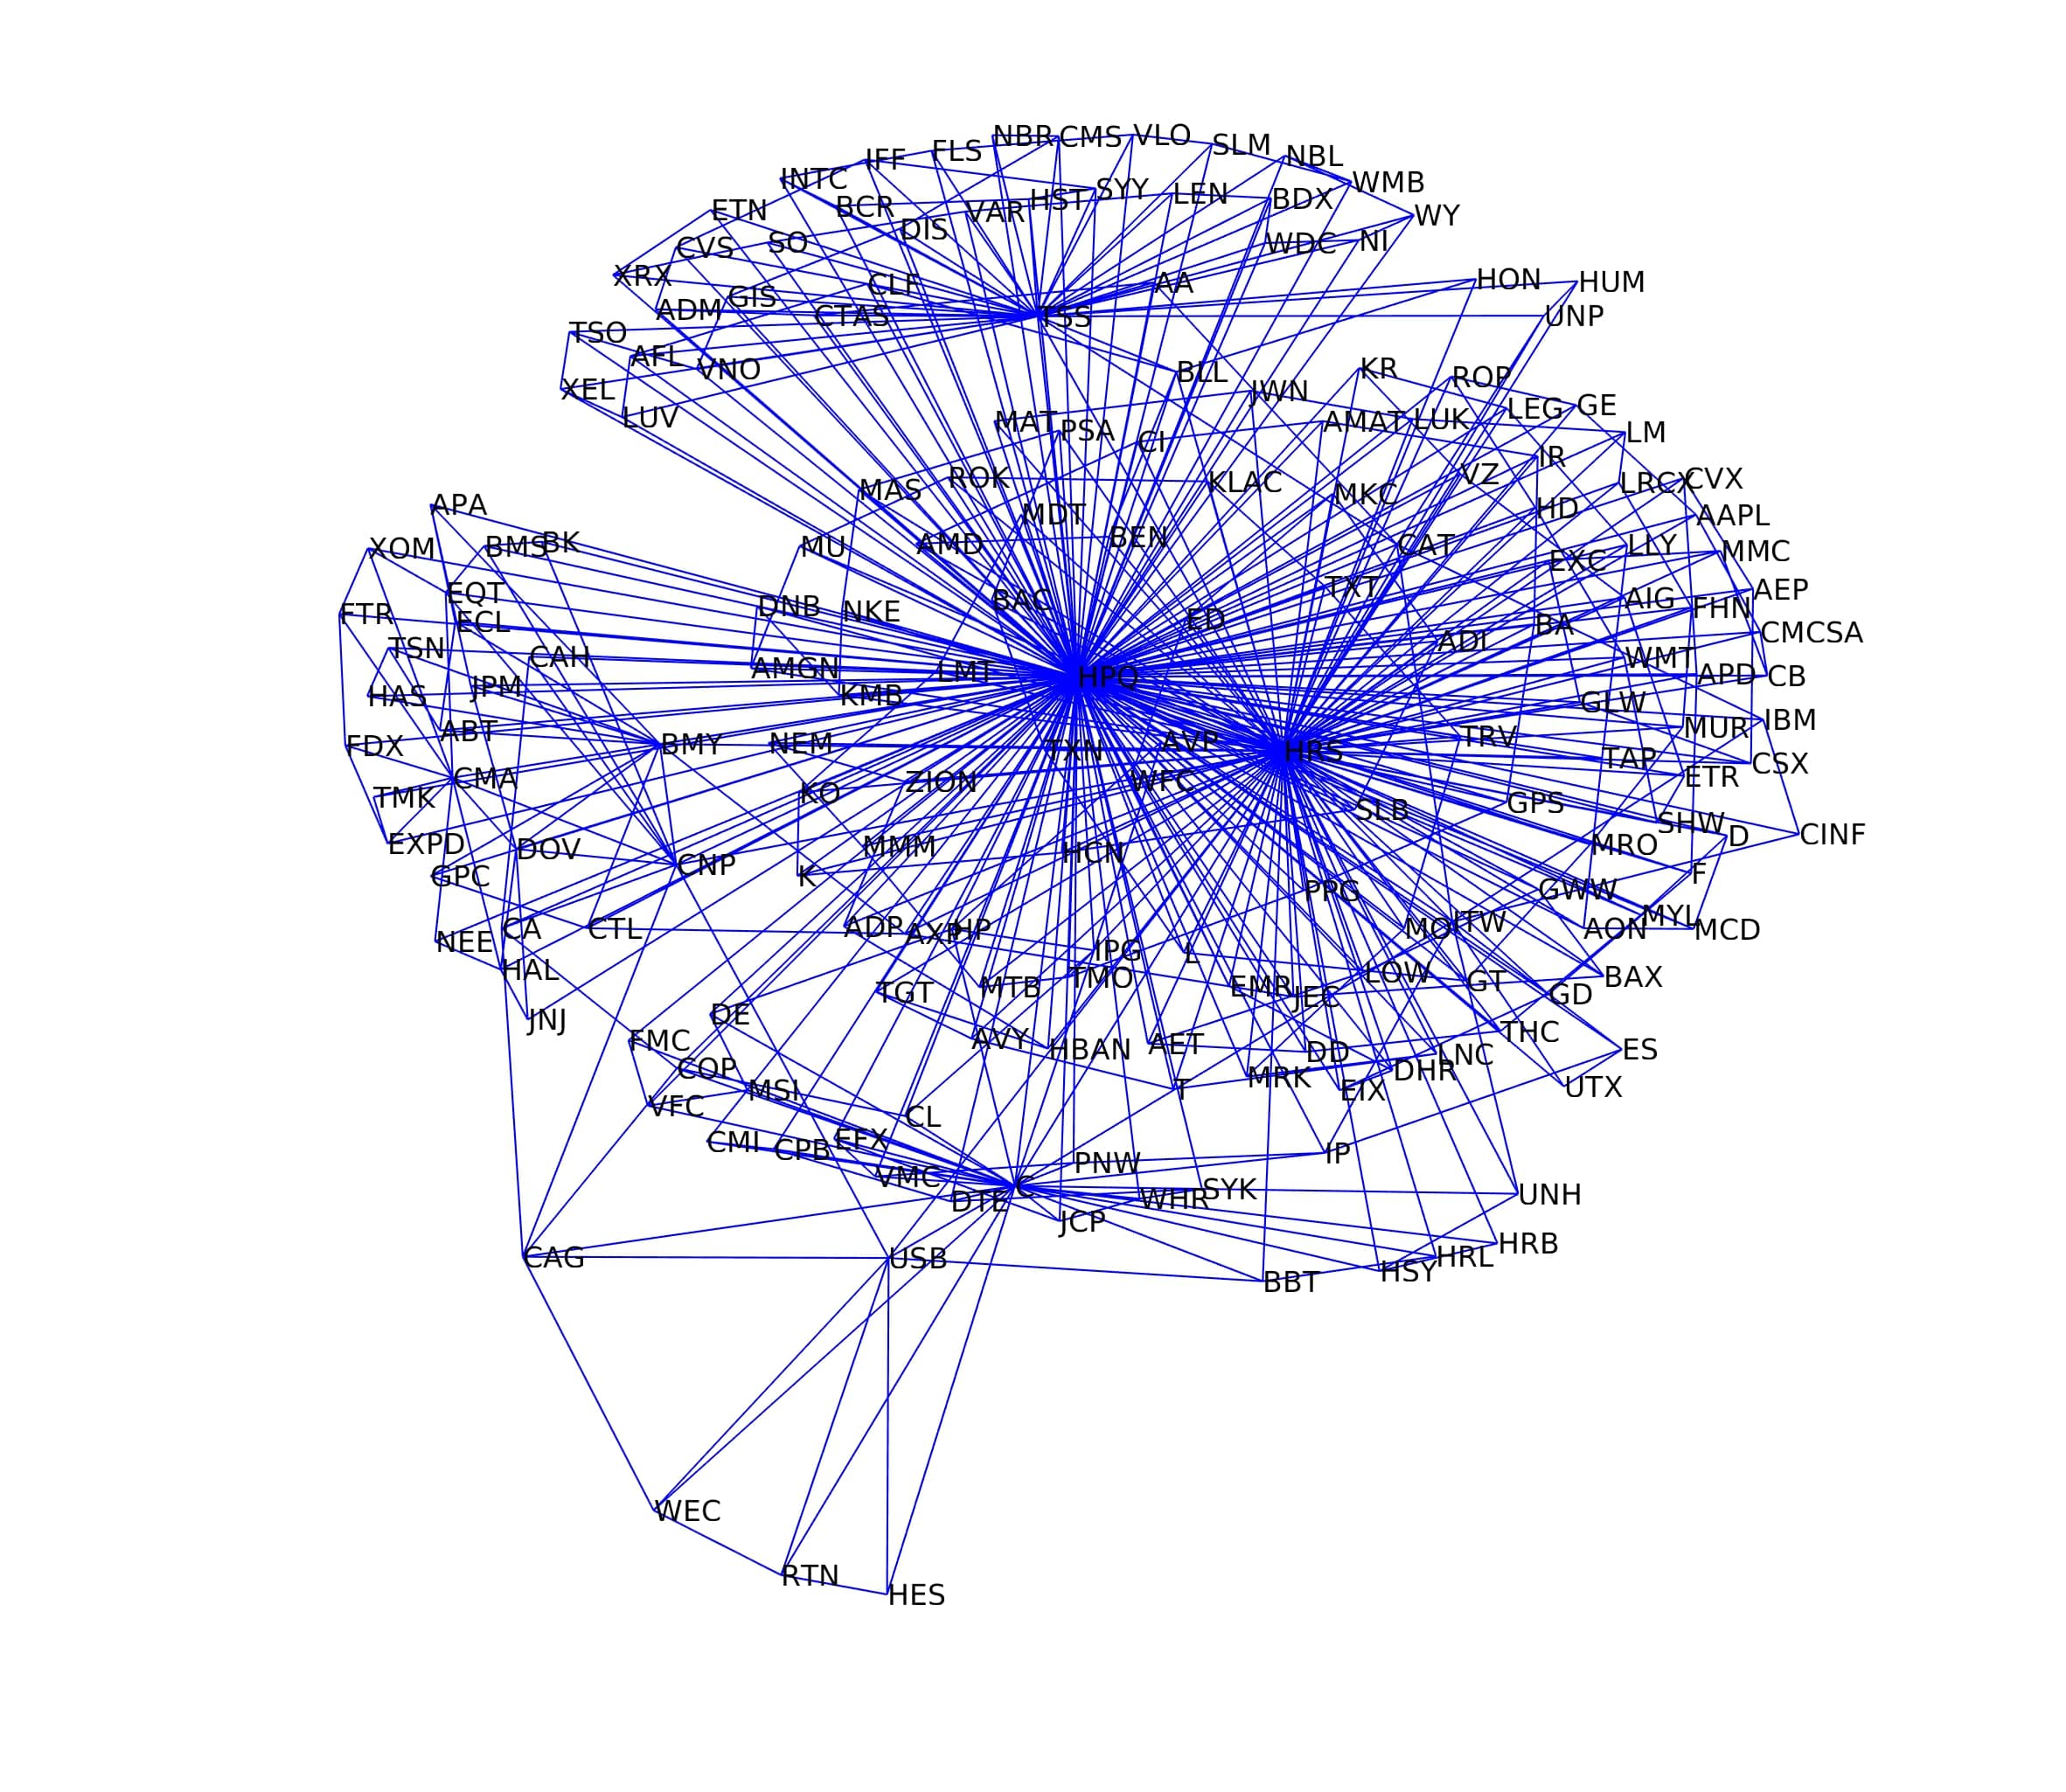
Figure 1 shows the analysis for three periods ending at: (first column) 23/07/1985, (second column) 08/01/2007, and (third column) 17/06/2010. Figure 1A-C show the heat-map of correlation matrices in three different periods, where we have analyzed the S&P 500 market (consisting of stocks) with an epoch of days which is shifted by days from . The corresponding MSTs are shown in Figure 1D-F, which have been generated using the Prim’s algorithm. Different colors in MSTs correspond to different sectors in the market. One can easily view the changes in the structures of MSTs in different periods of market evolution.
Threshold Networks
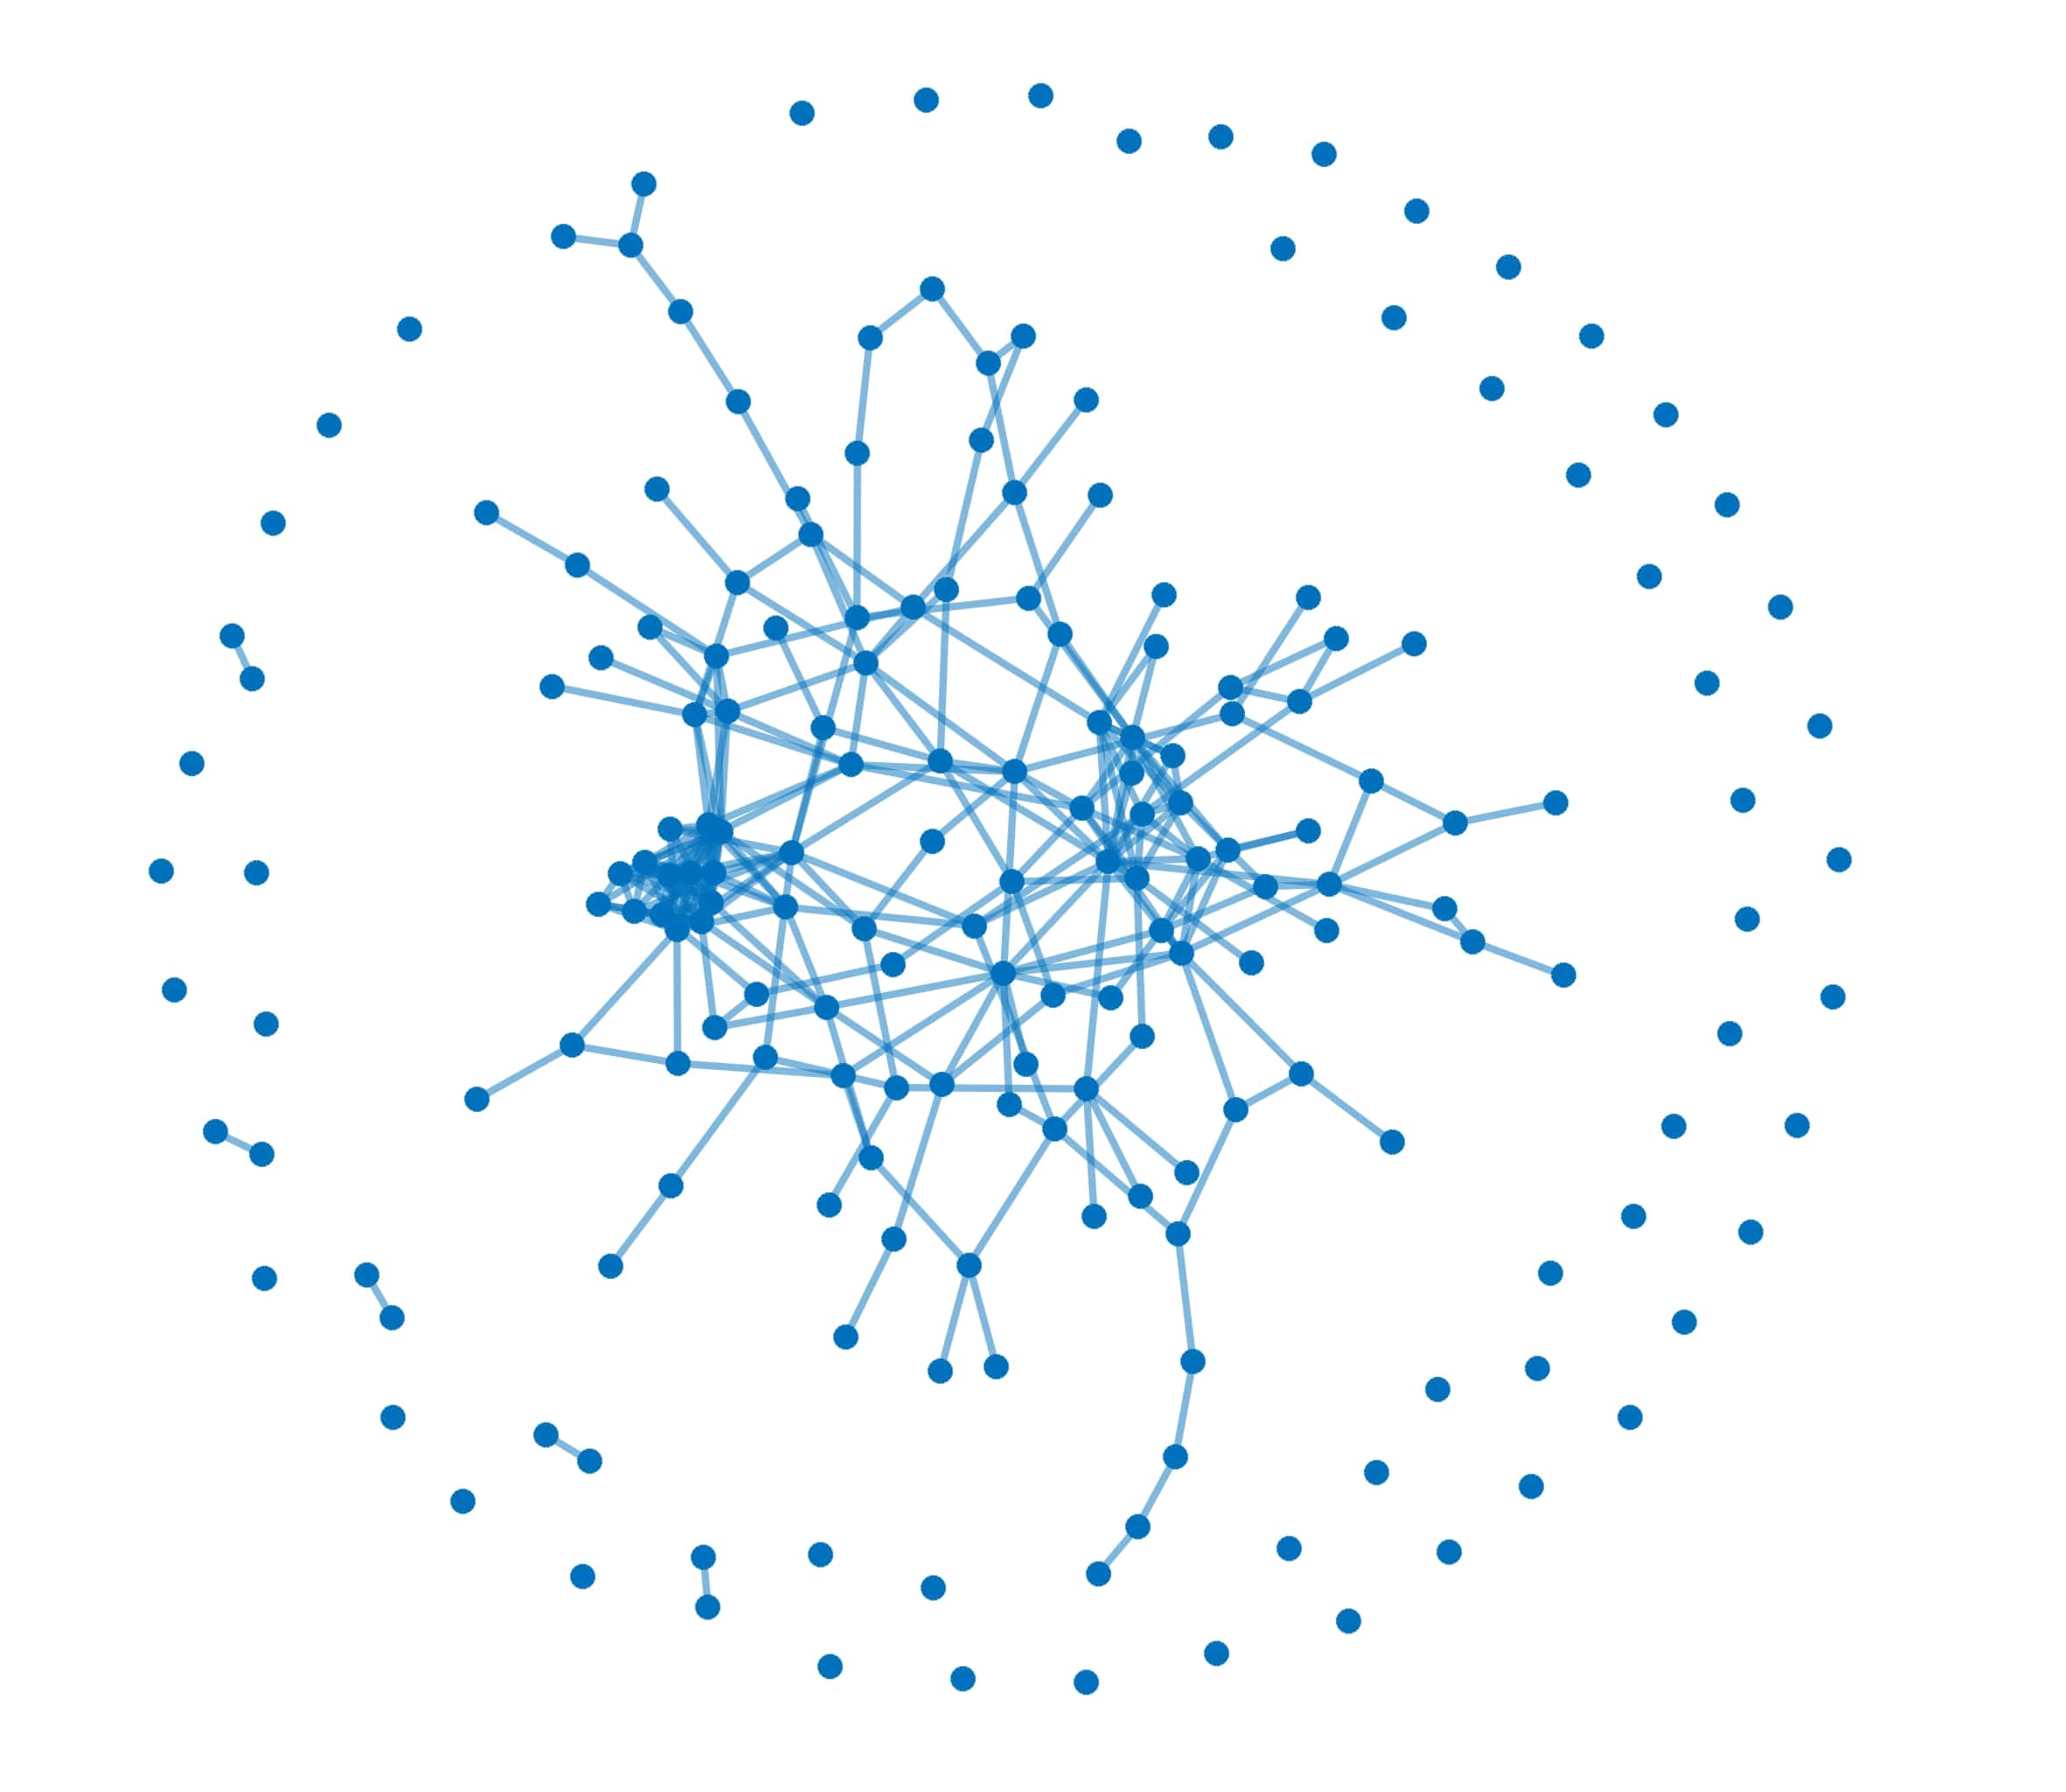
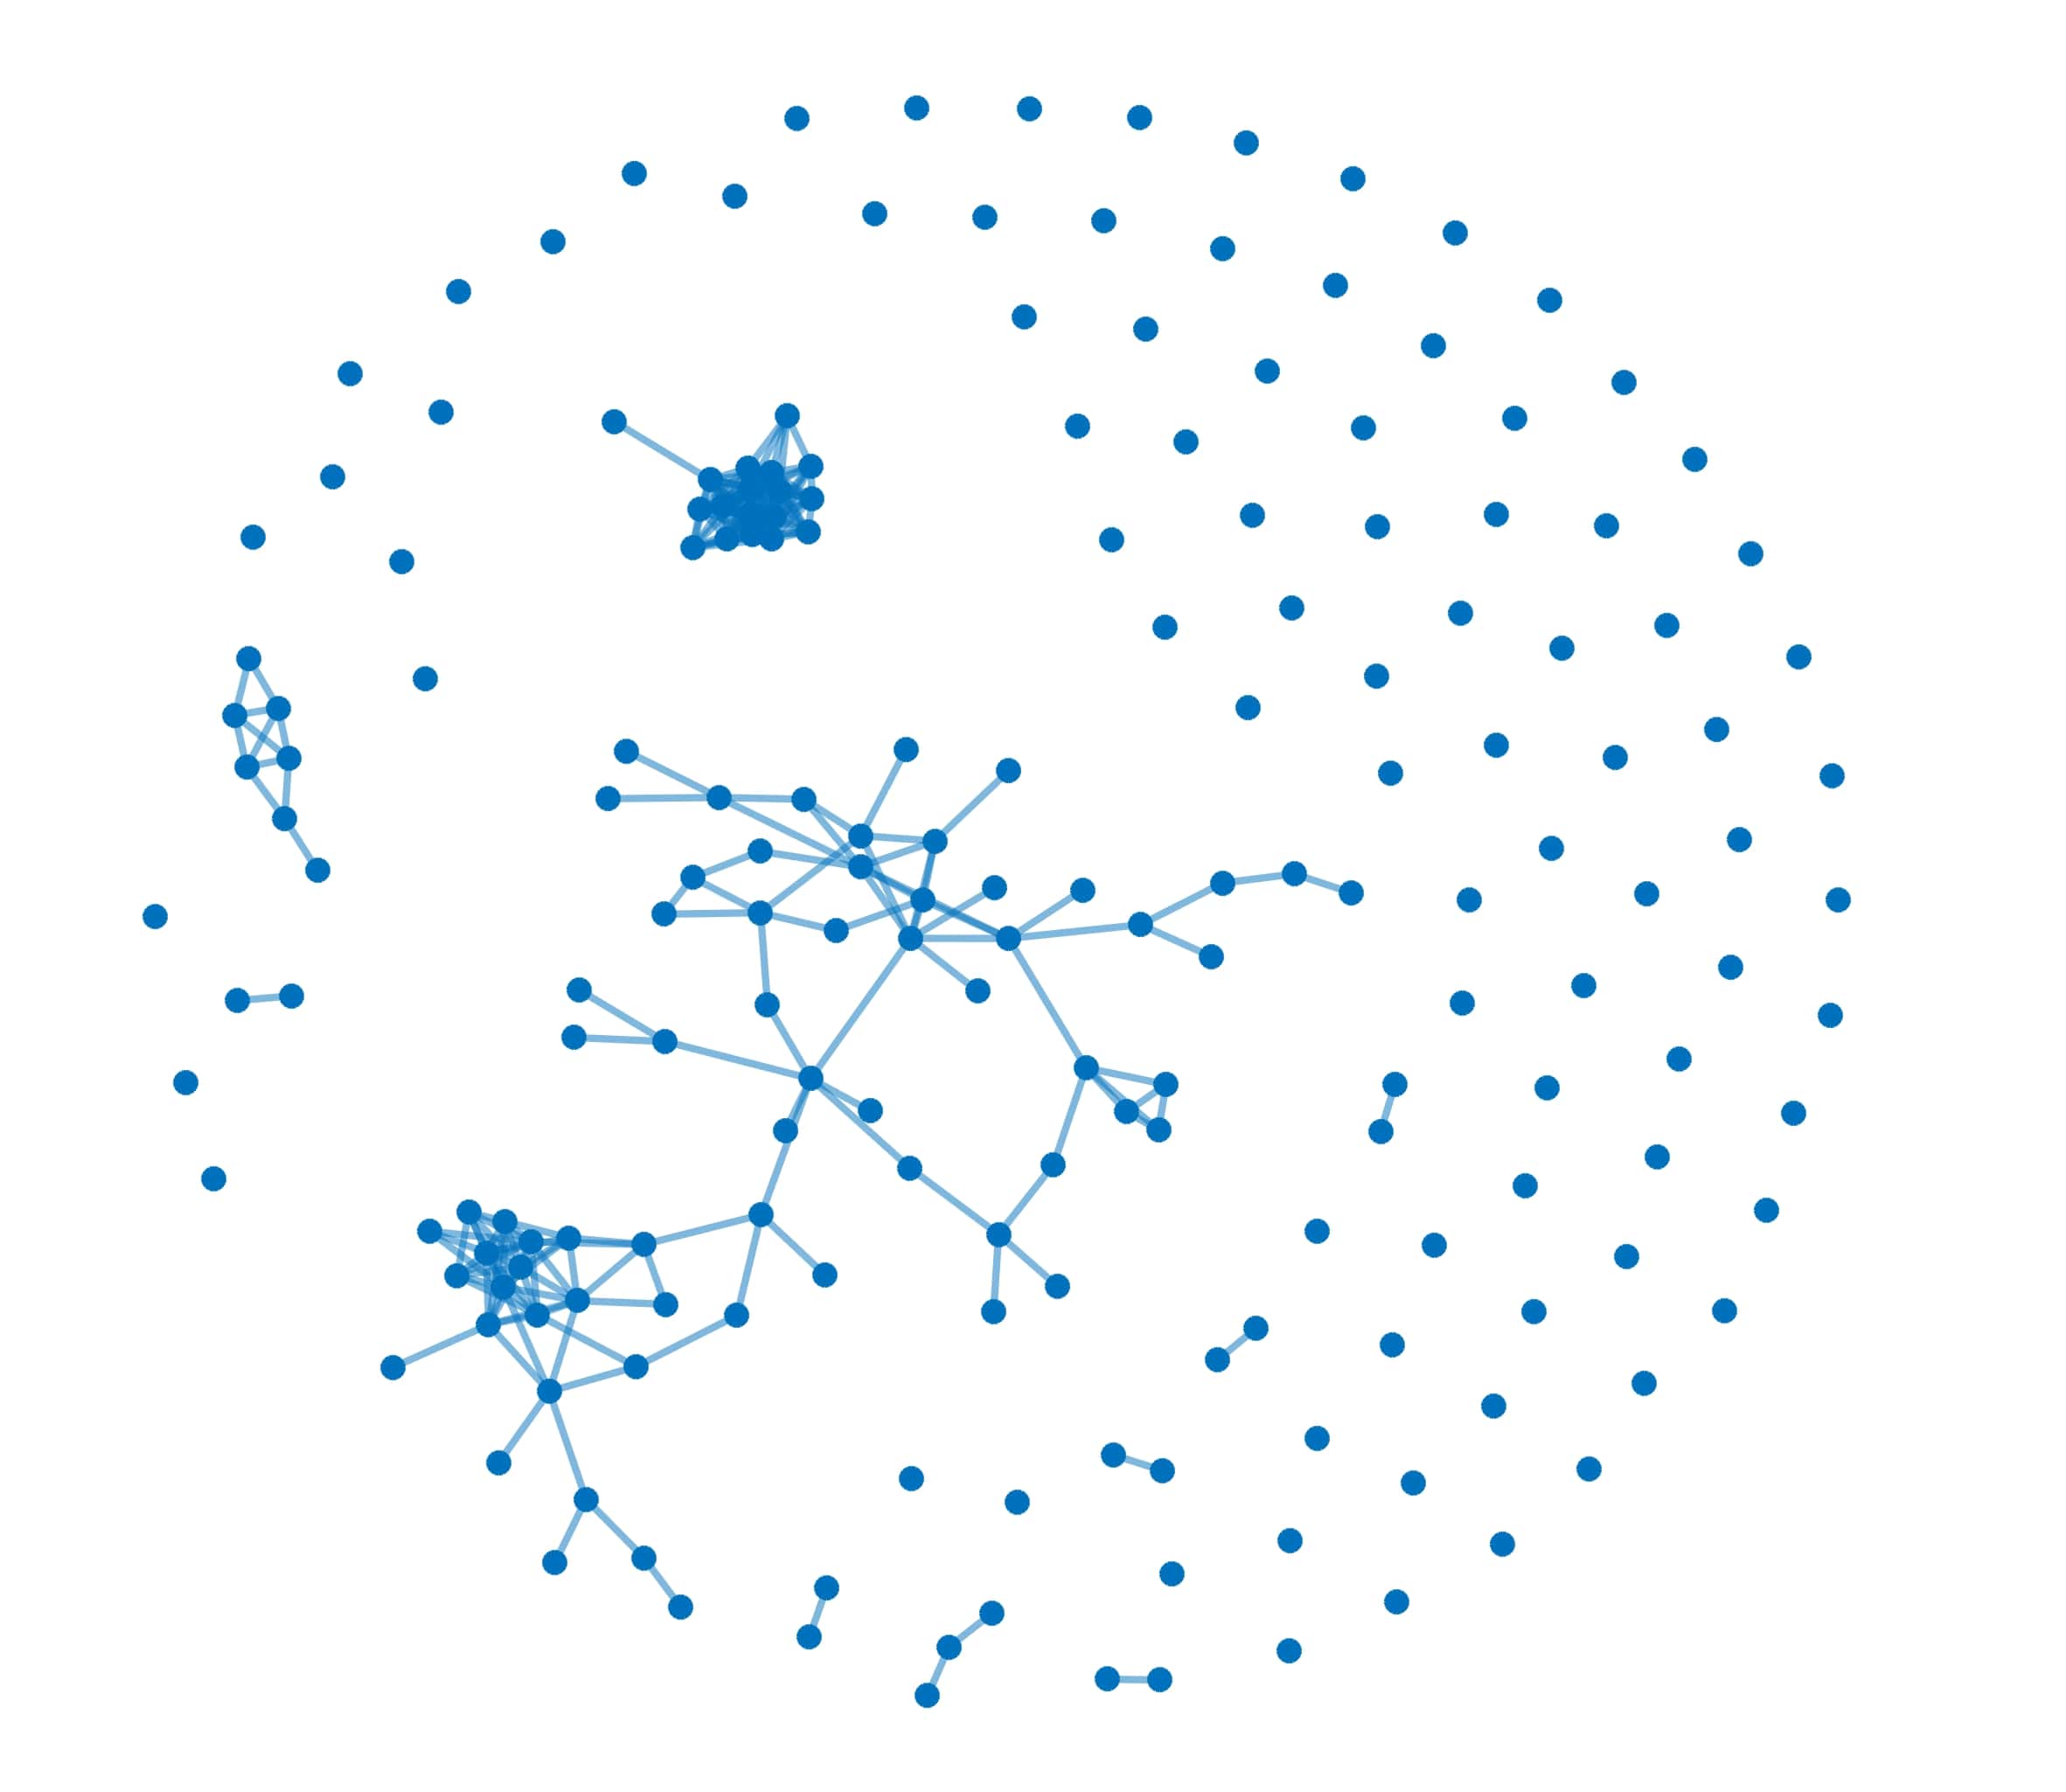
In this approach, an adjacency matrix is constructed by applying a threshold value in the correlation or fixing the number of edges of the network [53]. It filters out the strongest correlations by putting a certain value of threshold and discard all remaining correlations below the value of this threshold. A small threshold value gives rise to a completely connected graph, while increasing value of threshold makes the connections less. Thus, one can tune the threshold in order to get the weakly or strongly connected nodes. For a particular value of threshold, as correlation matrices change with time, the threshold networks also change, as shown in Figure 1G-I corresponding to the ECMs shown in Figure 1A-C. Here the Fruchterman- Reingold (forced-based) layout [54] has been used to visualize the threshold networks.
One drawback of the threshold networks is that there is a loss of information; when we put a threshold value to the correlation matrix we discard some nodes and edges. Also, threshold networks are very sensitive to the noise (random fluctuations). However, threshold networks have been constructed and applied in different areas of finance [55].
Planar Maximally Filtered Graph
PMFG is a network drawn in a plane, such that there are no intersecting links [27, 56]. If is total number of stocks, then it contains links. The PMFG has the advantage that it retains the structure of MST (which contains links) and provides additional information about the connections [44, 43]. However, PMFG has a disadvantage that there exists a certain arbitrariness in its results, as there is an embedding of data from higher dimension to lower dimension with a zero genus. Figure 1J-L show the planar maximally filtered graph of matrices shown in Figure 1A-C. We find significant changes in the structures of PMFGs in different periods of analysis.
Robustness: Noise suppression and community detection
We have seen that many of the correlation-based networks have shown clustering with communities of stocks. Thus, community detection in network science serves as an important technique for extraction of the clustering information from ECM of a multivariate time series. Several community detection algorithms have been proposed [59, 60, 61]. The problem is that different community detection algorithms yield different results for the same ECM. So, often domain knowledge is required to determine what is a sensible or meaningful community.
Further, we have seen that many of the networks are sensitive to noise or spurious correlations. Properties of random matrices [62] have turned out to be useful in reducing noise and thus understanding dynamics of complex systems [63]. An ensemble of random matrices, also known as stationary or standard random (Gaussian) matrix ensemble [62], introduced by Wigner [64, 65], have been applied to many studies in physics, biology, finance, etc. (see Refs. [66, 67, 68, 69] and references therein). The probability distribution of eigenvalues of Wishart orthogonal ensemble (WOE) follows Marcenko-Pastur distribution [70]. The ECM of a complex system is normally compared with WOE [71, 30, 72]. It has been observed from eigenvalues statistics of empirical correlation matrices that the few largest eigenvalues show deviations from the Wishart ensemble. Note that Pearson cross-correlation assumes that the time series are stationary, which are valid for shorter lengths of time series. However, if the number of time series are greater than the lengths of time series, then corresponding ECMs are noisy and highly singular. For such short time series, there is a great need of noise suppression in correlation matrix to extract actual correlations. There are different techniques for suppressing the noise in correlation matrix [73, 74, 75, 76]. Notably, any ECM of financial market can be decomposed into partial correlations, consisting of market , group and random modes, respectively [77, 78]. It enables us to identify the dominant stocks, sectors and inherent structures of the market. Recently, detailed analyses of ECMs using these approaches have been carried out to understand the complexity in dynamics of stock market [23, 63, 79]. It has been found that during the crisis, the eigenvalue spectrum behaves very differently from one corresponding to a normal period.
ENTROPY MEASURES
Entropy measures provide an easy way for continuous monitoring of the financial market, and also prove useful in various other applications in finance, as summarized below.
Phillippatos and Wilson had used entropy in selection of possible efficient portfolios by applying a mean-entropy approach on a randomly selected 50 securities over 14 years [80]. Using a hybrid entropy model, Xu et al. have evaluated the asset risk due to the randomness of the system [81]. In 1996, Buchen and Kelly used the principle of maximum entropy for option pricing to estimate the distribution [82], which fitted accurately with a known probability density function. The principle of the minimum cross-entropy principle (MCEP) has been very useful in finance, which was developed by Kullback and Leibler [83]. Later, Frittelli discovered sufficient conditions to give a interpretation of the minimal entropy martingale measure [84].
Entropy has also been used to understand the financial hazards as well as to construct an early warning indicator for predicting systematic risks [85, 86]. Maasoumi and Racine examined the predictability of the market returns using entropy measure and found that it is capable to detect the nonlinear dependence within the time series of market returns as well as between returns and other prediction variables obtained from other models [87]. Recently, Ricci curvature and entropy have been used to construct an economic indicator for market fragility and systemic risk [88]. Very recently, Almog et al. presented a perspective on the use of entropy measures such as structural entropy [89], which is computed from the communities in correlation-based networks. Chakraborti et al. computed the eigen-entropy from the eigen-vector centrality of the stocks in the correlation-based network [90]. Below, we compare the structural entropy [89] and eigen-entropy [90].
Structural Entropy
Recently, the concept of Structural Entropy (SE) has been used in monitoring the dynamical correlation based networks of financial market [89]. The SE resolved the problem of choosing different period of crisis and extracting substantial information from the large network of stock market. The SE measures the amount of heterogeneity of the network nodes with an assumption that more connected nodes share common attributes than others. The authors assume the nature of clusters as independent sub-units of the network. The process of calculating the structural entropy involves two steps: (i) Calculation of an optimal partition function which places every node in a certain cluster using a community detection algorithm. (ii) Analysing the partition function and extracting the representative value of the diversity level. Consider a network with nodes. The community detection algorithm partitions nodes in communities. Let denote the -dimensional vector where the -th component denotes the community assigned to node . Calculate -dimensional probability vector , where is the size of community . It is proportional size of the cluster in the network. Then, the formula for Shannon’s entropy is in terms of probability vector . Structural entropy of the network provides a way to continuously monitor the state of the network. However, it is sensitive to the choice of community detection algorithm employed in detecting communities. This arbitrariness makes the calculation of entropy dependent on the choice of the user and hence is not universal.
Eigen-entropy
Very recently, the concept of eigen-entropy was used in studying financial markets[90]. It is computed from eigenvector centrality of the network obtained from the short time series correlation matrices [91, 90]. In order to capture the global feature of the network, every node is ranked by its eigenvector centrality and then entropy formula from information theory is used to compute eigen-entropy. Let graph consisting of vertices and edges . Let be the adjacency matrix for with , if edge connection to vertices and are present and , if they are not. The sum of all the centralities connected to the vertices is proportional to centrality of the vertex. The adjacency matrix satisfies the matrix equation , where is the largest eigenvalue of . is a symmetric positive semi-definite matrix with all non-negative eigenvalues and orthogonal eigenvectors. According to the Perron-Frobenius theorem, any square matrix with all positive entries has a unique solution corresponding to the maximum eigenvalue and its eigenvector with all positive components. Then component of the corresponding eigenvector gives the relative eigen-centrality score of the node in the network. For an absolute score one must normalize the eigenvector, i.e., . The disorderness and randomness of the system uniquely be measured by eigen-entropy and defined as . Higher the disorder of the system higher the eigen-entropy.
Empirical correlation matrix of the market can be decomposed in two logical ways: (i) into three separated modes i.e. market mode , the group mode and the random mode , where it is arbitrary to chose the range of eigenvalue corresponding to the group mode and the random mode and (ii) into a market mode and group-random modes , with no arbitrariness in the system. is the preferable decomposition and corresponding eigen-entropy and and calculated as (matrix element-wise) and (matrix element-wise), respectively. The eigen-entropy computed using above method gives a simple yet robust measure to quantify the randomness of the financial market without using any arbitrary thresholds. Further Charkraborti et al. investigated the relative-entropy which separates the phase space based on their disorder [90]. The evolution dyanamics of these relative entropies in the phase space show phase-separation with possible order-disorder transitions. These results are certainly of deep significance for the understanding of financial market behavior and designing strategies for risk management.
A
B
C
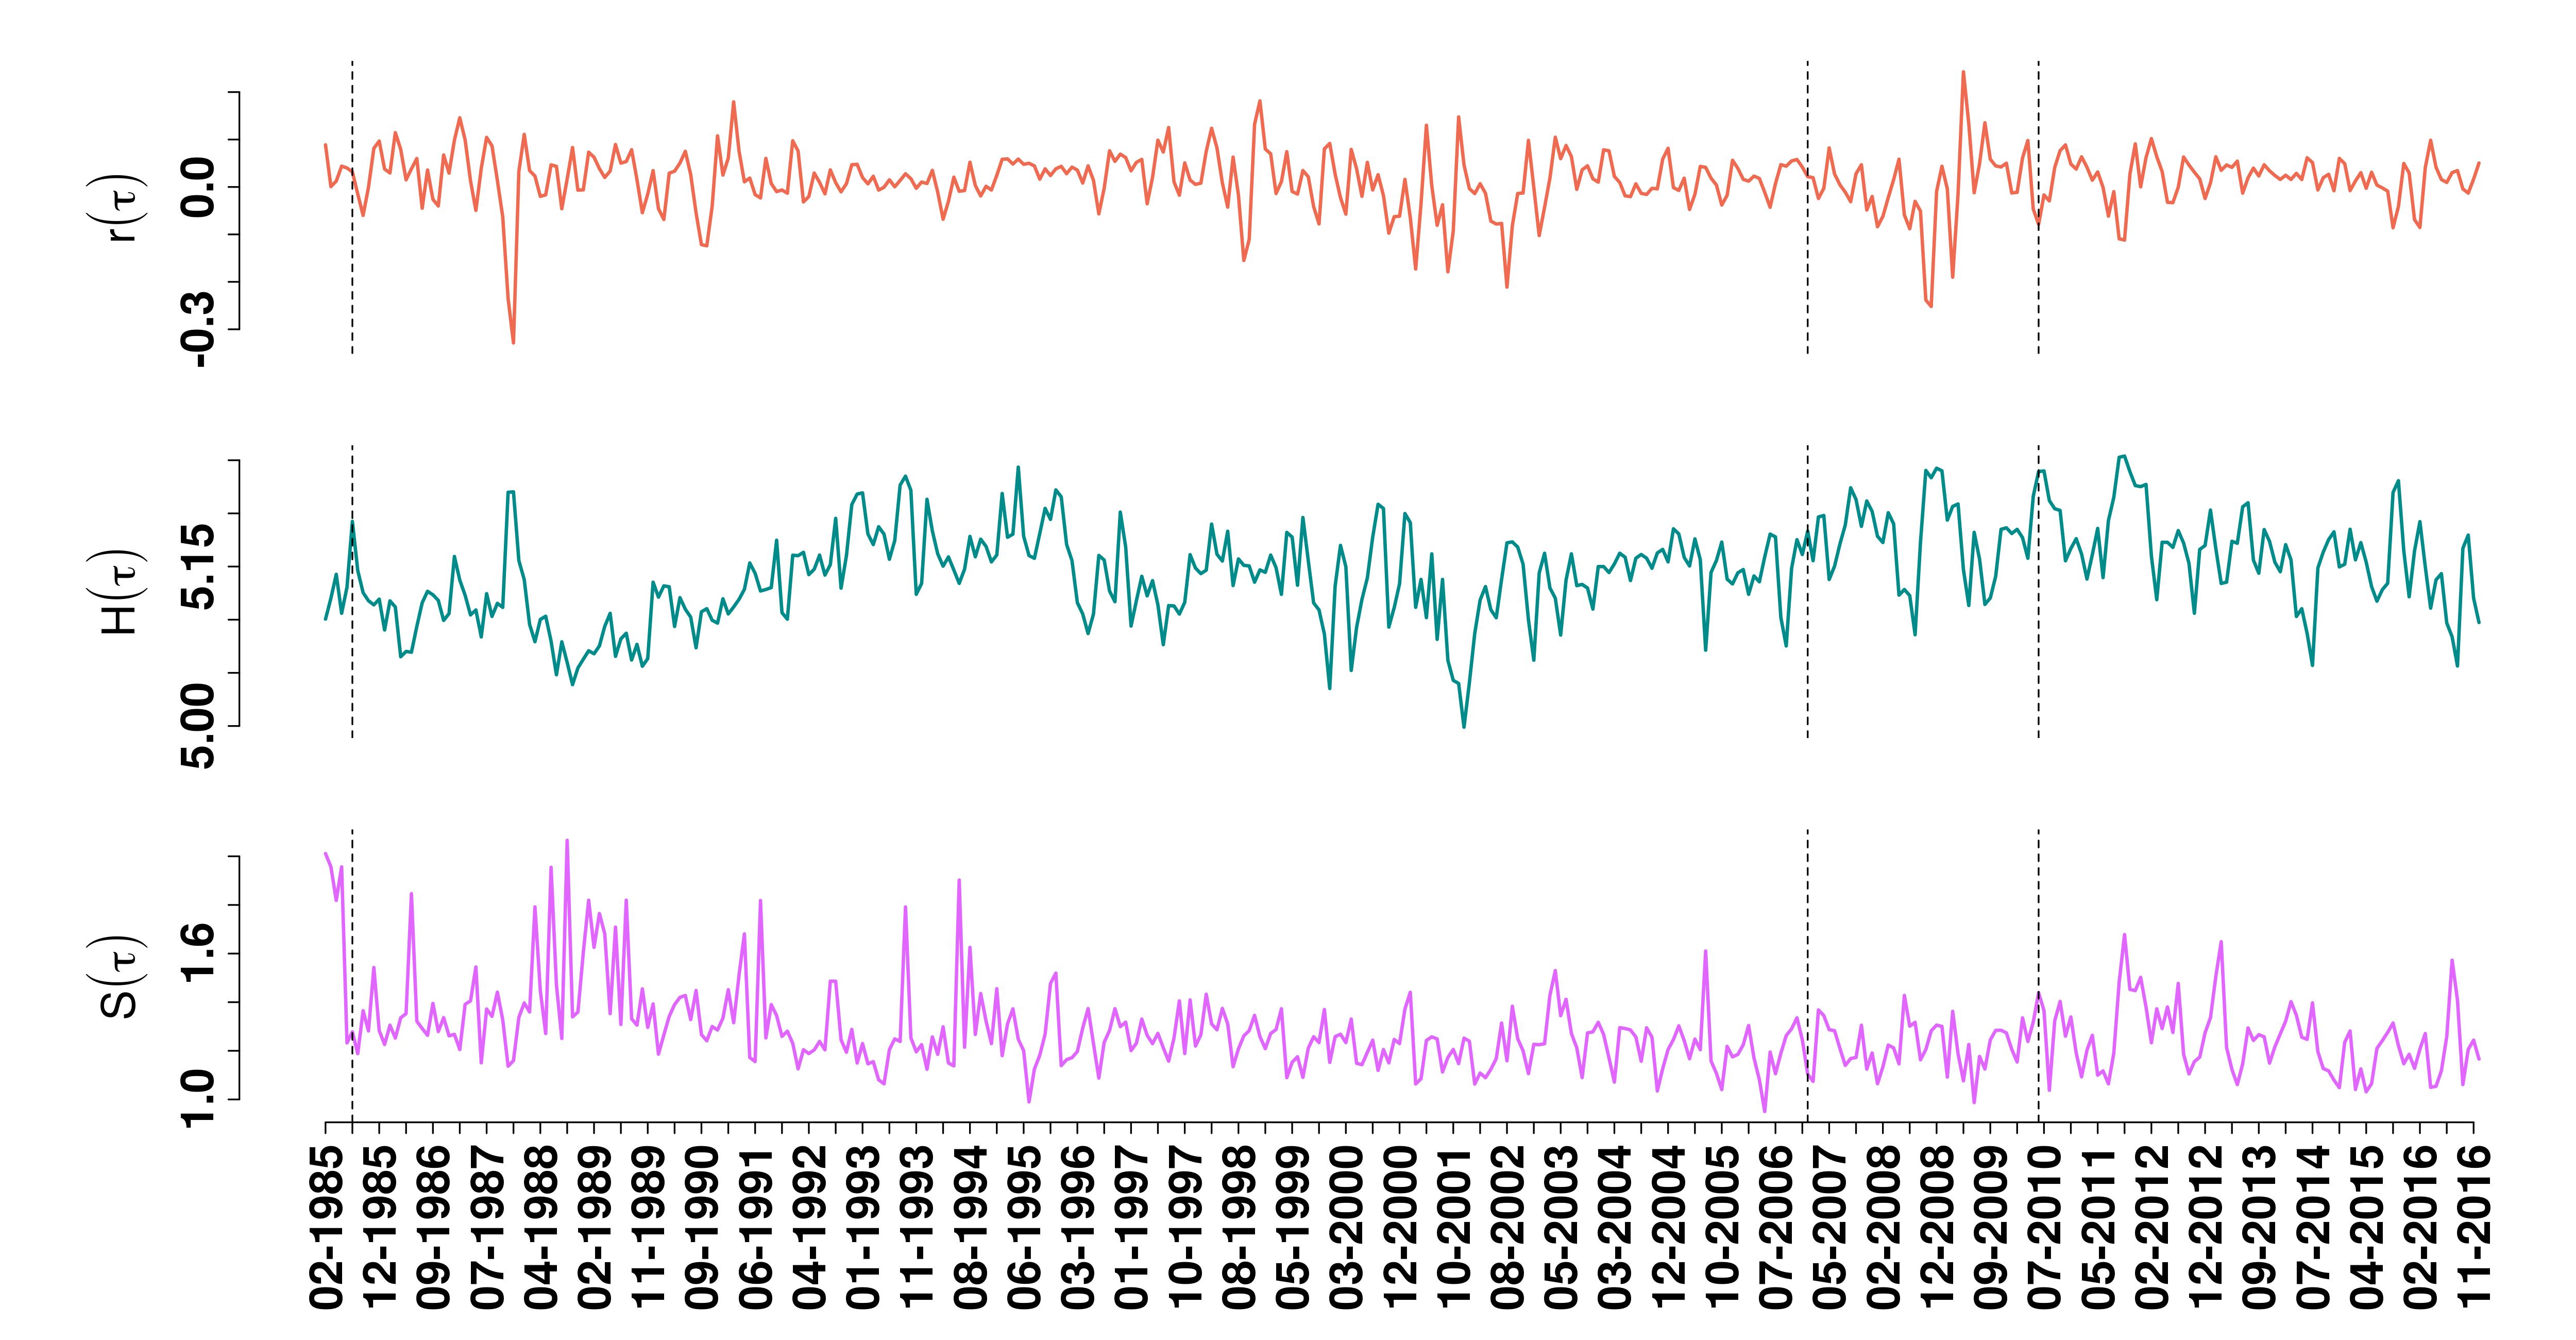
Figure 2 shows how the entropy measures can be used for continuous monitoring of the financial markets. Figure 2A-C show the evolution of S&P 500 market over a period of for index returns , eigen-entropies , and structural entropy , respectively. Three vertical dashed line are corresponding to epochs ending at 23/07/1985, 08/01/2007, and 17/06/2010.
CONCLUDING REMARKS
In this review, we have discussed different methods for analysis of static and dynamic correlation-based networks of financial markets, and also studied how entropy measures can be used to identify normal, bubble, and crash periods. Specifically, we have compared the recently developed concepts of structural entropy and eigen-entropy.
The prediction of collapses of financial markets using traditional economic theories has been a daunting task. These new and alternate methods have the potential use of continuous monitoring and understanding of the complex structures and dynamics of financial markets. These are a few of the attempts physicists have made for generation of early warning signals for crisis, and these methods can be used for timely intervention.
CONFLICT OF INTEREST STATEMENT
The authors declare that the research was conducted in the absence of any commercial or financial relationships that could be construed as a potential conflict of interest.
AUTHOR CONTRIBUTIONS
SK and HKP designed the idea, wrote the main manuscript text and prepared figures. VK and PG contributed to the literature review. All authors reviewed the manuscript.
ACKNOWLEDGEMENTS
The authors are grateful to Anirban Chakraborti, Hrishidev, Suchetana Sadhukhan, Kiran Sharma and Thomas H. Seligman for their critical inputs. HKP acknowledges postdoctoral fellowship provided by UNAM-DGAPA. This research was supported in part by the International Centre for Theoretical Sciences (ICTS) during a visit of VK, PG and SK for participating in the Summer research program on Dynamics of Complex Systems (Code: ICTS/Prog-DCS2019/07). The topic editors are acknowledged for supporting this open access publication.
References
- [1] Boccaletti, S., Latora, V., Moreno, Y., Chavez, M. & Hwang, D.-U. Complex networks: Structure and dynamics. Physics Reports 424, 175–308 (2006). DOI 10.1016/j.physrep.2005.10.009.
- [2] Jackson, M. O. Social and economic networks (Princeton University Press, 2010).
- [3] Barabási, A.-L. Network Science (Cambridge university press, 2016).
- [4] Erdős, P. & Rényi, A. On random graphs i. Publicationes Mathematicae Debrecen 6, 290 (1959).
- [5] Erdős, P. & Rényi, A. On the evolution of random graphs. Publ. Math. Inst. Hung. Acad. Sci 5, 17–60 (1960).
- [6] Watts, D. J. & Strogatz, S. H. Collective dynamics of ‘small-world’networks. Nature 393, 440 (1998). DOI 10.1038/30918.
- [7] Barabási, A.-L. & Albert, R. Emergence of scaling in random networks. Science 286, 509–512 (1999). DOI 10.1126/science.286.5439.509.
- [8] Barrat, A., Barthelemy, M. & Vespignani, A. Dynamical processes on complex networks (Cambridge University Press, 2008).
- [9] Caldarelli, G. Scale-free networks: complex webs in nature and technology (Oxford University Press, 2007).
- [10] Newman, M. Networks: An Introduction (Oxford University Press, 2010).
- [11] Albert, R. & Barabási, A.-L. Statistical mechanics of complex networks. Reviews of Modern Physics 74, 47 (2002). DOI 10.1103/RevModPhys.74.47.
- [12] Newman, M. E. The structure and function of complex networks. SIAM Review 45, 167–256 (2003). DOI 10.1016/S0010-4655(02)00201-1.
- [13] Boccaletti, S., Latora, V., Moreno, Y., Chavez, M. & Hwang, D.-U. Complex networks: Structure and dynamics. Physics Reports 424, 175–308 (2006). DOI 10.1016/j.physrep.2005.10.009.
- [14] Lancichinetti, A. & Fortunato, S. Consensus clustering in complex networks. Scientific Reports 2, 336 (2012). DOI 10.1038/srep00336.
- [15] Gao, J., Barzel, B. & Barabási, A.-L. Universal resilience patterns in complex networks. Nature 530, 307–312 (2016). DOI 10.1038/nature16948.
- [16] Bian, T. & Deng, Y. Identifying influential nodes in complex networks: A node information dimension approach. Chaos: An Interdisciplinary Journal of Nonlinear Science 28, 043109 (2018). DOI 10.1063/1.5030894.
- [17] Pal, H., Seligman, T. H. & Escobar, J. V. Correlation networks from random walk time series. Physical Review E 98, 032311 (2018). DOI 10.1103/PhysRevE.98.032311.
- [18] Brockmann, D. & Helbing, D. The hidden geometry of complex, network-driven contagion phenomena. Science 342, 1337–1342 (2013). DOI 10.1126/science.1245200.
- [19] Hidalgo, C. A. & Hausmann, R. The building blocks of economic complexity. Proceedings of the National Academy of Sciences 106, 10570–10575 (2009). DOI 10.1073/pnas.0900943106.
- [20] Tacchella, A., Cristelli, M., Caldarelli, G., Gabrielli, A. & Pietronero, L. A new metrics for countries’ fitness and products’ complexity. Scientific Reports 2, 723 (2012). DOI 10.1038/srep00723.
- [21] Münnix, M. C. et al. Identifying states of a financial market. Scientific Reports 2, 644 (2012). DOI 10.1038/srep00644.
- [22] Battiston, S., Puliga, M., Kaushik, R., Tasca, P. & Caldarelli, G. Debtrank: Too central to fail? financial networks, the fed and systemic risk. Scientific Reports 2, 541 (2012). DOI 10.1038/srep00541.
- [23] Pharasi, H. K. et al. Identifying long-term precursors of financial market crashes using correlation patterns. New Journal of Physics 20, 103041 (2018). DOI 10.1088/1367-2630/aae7e0.
- [24] Reis, S. D. et al. Avoiding catastrophic failure in correlated networks of networks. Nature Physics 10, 762–767 (2014). DOI 10.1038/nphys3081.
- [25] Mantegna, R. N. Information and hierarchical structure in financial markets. Computer Physics Communications 121-122, 153 – 156 (1999). DOI 10.1016/S0010-4655(99)00302-1.
- [26] Mantegna, R. N. Hierarchical structure in financial markets. The European Physical Journal B-Condensed Matter and Complex Systems 11, 193–197 (1999). DOI 10.1016/S0010-4655(99)00302-1.
- [27] Tumminello, M., Aste, T., Di Matteo, T. & Mantegna, R. N. A tool for filtering information in complex systems. Proceedings of the National Academy of Sciences 102, 10421–10426 (2005). DOI 10.1073/pnas.0500298102.
- [28] Battiston, S. et al. Complexity theory and financial regulation. Science 351, 818–819 (2016). DOI 10.1126/science.aad0299.
- [29] Onnela, J.-P., Chakraborti, A., Kaski, K. & Kertiész, J. Dynamic asset trees and portfolio analysis. The European Physical Journal B-Condensed Matter and Complex Systems 30, 285–288 (2002). DOI 10.1140/epjb/e2002-00380-9.
- [30] Onnela, J.-P., Chakraborti, A., Kaski, K., Kertesz, J. & Kanto, A. Dynamics of market correlations: Taxonomy and portfolio analysis. Physical Review E 68, 056110 (2003). DOI 10.1103/PhysRevE.68.056110.
- [31] Bonanno, G., Caldarelli, G., Lillo, F. & Mantegna, R. N. Topology of correlation-based minimal spanning trees in real and model markets. Physical Review E 68, 046130 (2003). DOI 10.1103/PhysRevE.68.046130.
- [32] Shanker, O. Defining dimension of a complex network. Modern Physics Letters B 21, 321–326 (2007). DOI 10.1142/S0217984907012773.
- [33] Shanker, O. Graph zeta function and dimension of complex network. Modern Physics Letters B 21, 639–644 (2007). DOI 10.1142/S0217984907013146.
- [34] Kumar, S. & Deo, N. Correlation and network analysis of global financial indices. Physical Review E 86, 026101 (2012). DOI 10.1103/PhysRevE.86.026101.
- [35] Nobi, A., Maeng, S. E., Ha, G. G. & Lee, J. W. Network topologies of financial market during the global financial crisis. arXiv preprint arXiv:1307.6974 (2013).
- [36] Bonanno, G., Caldarelli, G., Lillo, F. & Mantegna, R. N. Topology of correlation-based minimal spanning trees in real and model markets. Physical Review E 68, 046130 (2003). DOI 10.1103/PhysRevE.68.046130.
- [37] Bonanno, G. et al. Networks of equities in financial markets. The European Physical Journal B 38, 363–371 (2004). DOI 10.1140/epjb/e2004-00129-6.
- [38] Tumminello, M., Lillo, F. & Mantegna, R. N. Correlation, hierarchies, and networks in financial markets. Journal of Economic Behavior & Organization 75, 40–58 (2010). DOI 10.1016/j.jebo.2010.01.004. Transdisciplinary Perspectives on Economic Complexity.
- [39] Sharma, K., Gopalakrishnan, B., Chakrabarti, A. S. & Chakraborti, A. Financial fluctuations anchored to economic fundamentals: A mesoscopic network approach. Scientific Reports 7, 8055 (2017). DOI 10.1038/s41598-017-07758-9.
- [40] Jang, W., Lee, J. & Chang, W. Currency crises and the evolution of foreign exchange market: Evidence from minimum spanning tree. Physica A: Statistical Mechanics and its Applications 390, 707–718 (2011). DOI 10.1016/j.physa.2010.10.028.
- [41] McDonald, M., Suleman, O., Williams, S., Howison, S. & Johnson, N. F. Detecting a currency’s dominance or dependence using foreign exchange network trees. Physical Review E 72, 046106 (2005). DOI 10.1103/PhysRevE.72.046106.
- [42] Plerou, V., Gopikrishnan, P., Rosenow, B., Amaral, L. N. & Stanley, H. E. A random matrix theory approach to financial cross-correlations. Physica A: Statistical Mechanics and its Applications 287, 374–382 (2000). DOI 10.1016/S0378-4371(00)00376-9.
- [43] Aste, T., Di Matteo, T. & Hyde, S. Complex networks on hyperbolic surfaces. Physica A: Statistical Mechanics and its Applications 346, 20–26 (2005). DOI 10.1016/j.physa.2004.08.045.
- [44] Tumminello, M., Aste, T., Di Matteo, T. & Mantegna, R. N. A tool for filtering information in complex systems. Proceedings of the National Academy of Sciences 102, 10421–10426 (2005). DOI 10.1073/pnas.0500298102.
- [45] Song, W.-M., Di Matteo, T. & Aste, T. Nested hierarchies in planar graphs. Discrete App Math. 159, 2135–2146 (2011). DOI 10.1016/j.dam.2011.07.018.
- [46] Song, W.-M., Di Matteo, T. & Aste, T. Hierarchical information clustering by means of topologically embedded graphs. PLoS One 7, e31929 (2012). DOI 10.1371/journal.pone.0031929.
- [47] Tumminello, M., Di Matteo, T., Aste, T. & Mantegna, R. N. Correlation based networks of equity returns sampled at different time horizons. The European Physical Journal B 55, 209–217 (2007). DOI 10.1140/epjb/e2006-00414-4.
- [48] Kenett, D. Y. et al. Dominating clasp of the financial sector revealed by partial correlation analysis of the stock market. PloS One 5, e15032 (2010). DOI 10.1371/journal.pone.0015032.
- [49] Kenett, D. Y. et al. Dynamics of stock market correlations. AUCO Czech Economic Review 4, 330–341 (2010).
- [50] Onnela, J.-P., Kaski, K. & Kertész, J. Clustering and information in correlation based financial networks. The European Physical Journal B 38, 353–362 (2004). DOI 0.1140/epjb/e2004-00128-7.
- [51] Onnela, J.-P., Chakraborti, A., Kaski, K., Kertesz, J. & Kanto, A. Dynamics of market correlations: Taxonomy and portfolio analysis. Physical Review E 68, 056110 (2003). DOI 10.1103/PhysRevE.68.056110.
- [52] Onnela, J.-P., Chakraborti, A., Kaski, K. & Kertesz, J. Dynamic asset trees and black monday. Physica A: Statistical Mechanics and its Applications 324, 247–252 (2003). DOI 10.1016/S0378-4371(02)01882-4.
- [53] Yang, Y. & Yang, H. Complex network-based time series analysis. Physica A: Statistical Mechanics and its Applications 387, 1381–1386 (2008). DOI 10.1016/j.physa.2007.10.055.
- [54] Fruchterman, T. M. & Reingold, E. M. Graph drawing by force-directed placement. Software: Practice and experience 21, 1129–1164 (1991). DOI 10.1002/spe.4380211102.
- [55] Wang, R.-S., Zhang, S., Wang, Y., Zhang, X.-S. & Chen, L. Clustering complex networks and biological networks by nonnegative matrix factorization with various similarity measures. Neurocomputing 72, 134–141 (2008). DOI 10.1016/j.neucom.2007.12.043.
- [56] Nie, C.-x. & Song, F.-t. Relationship between entropy and dimension of financial correlation-based network. Entropy 20, 177 (2018). DOI 10.3390/e20030177.
- [57] Nie, C.-X. Dynamics of cluster structure in financial correlation matrix. Chaos, Solitons & Fractals (2017). DOI 10.1016/j.chaos.2017.05.039.
- [58] Sui, G., Li, H., Feng, S., Liu, X. & Jiang, M. Correlations of stock price fluctuations under multi-scale and multi-threshold scenarios. Physica A: Statistical Mechanics and its Applications 490, 1501–1512 (2018). DOI 10.1016/j.physa.2017.08.141.
- [59] MacMahon, M. & Garlaschelli, D. Community detection for correlation matrices. Physical Review X 5, 021006 (2015). DOI 10.1103/PhysRevX.5.021006.
- [60] Laloux, L., Cizeau, P., Bouchaud, J.-P. & Potters, M. Noise dressing of financial correlation matrices. Physical Review Letters 83, 1467–1470 (1999). DOI 10.1103/PhysRevLett.83.1467.
- [61] Fortunato, S. Community detection in graphs. Physics Reports 486, 75–174 (2010). DOI 10.1016/j.physrep.2009.11.002.
- [62] Mehta, M. L. Random Matrices (Academic Press, 2004).
- [63] Pharasi, H. K., Sharma, K., Chakraborti, A. & Seligman, T. H. Complex market dynamics in the light of random matrix theory. In New Perspectives and Challenges in Econophysics and Sociophysics, 13–34 (Springer, Cham, 2019).
- [64] Wigner, E. P. On the distribution of the roots of certain symmetric matrices. Annals of Mathematics 325–327 (1958). DOI 10.2307/1970008.
- [65] Wigner, E. P. Random matrices in physics. SIAM Review 9, 1–23 (1967). DOI 10.1137/1009001.
- [66] Shukla, P. Generalized random matrix theory: A mathematical probe for complexity. International Journal of Modern Physics B 26, 1230008 (2012). DOI 10.1142/S0217979212300083.
- [67] Guhr, T., Müller-Groeling, A. & Weidenmüller, H. A. Random-matrix theories in quantum physics: common concepts. Physics Reports 299, 189–425 (1998). DOI 10.1016/S0370-1573(97)00088-4.
- [68] Alhassid, Y. The statistical theory of quantum dots. Reviews of Modern Physics 72, 895 (2000). DOI 10.1103/RevModPhys.72.895.
- [69] Kota, V. Embedded random matrix ensembles for complexity and chaos in finite interacting particle systems. Physics Reports 347, 223–288 (2001). DOI 10.1016/S0370-1573(00)00113-7.
- [70] Marčenko, V. A. & Pastur, L. A. Distribution of eigenvalues for some sets of random matrices. Mathematics of the USSR-Sbornik 1, 457 (1967).
- [71] Plerou, V., Gopikrishnan, P., Rosenow, B., Amaral, L. & Stanley, H. A random matrix theory approach to financial cross-correlations. Physica A: Statistical Mechanics and its Applications 287, 374–382 (2000). DOI 10.1103/PhysRevE.65.066126.
- [72] Kumar, S. & Deo, N. Analysing correlations after the financial crisis of 2008 and multifractality in global financial time series. Pramana 84, 317–325 (2015). DOI 10.1007/s12043-015-0935-6.
- [73] Guhr, T. & Kälber, B. A new method to estimate the noise in financial correlation matrices. Journal of Physics A: Mathematical and General 36, 3009 (2003). DOI 10.1088/0305-4470/36/12/310.
- [74] Bouchaud, J.-P. & Potters, M. Theory of financial risks, vol. 4 (Cambridge University Press, 2000).
- [75] Vinayak, Schäfer, R. & Seligman, T. H. Emerging spectra of singular correlation matrices under small power-map deformations. Physical Review E 88, 032115 (2013). DOI 10.1103/PhysRevE.88.032115.
- [76] Vinayak & Seligman, T. H. Time series, correlation matrices and random matrix models. In AIP Conference Proceedings, vol. 1575, 196–217 (AIP, 2014).
- [77] Pan, R. K. & Sinha, S. Collective behavior of stock price movements in an emerging market. Physical Review E 76, 046116 (2007). DOI 10.1103/PhysRevE.76.046116.
- [78] Sharma, K., Shah, S., Chakrabarti, A. S. & Chakraborti, A. Sectoral co-movements in the indian stock market: A mesoscopic network analysis. In Economic Foundations for Social Complexity Science, 211–238 (Springer, 2017).
- [79] Pharasi, H. K., Seligman, E. & Seligman, T. H. Market states: A new understanding. arXiv preprint arXiv:2003.07058 (2020).
- [80] Philippatos, G. C. & Wilson, C. J. Entropy, market risk, and the selection of efficient portfolios. Applied Economics 4, 209–220 (1972). DOI 10.1080/00036847200000017.
- [81] Xu, J., Zhou, X. & Wu, D. D. Portfolio selection using mean and hybrid entropy. Annals of Operations Research 185, 213–229 (2011). DOI 10.1007/s10479-009-0550-3.
- [82] Buchen, P. W. & Kelly, M. The maximum entropy distribution of an asset inferred from option prices. Journal of Financial and Quantitative Analysis 31, 143–159 (1996). DOI 10.1007/s00780-011-0167-7.
- [83] Kullback, S. & Leibler, R. A. On information and sufficiency. The Annals of Mathematical Statistics 22, 79–86 (1951). DOI 10.1214/aoms/1177729694.
- [84] Frittelli, M. The minimal entropy martingale measure and the valuation problem in incomplete markets. Mathematical Finance 10, 39–52 (2000). DOI 10.1111/1467-9965.00079.
- [85] Bowden, R. J. Directional entropy and tail uncertainty, with applications to financial hazard. Quantitative Finance 11, 437–446 (2011). DOI 10.1080/14697681003685548.
- [86] Gradojevic, N. & Caric, M. Predicting systemic risk with entropic indicators. Journal of Forecasting 36, 16–25 (2017). DOI 10.1002/for.2411.
- [87] Maasoumi, E. & Racine, J. Entropy and predictability of stock market returns. Journal of Econometrics 107, 291–312 (2002).
- [88] Sandhu, R. S., Georgiou, T. T. & Tannenbaum, A. R. Ricci curvature: An economic indicator for market fragility and systemic risk. Science Advances 2 (2016). DOI 10.1126/sciadv.1501495.
- [89] Almog, A. & Shmueli, E. Structural entropy: Monitoring correlation-based networks over time with application to financial markets. Scientific Reports 9, 10832 (2019). DOI 10.1038/s41598-019-47210-8.
- [90] Chakraborti, A., Sharma, K., Pharasi, H. K. et al. Phase separation and universal scaling in markets: Fear and fragility. arXiv preprint arXiv:1910.06242v2 (2019).
- [91] Fan, Y. et al. Lifespan development of the human brain revealed by large-scale network eigen-entropy. Entropy 19, 471 (2017). DOI 10.3390/e19090471.