Searching for obscured AGN in 2 submillimetre galaxies
Abstract
Aims. Submillimetre-selected galaxies (SMGs) at high redshift ( 2) are potential host galaxies of active galactic nuclei (AGN). If the local Universe is a good guide, 50 of the obscured AGN amongst the SMG population could be missed even in the deepest X-ray surveys. Radio observations are insensitive to obscuration; therefore, very long baseline interferometry (VLBI) can be used as a tool to identify AGN in obscured systems. A well-established upper limit to the brightness temperature of 105 K exists in star-forming systems, thus VLBI observations can distinguish AGN from star-forming systems via brightness temperature measurements.
Methods. We present 1.6 GHz European VLBI Network (EVN) observations of four SMGs (with measured redshifts) to search for evidence of compact radio components associated with AGN cores. For two of the sources, e-MERLIN images are also presented.
Results. Out of the four SMGs observed, we detect one source, J123555.14, that has an integrated EVN flux density of 201 15.2 Jy, corresponding to a brightness temperature of 5.2 0.7 105 K. We therefore identify that the radio emission from J123555.14 is associated with an AGN. We do not detect compact radio emission from a possible AGN in the remaining sources (J123600.10, J131225.73, and J163650.43). In the case of J131225.73, this is particularly surprising, and the data suggest that this may be an extended, jet-dominated AGN that is resolved by VLBI. Since the morphology of the faint radio source population is still largely unknown at these scales, it is possible that with a 10 mas resolution, VLBI misses (or resolves) many radio AGN extended on kiloparsec scales.
Key Words.:
galaxies: starburst — galaxies: active, nuclei — techniques — high angular resolution, interferometric1 Introduction
Submillimetre galaxies (SMGs) are the most bolometrically luminous sources in the Universe (Swinbank et al. 2014). They are responsible for up to half of the total star formation in the Universe and are likely the massive, dusty progenitors of the largest elliptical galaxies that we see in the local Universe (e.g. Simpson et al. 2014; Swinbank et al. 2006; Casey et al. 2014). While it is clear that the processes of star formation are important in SMGs, it is still unclear as to what fraction also hosts active galactic nuclei (AGN) and whether those AGNs are energetically significant in the bolometric output of those luminous galaxies. Some SMG systems probably host components associated with both AGN activity and star-formation processes (for a review, see Biggs et al. 2010). Previous observations of extragalactic objects have illustrated that the upper limit to the brightness temperature of star-forming galaxies is expected not to exceed K, and distant SMGs with above this value are most likely powered by AGN (e.g. Condon 1992; Middelberg et al. 2010, 2013).
To date, large surveys focused on detecting AGN systems have been conducted at a range of different wavelengths and, in particular, for the IR and X-ray domains (Alexander et al. 2005, 2008; Ivison et al. 2004; Lutz et al. 2005; Menéndez-Delmestre et al. 2007, 2009; Valiante et al. 2007; Pope et al. 2008; Bonzini et al. 2013; Smolčić et al. 2017; Wang et al. 2013; Stach et al. 2019). Due to the dust extinction in the near-IR, optical, and UV, as well as gas absorption in X-ray bands, these surveys are often incomplete. In the mid- and far-IR, incompleteness of AGN surveys may arise from the fact that not all AGN have significant IR emission from a dusty torus and therefore may not be detected. It is postulated that up to a third of AGN are undetected in these surveys (Mateos et al. 2017). Moreover, other studies have compared AGN selected from various wavebands and find that their host galaxies tend to have different properties in terms of colour (Hickox et al. 2009) and star-formation rates (SFR) (Juneau et al. 2013; Ellison et al. 2016). In particular, Hickox et al. (2009) illustrated that there is only very little overlap between their 122 radio-selected AGN and those selected by X-ray or IR. Therefore, dust-free radio surveys are needed to provided a more complete census of the AGN population. Traditional radio surveys are only sensitive to radio-loud (RL) AGN, which only represent a tiny fraction (10 20%) of the whole AGN population; however, modern radio surveys can achieve a flux depth where radio-quiet AGN can be detected (see Prandoni et al. 2018 for a review). Recent work has focused on the radio as it is sensitive to AGN and star formation concordantly, thus providing a method of surveying AGN and star-formation activity across cosmic time (e.g. Smolčić et al. 2017; Padovani et al. 2015). A lot of work has also been done to look for AGN-driven radio emission, which has been identified by an excess of radio emission compared to what is expected based on the radio-FIR correlation, holding for star-forming galaxies (e.g. Ivison et al. 2010; Condon et al. 2002; Thomson et al. 2014; Magnelli et al. 2015).
Very long baseline interferometry (VLBI) provides an alternative method of identifying AGN that is not affected by star-formation-related radio emission via the detection of high brightness temperature compact radio components as can be seen in Garrett et al. (2001, 2005); Chi et al. (2013); Middelberg et al. (2011, 2013); Herrera Ruiz et al. (2017), for example. In particular, Chi et al. (2013) identified 12 AGNs in the Hubble Deep Field-North (HDF-N) using a global array of VLBI telescopes. As suggested in Chi et al. (2009), the radio-enhanced AGNs are probably obscured AGNs which remain undetected even in the deepest X-ray surveys. Indeed, if the local Universe is a good guide, roughly half of the AGNs in SMGs are Compton thick (e.g. Risaliti et al. (1999)).
Chi et al. (2009) argued that deep, high-resolution radio observations are required in order to generate complete samples of obscured AGNs at high redshifts. However until recently, deep, wide-field VLBI surveys were difficult to realise and the field of view (FoV) is still relatively limited. The employment of new analysis techniques, as seen in Radcliffe et al. (2016) and Deller et al. (2011) for example, has permitted much deeper and wider VLBI surveys of AGN to be conducted (e.g. Middelberg et al. 2013; Herrera Ruiz et al. 2017; Radcliffe et al. 2018). VLBI has become a sensitive tool in distinguishing between AGN and star-formation processes, including the ability to detect Compton-thick AGNs in dusty systems that would otherwise go undetected. These advances have proven that the radio morphological information and brightness temperature measurements provided by VLBI are sensitive enough to isolate the pure star-forming regions from AGN within individual SMGs (e.g. Muxlow et al. 2005; Chi et al. 2013).
| Source Name | SFR | |||||||
|---|---|---|---|---|---|---|---|---|
| [Jy] | [mJy] | [mJy] | [1025 W Hz-1] | [104 ] | ||||
| J123555.14 | 212.0 13.7 | 5.4 1.9 | 23.1 0.6 | 1.875 | 0.55 0.04 | 0.77 0.06 | 1.41 0.16 | 2.04 0.03 |
| J123555.14∗ | 0.028 0.002 | 0.039 0.003 | 2.42 0.15 | |||||
| J123600.10 | 262.0 17.1 | 6.9 2.0 | 57.2 0.6 | 2.710 | 1.66 0.11 | 2.32 0.15 | 1.42 0.13 | 2.34 0.03 |
| J131225.73 | 752.5 4.2 | 4.1 1.3 | ¡ 14.7 | 1.554 | 1.23 0.01 | 1.72 0.01 | 0.74 0.14 | ¡ 1.29 |
| J163650.43 | 221.0 16.0 | 8.2 1.7 | 45.9 2.9 | 2.378 | 1.02 0.07 | 1.42 0.10 | 1.57 0.10 | 2.32 0.04 |
| ∗AGN-subtracted components. | ||||||||
In this paper, we present 1.6 GHz VLBI observations of four SMGs at 2 using the European VLBI Network (EVN). For a subset of sources we also use e-MERLIN observations from the e-MERlin Galaxy Evolution (eMERGE) Great Observatories Origins Deep-North (GOODS-N) survey (Muxlow et al. 2005; 2020 in prep.). The sources are SMG J123555.14+620901.7, SMG J123600.10+620253.5, SMG J131225.73+423941.4, and SMG J163650.43+405734.5. These are located in the HDF-N, SSA-13, and ELAIS-N2 fields and were selected from Chapman et al. (2005, hereafter Chapman2005). The four sources that were chosen have 2, which is the mean redshift of the Chapman2005 sample, an epoch that may represent the peak of quasar activity (Wolf et al. 2003; Shankar et al. 2009). On the basis of the results of Chi et al. (2013) who detected 12 radio sources brighter than 150 Jy in the HDF-N, the targets were also chosen to have a total VLA 1.4 GHz flux density 200 Jy, which is much higher than the average value of 110 Jy of the whole sample. The VLA 1.4 GHz luminosities of the four sources are between 10 to 30 times more luminous than the local ultra-luminous starburst Arp 220.
This paper is organised as follows. In Section 2 we describe the VLBI observations and the data reduction methodology; in Section 3 we present and discuss our results and the derived source properties compared with other data at different frequencies; and finally, we note the main conclusions of the paper in Section 4. For this paper, we assume a flat CDM universe with = 67.8 0.9 km s-1 Mpc, = 0.308 0.012 and = 0.692 0.012 (Planck Collaboration et al. 2016).
2 Observations and data analysis
2.1 EVN observations
The source properties, including multi-wavelength flux densities in the literature, redshift information, as well as derived 1.4 GHz luminosities and values (see Section 3 for details) are listed in Table 1. The flux densities at 1.4 GHz (VLA) and at 850 m, as well as the redshift information are taken from Chapman et al. (2005). The 350 m fluxes are from the Herschel point-source catalogue111http://archives.esac.esa.int/hsa/whsa/ except for the upper limit of J131225.73, which was obtained by Dowell et al. (2003) with second-generation Submillimetre High Angular Resolution Camera (SHARC-2) observations. The VLA 1.4 GHz luminosities were derived from their observed 1.4 GHz fluxes without applying any -correction. The SFR, assuming that the radio emission arises purely from star-formation processes, was calculated following Kennicutt (1998):
| (1) |
where represents the luminosity at a certain frequency ; we used the VLA 1.4 GHz radio luminosities to derive the corresponding SFRs. For the VLBI detected source, J123555.14, the SFR values in Table 1 were derived with and without the contribution from the compact VLBI-detected AGN component. No -correction was applied to the far-IR-radio correlation parameter and values reported here (see Section 3.2 for details).
Our EVN survey was split into two 12-hour observing sessions with project codes EC029A and EC029B, respectively (PI S. Chi). EC029A was observed on 6 November 2009 targeting J131225.73 (SSA-13) and J163650.43 (ELAIS-N2), and EC029B was observed on 7 November 2009 targeting J123555.14 and J123600.10 (both are located in GOODS-N). The eight telescopes listed in Table 2 were used in both sessions, including the 100 m Effelsberg telescope, the 76 m Lovell telescope, and the 25 m Urumqi telescope in China. The array provided an angular resolution of 10 mas and a 1- sensitivity of 16 Jy beam-1.
| Name | Location | Diameter (m) |
|---|---|---|
| Effelsberg | Germany | 100 |
| Lovell | UK | 76 |
| Medicina | Italy | 32 |
| Noto | Italy | 32 |
| Onsala | Sweden | 25 |
| Torun | Poland | 32 |
| Urumqi | China | 25 |
| Westerbork | The Netherlands | 25 |
| Project | Source Field | Source Name | RA (J2000) | Dec (J2000) | Role |
| SSA-13 | J131225.73 | 13:12:25.734 | +42:39:41.47a | Target | |
| J1317+4115 | 13:17:39.1938 | +41:15:45.618b | Phase calibrator for J131225.73 | ||
| EC029A | ELAIS-N2 | J163650.43 | 16:36:50.435 | +40:57:34.46c | Target |
| J1640+3946 | 16:40:29.6328 | +39:46:46.028b | Phase calibrator for J163650.43 | ||
| 3C345 | 16:42:58.810 | +39:48:36.99b | Fringe finder | ||
| GOODS-N | J123555.14 | 12:35:55.1263 | +62:09:01.739 | Target | |
| EC029B | GOODS-N | J123600.10 | 12:36:00.0743 | +62:02:53.670 | Target |
| J1241+6020 | 12:41:29.5906 | +60:20:41.322b | Primary calibrator | ||
| J1234+619 | 12:34:11.7413 | +61:58:32.480 | Secondary calibrator | ||
| aFomalont et al. (2006) | |||||
| bVLBA calibrator catalogue (http://www.vlba.nrao.edu/astro/calib/) | |||||
| cIvison et al. (2002) | |||||
The sources were observed in the standard phase referencing mode at 1.6 GHz ( 18cm). For EC029A, we used the bright quasar 3C345 as a ’fringe finder’. Two well-established VLBI calibrators, J1317+4115 ( 200 mJy) and J1640+3946 ( 890 mJy), lying 1.7 and 1.4 degrees away from the target sources were used as phase calibrators. Each target, along with its phase calibrator, was observed with a cycle time of 10 minutes (8 minutes on the target and 2 minutes on the phase calibrator). The fringe finder was observed for 4 minutes in the middle of the session. For EC029B, we had an 190 mJy primary phase calibrator J1241+6020, which is located 1.5 from the centre of the HDF-N, and an 17 mJy secondary phase calibrator J1234+619 lying 25 away from the HDF-N centre. In this case, the observations cycled between the primary calibrator, the secondary calibrator, J123600.10 (the target), the secondary calibrator, and J123555.14 (the target). Details about the calibrators are listed in Table 3. The secondary calibrator of EC029B, J1234+619, was found to be displaced with respect to the correlated position by 20 mas. The improved position measured by these observations via the AIPS task JMFIT is given in Table 3.
Our observations were recorded at 1024 Mbits/sec (Nyquist sampled with two-bit encoding, dual-polarisation, 8 16 MHz IF channels) for a total observing time of 24 hours. Two-second integrations and 16 spectral channels per 16 MHz baseband were adopted for the correlation parameters. Our data were correlated at the Joint Institute for VLBI ERIC 222www.jive.eu/ (JIVE).
2.2 Data analysis
The observed data were analysed using the Astronomical Image Processing System (AIPS)333www.aips.nrao.edu/. All of the sources and the calibrators were calibrated with the following strategy: An initial amplitude calibration that was derived from the system temperature and the gain curves of the telescopes (available from the JIVE archive as a calibration table generated by the pipeline processes) was applied first. Thereafter, bad data with abnormally high or corrupted amplitude or phase information were removed using the AIPS tasks SPFLG and CLIP. The dispersive delays were then corrected for using an ionospheric map that was implemented within VLBATECR. The instrumental delays (fixed delay offsets between the IF channels were calibrated by running FRING on data from a single scan on a strong source (3C345 and J1241+6020 for EC029A and EC029B, respectively). We performed fringe-fitting on the fringe finder and primary phase calibrators to calibrate the phase and phase-rates by also using FRING. Finally, we performed a bandpass calibration using BPASS by again employing 3C345 and J1241+6020 for EC029A and EC029B, respectively.
We employed different strategies for EC029A and EC029B for self-calibration. For EC029A, we used SPLIT to separate the phase-calibrators (J1317+4115 and J1640+3946) and generated the best possible self-calibrated maps of these sources. The clean-components of these maps were then used to update the source model used by FRING, and the phase and phase-rates were re-determined. After applying the new corrections, we used SPLIT again to separate the calibrators, then successive loops of IMAGR and CALIB resulted in the final maps for these sources. The amplitude and phase corrections derived from CALIB were then applied to the target sources using CLCAL. The target data were then separated using SPLIT and dirty images generated with IMAGR.
For EC029B, a similar approach was implemented with corrections from the primary calibrator, which were determined by FRING and later refined by CALIB, including amplitude corrections. These were applied to the secondary calibrator and the targets. The initial images made of the secondary calibrator show it to be shifted about 20 mas from the phase centre (correlated position) of the map. This position was known to be an error but it remained uncorrected at the time the data were correlated. FRING was re-run on the secondary calibrator using the new map with the correct position, and the phase and phase-rate corrections were also applied to the targets.
Of the four targeted sources, only one was unambiguously detected by VLBI, J123555.14, which is located in the HDF-N. The other three sources were not detected. We generated maps using highly tapered uv-data (excluding the Urumqi telescope), but no further detections were found. We used the Common Astronomy Software Applications (casa; McMullin et al. 2007) task viewer to generate the radio contour maps of the sources.
| Source Name | EVN | EVN | Beam | Angular Size | Linear Size | ||
|---|---|---|---|---|---|---|---|
| [Jy beam-1] | [Jy] | [mas mas ()] | [105 K] | [mas mas ()] | [parsec2] | ||
| J123555.14 | 110.2 15.2 | 201.1 40.2 | 0.95 | 12.8 10.4 (14.5) | 5.2 0.7 | 23.9 22.3 (131.4) | 116.7 186.9 |
| J123600.10 | 42.6 | – | ¡ 0.16 | 12.6 10.5 (11.0) | 5.6 | – | – |
| J131225.73 | 41.0 | – | ¡ 0.05 | 17.8 11.7 (1.0) | 2.4 | – | – |
| J163650.43 | 47.2 | – | ¡ 0.22 | 18.5 11.6 (1.4) | 3.5 | – | – |
Table 4 summarises the VLBI results. In this table, the angular size of J123555.14 was measured by fitting a single 2D Gaussian to the source using the AIPS task, JMFIT. The linear size at the distance of this source was calculated following Wright (2006)444http://www.astro.ucla.edu/ wright/CosmoCalc.html.
2.3 eMERGE DR1 data
Two sources in our sample (J123555.14 and J123600.10) are also part of the eMERGE Data Release 1 (eMERGE DR1). The eMERGE DR-1 dataset provides a very sensitive image of the central 15 of the GOODS-N field at 1.5 GHz, as observed by e-MERLIN and the Jansky Very Large Array (JVLA).
The source detected by VLBI, J123555.14, lies within the FoV of eMERGE. The VLBI and eMERGE images are presented in Figure 2. The resolution of the eMERGE DR1 maximum sensitivity image is 890 780 milliarcsec2 and the 1- root mean square (r.m.s.) noise level reaches 1.71 Jy beam-1 in the central area and 2.37 Jy beam-1 near the J123555.14 source position. We also created an additional re-weighted eMERGE 1.5 GHz image of J123555.14 with a resolution that matched the published JVLA 5.5 GHz map (Guidetti et al. 2017). The primary beam was corrected with a beam size of 560 470 milliarcsec2. It reaches an r.m.s noise level of 1.94 Jy beam-1 in the central area and 2.54 Jy beam-1 near the position of J123555.14. The JVLA 5.5 GHz image, which was used along with the re-weighted 1.5 GHz map to derive the spectral index (see Section 3.3), has an r.m.s noise level of 14.0 Jy beam-1 near the source position.
J123600.10 lies slightly outside the field of the eMERGE maximum sensitivity map as the FoV is restricted due to the limited extent of the Lovell Telescope primary beam response. We reprocessed the eMERGE data with the Lovell Telescope flagged to make a clear detection (contours shown in Figure 2b). The reprocessed image has less sensitivity than the central DR1 image, but it still reaches an r.m.s. noise level of 1.77 Jy beam-1 near the source position with a resolution of 770 750 milliarcsec2 and goes significantly deeper than our VLBI images. As J123600.10 lies near the edge of this image, there is some bandwidth smearing of the source at the level of 10%.
3 Results and discussion
3.1 Brightness temperature
The brightness temperature () of a source with a redshift is given by:
| (2) |
where is the peak brightness and is the observing frequency; and denote the deconvolved major and minor axes of the source (Condon et al. 1982; Ulvestad et al. 2005). For the three undetected sources, we derived upper limits for their brightness temperatures (see Table 4).
A well-established upper limit to the brightness temperature of 105 K exists in star-forming systems (Condon 1992; Lonsdale et al. 1993). In the local Universe, such a brightness temperature can be achieved by either AGN or supernovae activity (Kewley et al. 2000). However, at a more distant universe (), where the VLBI detection threshold exceeds what stellar non-thermal sources can reach, this value can typically only be attained by AGN (Middelberg et al. 2010, 2013). Notably, while one can be confident of a compact, approximate milli-arcsecond source with 105 K being an AGN, it is not certain that AGN in sources below this criteria can be ruled out. Those sources may contain extended structures, such as jets and lobes, and only a smaller fraction of their flux is from the compact central core (Jarvis et al. 2019; Muxlow et al. 2005).
The detected source J123555.14 has a brightness temperature of 5.2 0.7 105 K, which is approximately five times higher than the star-forming envelope. This supports the interpretation that J123555.14 contains an AGN core. The undetected sources, however, have upper limits on their brightness temperatures exceeding K, which cannot completely rule out AGN activity in these objects.
3.2 Infrared-radio correlation
Our four sources are part of a larger sample of SMGs from Chapman et al. (2005) that have good positions and measured redshifts. Table 1 presents the source flux densities at 1.4 GHz and 850 m provided in Chapman et al. (2005) and the derived values. We define the latter as:
| (3) |
where and are the luminosities at m and 1.4 GHz. We also calculated the values for the sources using the same strategy (Table 1).
A fairly tight far-infrared-radio correlation applies to a wide-range of galaxy types in the local Universe (see Solarz et al. 2019 and references therein). The relation also appears to hold at cosmological distances (e.g. Garrett (2002) and Elbaz et al. (2002)). Radio-loud AGNs are observed to have much lower values of on average, compared to radio quiet or star-forming systems. The value of can therefore help to distinguish between AGN activity and star-forming processes in extragalactic systems (e.g. Condon et al. (2002); Sargent et al. (2012); Delhaize et al. (2017)).
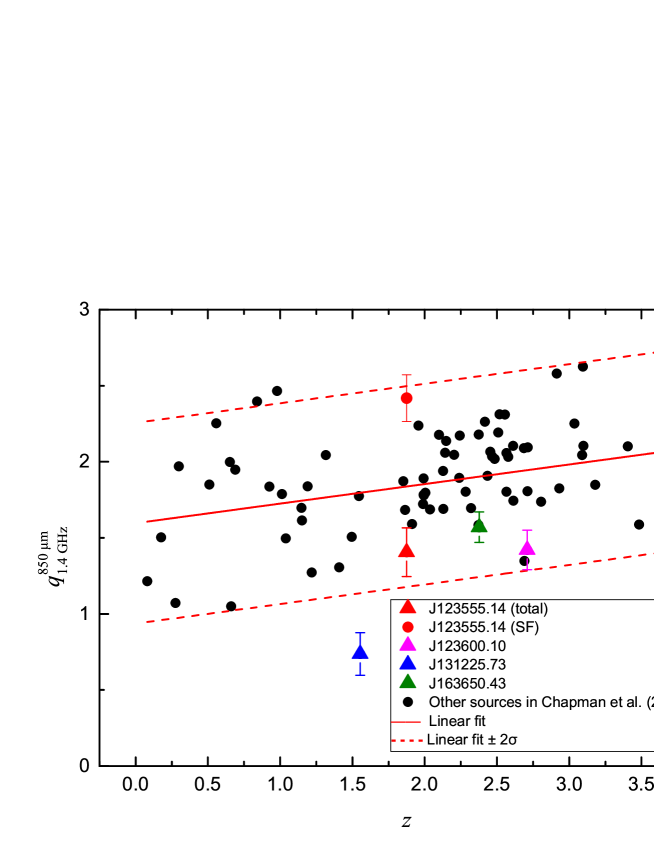
Figure 1 presents a plot of versus the redshift for the 76 SMG sources in Chapman et al. (2005), including the four sources observed by VLBI. Since we were mostly interested in seeing whether our sources deviated from the rest of the sample, a simple linear fit was applied to the observed band flux ratios without the application of any -correction. The Chapman2005 sample has a mean of 1.85 with a standard deviation from the linear fit of 0.35. Three of our four sources appear to follow the FIR-radio correlation, which is represented by with offsets that are smaller than 2 from the linear fit.
It is interesting, however, that all three objects are below the correlation, thus, on average, they have larger radio luminosities than expected. However, for the detected source J123555.14, the value increases to 2.42 0.15 when the contribution of the AGN core is subtracted from the 1.4 GHz radio luminosity. This value is actually higher than most of the sources in Figure 1. Considering that the linear fit was performed on a sample of SMG, which is possibly contaminated by AGN, the correlation shown in Figure 1 might be displaced towards lower q values with respect to that of a sample consisting purely of star-forming galaxies.
One of the sources, J131225.73, has a value of 0.74, which departs from the mean linear fit by 3. A further discussion on this point is given in Section 3.3.
While and are more sensitive to the dust emission measurement, other -values with wider IR waveband coverage, such as and , are more sensitive to the actual IR emission from the source. We note that is defined as the logarithmic ratio of the rest-frame 8-1000 m flux and 1.4 GHz radio flux. Bell (2003) measured a median value of 2.64 0.02 over 164 SMGs, showing no signs of AGN. This value is similar to the medium value of 2.59 0.05 in Thomson et al. (2014) involving 76 SMGs. Del Moro et al. (2013) classified sources with 1.68 as radio excess AGNs. Additionally, is the logarithmic ratio of the far-IR and 1.4 GHz radio luminosity, where the far-IR luminosity is estimated by the flux in a wide band centred at 80 m. Kovács et al. (2006) derived an average value of 2.14 with an intrinsic spread of 0.12. Sources with a value that is more than 2 lower than the mean value are likely to be hosts of a radio-loud AGN. In Section 3.3, we use the values of the sources from the literature to support our arguments. Both the value of J123555.14 and the values of J131225.73 and J163650.43 are below the mean values mentioned above, which is in agreement with the distribution characteristics of Figure 1.
3.3 Source description
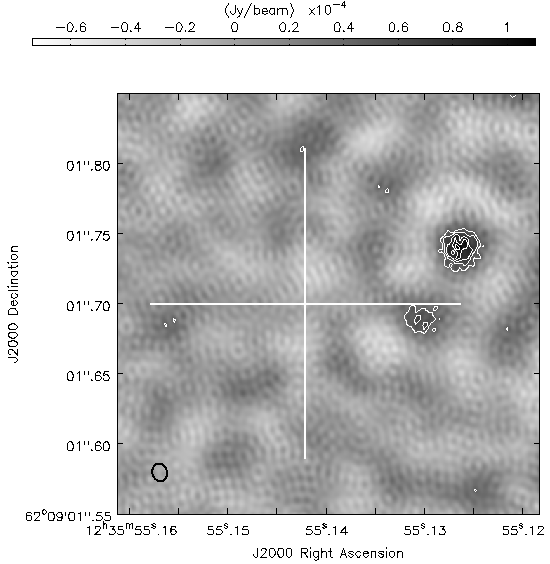
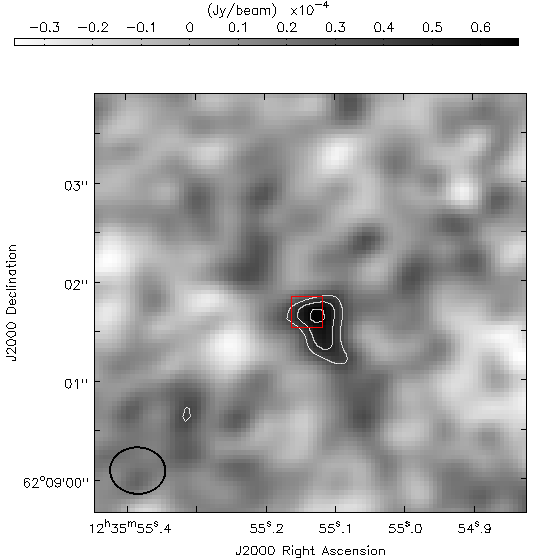
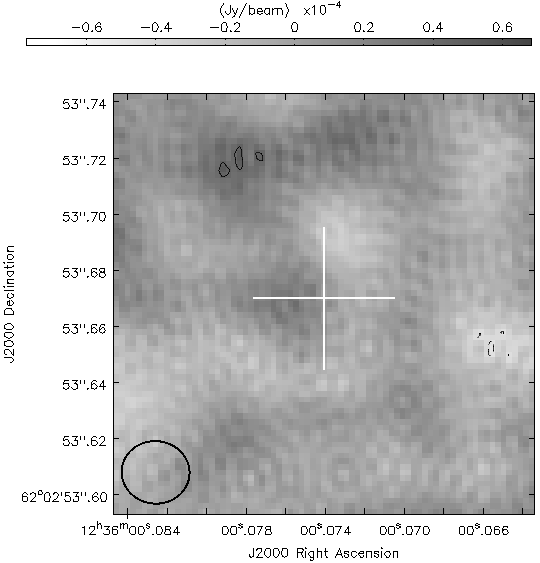
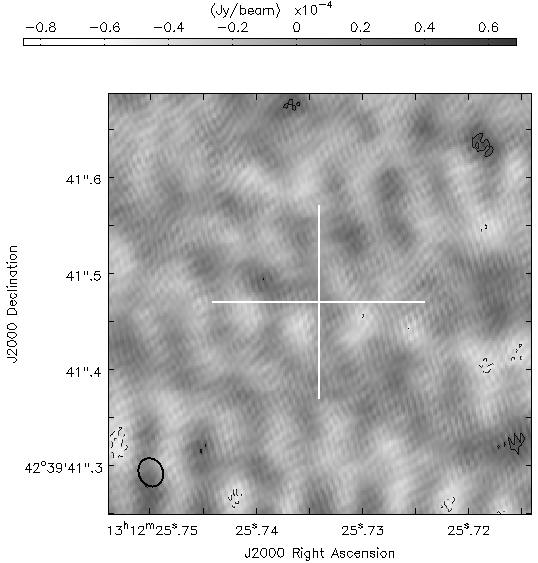
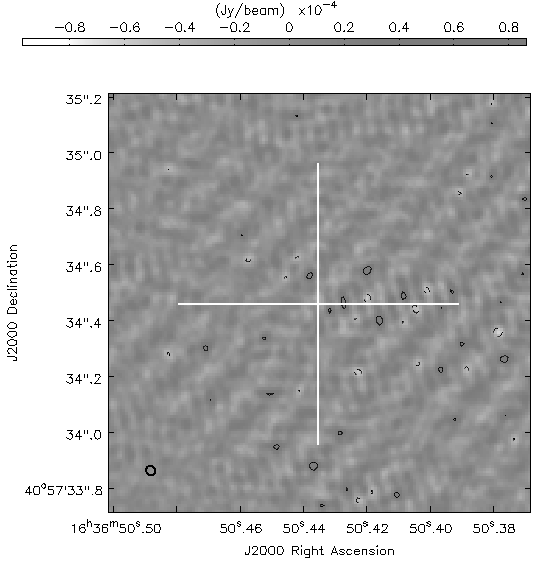
The various contour maps of our four targets are shown in Figures 2, 3, and 4. The crosses on the figures are centred on their expected a priori positions and scaled with respect to the associated error. In Figure 2a, the white cross presents the VLA-measured coordinates of J123555.14 given in Richards (2000), the red dotted cross shows the measured position in the eMERGE maximum sensitivity image and the blue one represents the position in the eMERGE 5.5 GHz map. The cross in Figure 3a represents the expected position of J123600.10 measured in the re-processed eMERGE image. For the other two undetected sources in Figure 4, the expected positions and errors are specified in Chapman et al. (2005); Fomalont et al. (2006); Ivison et al. (2002) and refer to 1.4 GHz VLA observations.
J123555.14 was detected and resolved in our VLBI observations. This source is located at a spectroscopic redshift of 1.875 (Chapman et al. 2005). Figure 2 shows the VLBI, the optical image, and e-MERLIN DR1 maps of the source. The EVN image shows two components separated by 56.5 mas. The brighter of the two components is consistent with the source detected by Radcliffe et al. (2018). They did not detect the fainter southern component, but we note that this is only detectable in our image at the 4- level, which has a weak reliability. Therefore, we do not discuss this component in this paper. The brighter northern component was detected at the 7- level with a brightness temperature of 07 105 K.
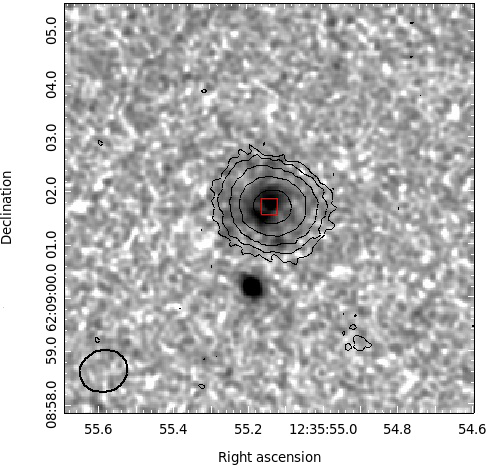
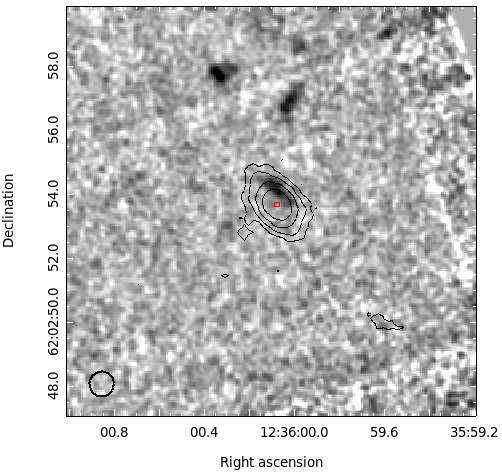
The source shows a face-on disc-like morphology with a close companion ( 10 20 kpc in projection) in the rest-frame near-UV image (Figure 2b). This image was taken by the Advanced Camera for Surveys (ACS) of the Hubble Space Telescope (HST) with the F814W filter in the Cosmic Assembly Near-infrared Deep Extragalactic Legacy Survey (CANDELS; Koekemoer et al. 2011) and was retrieved from the Legacy Archive555https://hla.stsci.edu/. The HST image was processed by SAO Image DS9666http://ds9.si.edu/site/Home.html. For clarity, the image was smoothed with a 2D Gaussian convolution with a FWHP of 0.1.
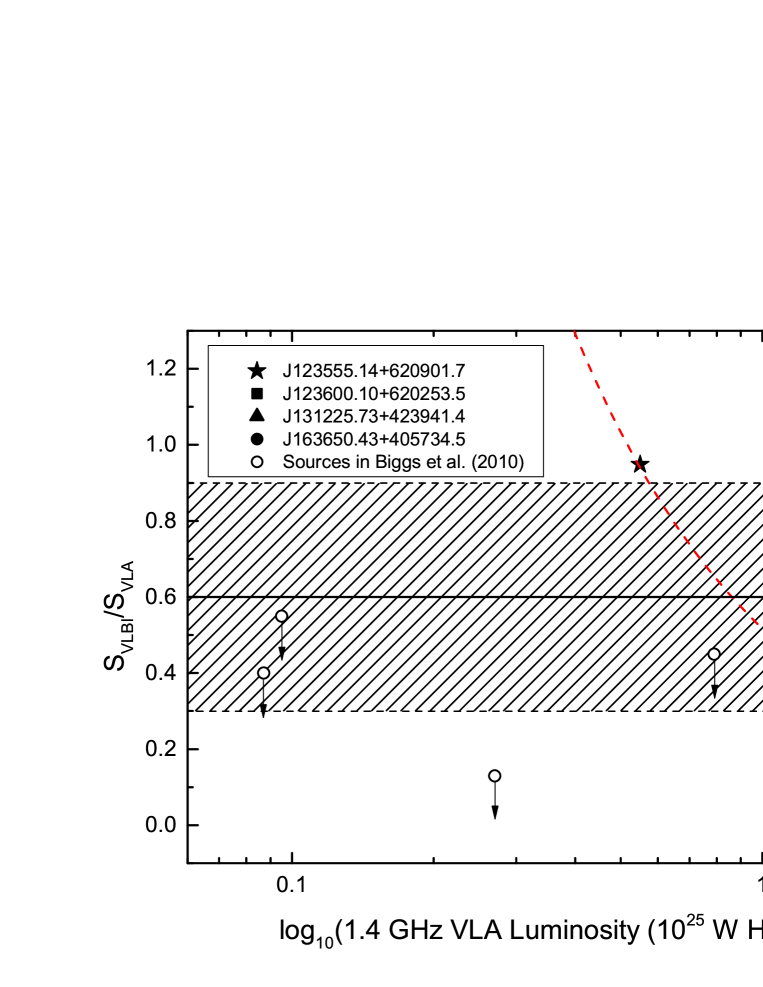
The HST CANDELS image was contoured with the 1.5 GHz eMERGE DR1 maximum sensitivity map, where the source is detected with a peak and integrated flux density of 185.2 4.6 Jy. This value is consistent with the VLBI flux within the errors. Moreover, this source has a total 1.4 GHz VLA flux density of 212.0 13.7 Jy, which corresponds to a radio luminosity of 5.50 0.4 1024 W Hz-1. As shown in Figure 5, this source has a prominent VLBI-to-VLA flux density ratio of 0.95, which is much higher than the mean value of 0.6 measured by Herrera Ruiz et al. (2017) over a larger sample of Very Long Baseline Array (VLBA) detected sources, which were observed with a similar, approximate milli-arcsecond resolution and an 10 Jy sensitivity. This suggests that most of the radio emission is associated with a compact milli-arcsecond central core. Another possible explanation for a large value of is source variability. In particular, the VLBI and VLA data in this paper were taken at different epochs. Nevertheless, only a few percent of faint radio sources are expected to be variable and this particular source was observed as being variable in the recent study of Radcliffe et al. (2019). The source has a SFR of 0.77 0.06 104 , which was calculated with the total . In removing the 95% VLBI recovered luminosity which is considered to be associated with an AGN, a corresponding SFR of 385 30 is indicated by the 1.4 GHz radio luminosity contributed by star-forming processes (0.28 0.02 1024 W Hz-1).
The source appears to be slightly resolved in the eMERGE 1.5 and 5.5 GHz images, the latter has a peak brightness of 5. The total flux densities of the eMERGE 1.5 and 5.5 GHz images yield a spectral index of 0.49. This relatively flat spectral index is indicative of an AGN component being the dominant source of radio emission. This source was also confirmed to be an AGN in Radcliffe et al. (2018). Its mid-IR spectrum also shows evidence of an AGN in this source (Pope et al. 2008). Hainline et al. (2011) suggest that an estimated fraction of 0.7 0.8 of its Spitzer-Infrared Array Camera (IRAC) 8 m emission was contributed by a power-law component ( where = 3 was the best fit), which is considered to likely originate from an AGN. By fitting local spectral energy distributions (SEDs) with 24 m Spitzer photometry, Murphy et al. (2009) suggested that more than 50% of its 8-1000 m total IR energy budget could be contributed by AGN activity. This source has a S850μm and S350μm of 5.4 1.9 mJy and 23.1 0.6 mJy; this yields a and of 1.41 0.16 and 2.04 0.03, respectively (see Table 1). Although the and values of this source seem to follow the FIR-radio correlation, it has a of 1.51 (Murphy et al. 2009). This value is 4 lower than the median value of 2.60 (Bell 2003; Thomson et al. 2014). According to the argument that Del Moro et al. (2013) raise that sources with 1.68 are likely radio excess AGNs, the low value of this source is a strong indicator of an AGN. After subtracting the AGN-contributed radio luminosity, the source has a and values of 2.42 0.15 and 3.05 0.02, respectively. These values may reflect the values for purely star-forming systems. As shown in Figure 1, the star-formation-associated value of is higher than the majority of the Chapman2005 SMG sample. The source also shows evidence of an AGN at X-ray wavelengths, as suggested by Alexander et al. (2005) and Del Moro et al. (2013).
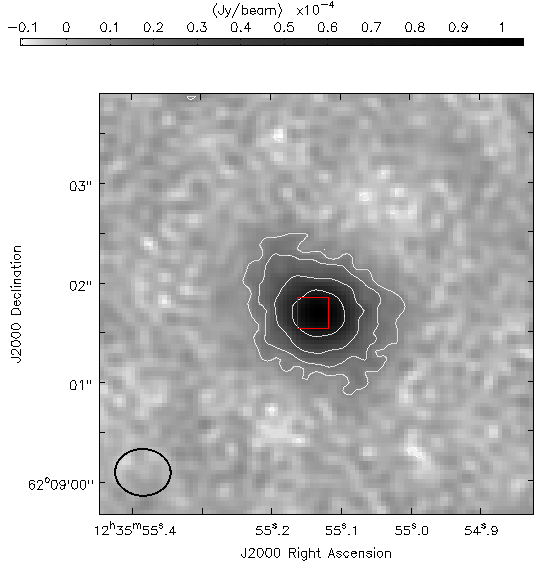
J123600.10 was not detected in our VLBI observations with a 3- brightness temperature limit of K and it is located at a redshift of 2.710 (Chapman et al. 2005). This source is detectable in the eMERGE re-weighted image with an angular size of mas2, and the measured peak and integrated flux densities are 52.4 1.7 Jy beam-1 and 83.5 4.1 Jy, respectively. This yields a brightness temperature of 523 K. Since the peak brightness measured in the eMERGE re-weighted image is only approximately five times the VLBI detecting threshold, it is not surprising that we did not detect this source with VLBI.
The contours of the eMERGE re-weighted image for this source are shown in Figure 3b on top of the HST image taken with the Near Infrared Camera and Multi-Object Spectrometer (NICMOS) using the NIC2 camera and the F160W filter in Swinbank et al. (2010) (project ID: 9506). The source shows a disc-like morphology with close companions. The NICMOS image was retrieved from the Legacy Archive and was processed by SAO Image DS9. For clarity, the image was smoothed with a 2D Gaussian convolution with a FWHP of 0.15.
This source has a S850μm and S350μm of 6.9 2.0 mJy and 57.2 0.6 mJy; this yields a and of 1.42 0.13 and 2.34 0.03, respectively (Table 1). Additionally, both follow the FIR-radio correlation. The source has a low VLBI-to-VLA flux ratio upper limit of 0.16, suggesting that a significant fraction of the radio emission is extended and probably associated with star-formation processes. This is supported by other measurements Chapman et al. (2003) suggest that this galaxy is possibly an edge-on merger from its optical morphology. However, this source has a total 1.4 GHz VLA flux density of 262.0 17.1 Jy, which corresponds to a radio luminosity of 1.66 0.11 1025 W Hz-1. This value can only be reached by an AGN or extremely strong star-forming galaxies with SFR of 2.32 0.15 104 . The high luminosity indicates that extended jet emission from a jet associated with quasar activity may exist in this source (Jarvis et al. 2019; Muxlow et al. 2005), which was undetected in these VLBI observations.
J131225.73 was not detected in our VLBI observations with a 3- brightness temperature limit of 105 K and it is located at a redshift of 1.554 (Chapman et al. 2005). A point source was detected at 8.4 GHz by the VLA at a resolution of 6 (Fomalont et al. 2002) with a total flux density of Jy. The implied spectral index of the source is relatively steep: -0.7. The non-detection of the source on VLBI scales and the very low upper limit of the ratio of 0.05 may suggest that a significant fraction of the radio emission is associated with star-formation processes.
However, although this is a steep spectrum radio source, it does have a significant radio-excess with relatively low values. This source has a of 4.1 1.3 mJy (see Table 1), and it is clearly identified as an outlier in Figure 1. Indeed, it has the lowest value of out of all of the sources in the Chapman2005 sample. This source was undetected with SHARC-2 (Dowell et al. 2003); this yields an upper limit to its of 14.7 mJy (Laurent et al. 2006; Kovács et al. 2006), which corresponds to a of 1.29. Moreover, Kovács et al. (2006) derived a value of 0.79 0.35 for this source; this value is exceptionally lower than their average value of 2.14, thus they suggested that this source likely hosts a radio-loud AGN. In addition, the source is unresolved by the VLA at 1.4 and 8.4 GHz. It has a flux density in excess of 750 Jy at 1.4 GHz and a corresponding radio luminosity of 1.23 0.01 1025 W Hz-1. Assuming all the radio emission is associated with star-formation processes, an extremely high SFR of 1.72 0.01 104 is implied.
Given the main observational properties of J131225.73, it is rather surprising that this source goes undetected by the EVN at 1.6 GHz. One possible explanation is that while the radio emission is indeed associated with an AGN, it is extended in nature, which is possibly due to the presence of extended jet features that dominate the total flux density of the source and extend spatially over kiloparsec scales. Since the morphology of the faint radio source population is still largely unknown on these scales, it is possible that VLBI misses (or resolves) many radio AGN that are dominated by extended jet components.
J163650.43 was not detected in our VLBI observations with an implied 3- brightness temperature limit of 105 K and it is located at a redshift of 2.378 (Chapman et al. 2005). This source has a S850μm and S350μm of 8.2 1.7 mJy and 45.9 2.9 mJy; this yields a and of 1.57 0.10 and 2.32 0.04, respectively (see Table 1). Additionally, both seem to follow the FIR-radio correlation. The source recovers 22% of its 1.4 GHz flux; the non-detection on VLBI scales may suggest that a significant fraction of the radio emission is associated with star-formation processes. This is supported by other measurements Engel et al. (2010) classify this source as a close binary galaxy merger because the CO(3-2) and CO(7-6) data show two peaks separated by 3 kpc. A value of 1.75 0.17 for this sources was measured by Kovács et al. (2006), this value is slightly lower than the 2- constraint from the mean value of 2.14, and it was considered to be consistent with the far-infrared to radio correlation.
However, J163650.43 has a total 1.4 GHz VLA flux density of 221.0 16.0 Jy corresponding to a luminosity of 1.02 0.07 1025 W Hz-1. This value can only be reached by an AGN or extremely powerful star-forming galaxies with a SFR of 1.42 0.10 104 . The high luminosity suggests that similar to 131225.73, this source may host extended radio jet emission associated with an AGN (Jarvis et al. 2019; Muxlow et al. 2005). Moreover, this source was classified as an AGN-hosting galaxy in Swinbank et al. (2004) because of its H emission with a large line width of 1753 km s-1 in the near-infrared. Hainline et al. (2011) suggest that an estimated fraction of 0.6 0.8 of its Spitzer-Infrared Array Camera (IRAC) 8 m emission was contributed by a power-law component ( where = 3 was the best fit), which is considered to likely originate from an AGN.
4 Summary
We have conducted EVN 1.6 GHz observations of four SMGs (J123555.14, J123600.10, J131225.73, and J163650.43,). Out of the four targets, we detected J123555.14 once, which is a source located in the GOODS-N field with a brightness temperature of 5.2 0.7 105 K. This value exceeds the maximum brightness temperature of 105 K that a star-forming galaxy is expected to reach. We therefore suggest that the radio emission associated with J123555.14 largely arises from AGN processes. We also derived brightness temperature upper limits of the three undetected sources. The non-detections may suggest that most of their radio emission is powered by star-forming processes or extended radio jets. Notably, the three undetected sources all have relatively high 1.4 GHz radio luminosities and/or show evidence of an AGN in other wavebands. This fact may suggest that while SGMs are potential hosts of AGN, star-forming processes and AGN activity probably exist in such systems concordantly.
In particular, at least one of the sources, J131225.73, shows multi-wavelength properties that would lead us to expect it to be detected by VLBI. It is highly luminous in the 752.5 4.2 Jy or 1.23 0.01 1025 W Hz-1 at 1.4 GHz, has an exceptionally low value of , and is unresolved in both the 1.4 and 8.4 GHz VLA observations. We suggest that this source, might be associated with an AGN that is dominated by extended jet emission. It would be interesting to observe the structure of this radio source with intermediate resolution, such as e-MERLIN at 5 GHz, in order to better understand the nature of the source. Since the morphology of the faint radio source population is still largely unknown on these scales, it is possible that VLBI misses (or resolves) many extended radio AGN of this type. As illustrated by the upper limits of the VLBI-to-VLA flux ratio of the un-detected sources, a bright radio source ( 200Jy at 1.4 GHz) with less than 20% of it radio flux contributed by an AGN would probably be missed by VLBI observations at a 1- sensitivity of 10 Jy. Surveys with multiple resolution (e.g. VLA, e-MERLIN, and VLBI) are therefore needed to determine what fraction of the extragalactic objects have similar properties and thus would probably be missed by VLBI.
Acknowledgments
The EVN observations were originally proposed by S. Chi et al. in 2009. Seungyoup Chi passed away in 2011, the final year of his PhD studies. We very much appreciate his contribution to this project, including earlier research on the topic.
HC is funded by the Science and Technology Facilities Council (STFC) and the China Scholarship Council (CSC) (File No.201704910999), we are thankful for their support.
DMA and IRS acknowledge STFC through grant code ST/P000541/1.
IP acknowledges support from INAF under the PRIN SKA/CTA ‘FORECaST’ project.
JFR is funded by the South Africa Radio Astronomy Observatory and is grateful for their support
This research made use of Astropy, a community-developed core Python
package for Astronomy (Astropy Collaboration et al. 2013, 2018).
The European VLBI Network is a joint facility of European, Chinese, South African, and other radio astronomy institutes funded by their national research councils.
e-MERLIN is a National Facility operated by the University of Manchester at Jodrell Bank Observatory on behalf of STFC.
The National Radio Astronomy Observatory is a facility of the National Science Foundation operated under cooperative agreement by Associated Universities, Inc.
References
- Alexander et al. (2005) Alexander, D. M., Bauer, F. E., Chapman, S. C., et al. 2005, ApJ, 632, 736
- Alexander et al. (2008) Alexander, D. M., Brandt, W. N., Smail, I., et al. 2008, AJ, 135, 1968
- Astropy Collaboration et al. (2018) Astropy Collaboration, Price-Whelan, A. M., Sipőcz, B. M., et al. 2018, AJ, 156, 123
- Astropy Collaboration et al. (2013) Astropy Collaboration, Robitaille, T. P., Tollerud, E. J., et al. 2013, A&A, 558, A33
- Bell (2003) Bell, E. F. 2003, ApJ, 586, 794
- Biggs et al. (2010) Biggs, A. D., Younger, J. D., & Ivison, R. J. 2010, MNRAS, 408, 342
- Bonzini et al. (2013) Bonzini, M., Padovani, P., Mainieri, V., et al. 2013, MNRAS, 436, 3759
- Casey et al. (2014) Casey, C. M., Scoville, N. Z., Sanders, D. B., et al. 2014, ApJ, 796, 95
- Chapman et al. (2005) Chapman, S. C., Blain, A. W., Smail, I., & Ivison, R. J. 2005, ApJ, 622, 772
- Chapman et al. (2003) Chapman, S. C., Windhorst, R., Odewahn, S., Yan, H., & Conselice, C. 2003, ApJ, 599, 92
- Chi et al. (2013) Chi, S., Barthel, P. D., & Garrett, M. A. 2013, A&A, 550, A68
- Chi et al. (2009) Chi, S., Garrett, M. A., & Barthel, P. D. 2009, in Astronomical Society of the Pacific Conference Series, Vol. 408, The Starburst-AGN Connection, ed. W. Wang, Z. Yang, Z. Luo, & Z. Chen, 242
- Condon (1992) Condon, J. J. 1992, ARA&A, 30, 575
- Condon et al. (1982) Condon, J. J., Condon, M. A., Gisler, G., & Puschell, J. J. 1982, ApJ, 252, 102
- Condon et al. (2002) Condon, J. J., Cotton, W. D., & Broderick, J. J. 2002, AJ, 124, 675
- Del Moro et al. (2013) Del Moro, A., Alexander, D. M., Mullaney, J. R., et al. 2013, A&A, 549, A59
- Delhaize et al. (2017) Delhaize, J., Smolčić, V., Delvecchio, I., et al. 2017, A&A, 602, A4
- Deller et al. (2011) Deller, A. T., Brisken, W. F., Phillips, C. J., et al. 2011, PASP, 123, 275
- Dowell et al. (2003) Dowell, C. D., Allen, C. A., Babu, R. S. a., et al. 2003, in Society of Photo-Optical Instrumentation Engineers (SPIE) Conference Series, Vol. 4855, Proc. SPIE, ed. T. G. Phillips & J. Zmuidzinas, 73–87
- Elbaz et al. (2002) Elbaz, D., Cesarsky, C. J., Chanial, P., et al. 2002, A&A, 384, 848
- Ellison et al. (2016) Ellison, S. L., Teimoorinia, H., Rosario, D. J., & Mendel, J. T. 2016, MNRAS, 458, L34
- Engel et al. (2010) Engel, H., Tacconi, L. J., Davies, R. I., et al. 2010, ApJ, 724, 233
- Fomalont et al. (2006) Fomalont, E. B., Kellermann, K. I., Cowie, L. L., et al. 2006, ApJS, 167, 103
- Fomalont et al. (2002) Fomalont, E. B., Kellermann, K. I., Partridge, R. B., Windhorst, R. A., & Richards, E. A. 2002, AJ, 123, 2402
- Garrett (2002) Garrett, M. A. 2002, A&A, 384, L19
- Garrett et al. (2001) Garrett, M. A., Muxlow, T. W. B., Garrington, S. T., et al. 2001, A&A, 366, L5
- Garrett et al. (2005) Garrett, M. A., Wrobel, J. M., & Morganti, R. 2005, ApJ, 619, 105
- Guidetti et al. (2017) Guidetti, D., Bondi, M., Prandoni, I., et al. 2017, MNRAS, 471, 210
- Hainline et al. (2011) Hainline, L. J., Blain, A. W., Smail, I., et al. 2011, ApJ, 740, 96
- Herrera Ruiz et al. (2017) Herrera Ruiz, N., Middelberg, E., Deller, A., et al. 2017, A&A, 607, A132
- Hickox et al. (2009) Hickox, R. C., Jones, C., Forman, W. R., et al. 2009, ApJ, 696, 891
- Ivison et al. (2004) Ivison, R. J., Greve, T. R., Serjeant, S., et al. 2004, ApJS, 154, 124
- Ivison et al. (2002) Ivison, R. J., Greve, T. R., Smail, I., et al. 2002, MNRAS, 337, 1
- Ivison et al. (2010) Ivison, R. J., Magnelli, B., Ibar, E., et al. 2010, A&A, 518, L31
- Jarvis et al. (2019) Jarvis, M. E., Harrison, C. M., Thomson, A. P., et al. 2019, MNRAS, 485, 2710
- Juneau et al. (2013) Juneau, S., Dickinson, M., Bournaud, F., et al. 2013, ApJ, 764, 176
- Kennicutt (1998) Kennicutt, Robert C., J. 1998, ARA&A, 36, 189
- Kewley et al. (2000) Kewley, L. J., Heisler, C. A., Dopita, M. A., et al. 2000, ApJ, 530, 704
- Koekemoer et al. (2011) Koekemoer, A. M., Faber, S. M., Ferguson, H. C., et al. 2011, ApJS, 197, 36
- Kovács et al. (2006) Kovács, A., Chapman, S. C., Dowell, C. D., et al. 2006, ApJ, 650, 592
- Laurent et al. (2006) Laurent, G. T., Glenn, J., Egami, E., et al. 2006, ApJ, 643, 38
- Lonsdale et al. (1993) Lonsdale, C. J., Smith, H. J., & Lonsdale, C. J. 1993, ApJ, 405, L9
- Lutz et al. (2005) Lutz, D., Valiante, E., Sturm, E., et al. 2005, ApJ, 625, L83
- Magnelli et al. (2015) Magnelli, B., Ivison, R. J., Lutz, D., et al. 2015, A&A, 573, A45
- Mateos et al. (2017) Mateos, S., Carrera, F. J., Barcons, X., et al. 2017, ApJ, 841, L18
- McMullin et al. (2007) McMullin, J. P., Waters, B., Schiebel, D., Young, W., & Golap, K. 2007, in Astronomical Society of the Pacific Conference Series, Vol. 376, Astronomical Data Analysis Software and Systems XVI, ed. R. A. Shaw, F. Hill, & D. J. Bell, 127
- Menéndez-Delmestre et al. (2007) Menéndez-Delmestre, K., Blain, A. W., Alexand er, D. M., et al. 2007, ApJ, 655, L65
- Menéndez-Delmestre et al. (2009) Menéndez-Delmestre, K., Blain, A. W., Smail, I., et al. 2009, ApJ, 699, 667
- Middelberg et al. (2011) Middelberg, E., Deller, A., Morgan, J., et al. 2011, A&A, 526, A74
- Middelberg et al. (2010) Middelberg, E., Deller, A., Morgan, J., et al. 2010, in 10th European VLBI Network Symposium and EVN Users Meeting: VLBI and the New Generation of Radio Arrays, Vol. 10, 26
- Middelberg et al. (2013) Middelberg, E., Deller, A. T., Norris, R. P., et al. 2013, A&A, 551, A97
- Murphy et al. (2009) Murphy, E. J., Chary, R. R., Alexander, D. M., et al. 2009, ApJ, 698, 1380
- Muxlow et al. (2005) Muxlow, T. W. B., Richards, A. M. S., Garrington, S. T., et al. 2005, MNRAS, 358, 1159
- Padovani et al. (2015) Padovani, P., Bonzini, M., Kellermann, K. I., et al. 2015, MNRAS, 452, 1263
- Planck Collaboration et al. (2016) Planck Collaboration, Ade, P. A. R., Aghanim, N., et al. 2016, A&A, 594, A13
- Pope et al. (2008) Pope, A., Chary, R.-R., Alexander, D. M., et al. 2008, ApJ, 675, 1171
- Prandoni et al. (2018) Prandoni, I., Guglielmino, G., Morganti, R., et al. 2018, MNRAS, 481, 4548
- Radcliffe et al. (2019) Radcliffe, J. F., Beswick, R. J., Thomson, A. P., et al. 2019, MNRAS, 2500
- Radcliffe et al. (2016) Radcliffe, J. F., Garrett, M. A., Beswick, R. J., et al. 2016, A&A, 587, A85
- Radcliffe et al. (2018) Radcliffe, J. F., Garrett, M. A., Muxlow, T. W. B., et al. 2018, A&A, 619, A48
- Richards (2000) Richards, E. A. 2000, ApJ, 533, 611
- Risaliti et al. (1999) Risaliti, G., Maiolino, R., & Salvati, M. 1999, ApJ, 522, 157
- Sargent et al. (2012) Sargent, M. T., Béthermin, M., Daddi, E., & Elbaz, D. 2012, ApJ, 747, L31
- Shankar et al. (2009) Shankar, F., Weinberg, D. H., & Miralda-Escudé, J. 2009, ApJ, 690, 20
- Simpson et al. (2014) Simpson, J. M., Swinbank, A. M., Smail, I., et al. 2014, ApJ, 788, 125
- Smolčić et al. (2017) Smolčić, V., Novak, M., Delvecchio, I., et al. 2017, A&A, 602, A6
- Solarz et al. (2019) Solarz, A., Pollo, A., Bilicki, M., et al. 2019, PASJ, 71, 28
- Stach et al. (2019) Stach, S. M., Dudzevičiūtė, U., Smail, I., et al. 2019, MNRAS, 487, 4648
- Swinbank et al. (2006) Swinbank, A. M., Chapman, S. C., Smail, I., et al. 2006, MNRAS, 371, 465
- Swinbank et al. (2014) Swinbank, A. M., Simpson, J. M., Smail, I., et al. 2014, MNRAS, 438, 1267
- Swinbank et al. (2004) Swinbank, A. M., Smail, I., Chapman, S. C., et al. 2004, ApJ, 617, 64
- Swinbank et al. (2010) Swinbank, A. M., Smail, I., Chapman, S. C., et al. 2010, MNRAS, 405, 234
- Thomson et al. (2014) Thomson, A. P., Ivison, R. J., Simpson, J. M., et al. 2014, MNRAS, 442, 577
- Ulvestad et al. (2005) Ulvestad, J. S., Antonucci, R. R. J., & Barvainis, R. 2005, ApJ, 621, 123
- Valiante et al. (2007) Valiante, E., Lutz, D., Sturm, E., et al. 2007, ApJ, 660, 1060
- Wang et al. (2013) Wang, S. X., Brandt, W. N., Luo, B., et al. 2013, ApJ, 778, 179
- Wolf et al. (2003) Wolf, C., Wisotzki, L., Borch, A., et al. 2003, A&A, 408, 499
- Wright (2006) Wright, E. L. 2006, PASP, 118, 1711