Dynamic length scales in athermal, shear-driven, jamming of frictionless disks in two dimensions
Abstract
We carry out numerical simulations of athermally sheared, bidisperse, frictionless disks in two dimensions. From an appropriately defined velocity correlation function, we determine that there are two diverging length scales, and , as the jamming transition is approached. We analyze our results using a critical scaling ansatz for the correlation function, and argue that the more divergent length is a consequence of a dangerous irrelevant scaling variable, and that it is which is the correlation length that determines the divergence of the system viscosity as jamming is approached from below in the liquid phase. We find that diverges with the critical exponent . We provide evidence that measures the length scale of fluctuations in the rotation of the particle velocity field, while measures the length scale of fluctuations in the divergence of the velocity field.
I Introduction
Athermal granular and related soft matter materials, such as non-Brownian suspensions, emulsions, and foams, all undergo a phase transition from a liquid-like state to a rigid but disordered solid state as the packing fraction of the granular particles increases. This is known as the jamming transition LiuNagel ; OHern . In isotropic jamming, mechanically stable configurations are generated by isotropically compressing the system, or by quenching random initial configurations OHern ; Wyart ; Chaudhuri ; Vagberg.PRE.2011 . At low particles may avoid each other and the system pressure . At a critical a system spanning rigid cluster forms and the system pressure becomes finite. In shear-driven jamming OT1 ; OT2 ; VagbergOlssonTeitel ; OT3 ; Hatano1 ; Hatano2 ; Hatano3 ; Otsuki ; Heussinger1 ; Heussinger2 the system is uniformly sheared at a fixed strain rate . In a system with a Newtonian rheology, such as for particles in suspension, at low and small the system flows with a shear stress , and thus a finite viscosity . But above a critical the system develops a finite yield stress and .
For the idealized case of frictionless particles, the jamming transitions behave in many respects like continuous phase transitions OHern ; OT1 ; OT2 ; VagbergOlssonTeitel . In isotropic jamming, in the limit of quasistatic compression, the pressure increases algebraically from zero as increases above OHern . In shear-driven jamming, in the limit of quasistatic shearing, the yield stress (as well as the pressure along the yield stress line) similarly increases algebraically from zero as increases above OT1 ; OT2 ; Heussinger1 . This analogy with continuous phase transitions suggests that there should be a critical correlation length that diverges as the jamming transition is approached, and it is the divergence of this that sets the singular behavior of other observable quantities. The goal of this work is to identify this for shear-driven jamming in a simple model with Newtonian rheology in two dimensions, and to determine the critical exponent that controls it algebraic divergence at .
For isotropic jamming, an analysis of the modes of small vibration of mechanically stable packings above by Silbert et al. Silbert led to diverging longitudinal and transverse lengths in the solid phase, and , with and . A diverging isostatic length scale , measuring the deviation of the average particle contact number from the frictionless isostatic value in dimensions, was predicted from analytical arguments by Wyart et al. Wyart2 . Since OHern , one finds . Recently, Hexner et al. Hexner have proposed two new diverging length scales above , associated with correlations of the average particle contact number, and associated with contact number fluctuations. They find , with in dimensions and 0.85 in dimensions; and , with in and 1.29 in .
Drocco et al. Drocco determined a diverging length scale with exponent by considering the size of the cluster of particles that is dragged along by an intruder forced through the system at different packings in two dimensions. A similar value of was found by O’Hern et al. OHern from looking at the scaling of the critical with system size in mechanically stable packings in both two and three dimensions. However a finite-size scaling analysis by Vågberg et al., VOT for both isotropic and shear-driven jamming in two dimensions, argued that the value was an artifact of not including corrections to scaling, and that once such corrections are included one finds . However others have challenged whether such a finite-size scaling analysis correctly probes the correlation length in dimensions. Above the upper critical dimension (), where mean-field results hold, one expects quantities to scale with system length according to . Since some arguments suggest that for the jamming transition Wyart ; Wyart3 ; Goodrich ; Charbonneau ; Goodrich2 , a value , determined from finite-size scaling in , could thus reflect this mean-field behavior rather than the scaling of the correlation length .
For sheared systems, Heussinger and Barrat Heussinger1 argued that, for , one could define an isostatic length scale , similarly to that defined above . However, unlike for mechanically stable states above , they found for quasistatically sheared configurations below jamming that , thus implying with . Numerical results in this work then found in the range of 0.8–1.0. In later work, Heussinger et al. Heussinger3 defined several other length scales for sheared systems below jamming, , obtained by measuring the variation of different properties as the system evolves with increasing strain . From measurements of the mean-squared particle displacement they found ; from measurements of particle overlap they found ; and from measurements of the dynamical susceptibility they found . These observations could be consistent with . Düring et al. During2 , however, predicted that for sheared systems there are two diverging length scales, and , but argue that it is that sets the length scale of velocity correlations. Assuming then gives . While Ref. During2 presents numerical support for these two lengths scales for a model network of rigid rods, the numerical results for particle suspensions are less clear. For suspensions, the authors state that their system sizes are not sufficiently large for them to numerically test their prediction concerning . The smaller length describes only the decay of the velocity correlation function on relatively short length scales , such that the correlation decays to a relative value of about 0.2 (see their Fig. 7). In contrast, here we will be concerned with behavior on long length scales, where the correlation has already decayed to a relative value of around 0.05 and smaller.
In this work we reexamine the question of the correlation length in athermally sheared suspensions of frictionless particles. Our goal is to make a direct measurement of the correlation length by looking at the spatial decay of an appropriate velocity correlation function. Experimental measurements by Pouliquen Pouliquen , of velocity correlations for grains flowing down a rough inclined plane, showed an increase in the correlation length as the angle of incline, and hence the average flow velocity, decreased. In an early work on shear-driven jamming OT1 we proposed a correlation length , obtained from the transverse velocity correlation function. Carrying out a critical scaling analysis we concluded that the correlation length exponent was , similarly to the value obtained in several earlier works OHern ; Drocco . In this work, however, we argue that our previous analysis was incorrect, because of a failure to appreciate the effects of multiple length scales. We present a new, more careful, analysis of a somewhat different velocity correlation function, and now conclude that for two dimensions.
The remainder of our paper is organized as follows. In Sec. II we present the model we use for our simulations, which is the Durian “mean-field” model for foams Durian . In Sec. III we review our earlier results OT1 for the transverse velocity correlation function and indicate the difficulty with our earlier analysis. In Sec. IV we define a new velocity correlation function and present our numerical analysis which demonstrates that there are two different divergent lengths, and , each diverging with a different critical exponent at jamming. In Sec. V we present a scaling analysis for our velocity correlation and argue that the diverging length is a consequence of a dangerous irrelevant scaling variable. In Sec. VI we show that, while diverges more rapidly than as jamming is approached, it is nonetheless that is the proper correlation length that determines the divergence of the viscosity as jamming is approached. In Sec. VII we provide a physical interpretation for the two diverging lengths, showing that is associated with the rotation of the particles’ velocity field, while is associated with the divergence of the velocity field. Finally in Sec. VIII we summarize our conclusions.
II Model
We use a well studied model of size-bidisperse, frictionless, soft-core circular disks in two dimensions OHern . We take equal numbers of big and small disks with diameter ratio of . Particle center of mass positions and velocities are denoted as and , respectively.
When two particles overlap, they experience a repulsive elastic force. If is the center-to-center distance between two disks, then a pair of disks will overlap whenever . The interaction between particles is taken as simple one-sided harmonic potential,
| (1) |
where is the stiffness constant of the interaction. When particles overlap, the elastic force on particle due to its contact with is thus
| (2) |
with the inward normal to the surface of particle at its point of contact with .
Particles also experience a dissipative force, which we model as a viscous drag with respect to a uniformly sheared host medium, as for a particle in suspension,
| (3) |
where is the shear strain rate, the viscous drag coefficient, and the flow is in the direction OT1 ; OT2 .
We use an overdamped equation of motion,
| (4) |
where the sum is over all particles in contact with . This leads to the equation of motion for particle ,
| (5) |
which is equivalent to the Durian bubble model Durian for foams in his “mean field” limit. Uniform simple shearing is applied using Lees-Edwards boundary conditions LeesEdwards on a system of equal length and height . While this model is greatly simplified, it is a well studied and commonly used model for studying the criticality of frictionless shear-driven jamming for a system with Newtonian rheology Tewari ; Andreotti ; Lerner ; Vagberg.PRL.2014 ; DeGiuli ; Berthier .
For our simulations we take the unit of length as , the unit of energy as , and the unit of time as . The equations of motion are integrated using the Heun method with an integration step . Unless stated otherwise, our simulations use a total of particles, varying at the fixed packing , which we have previously determined OT2 ; VOT to be the shear-driven jamming of our model. At this packing the system has a length . We typically shear our simulations to a total strain of for the largest , and to for the smallest . We start our shearing runs from an initial random configuration at the largest . For each smaller we start with a configuration from the next larger .
III Transverse velocity correlation
In our previous work on shear-driven jamming OT1 we proposed a measure of the correlation length from consideration of the transverse velocity correlation function, and argued for a correlation length exponent . In this section we show why this prior work is incorrect. However, first we make a more general comment about our prior work OT1 . While we believe that the multivariable critical scaling introduced in OT1 is valid and provided a new understanding of the shear-driven jamming transition, none of the specific numerical values for critical exponents or the jamming density that we reported in Ref. OT1 are, to our current understanding, correct. The scaling collapses that determined the values of critical parameters in Ref. OT1 were obtained by eyeball estimates of goodness of fit. We have since demonstrated (see Ref. VagbergOlssonTeitel Sec. V.A) that such eyeball estimates can often be misleading and that a more systematic analysis is required. We carried out such a systematic study for our current model in Ref. OT2 , where we found that corrections to scaling (ignored in Ref. OT1 ) were needed to correctly describe our numerical results. We will show in the present work that corrections to scaling are similarly needed for a correct description of the velocity correlation function. Note that the values of and the critical exponent that we use in the present analysis are the values obtained by us in Ref. OT2 . We now turn back to the velocity correlation function.
Asymptotically close to the jamming point the critical scaling equation for the correlation length, ignoring corrections to scaling, is
| (6) |
with , is the correlation critical exponent, the dynamic critical exponent, and an arbitrary length rescaling factor VagbergOlssonTeitel . If we set , then the above becomes
| (7) |
where is for and is for . Taking , we expect is a finite constant, and we then have the usual . But if we take , then we get
| (8) |
Expecting to be a finite constant, at () we then get .
In this section and the next, we consider the behavior of the velocity correlation for varying at fixed , and thus attempt to determine the critical exponent . Using the value , obtained from our earlier scaling analysis of the stress OT2 , we can then find the value of .
In our earlier work OT1 we considered the correlations of the component of the particle velocity transverse to the direction of the shear flow,
| (9) |
The normalization is chosen so that . By translational symmetry, the above correlation is independent of the position , and depends only on the separation . To compute velocity correlations we use the following method. The continuous system is discretized by a square grid of boxes, where the grid box is sufficiently small that only a single particle can have its center in any given box. The boxes that contain the center of a particle are then assigned the velocity of that particle. The correlation is then computed by averaging over pairs of boxes with the specified separation, and then averaging over different configurations within the sheared steady-state ensemble. Empty boxes are not included in this calculation.
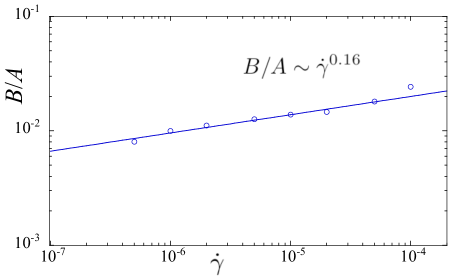
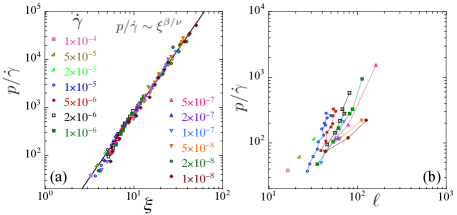
In Fig. 1(a) we plot vs for different strain rates at the fixed OT2 . We see that the correlation decreases, reaches a minimum at a distance we will denote as , and then increases again to decay to zero. The location of the minimum sets a length scale for the system. We see that increases as decreases and one approaches the jamming critical point. In Fig. 1(b) we plot vs and find a reasonable fit to the powerlaw , with . Using the value , obtained from our earlier analysis of stress OT2 , we then get a value of . This value differs from the of our earlier work OT1 because the value of the critical claimed in that work was later found, by a more careful analysis OT2 , to be too low. However the analysis presented here still illustrates how one typically gets values from such an approach.
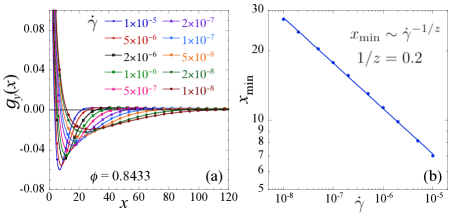
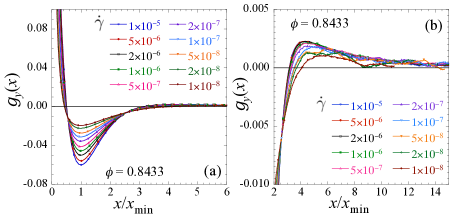
Although the fit in Fig. 1(b) looks good, there are problems with this analysis. If were indeed the correlation length, and this were the only important length scale in the problem for distances , then we would expect that all features in the curves vs for different would align when plotting vs . We show such a scaled plot in Fig. 2. In Fig. 2(a) we show a range of that includes the minimum at . In Fig. 2(b) we show a blow up of the plot in Fig. 2(a) that focuses on the region above the minimum. Here we clearly see that does not stay negative as it decays to zero, but in fact turns positive again, reaches a maximum, and then decays to zero. Comparing the curves of different , neither the location where crosses zero, nor the location where has its maximum, align when plotting vs . Both and increase as decreases. This thus indicates that the correlation at large is governed by more than one length scale.
While the divergence of as jamming is approached indicates that there is indeed a diverging length scale in the problem, it would seem that the value of is determined by the competition of two or more length scales that diverge differently. The exponent found in Fig. 1(b) from the fit of should be regarded as only an effective exponent for a specific range of , rather than the true dynamic exponent associated with the divergence of the correlation length as one gets asymptotically close to jamming.
One could attempt to determine the different length scales contributing to if one had a good analytic approximation to the functional form of . Fitting to that form would allow one to extract the different lengths and see how they separately behave as jamming is approached. However, the complex structure of , decreasing, then increasing, and then decreasing again toward zero, leaves us without any good analytical form for such a fit. In the following section, we therefore consider an alternative velocity correlation for which such an analysis is possible.
IV Alternative velocity correlation
To measure a correlation length, one would in principle like to find a quantity whose correlation displays a simple exponential decay at large lengths. Clearly does not do so. We have also considered
| (10) |
where
| (11) |
is the nonaffine part of the velocity of particle , i.e., the fluctuation of the velocity away from a uniform shear flow (note since the affine part of the velocity is strictly in the direction). In general, is also not a simple exponential decay, but unlike it appears to have only a single extremum; as increases, decreases, reaches a minimum, and then increases to decay to zero while staying negative. We thus find that we can reasonably parametrize as the sum of two exponentials with possibly different decay lengths.
While such a procedure works reasonably well for , after some trial and error, we have found that a two exponential parametrization works even better gxvsg , giving more accurate results, when applied to an alternative velocity correlation function given by
| (12) |
Hence, in this section we will focus on . We will provide a physical interpretation for this particular correlation later in Sec. VII. Defining
| (13) |
with and both positive, we find a reasonable fit to Eq. (12) by taking
| (14) |
where the second term is used to enforce the periodic boundary condition, .
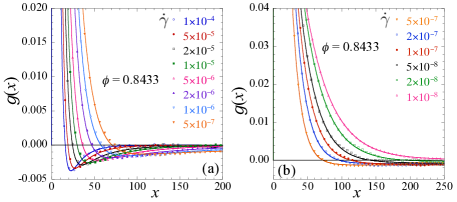
In Fig. 3 we plot vs for different strain rates at the fixed . In Fig. 3(a) we show results for the larger strain rates . Our results are from systems with particles, except for the three largest strain rates, which use particles. The solid lines are fits to Eq. (14) using the form of Eq. (13) for . We see clearly the nonmonotonic behavior as increases that requires the use of the two-exponential form of Eq. (13).
In Fig. 3(b) we show results for . For these smaller values of , while is still seen to go negative, the minimum in becomes very shallow and indeed seems to vanish at the smallest . As we will see below, the length has grown large, almost to the size , while the coefficient ratio is decreasing. It is thus numerically unstable to try to fit to Eq. (13) and determine . Nevertheless we can still hope to determine from the initial decay of . For this we empirically fit to the simpler form given by Eq. (15) below,
| (15) |
Such fits give the solid lines in Fig. 3(b).
In Fig. 4 we plot the resulting values of and , as obtained from the fits described above. For we use the two-exponential form of Eq. (13) to determine both and . For we use the simpler form of Eq. (15) to determine . For comparison, and to indicate how well we might expect Eq. (15) to do, we also show results for obtained at larger by fitting to Eq. (15), but limiting the data used in the fit to . We see that the values of obtained from this simpler fit of Eq. (15) tend to be slightly smaller than those obtained from Eq. (13), but that the two approach each other as decreases. This gives us confidence that the values of obtained at low via Eq. (15) are reasonable.
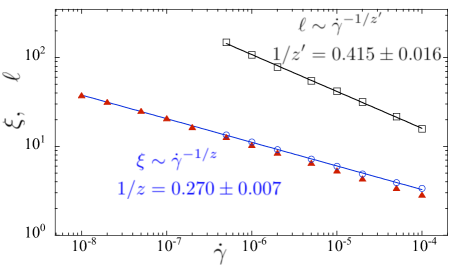
We see that for both and , the data in Fig. 4 fall on a nice straight line, giving a power-law divergence for each length, with , and with . Using OT2 we then get a correlation length exponent of for , and for . The length thus diverges more rapidly than the length , while diverges with an exponent consistent with . This is the main result of this work. Note, by construction, .
V Scaling Analysis
In this section we address the question of how there can be two different diverging length scales and , with different critical exponents. We start with a usual scaling ansatz for the correlation function Chaikin ,
| (16) |
As with Eq. (6), is the correlation length exponent, the dynamic critical exponent, and an arbitrary length rescaling factor. Since the separation is a length, it must scale in the combination . We also add to Eq. (16) the leading correction-to-scaling variable OT2 ; VagbergOlssonTeitel ; Berthier . Since, in the scaling sense, is an irrelevant variable, its scaling exponent must be negative, so that the scaling variable vanishes in the limit of large length scales, Binder ; Hasenbusch .
If we now choose , then the above becomes
| (17) |
If we assumed that the irrelevant variable can be ignored (i.e., set ), then we would conclude that at , i.e., at , the correlation depends on distance only through the term . This would thus define the correlation length as
| (18) |
For the more general case of , would scale as in Eq. (8). This approach gives only a single diverging length scale .
However, in the previous section we have found empirically that there are two diverging length scales, and . We can extract such a second diverging length scale from Eq. (17) if, instead of assuming can be ignored, we assume that is a dangerous irrelevant variable Chaikin , and that the scaling function contains a term proportional to . In this case, when , will depend on distance through the two terms and . A new diverging length scale
| (19) |
thus appears. Since must be positive, diverges more rapidly as than does . Since the irrelevant variable is presumed to be small, is large. Both these conclusions are in accord with our findings in the previous section.
For , should become independent of as . Since the scaling function depends on the packing via the variable , we conclude that, as , . Comparing with our notation of the previous section we thus have at ,
| (20) |
while for as ,
| (21) |
Using the values of and obtained in Fig. 4, we get .
The above arguments yield several testable predictions. Assuming the scaling function is reasonably described by the empirical form of Eq. (13), then at (i.e., ) the coefficient ratio can only depend on the scaling variable . The simplest assumption is that varies linearly in this variable. In this case we expect , with . In Fig. 5 we plot vs at . We use only results for , where we can fit to the form of Eq. (13), and thus accurately determine the coefficient of the second exponential term that arises from the correction to scaling variable . We see a fair power-law behavior, , with an exponent in good agreement with .
Thus, as , we see that while diverges faster than the length , the exponential term involving the decay length becomes negligible compared to the exponential term that decays with . This is consistent with the assumption that the term involving arises from an irrelevant variable .
The preceding discussion has focused on behavior at the jamming . Another testable prediction involves behavior at . The scaling equation (17) predicts that for , the quantities , , and will be modified by scaling functions that depend only on the variables and ,
| (22) |
| (23) |
| (24) |
If we assume that the irrelevant variable is sufficiently small that it can be neglected in the above (i.e. ), then we expect that plotting the left-hand side of each of Eqs. (22)–(24) vs will result in a collapse of the data to a common curve.
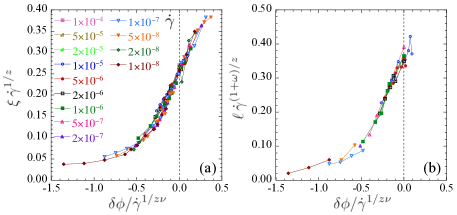
In Fig. 6(a) we plot vs for different strain rates . The values of come from fits to either Eq. (13) or (15), as needed. In Fig. 6(b) we plot vs . The values of come from fits to only Eq. (13). Just as in Fig. 4 at , there are considerably fewer data points for than for since fits to Eq. (13) become unreliable as gets large. In Fig. 7 we show the corresponding scaled plots of and vs . As expected, we find a reasonable data collapse in both cases. In Fig. 7(a), where there are more data points, we see that the curves for different slightly increase, away from the limiting curve, as increases. This is an indication that, for the larger , the correction-to-scaling variable is not quite negligible.
[t]
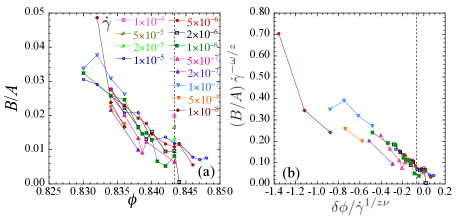
In Fig. 8(a) we plot the coefficient ratio vs for different strain rates . The results for and used here come only from fits using Eq. (13). Compared to our data for and in Fig. 6, the data for are considerably noisier. In Fig. 8(b) we show the corresponding scaled plot of vs . The collapse is similarly less satisfactory than the corresponding collapses for and in Fig. 7. For this collapse we have used the value of , using the values of and from the fits to and of Fig. 4. If we used instead , from the fit to at of Fig. 5, then the collapse does not visibly improve.
One reason that the scaled plot of fails to collapse nicely might be the effect of the correction-to-scaling variable , as we have discussed above in connection with . But two other, probably more serious, reasons are the following. (i) The fitting form of Eq. (13) is only an approximation to the true scaling function. Forcing the scaling function to fit to this form might skew results for the amplitudes and to a greater extent than for the length scales and . (ii) Fitting to Eq. (13), and accurately determining the second exponential term, becomes difficult when is large. Indeed, we see in Fig. 8(b) that it is the data at small rates (the same range where we cannot determine when ) where the data depart most from a common curve; the data for collapses to a much better extent. Thus we conclude that the behavior of , while lacking the precision of other quantities, is consistent with our scaling analysis.
There is one troubling aspect of our analysis above. Here we have argued that the correction to scaling exponent found from is . However, in our earlier critical scaling analysis of the pressure OT2 , that included corrections to scaling, we found . Thus the found in this work is half the value found from our scaling analysis of pressure. It could be that the leading correction-to-scaling variable that effects is different from the one that effects . Or it could be that the scaling equation for ,
| (25) |
is such that when one expands the scaling function about , the leading term is proportional to , rather than . This would cause the correction-to-scaling term in the scaling of to scale as , and therefore reconcile that analysis with the present one.
VI Relation between and
In Sec. IV we identified two diverging length scales, and . In Sec. V we presented a scaling analysis that indicated that, while diverges more rapidly than as the jamming transition is approached, arises from an “irrelevant” (in the renormalization group sense) variable. Thus we expect that it is that is the correlation length that determines the singular behavior of global quantities at jamming. Here we present further evidence to support this view.
Consider the transport coefficient , which is the pressure analog of the shear viscosity. As , in the liquid-like phase below , this transport coefficient diverges algebraically, , as the jamming transition is approached OT1 ; OT2 ; VagbergOlssonTeitel . This divergence is due to the diverging correlation length. In Fig. 9(a) we plot vs the length , and in Fig. 9(b) we plot vs the length . The data in these figures are at the same set of values as in Fig. 6. When plotting vs , the data for give an excellent collapse to a common curve with a simple power-law relation,
| (26) |
Fitting the data for gives the exponent . However, there is no collapse when plotting vs . This indicates that it is and not that controls the divergence of , as one approaches the jamming transition.
The scaling behavior of follows from that of Eq. (25). Assuming that, to lowest order, the correction-to-scaling variable may be ignored, we have,
| (27) |
where . For , we thus have . Since when , it then follows that when . For , we know that has a finite limit as ; it thus must be true that , so that the scaling Eq. (27) yields as . In this same limit we have . Thus, as for , we again recover . Using the values from the fit in Fig. 9(a), and from our results of Sec. IV, we thus get . This is in excellent agreement with our earlier results from a direct scaling analysis of the rheology OT2 ; OT3 .
Note that, unlike the scaling analysis of Refs. OT2 ; OT3 , the analysis of Fig. 9(a) allows the determination of without the need to know the value of . In an earlier work Olsson1 , one of us established that, for , scales the same as the relaxation time that describes the decay of a sheared configuration to zero energy, once the shearing has been turned off. Since it is known that the system is isostatic at jamming, with the average contact number per particle in two dimensions, plotting vs yields a power-law behavior . Here is the average contact number of the energy relaxed state. Thus one can determine the exponent , again without having to know the value of . Here is the exponent that determines how the contact number varies as the packing decreases below , . The analysis in Ref. Olsson1 gave , while that in Ref. Lerner gave . Comparing to the value found here yields the conclusion , and so , in agreement with the earlier results of Ref. Heussinger1 . Taking from our analysis of Sec. IV, we also conclude that , again recovering earlier results of Ref. Heussinger1 .
While, from the above arguments, we expect Eq. (26) to hold both exactly at , and for below , it is surprising to find in Fig. 9(a) that this relation seems to hold more generally, for any and . Comparing Eqs. (22) with (27), we see that for this relation to hold in general, it is necessary that the respective scaling functions for and for obey the relation,
| (28) |
In general, a scaling approach does not assume any knowledge about the details of the scaling function, or the relation between scaling functions of different quantities as in Eq. (28), except for behaviors in different asymptotic limits. However the more general result of Eq. (26) can be shown to follow from an effective density approximation that we have introduced previously OT3 , and which we have found to describe well the rheology of the system, provided one does not go too far above . We have found that behavior at a given and is well described by considering the system to be in the hard-core limit, but at an effective packing given by , where is the elastic energy of the system at the given packing and strain rate, and .
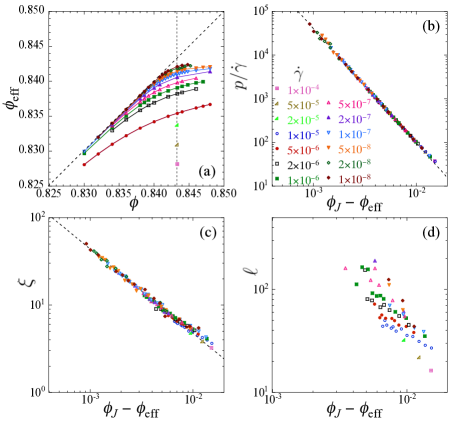
In Fig. 10(a) we plot vs for different . For , the smaller the , the closer one is to the hard-core limit, and the smaller is the deviation of from . In Figs. 10(b), 10(c), and 10(d) we plot , , and , respectively, vs , using . We see that the data for and collapse to a nice power-law scaling,
| (29) | ||||
| (30) |
from which the general result of Eq. (26) follows for any and . For we find no such nice collapse.
We have empirically found that our effective density approximation describes well the leading critical singularity, but does not describe well effects due to corrections to scaling. This is the reason we have considered here instead of the related shear viscosity . In OT2 we demonstrated that corrections to scaling are considerably smaller for than they are for . That the data in Figs. 9(a), 10(b) and 10(c) are simple power-law relations is a signature that, for these quantities, the corrections to scaling are generally small for our range of data. However, from Eq. (19) we see that the length would diverge in the limit of , when corrections to scaling vanish. Thus, unlike and which have well defined limiting behaviors as , the length requires the corrections to scaling to be finite in order for to be finite. We believe this is the reason that in Fig. 10(d) shows no nice collapse when plotted vs .
VII Rotation and divergence of the velocity field
In this section we provide a physical interpretation for the particular velocity correlation of Eq. (12), as well as a physical interpretation of the lengths and . We first consider the mixed correlation of different velocity components, , where again is the nonaffine part of the particle velocity field, i.e., the fluctuation of the velocity away from a uniform shear flow. For along the flow direction, this correlation vanishes by symmetry, . However, this is not the case for along the system diagonal. With the unit vector in the diagonal direction, the correlation of the components,
| (31) |
as shown in Fig. 11(a), is in general nonvanishing. The geometry of this correlation suggests that it is a measure of the rotation of fluctuations of the velocity field Olsson2 .
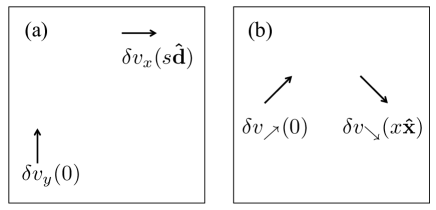
In our shearing geometry, with periodic boundary conditions in the direction, and Lees-Edwards boundary conditions in the direction, it is easiest to measure correlations along the direction, rather than along . We therefore define correlations similar to Eq. (31) as follows. With as defined above, and the orthogonal unit vector , we define
| (32) | ||||
| (33) |
We can then consider the correlations,
| (34) |
We find numerically that these two correlations are equal. The first of these correlations, shown in Fig. 11(b), is related to that of Eq. (31) by making a clockwise rotation by . Substituting Eqs. (32) and (33) into Eq. (34), and comparing with Eq. (12), we then find that
| (35) |
Our alternative velocity correlation is thus a measure of the rotation of the velocity-field fluctuations.
This observation also suggests an interpretation for the the second exponential term of Eq. (13), , which gives a negative contribution to . That this term is negative implies that there is a contribution to the correlation that is positive; such a term is related to the divergence of the velocity-field fluctuations. Our interpretation is thus that measures the size of fluctuations in the rotation of the velocity field, whereas measures the size of fluctuations in the divergence of the velocity field. We now proceed to demonstrate this by a direct calculation.
In principle one would like to directly compute the correlations of the rotation, , and divergence, , of velocity fluctuations. However that would require both a discretization of the velocity field to a grid, and then also the discretization of the velocity derivates. Instead, we take a different approach. We consider a circular window of radius centered about a point . We then compute the integrals of the rotation and the divergence of over the area of
| (36) |
and
| (37) |
where is the circumference of , and and are the unit tangent and unit normal vectors to . Since the velocity field is only defined discretely at the sites of individual particles, we approximate the above integrals by
| (38) |
where the sums are over all particles that lie within an annulus centered at radius and of thickness .
Since , it necessarily follows that . However we find that, for sufficiently large , the mean-square fluctuations and scale . This can be rationalized if we think of as being a local quantity that fluctuates independently on sufficiently large length scales; then both and will scale proportional to the area of . If we define as the number of particles within the annulus , then similarly . The quantities and then represent the mean-square fluctuations of the normal and tangential components of the velocity per particle within the annulus. If velocity fluctuations were uncorrelated from particle to particle, and if velocity fluctuations were independent of orientation, then these quantities would both be equal to . We therefore define,
| (39) | ||||
| (40) |
where denotes an average over both the center position of the circular window within a given configuration, as well as over different configurations within the sheared steady state. The difference of and from unity is then a measure of the effect of velocity correlations.
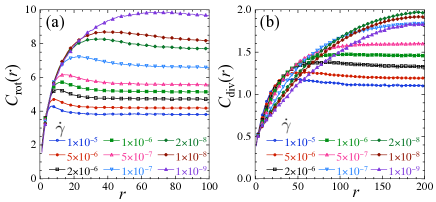
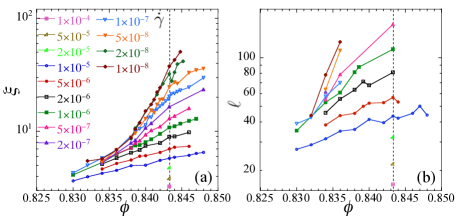
In Fig. 12(a) we plot vs for different strain rates at the fixed . We see that as increases, increases until it reaches a maximum, and then decreases a bit and plateaus to a constant. The location of the maximum at sets the length scale on which fluctuations saturate. We see that increases as decreases. In Fig. 12(b) we plot . Here we see a similar behavior. As increases, increases, reaches a maximum, and then plateaus to a constant. The location of the maximum at increases as decreases. However for the smallest , the curves continue to increase with and no maximum can be determined; this is because the relevant length scale has become too big compared to the finite length of our system.
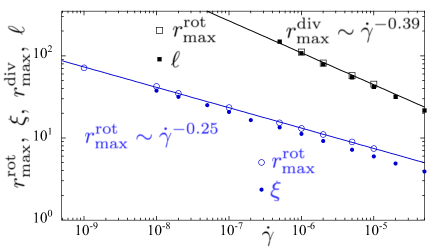
In Fig. 13 we plot the locations of these maxima, and , vs strain rate at fixed ; these are shown as the open symbols. The solid lines show power-law fits to these data, giving an exponent 0.25 for and 0.39 for . These values are in reasonable agreement with the exponents and found for the velocity length scales and in Fig. 4 of Sec. IV. To highlight this point, we also show as solid symbols in Fig. 13 the data for and from Fig. 4. We clearly see that and .
We thus conclude from this analysis that the correlations lengths and , obtained from the velocity correlation , have the following interpretation. The length measures the characteristic length scale of fluctuations in the rotation of the particle velocity field , while measures the characteristic length scale of fluctuations in the divergence of .
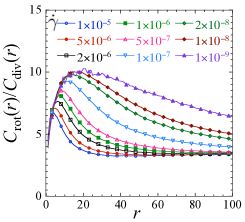
Note one additional point. For the curves for different appear to be approaching a common limiting curve in the hard-core limit, as . We find that this curve is logarithmic. The behavior of is less clear. If we look at the ratio of , shown in Fig. 14, then we see that this ratio reaches a maximum at an that increases with decreasing , but that the large limit appears to be constant for all , .
VIII Summary
To summarize our results, we have considered the length scales that characterize the fluctuations of the particle velocity field , in a simple-sheared system of athermal, bidisperse, frictionless circular disks in two dimensions, sheared at a constant rate . We have shown that our earlier analysis OT1 of the transverse velocity correlation function gave an erroneous value for the correlation length exponent , because of a failure to appreciate the effects of multiple length scales. We have then introduced an alternative velocity correlation function , related to the rotation of the velocity fluctuations, and find that it is reasonably characterized in terms of two different length scales and . By considering behavior for varying at the jamming , we find numerically that these two lengths diverge with different critical exponents, with diverging more rapidly than as the jamming point is approached.
We then provide an analysis of in terms of a critical scaling ansatz. In terms of this scaling ansatz, is seen to arise from the effects of a dangerous irrelevant, correction-to-scaling, variable. This scaling analysis provides self-consistent results for both the relative amplitudes of the competing terms involving the two length scales, as well as for behavior when . Although the length diverges more rapidly than , we find that the term involving scales to zero as jamming is approached. The identification of with the effects of an irrelevant variable then leads to the conclusion that it is which is properly identified as the correlation length that controls the critical behavior at jamming, and we find results consistent with an exponent , in agreement with an earlier finite-size scaling analysis VOT . The length diverges with the exponent , with the correction-to-scaling exponent . We discussed how this value of can be reconciled with our earlier determination of in Ref. OT2 .
Supporting our conclusion that is the correlation length, we have shown how the pressure analog of viscosity, , scales as a simple powerlaw of , , over a wide range of strain rates and packing fractions . We show that this result follows from an effective density approximation, in which the behavior of the system at packing and finite strain rate can be mapped onto a hard-core system (i.e., at an effective packing . But we find no such simple relation between and , nor is the behavior of well described by the effective density approximation.
Finally we have provided the physical significance of the two lengths and . By directly considering the fluctuations of the rotation of the velocity field, , and the divergence of the velocity field , we show that sets the length scale on which fluctuations in the rotation of saturate, while sets the length scale on which fluctuations in the divergence of saturate.
Acknowledgements
This work was supported in part by National Science Foundation Grant No. DMR-1809318. The simulations were performed on resources provided by the Swedish National Infrastructure for Computing (SNIC) at HPC2N.
References
- (1) A. J. Liu and S. R. Nagel, The jamming transition and the marginally jammed solid, Annu. Rev. Condens. Matter Phys. 1, 347 (2010).
- (2) C. S. O’Hern, L. E. Silbert, A. J. Liu, and S. R. Nagel, Jamming at zero temperature and zero applied stress: The epitome of disorder, Phys. Rev. E 68, 011306 (2003).
- (3) M. Wyart, L. E. Silbert, S. R. Nagel, and T. A. Witten, Effects of compression on the vibrational modes of marginally jammed solids, Phys. Rev. E 72, 051306 (2005).
- (4) P. Chaudhuri, L. Berthier, and S. Sastry, Jamming transitions in amorphous packings of frictionless spheres occur over a continuous range of volume fractions, Phys. Rev. Lett. 104, 165701 (2010).
- (5) D. Vågberg, P. Olsson, and S. Teitel, Glassiness, rigidity, and jamming of frictionless soft core disks, Phys. Rev. E 83, 031307 (2011).
- (6) P. Olsson and S. Teitel, “Critical scaling of shear viscosity at the jamming transition,” Phys. Rev. Lett. 99, 178001 (2007).
- (7) P. Olsson and S. Teitel, “Critical scaling of shearing rheology at the jamming transition of soft-core frictionless disks,” Phys. Rev. E 83, 030302(R) (2011).
- (8) D. Vågberg, P. Olsson, and S. Teitel, “Critical scaling of Bagnold rheology at the jamming transition of frictionless two-dimensional disks,” Phys. Rev. E 93, 052902 (2016).
- (9) P. Olsson and S. Teitel, “Herschel-Bulkley shearing rheology near the athermal jamming transition,” Phys. Rev. Lett. 109, 108001 (2012).
- (10) T. Hatano, Scaling properties of granular rheology near the jamming transition, J. Phys. Soc. Jpn. 77, 123002 (2008).
- (11) T. Hatano, Growing length and time scales in a suspension of athermal particles, Phys. Rev. E 79, 050301R (2009).
- (12) T. Hatano, Critical scaling of granular rheology, Prog. Theor. Phys. Suppl. 184, 143 (2010).
- (13) M. Otsuki and H. Hayakawa, Critical behaviors of sheared frictionless granular materials near the jamming transition, Phys. Rev. E 80, 011308 (2009).
- (14) C. Heussinger and J.-L. Barrat, Jamming transition as probed by quasistatic shear flow, Phys. Rev Lett. 102, 218303 (2009).
- (15) C. Heussinger, P. Chaudhuri, and J.-L. Barrat, Fluctuations and correlations during the shear flow of elastic particles near the jamming transition, Soft Matter 6, 3050 (2010).
- (16) L. E. Silbert, A. J. Liu, and S. R. Nagel, Vibrations and diverging length scales near the unjamming transition, Phys. Rev. Lett. 95, 098301 (2005).
- (17) M. Wyart, S. R. Nagel, and T. A. Witten, Geometric origin of excess low-frequency vibrational modes in weakly connected amorphous solids, Europhys. Lett. 72, 486 (2005).
- (18) D. Hexner, A. J. Liu, and S. R. Nagel, Two diverging length scales in the structure of jammed packings, Phys. Rev. Lett. 121, 115501 (2018).
- (19) J. A. Drocco, M. B. Hastings, C. J. Olson Reichhardt, and C. Reichhardt, Multiscaling at point J: Jamming is a critical phenomenon, Phys. Rev. Lett. 95, 088001 (2005).
- (20) D. Vågberg, D. Valdez-Balderas, M. A. Moore, and P. Olsson and S. Teitel, “Finite-size scaling at the jamming transition: Corrections to scaling and the correlation-length critical exponent,” Phys. Rev. E 83, 030303(R) (2011)
- (21) M. Wyart, On the rigidity of amorphous solids, Ann. Phys. Fr. 30, 1 (2005).
- (22) C. P. Goodrich, A. J. Liu, and S. R. Nagel, Finite-size scaling at the jamming transition, Phys. Rev. Lett. 109, 095704 (2012).
- (23) P. Charbonneau, E. I. Corwin, G. Parisi, and F. Zamponi, Universal microstructure and mechanical stability of jammed packings, Phys. Rev. Lett. 109, 205501 (2012).
- (24) C. P. Goodrich, S. Dagois-Bohy, B. P. Tighe, M. van Hecke, A. J. Liu, and S. R. Nagel, Jamming in finite systems: Stability, anisotropy, fluctuations, and scaling, Phys. Rev. E 90, 022138 (2014).
- (25) C. Heussinger, L. Berthier, and J.-L. Barrat, Superdiffusive, heterogeneous, and collective particle motion near the fluid-solid transition in athermal disordered materials, Europhys. Lett. 90, 20005 (2010).
- (26) G. Düring, E. Lerner and M. Wyart, Length scales and self-organization in dense suspension flows, Phys. Rev. E 89, 022305 (2014).
- (27) O. Pouliquen, Velocity correlations in dense granular flows, Phys. Rev. Lett. 93, 248001 (2004).
- (28) D. J. Durian, “Foam mechanics at the bubble scale,” Phys. Rev. Lett. 75, 4780 (1995) and “Bubble-scale model of foam mechanics: Melting, nonlinear behavior, and avalanches,” Phys. Rev. E 55, 1739 (1997).
- (29) D. J. Evans and G. P. Morriss, Statistical Mechanics of Non-equilibrium Liquids (Academic Press, London, 1990).
- (30) S. Tewari, D. Schiemann, D. J. Durian, C, M. Knobler, S. A. Langer, and A. J. Liu, Statistics of shear-induced rearrangements in a two-dimensional model foam, Phys. Rev. E 60, 4385 (1999).
- (31) B. Andreotti, J.-L. Barrat, and C. Heussinger, “Shear flow of non-brownian suspensions close to jamming,” Phys. Rev. Lett. 109, 105901 (2012).
- (32) E. Lerner, G. Düring, and M. Wyart, “A Unified framework for non-Brownian suspension flows and soft amorphous solids,” Proc. Natl. Acd. Sci. U.S.A. 109, 4798 (2012).
- (33) D. Vågberg, P. Olsson, and S. Teitel, “Universality of jamming criticality in overdamped shear-driven frictionless disks,” Phys. Rev. Lett. 113, 148002 (2014).
- (34) E. DeGiuli, G. Düring, E. Lerner, and M. Wyart, “Unified theory of inertial granular flows and non-Brownian suspensions,” Phys. Rev. E 91, 062206 (2015).
- (35) T. Kawasaki, D. Coslovich, A. Ikeda, and L. Berthier, “Diverging viscosity and soft granular rheology in non-Brownian suspensions,” Phys. Rev. E 91, 012203 (2015).
- (36) We find that has a better fit to an exponential decay at smaller than does , and that the length extracted from is about 1.5 times smaller than that from ; this means that finite size effects set in for at larger than they do for .
- (37) P. M. Chaikin and T. C. Lubensky, Principles of Condensed Matter Physics, (Cambridge University Press, Cambridge, 1995), see Chapter 5.
- (38) K. Binder, Finite size scaling analysis of ising model block distribution functions, Z. Phys. B 43, 119 (1981).
- (39) M. Hasenbusch, A. Pelissetto, and E. Vicari, The critical behavior of 3D Ising spin glass models: universality and scaling corrections, J. Stat. Mech. (2008) L02001.
- (40) P. Olsson, Relaxation times and rheology in dense athermal suspensions, Phys. Rev. E 91, 062209 (2015).
- (41) P. Olsson, Asymmetric velocity correlations in shearing media, Phys. Rev. E 82, 031303 (2010).