New growth mechanism of dust grains in protoplanetary disks with magnetically driven disk winds
Abstract
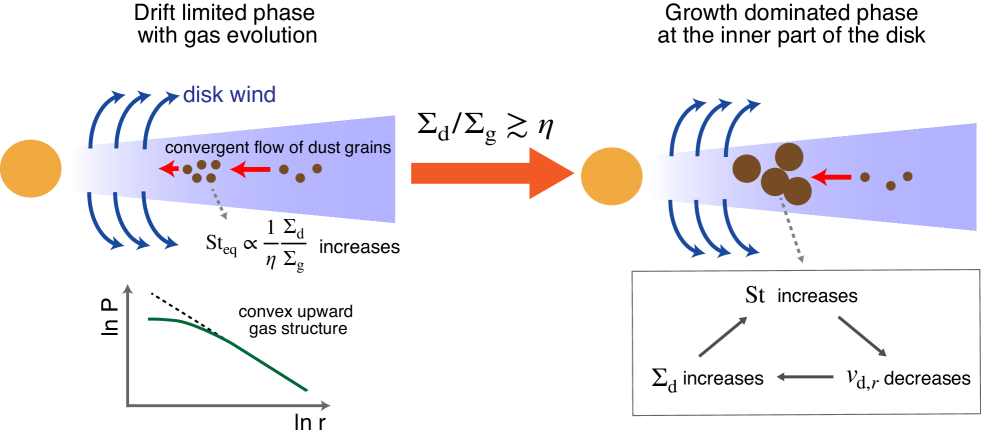
We discovered a new growth mode of dust grains to km-sized bodies in protoplanetary disks that evolve by viscous accretion and magnetically driven disk winds (MDWs). We solved an approximate coagulation equation of dust grains with time-evolving disks that consist of both gas and solid components by a one-dimensional model. With the grain growth, all solid particles initially drift inward toward the central star by the gas drag force. However, the radial profile of gas pressure, , is modified by the MDW that disperses the gas in an inside-out manner. Consequently, a local concentration of solid particles is created by the converging radial flux of drifting dust grains at the location with the convex upward profile of . When the dimensionless stopping time, St, there exceeds unity, the solid particles spontaneously reach the growth dominated state because of the positive feedback between the suppressed radial drift and the enhanced accumulation of dust particles that drift from the outer part. Once the solid particles are in the drift limited state, the above-mentioned condition of St for the dust growth is equivalent with
where is the dust-to-gas surface-density ratio and is dimensionless radial pressure-gradient force. As a consequence of the successful growth of dust grains, a ring-like structure containing planetesimal-sized bodies is formed at the inner part of the protoplanetary disks. Such a ring-shaped concentration of planetesimals is expected to play a vital role in the subsequent planet formation.
1 Introduction
Recent observations by large astronomy facilities such as the Atacama Large Millimeter/Submillimeter Array (ALMA) and Subaru telescope revealed varieties of complicated structures of protoplanetary disks (PPDs hereafter; Hashimoto et al., 2011; Casassus et al., 2013; Fukagawa et al., 2013; ALMA Partnership et al., 2015; Benisty et al., 2015; Andrews et al., 2011, 2018a, 2018b; Akiyama et al., 2019). It is important to understand how planets are formed in evolving PPDs with various complicated structures.
In addition to viscous accretion (e.g., Lynden-Bell & Pringle, 1974), there are various processes that affect the evolution of PPDs, such as photoevaporation (Shu et al., 1993; Owen et al., 2012; Ercolano & Rosotti, 2015; Hollenbach, 2017), the magnetically driven disk wind (MDW) (Ferreira et al., 2006; Suzuki & Inutsuka, 2009; Bai & Stone, 2013; Lesur et al., 2013; Suzuki et al., 2016), and non-ideal MHD effects (Sano et al., 2004; Bai, 2013; Simon et al., 2015; Suriano et al., 2018, 2019). An interesting aspect of these processes is that they potentially create characteristic features in the surface density of the gas because different processes effectively operate at different locations.
In usual conditions, such as the minimum-mass solar nebula (MMSN hereafter; Hayashi, 1981), the gas pressure generally decreases with the radial distance from a central star. In such circumstances, one of the severe obstacles against the planet formation is the infall of solid particles toward the central star by the gas drag. The gas component rotates with a sub-Keplerian velocity because of the outward pressure gradient force to the radial force balance, while the solid component tends to rotate with the Keplerian velocity. Therefore, solid particles feel headwind from the gas so that their rotation velocity is decelerated. As a result, these solid particles move toward the central star (Whipple, 1972; Adachi et al., 1976; Weidenschilling, 1977). The timescale of this inward drift is significantly shorter than the growth time of solid particles when we assume the direct sticking of solid particles as the growth mechanism. This obstacle is often called “the radial drift barrier”.
There have been various mechanisms introduced to overcome the radial drift barrier. The rapid formation of large-sized bodies is one possible solution to this barrier. A possible path is two-fluid instability between the gas and solid components, which is called streaming instability (Youdin & Goodman, 2005). The streaming instability forms dense clumps of solid particles quickly (Johansen & Youdin, 2007). These dense clumps eventually collapse to objects with a size of km by the self-gravity (Johansen et al., 2012). These large objects are no longer affected strongly by the background gas flow, because they are too massive to be perturbed by the gas drag. Considering the internal density evolution of solid particles is an alternative way to the rapid formation of large-sized bodies. Okuzumi et al. (2012) computed the evolution of dust mass and their internal density simultaneously, and they found that fluffy dust aggregates can quickly grow into large-sized bodies rather than falling toward the central star.
Substructures of gaseous disks are another possible solution to the radial drift barrier. For example, a local maximum of gas pressure, which is often called a “pressure bump”, is a promising location to halt the radial drift of solid particles (Whipple, 1972; Haghighipour & Boss, 2003a, b; Taki et al., 2016). This is because the direction of the radial drift of dust particles is the same as the direction of the pressure gradient, which is derived from the radial force balance of the gas. Several candidates that yield pressure bumps are proposed: some examples are the inner edge of PPDs (Haghighipour & Boss, 2003a), the inner edge of dead zones (Lyra et al., 2008; Dzyurkevich et al., 2010; Suzuki et al., 2010), which are inactive with respect to magnetorotational instability (MRI hereafter; Velikhov, 1959; Chandrasekhar, 1961; Balbus & Hawley, 1991), and snowlines (Kretke & Lin, 2007).
The MDW potentially creates a pressure bump near the inner edge of PPDs (Suzuki et al., 2010; Takahashi & Muto, 2018). The mass loss timescale owing to the MDW is scaled by the local Keplerian time. Therefore, the MDW generally disperses the gas component of a PPD in an inside-out manner. In other words, an inner cavity of the gaseous disk is expected to from by the MDWs. Takahashi & Muto (2018) calculated the evolution of the surface density of both gas and solid components simultaneously with MDWs. They confirmed that pressure bumps formed by MDWs halt the radial drift of dust particles, and showed that the dust surface density gives a ring-hole configuration. An interesting aspect of the pressure bump formed by the MDW is that it moves outward with time. The dust ring also moves outward as the location of the pressure maximum moves.
The radial drift velocity of solid particles is a function of their size and the solid-to-gas density ratio (Nakagawa et al., 1986). Namely, the growth of dust particles is also important in forming ring-hole structures, in addition to the accumulation of the solid component. Since the accumulation of solid particles effectively occurs at a pressure bump, the growth timescale of solid particles is significantly shorter there than that in other parts of PPDs.
The main focus of the present paper is to investigate the size evolution of dust particles, which was not considered in Takahashi & Muto (2018), in PPDs with MDWs. We calculate a coagulation equation of solid particles in time-evolving PPDs with MDWs. Although previous works have mainly focused on pressure bumps, we further pursue a new mechanism that piles up dust particles in PPDs.
The construction of this paper is as follows. In Sect. 2 we describe the equations and simulation settings. In Sect. 3 we show the simulation results of different cases and explain a newly discovered growth mechanism of solid particles. In Sect. 4 we discuss caveats of our model and implications for the observation of PPDs and the formation of planetary systems. Our conclusions are presented in Sect. 5.
2 Model
We solve a coagulation equation of dust grains with the time-evolving surface densities of the gas and solid components under the axisymmetric approximation. We describe each equation below.
2.1 Gas Surface Density
The time evolution of gas surface density, , with MDWs can be written as
| (1) |
where is the radial distance from a central star and and are the and (vertical) components of the velocity of gas. The subscript “w” of the third term represents the mass loss by MDWs. We neglect the backreaction from the solid component in eq. (1). is related to the gas density at the midplane, , via
| (2) |
Here, the vertical scale height of gas,
| (3) |
is derived from the sound speed, , and the Keplerian frequency, , where is the gravitational constant and is the mass of the central star. Throughout this paper, we consider a star with one solar mass, . We adopt the temperature structure that is determined by the radiative equilibrium, (Hayashi, 1981). From this we obtain , where is the Boltzmann constant, is the unified atomic mass unit, and (Hayashi, 1981) is the mean molecular weight. From these dependences, the scale height depends on as .
The second term of eq. (1) denotes the radial flow of the gas and it is calculated from the conservation of the angular momentum in an annulus of a disk (Suzuki et al., 2016) as
| (4) |
where the subscript, “mid”, stands for the midplane and and are dimensionless parameters after Shakura & Sunyaev (1973). is an effective turbulent viscosity, and is a magnetic braking stress, namely the torque exerted from the MDW, where denotes that the density-weighted averages are taken over the and directions (see Suzuki et al., 2016, for the mathematical definitions). These two parameters, and , respectively determine the outward transport and removal of the angular momentum from a disk that induce the accretion of gas to the central star.
We consider two types of the parameterization for the wind torque: (i) is constant in the whole region; and (ii) depends on the local gas surface density. We name (i) constant torque and (ii) -dependent torque from now on, following Suzuki et al. (2016). The wind torque is expressed as
| (5) |
We assume that and for the constant torque case, and and for the -dependent case. Bai (2013) reported that with a negative dependence on the plasma , , by local MHD simulations. The constant torque case corresponds to the case that the plasma is uniform for time and location (Bai, 2016). The -dependent torque case corresponds to the case that the vertical magnetic flux is preserved at each location even though the gas surface density decreases. We test these two extreme cases in this paper.
2.2 Dust Surface Density
The time evolution of dust surface density, , has basically a similar form to eq. (1),
| (7) |
where is the mass loss rate of the solid component dragged upward by gaseous MDWs, . The values of and depend on the masses and sizes of solid particles. Under the single-size approximation, we use and for bodies with the mass-weighted averaged mass (see derivation in Appendix A).
We can obtain a fitting formula for from the result of Miyake et al. (2016).
| (8) |
where is the Stokes number for a spherical dust grain defined as (Sato et al., 2016)
| (9) |
Here g cm-3 is the material density of the solid component, is the radius of a solid particle with mass, , and is the mean free path between gas particles. The mean free path is expressed as , where is the collisional cross section between molecules. When , the gas drag is in the Epstein regime, and otherwise if , it is in the Stokes regime. When , the solid particles are well coupled to the gas. When , the solid particles are hardly affected by the gas drag, and their motion is almost independent of the gas flow. Since we adopt , eq. (8) indicates that only small dust grains that are tightly coupled to the gas with are lost with MDWs and that the larger grains are left in the disk (see Miyake et al., 2016, for the detail).
The radial drift velocity, , is derived from the radial and azimuthal components of the equation of motion of solid particles (Adachi et al., 1976; Weidenschilling, 1977; Takeuchi & Lin, 2002),
| (10) |
where is a dimensionless pressure gradient force described below and is the Keplerian rotational velocity. From eq. (10), the relative velocity, , has a maximum speed at .
The dimensionless pressure gradient force is
| (11) |
where is gas pressure at the midplane. Although is positive everywhere in the MMSN, MDWs locally change in, and in some cases, could take a negative value.
2.3 Radial Drift Timescale
From the radial velocity of solid particle, eq. (10), the radial drift timescale, , is defined as
| (12) | ||||
| (13) |
where eq. (12) is for smaller particles that are strongly coupled to the gas and eq. (13) is for larger particles that are weakly coupled to the gas. When the accretion is induced by turbulent viscosity, . If we consider typical conditions of the MMSN, and , we get ; when solid particles grow to St, they enter the loose coupling state from the strong coupling limit.
We should note, however, that the above estimate is modified when the MDW torque plays a dominant role in determining . In addition, is largely altered in PPDs with MDWs, which we examine in Section 3.
2.4 Collisional Growth of Solid Particles
We assume perfect sticking via collisions without collisional fragmentation and adopt a single-size approximation to calculate the collisional growth of dust particles, following Sato et al. (2016). The time evolution of via collisions and radial drift is given by (see derivation in Appendix A),
| (14) |
where is the relative velocity between solid particles with masses and is the scale height of dust grains with , which can be estimated as
| (15) |
(Youdin & Lithwick, 2007), where is turbulent strength and we here adopt . We follow the growth of up to km, because we are interested in the formation processes of km-sized bodies, planetesimals, and the growth process of bodies larger than km is controlled by the self-gravity, which is not considered in our model.
We basically follow Okuzumi et al. (2012) for the derivation of , which we briefly summarize below:
| (16) |
denotes the relative velocity by the Brownian motion, which is given by
| (17) |
where and are the masses of colliding particles, and in the single-size approximation we take . , , and are the three components of the relative velocity between colliding particles, which arise from the drift motion of dust grains from the background gas. In addition to the component of eq. (10), the and components are written as
| (18) |
and
| (19) |
If we apply the single-size approximation () in a strict sense, , , and are all zero. However, this is not realistic. We estimate them by , where , . In Sato et al. (2016), they found that is a good approximation that well explains the result considering the realistic distribution of particle masses by Okuzumi et al. (2012).
The component can be estimated from the difference between the vertical sedimentation velocities of particles 1 and 2 as
where is the mean scale height of particles with and . Here, stands for .
is the relative velocity by the turbulent motion of the gas that pushes particles in a stochastic manner. We adopt the formula introduced in Ormel & Cuzzi (2007), in which they classified the interaction between turbulent eddies and particles into two regimes. In Class I solid particles interact with an eddy for a long time and their initial motion is modified before the eddy vanishes; In Class , the duration of the interaction between solid particles and an eddy turnover time is shorter than their stopping time. We define the relative velocity of each class as and , respectively. From these arguments, the relative velocity can be estimated as
| (21) |
is a turbulent Reynolds number, where is a kinematic viscosity of the gas. The thermal velocity is given by . Here
| (22) |
and
| (23) |
where is the boundary between the two regimes and denotes interchange between particles 1 and 2.
2.5 Growth Timescale
We define a growth timescale, , of solid particles from the increase of particle size, ; we here use , instead of , to evaluate because it coincides with the growth timescale of St in the Epstein regime (eq. 9). Then, from eq. (14) we can derive
| (24) | |||||
In this paper, we mainly focus on the dust growth in a range of . In this case, in eq. (15). is dominated by the turbulent component in usual situations. The regime of roughly corresponds to the intermediate range of eq. (21), which gives . Then, we finally obtain the following approximated expression of for :
| (25) | |||||
2.6 Initial Conditions and Numerical Methods
We adopt the MMSN model for the initial gas surface density,
| (26) |
where at au is taken from the original value introduced in Hayashi (1981). The initial dust surface density is , which is adopted from the interstellar dust-gas ratio. We follow the collisional growth of dust grains that have the initial radius of , which is the same order of magnitude as the typical size of interstellar dust grains.
The simulation domain covers a region from 0.01 au to 300 au, which is resolved by 255 grid points111. The grid spacing, , is proportional to . The surface density of the gas is updated by solving eq. (1) in a time-implicit manner. The initial total mass of the gas component is .
We consider icy dust grains in this paper and assume inside au throughout the time evolution, whereas we do not treat detailed properties of the snowline (Oka et al., 2011) for simplicity. In addition, unless we do not take into account the fragmentation of collisionally grown particles, rapidly increases because of the accelerated coagulation in au in an unrealistic manner (Birnstiel et al., 2010; Sato et al., 2016). This is also a reason why we set in au to avoid unphysically rapid growth of dust grains.
We also assume outside au to avoid the effect of the outer boundary on the surface density profile of the dust component. The initial total mass of the dust component is , where is the Earth mass.
We calculate the time evolution of , , and for different sets of the 3 parameters, the turbulent viscosity, , the mass loss by the MDW, , and the MDW torque, . The employed values are summarized in Table 1.
| Case | Growth ? | Corresponding Figure | |||
|---|---|---|---|---|---|
| STb + NM + ZTq | 0.0 | No | 1 | ||
| STb + WM + ZTq | 0.0 | No | 2 | ||
| WTb + NM + ZTq | 0.0 | No | - | ||
| WTb + NM + CTq | No | - | |||
| WTb + NM + STq | No | - | |||
| WTb + WM + ZTq | 0.0 | Yes | 3 | ||
| WTb + WM + CTq | No | 4 | |||
| WTb + WM + STq | Yes | 5 |
3 Results
3.1 MRI active () cases
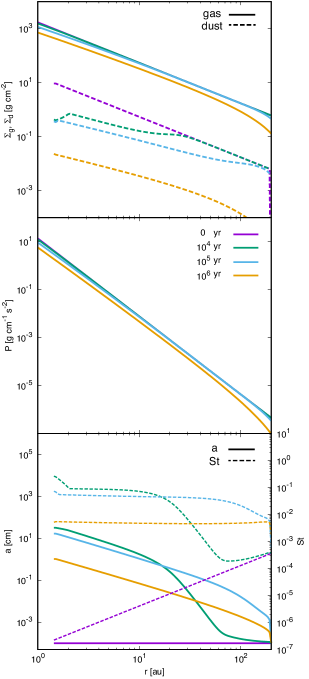
In this section, we present results of the MRI active cases with . Figure 1 compares the radial profiles of of various physical quantities of the case without MDW (STb+NM+ZTq) at and yrs. The top panel shows that the surface density of the gas, , decreases with time by viscous accretion. The gas pressure at the midplane, , (middle panel) as well as keeps a decreasing trend with , which leads to the inward drift of solid particles (eqs. 10 & 11).
The decrease of the dust surface density, , is more significant in an inside-out manner (top panel of Figure 1); is excavated in au at yrs and au at yr, respectively. This is because dust grains at smaller reach the drift limited state from earlier times. The dust grains are initially well coupled to the gas because St in the entire region (bottom panel of Figure 1), and therefore . The growth of dust grains is more rapid in the inner region because (eq. 25). The increase of St with the dust growth reduces ( for St ; eq. 13). Eventually at St , and finally, dust particles drift inward rapidly before growing to further larger bodies; the growth of solid particles are limited by the radial drift (bottom panel of Figure 1; Okuzumi et al., 2012; Sato et al., 2016, see also Section 3.3.2).
Readers may notice an upward bend of St near the inner edge of the dust disk at and yrs. Inside this point the solid particles are in the Stokes regime. However, they are still subject to the inward drift and do not overcome the radial drift barrier.
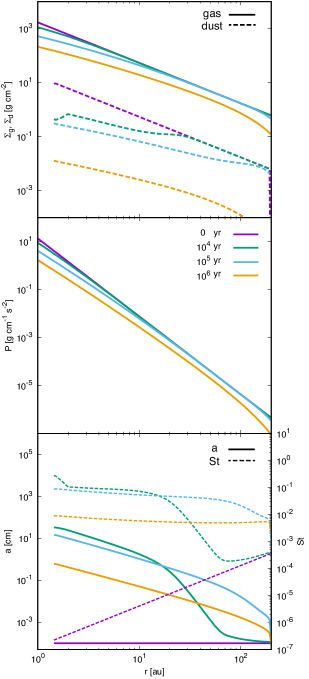
Figure 2 shows the case with the mass loss by (STb+WM+ZTq). The top panel shows that decreases slightly faster particularly in the inner region by the MDW than of the case without MDWs (Figure 1). However, the difference of between the two cases is not so significant because the evolution of the gas is mainly controlled by the strong accretion owing to the large .
Because the time evolution of of Figure 1 is similar to that of Figure 2, the properties of the solid component also follow the similar trend. The mass loss of solid particles by the gaseous MDWs is not effective in both cases. Substituting into eq. (8) shows that dust grains should be tightly coupled with at the midplane in order to be entrained by the MDW. In the inner region where the effect of the MDWs is significant dust grains grow rapidly beyond . Therefore, most of the solid particles are not lost with the MDWs but left in the disk and eventually accrete to the central star.
The results presented in Figures 1 & 2 indicate that the collisional growth cannot proceed to form planetesimals in the MRI-active condition with , whether or not the gas is lost via MDWs. This is because the evolution of the gas component is mainly determined by the accretion. As a result, the solid particles inevitably drift inward when they grow to . Although in these cases we do not consider the MDW torque, it does not affect so much the overall evolution of because the accretion is induced dominantly by the turbulent viscosity. Smaller is required to overcome the radial drift barrier.
3.2 MRI inactive () cases
In this subsection, we examine the time evolution of MRI inactive cases with MDWs. We focus particularly on the evolution of the three cases with the mass loss by MDWs (WTb+WM+XTq cases in Table 1) that adopt different models of the wind torque (zero / constant / -dependent torque). In addition to these 3 cases, we also performed cases without mass loss by MDWs (WTb+NM+XTq in Table 1). They are not displayed in figures because most of the solid particles fall into the central star by the radial drift, similarly to the MRI active cases.
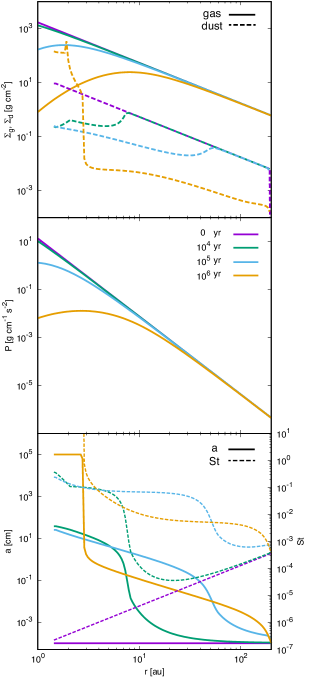
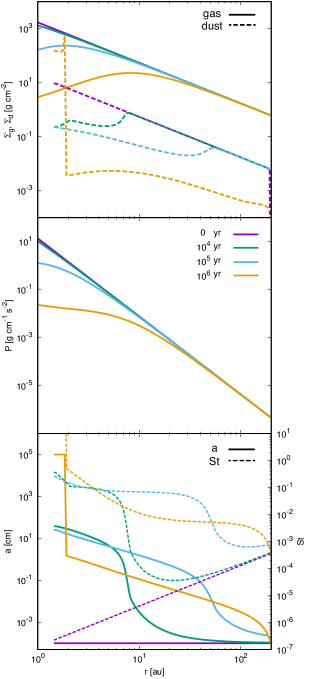
Figure 3 presents the results of the case with weak turbulence + wind mass loss + zero-torque (WTb+WM+ZTq). The top panel shows that the mass loss by the MDW plays an effective role; the radial profile of largely deviates from the initial power-law profile in (10) au at () yrs.
The top panel of Figure 3 also shows that although the time evolution of up to yrs is similar to that of the strong turbulent cases (Figures 1 and 2), there is a region where dust particles are piled up near the inner edge ( au) of the dust disk at yrs.
The bottom panel of Figure 3 shows that the size of the dust particles grows up to 1 km, which is the upper cap in our setting, at yr in a ring-like region of in au (top panel). St goes beyond at that time, which is in contrast to St at the earlier times of and yr when the growth of solid particles are still constrained by the radial drift. We can conclude that dust particles get over the radial drift barrier in this case. A key to the dust growth against the radial drift barrier is to achieve St , which we explain in more detail later (Section 3.3).
In the constant torque case (WTb+WM+CTq), the mass accretion by the turbulent viscosity is as weak as the zero-torque case. However, the top panel of Figure 4 shows that in the inner region is not so low as that obtained in Figure 3 because the gas is supplied by the wind-driven accretion. As a result, the gas pressure does not show a local maximum but monotonically decreases with . Dust grains suffer inward radial drift before growing to St .
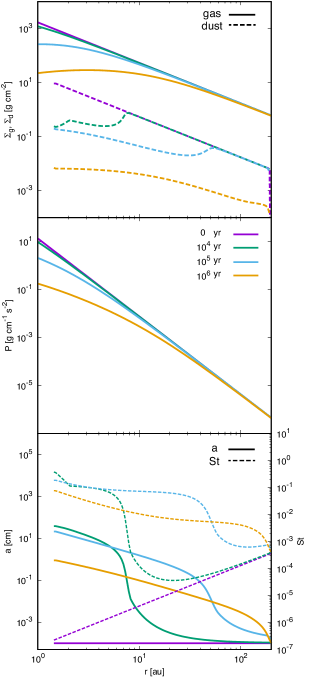
In the -dependent torque case (WTb+WM+STq), the evolution of exhibits intermediate behavior between the previous two cases as shown in the top panel of Figure 5. (top panel) shows a ring-like structure, and the solid component grows beyond St to reach the upper bound of km (bottom panel). However, contrary to the zero-torque case, this case does not show a local maximum of the gas pressure (middle panel); a pressure bump is not a necessary condition to form a local concentration of dust grains and the subsequent growth of solid particles. This issue is explained in more detail in Section 3.3.
3.3 Conditions for Dust Growth
We have shown the five different cases in Figures 1 – 5. Initial small dust grains successfully grow to planetesimal-size objects in two cases, while in the other three cases most of the solid particles fall onto the central star by the inward radial drift. In particular, the three MRI inactive cases shows that a small difference of the evolution of sways the fate of the growth of dust grains. We explore conditions for the dust growth against the radial drift barrier by examining these three cases.
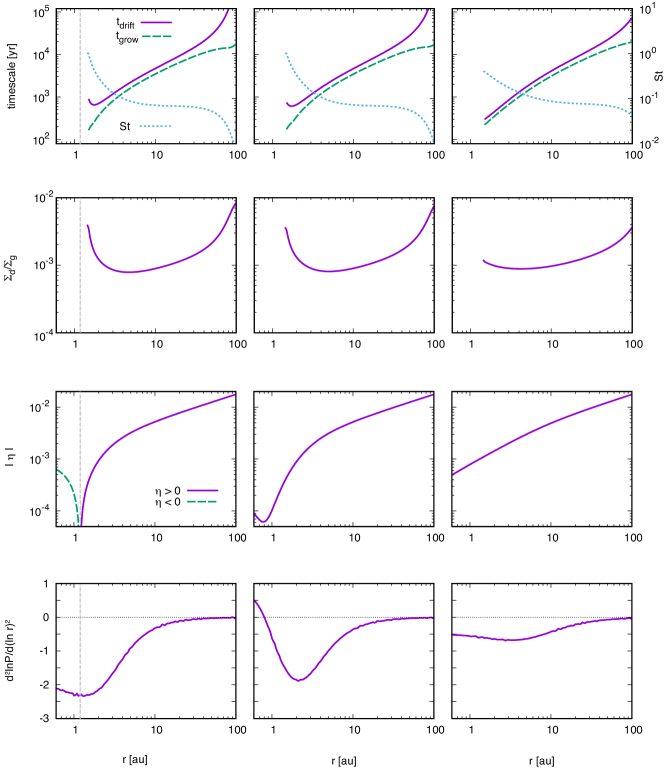
Figure 6 presents the radial profiles of various physical quantities of these three MRI inactive cases. The left (WTb+WM+ZTq) and middle (WTb+WM+STq) panels correspond to the cases with the successful dust growth. In these cases, the snapshots are taken at the onset time, and yrs, respectively, of the growth of dust particles when the Stokes number exceeds St at the inner edge of the dust disk, au. We display snapshots at an arbitrary time, yrs, for the right panels (WTb+WM+CTq), which does not yield the significant growth of the solid component.
3.3.1 Equilibrium Stokes Number
As we explained earlier (Section 3.1), the collisional growth initially dominates the radial drift of dust particles, , which we call the growth dominated phase. With the growth of dust grains, ( St-1 for St ) decreases to eventually give .
These features can be seen in the top panels of Figure 6. in the outer region of au, which is still in the initial growth dominated phase. However, in the region of au, already approaches to .
3.3.2 St St: Radial Drift
In a typical PPD condition and , which give St (Birnstiel et al., 2012; Okuzumi et al., 2012; Sato et al., 2016). The top panels of Figure 6 also show St in au. (See also St in the bottom panel of Figures 1 – 5 at yrs.)
The dust particles with St drift inward before growing to further larger bodies because St-1 for St and further growth accelerates the radial drift. Therefore, these solid particles are in the drift limited state. Figures 1, 2, and 4 show that the dust particles of these three cases (STb+NM+ZTq, STb+WM+ZTq, and WTb+WB+CTq) suffer the radial drift and that they do not grow to larger bodies but fall into the central star at yrs.
3.3.3 St St: Rapid Growth
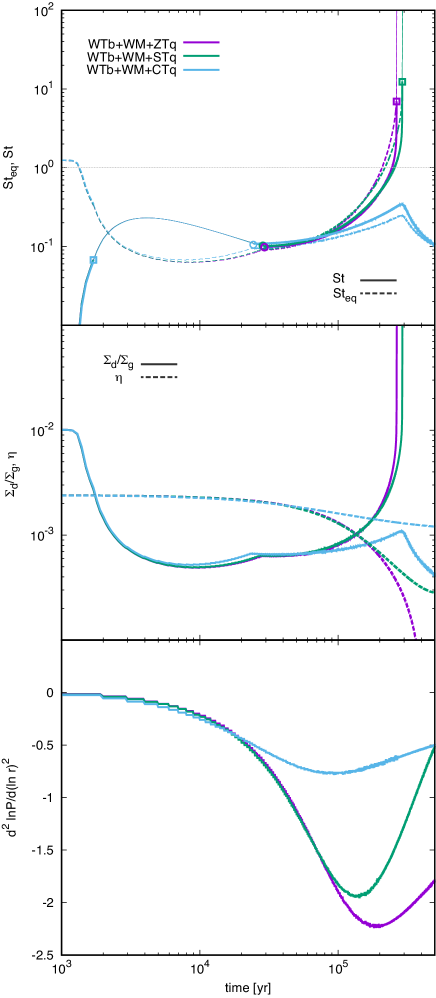
The top left and top middle panels of Figure 6 show that near the inner edge of the solid disk, au, which expects the growth of dust particles (Figures 3 and 5). In order to inspect this growth dominated state we display the time evolution of various physical quantities at au of the three MRI inactive cases in Figure 7.
The top panel of Figure 7 compares the time evolutions of calculated by the coagulation equation (14) and equilibrium of eq. (27). In the initial phase of yrs, St ( Steq) rises up quite rapidly because the dust particles are in the growth dominated state in all the three cases (Note that all the three lines are overlapped).
At yrs the state of the gas drag changes from the Epstein regime (thick lines) to the Stokes regime (thin lines) with the increase of particle size, , which is indicated by squares. Afterward St ( in the Stokes regime) gradually decreases until yrs222We note that the solid particles are in the drift limited state with the Stokes drag force during yrs, although St is considerably larger than Steq during most of the period. The reason why St Steq is that Steq is derived for the Epstein drag. . This is because smaller particles drift from the outer region by the radial drift. Therefore, when we watch solid particles at a fixed point of au, St is observed to be decreasing with time.
Since the gas density gradually decreases by the MDW and the accretion, the mean free path ( as shown in Section 2.2) increases with time. As a result, the gas-solid interaction returns back to the Epstein drag at yrs (shown by circles). After that time, the solid particles are in the equilibrium state of St Steq.
In all the three cases, St ( St; eq. 27) gradually increases because decreases and increases (middle panel of Figure 7) , which will be also discussed in Section 3.3.4. However, St ( Steq) of the purple (WTb+WM+ZTq) and green (WTb+WM+STq) lines start to deviate upward from the light blue (WTb+WM+CTq) line. In these two cases St finally jumps up beyond unity.
For St , the radial velocity of solid particles follows St-1 (see eq. 10 and Section 2.3). Therefore, the growth of solid particles with slows down the inward radial drift. If a region with St is formed locally, it accumulates solid particles that drift inward from the outer part of a PPD. This enhances the dust density there. The local enhancement of causes the faster growth of solid particles (eq. 24). In summary, an increase of St finally leads to a further increase of St once St exceeds unity; a positive feedback sets in to trigger the growth of solid particles.
3.3.4 Requirements for St St
We have shown that the key for drifting particles to reach the growth dominated state is to achieve St in the equilibrium state. Since (eq. 27), smaller and larger favor larger Steq.
The middle panel of Figure 7 shows that decreases with time because the MDW disperses the gas in an inside-out manner to reduce the outward pressure gradient (Figures 3–5). In particular, the two successful cases (purple and green lines) show a more rapid drop of to give larger Steq than the unsuccessful case (light blue line). The consistent trend is obtained for the snapshot radial profile of in Figure 6; the third left (WTb+WM+ZTq) and third middle (WTb+WM+STq) panels show that deviates downward from the initial profile and gives quite small in au. The left case even exhibits inside au because of the pressure bump.
Although the dust-to-gas ratio, , initially drops from the initial value of to by the radial drift, slowly rises after yrs (middle panel of Figure 7). of the two successful cases (purple and green lines) increases more rapidly to , which also contributes to reaching St ( Steq) .
From these arguments, we can obtain a condition to trigger the subsequent growth of solid particles in the drift limited state with St ,
| (28) |
The middle panel of Figure 7 demonstrates that the solid line () of the two successful cases (purple and green) overtakes the corresponding dashed line (), while this does not occur in the unsuccessful case (light blue). We can conclude that eq. (28) is a reasonable criterion to reach the growth dominated phase. Although eq. (28) is a rearranged expression of St with eq. (27) apart from the numerical factor, eq. (28) is important as an independent condition because eq. (27) is valid only for St in a strict sense. Our numerical calculations have confirmed that is a useful indicator even for relatively large St.
After St ( Steq) of WTb+WM+CTq (light blue) slowly increases up to at yrs (top panel of Figure 7), St decreases with after that time (middle panel). This is because the dust grains that are initially located at the outer boundary of au already reach au at this time by the radial drift and the mass supply from the outer region ceases afterward. If the initial radius of the dust disk was larger than the current setup, this case could also reach the growth dominated state of solid particles at a later time.
We have explained that both the decreasing and increasing play important roles in obtaining in the two cases with the significant dust growth. The small is a characteristic consequence of the inside-out evacuation of the gas by the MDW. On the other hand, it is not straightforward to understand the increase of . While we discussed that the positive feedback loop inevitably enhances for St , the requirement here is to accumulate solid particles with St , which we consider below.
3.3.5 Dust Accumulation under St
Let us introduce the radial mass flux of dust particles:
| (29) |
where when dust particles drift inward. When at a single annulus in a disk, the net mass flux into this annulus is positive so that increases there. We derive an analytic expression that gives this condition for the local pile-up of dust particles below.
Let us consider dust particles in the drift limited state with St (Figure 6 and Section 3.3.2). When St is a constant, is controlled only by the the gas pressure profile so that we have (see eq. (B2) of Appendix B)
| (30) |
where we here used the radial dependence of the gas temperature, , of the MMSN.
If we adopt a power-law dependence of in eq. (29), the condition for the accumulation, , reads (see Appendix B for the derivation),
| (31) |
In the drift limited phase, the radial dependence of tends to approach to the steady state value, (Birnstiel et al., 2012, see also Appendix B), which gives a practical criterion,
| (32) |
to create a local concentration of dust particles; the convex upward profile of drives converging dust flows.
We show the radial profile and the time evolution of in the bottom panels of Figure 6 and the bottom panel of Figure 7, respectively. These figures illustrate that the WTb+WM+NTq and +STq cases give small at au, which can induce strong convergent dust flux. On the other hand, of the WTb+WM+CTq case is not so small as those of the two cases, and therefore, the excited convergent flows are too weak to proceed subsequent growth of solid particles.
An important point is that a pressure bump structure, which corresponds to the position of , is not necessarily required to excite strong convergent dust flux, which is driven by negative . Figure 6 shows that in the entire region of the WTb+WM+STq case (middle column), namely there is no local maximum of the gas pressure. This case clearly demonstrates that dust particles can be piled up by the strong converging flux even without any pressure bump. The WTb+WM+ZTq case (left column of Figure 6) also illustrates that the location ( au) of the solid concentration does not coincide with the pressure bump at au.
3.3.6 Summary of Dust Growth
We summarize the overview of the mechanism for the growth of solid particles in Figure 9. The dust growth consists of two steps: (1) Converging dust flux gradually forms a local concentration of solid particles by the supply of radially drifted dust grains from the outer region with the increase of their St (Sections 3.3.4 and 3.3.5): (2) Once St ( Steq) , the unstable growth mode of solid particles sets in by the positive feedback (Section 3.3.3) .
We point out that the step (1) could be accomplished by different processes from the MDW, provided that they create a region with small and large in a drift limited region. We discuss other possibilities that can trigger unstable dust growth in Section 4.5.
We would like to claim that our new growth mechanism is different from those proposed previously. In our process, all the dust grains firstly experience the drift limited state. After that, part of them switch to the growth dominated state in the Epstein regime. These features are in contrast to the mechanism introduced by Okuzumi et al. (2012), in which fluffy dust grains skip the drift limited phase and directly enter the growth dominated phase in the Stokes regime. Our mechanism is also different from that driven by the backreaction from dust to gas that decelerates the radial drift of dust grains (Drazkowska et al., 2016; Gonzalez et al., 2017).
3.4 Total mass of solid component
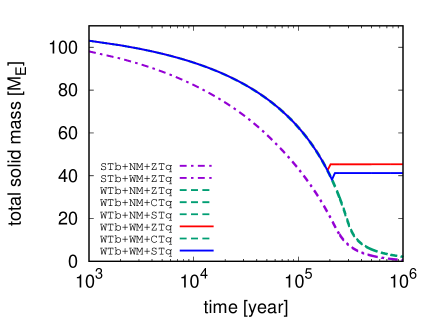
We inspect how much fraction of the initial solid mass ( between 1.5 au and 200 au) survives in the calculated disks. The dust grains are dispersed via (1) the radial drift to the central star and (2) the upward entrainment by MDWs. We found that in all the eight cases the former dominates the latter, because in the inner region where the effect of the MDW is most prominent the dust grains grow so rapidly that they are too large to be dragged upward.
Figure 10 presents the time evolution of the total solid mass left in the computational domain of all the cases tabulated in Table 1. The time evolutions can be classified into three types: (i) MRI-inactive cases that show significant dust growth (solid lines), (ii) MRI-inactive cases without significant dust growth (dashed lines), and (iii) MRI-active cases without significant dust growth (dot-dashed lines). In type (i), when the subsequent dust growth sets in at the inner edge of the solid disk, there is numerical error, which appears as a spike at yrs.
Figure 10 shows that in types (ii) and (iii) most of the initial solid mass is lost at yrs because of the radial drift. On the other hand, the two cases of type (i) leaves the solid mass of – in the disk. The remained mass is determined by the time when St exceeds in the local dust concentration formed near the inner edge. This is because, while before that time all the solid particles drift inward to the central star, after that time they are captured by the ring-like concentration of the solid component. As shown in Figure 7, St reaches at slightly earlier time in the WTb+WM+ZTq case (red solid line) than in the WTb+WM+STq case (blue solid line). Therefore, the former case leaves the slightly larger solid mass.
The remained mass of is sufficient to bear the total solid component in the planets of the solar system and probably a sizable fraction of exoplanetary systems. The sufficient gaseous mass is also considered to remain to form gas giants when the subsequent growth of dust grains occurs at yrs.
4 Discussion
We assumed several approximations when we solved the coagulation equation of solid particles and the evolution of and . We discuss limitations of our treatment and processes that are not considered in Sections 4.1- 4.5. We also discuss observational implications in Section 4.6.
4.1 Uncertainty of MHD effects
We solved the evolution of the gas component by the simple model of eq. (1) with the three parameters, , , and .
is mainly determined by the ionization degree (Sano et al., 2000; Hirose & Turner, 2011; Mori & Okuzumi, 2016). Although we assumed a constant , in realistic situations varies with because an MRI-inactive dead zone is formed (Gammie, 1996; Sano & Miyama, 1999). In this case pressure bumps could be created at the edges of the dead zone (Lyra et al., 2008; Suzuki et al., 2010; Dzyurkevich et al., 2010) and dust grains could grow into larger bodies there. The wind torque, , may also have a large uncertainty concerning non-ideal MHD effects (Bai, 2017).
The mass loss, , by the MDW also contains uncertainties. Suzuki et al. (2016) argued that could be constrained by the released gravitational energy through the accretion, which reduces in the inner region. However, this constraint can be loosened if the energy is supplied by external heating owing to the irradiation from the central star. Therefore, we adopted the simplest situation of constant in the present paper.
4.2 Backreaction on Gas
We solved the main equations neglecting the backreaction from dust to gas. However, the backreaction is important when the dust-to-gas ratio is high (Nakagawa et al., 1986). If the backreaction is included, the radial velocity of solid particles is modified as
| (33) |
where is volumetric density of dust grains. This equation indicates that the drift speed is reduced for a large dust-to-gas ratio irrespective of the direction of . Therefore, once dust grains are accumulated, the radial drift is suppressed, which further supports the growth of dust particles.
The suppression of is more severe for a higher dust-to-gas ratio. Figures 3 and 5 show the ring with high .
The backreaction also affects the profile of gas density. Taki et al. (2016) found from their local simulations that the dust accumulation at a pressure bump flattens the radial profile of the gas by the redistribution of the angular momentum between the dust and the gas through the backreaction. The profile of would be also flattened by the backreaction on the gas in the WTb+WM+ZTq and WTb+WM+STq cases (Figures 3 and 5). However, this does not severely affect the onset of the subsequent growth of dust particles because it is triggered for small (middle panel of Figure 7). It is worth estimating the dust-to-gas mass ratio, , because it is more directly related to dust-gas interactions. at the midplene can be derived from eqs. (2) and (15) as
| (34) |
where we used . We employ the typical values, , , and , which are taken from the onset time of the dust growth (Figure 7), and then we obtain at the midplane.
The modification of the gas density profile again suppresses the saturation level of dust density for , which is also confirmed in a 2D global simulation (Kanagawa et al., 2018). Although a spike of is seen at the outer edge of the growth dominated region in the middle panel of Figures 3 and 5, it would be smoothed out in realistic situations with the backreaction on the gas.
4.3 Fragmentation
Although we do not consider the effect of collisional fragmentation in Equation (14), it is effective for high speed collisions. Collisional coagulation of dust grains generates dust aggregates. The critical collisional fragmentation velocities for dust aggregates are investigated with -body simulations (Wada et al., 2013). The critical velocities are estimated to be 60-80 m/s for icy dust and 6-8 m/s for silicate dust, whereas is still very uncertain and it is reported that could be as fast as (Kimura et al., 2015; Steinpilz et al., 2019). Here we estimate the collisional velocity in our calculations to be compared with the critical velocities.
During dust growth, the relative velocities have maximum values at . Successful dust growth takes place in the region with small . Turbulence mainly determines the relative velocities because the radial drift is negligible there. The maximum velocities arising from the turbulence are estimated to be from eq. (22) with . For the cases with successful dust growth, where the turbulence is weak, the maximum turbulent velocity is m/s, which is much slower than the critical velocity for icy aggregates.
In the present calculations we fix inside the snowline to avoid the treatment of silicate dust (Section 2.6). However, if we take into account collisional fragmentation properly, we may handle the evolution of the solid component in au.
4.4 Hydrodynamical Instabilities
In this paper, we do not solve hydrodynamical equations directly. PPDs that evolve with MDWs, however, potentially drive hydrodynamical instabilities by the modification of the profile of density and gas pressure.
It is well known that an axisymmetric rotational instability, which is called “Rayleigh’s criterion”, occurs when , where is the epicyclic frequency (Chandrasekhar, 1960). When the radial profile of the gas pressure has a sharp pressure bump, its inner side may break this condition.
In addition, when the radial profile of vortensity has a local minimum, Rossby-wave instability (RWI), which is a type of non-axisymmetric hydrodynamical instabilities in differentially rotating disks, sets in (Lovelace et al., 1999; Ono et al., 2016, 2018). The instability criterion can be fulfilled even for a shallower slope of the gas pressure than that for the Rayleigh’s criterion. Therefore, the MDW possibly favors the RWI in PPDs. The RWI forms large anticyclonic vortices, which collects dust particles because it is a non-axisymmetric pressure bump (Lyra et al., 2009).
4.5 Pressure Bump
Various potential mechanisms have been proposed to form a pressure bump in PPDs because it is favorable sites for the formation of planetesimals (e.g., Johansen et al., 2014). Inhomogeneous mass accretion rate with radial distance possibly creates a pressure bump at the inner edge of an MRI dead-zone (Lyra et al., 2008) and at the H2O snow line (Kretke & Lin, 2007) (see also Section 1).
We demonstrated that a pressure bump is not necessarily required but a convex upward profile, , can pile up dust particles to trigger the subsequent growth to larger solid bodies. In other words, our work loosens the condition for the planetesimal formation.
4.6 Implication for Observation
Figures 3 and 5 presented the ring with high at au. We should note that the obtained ring can not be directly compared to rings observed in PPDs by ALMA (e.g., ALMA Partnership et al., 2015; Andrews et al., 2018b) because the solid component already grows to km (the upper limit in our setting), which is not observed by millimeter/sub-millimeter wavelength. In reality, however, the collisional fragmentation generates small dust grains that can be observed by ALMA.
The obtained rings are a possible source to supply crystalline materials to the outer disk. Crystalline materials are detected at the outer surface layer of transitional/pre-transitional disks. For instance, HD 100546 and HD 142527 are Herbig stars which have a circumstellar disk with a large gap or an inner cavity. A large amount of crystalline forsterite is detected around - au of the disk in HD 100546 system (Mulders et al., 2011). The crystalline water ice is also detected in the outer disk, au around HD 142527 (Min et al., 2016).
An in-situ formation model cannot explain a large amount of these crystalline materials because the temperature in the outer region is too low to crystallize amorphous materials. Therefore an additional heating mechanism or additional supply of crystalline materials is required.
The crystalline dust particles formed by the collision between planetesimals is one of the promising reservoirs of the detected crystalline materials (Bouwman et al., 2003). Planetesimals can be heated enough to crystallize due to their accretion processes or disintegration of radioactive nucleus. The collisional cascade of these planetesimals supplies a large amount of crystalline dust particles. If a planetesimal ring is located in a gas starved region like an inner gap or an inner cavity, the crystalline dust particles are carried to the surface of the outer disk by the radiation pressure from the central star.
We suggest that MDW-dominated disks naturally serve suitable conditions to produce crystalline materials. The MDW disperses the gas component from inside to outside with leaving a planetesimal ring with high in the inner region, as shown in Figures 3 and 5. Such a dense ring has a high collision rate between planetesimals and supplies a large number of small particles even though there is no strong perturber.
5 Conclusions
We investigated the evolution of dust grains in PPDs with the MDWs. We calculated the evolution of the surface densities of the dust and gas components in PPDs under the 1+1 D (time + radial distance) approximation in various conditions of turbulent viscosity, the mass loss by the MDW, and the magnetic braking by the MDW. We simultaneously solved a coagulation equation of solid particles under a single-size approximation with neglecting the effect of collisional fragmentation.
When the mass accretion by turbulent viscosity is efficient, most of the dust particles fall onto the host star before growing to the sufficiently large bodies even though the MDW is taken into account . The radial drift barrier is still a severe problem in PPDs governed by viscous accretion .
In contrast, however, if the mass accretion is moderately weak and the mass loss by the MDW is relatively important, the radial dependence of the gas pressure is largely altered from the initial power-law profile by the MDW. While all the dust grains drift inward to the central star, they are locally accumulated around the location of the minimum because the dust flux is converging there. When in the drift limited state, St St, and then, the dust particles rapidly grow to planetesimal-sized objects by the positive feedback between the reduced radial drift and the accelerated collisional growth.
Once the dust grains reach the growth dominated phase, the mass loss of the solid component ceases from a PPD because the inward drift is halted at the ring of the solid concentration that is formed near the inner edge, au, of the dust disk. The amount of the dust mass that is left in the disk is regulated by the time when St of the solid particles that constitute the ring exceeds unity. This timing is determined by the combination of , and . The dependence on these parameters will be clarified in future studies.
This new growth mode of dust grains will be a promising mechanism for the formation of planetesimal. Planetesimals formed by this process are distributed in a ring-like region with a clear inner edge. The position of the planetesimal ring is supposed to determine the final outcome of the planetary system. From observed orbital properties of exoplanets, we may infer the parameters of the MDW and turbulent viscosity of the PPDs.
In addition, of the ring region is much higher than the typical value of the MMSN model. This implies the accelerated formation of protoplanets; the rapid formation of gas-giant and inner rocky planets is further anticipated. It would be important to study the planet formation in such local concentrations of planetesimals.
Appendix A Single Size approximation
The collisional evolution of the surface number density, , of bodies with mass that rotate around a host star at is governed by (e.g., Kobayashi et al., 2010)
| (A1) | |||||
where the first and second terms on the right-hand side are the contributions from collision, the third term denotes radial drift, and the fourth term indicates the mass loss dragged by MDWs. Here, the collisional kernel between bodies with masses and , , is given by (Okuzumi et al., 2012)
| (A2) |
where is the number of bodies with masses ranging from to produced from a single collision between and (e.g., Kobayashi & Tanaka, 2010), is the radial drift velocity, is the relative velocity of bodies with masses and , and is the scale height of solid grains.
We use for perfect sticking. Integrating eq. (A1) over , we have
| (A3) |
where
| (A4) | |||||
| (A5) |
and
| (A6) |
Here indicates the mass-weighted average. In eq. (A3), the collisional terms are canceled out.
Multiplying eq. (A1) by , integrating it over , and we then have
| (A7) |
where
| (A8) | |||||
| (A9) | |||||
| (A10) |
and
| (A11) |
If we assume
| (A12) | |||
| (A13) | |||
| (A14) |
and the averaged values are given by the values for , such as and , eq. (A3) is then reduced to eq. (7). Eqs. (A3) and (A7) are then reduced to Eq. (14). The averaged collisional kernel in eq. (A14) is determined by the collisional cross section and relative scale height between bodies with same mass , while is the relative velocity between bodies with and (Sato et al., 2016). Eqs.(A12) and (A14) are valid not only for the single size population but also for the growth until the onset of runaway growth (e.g., Kobayashi et al., 2016). Readers may find similar discussion in Sato et al. (2016).
Appendix B Derivation of condition for dust surface density enhancement
In this section, we derive the condition for the accumulation of solid particles by converging flow, which plays an important role in dust grains to reach the growth dominated phase. We assume that the dust particles are in the drift limited phase of and that the surface density has a power-law profile of .
The dust mass flux is written as
| (B1) |
where in the drift limited state the radial accretion speed of gas is generally much slower than the drift velocity of dust from gas, and therefore, we can safely neglect in eq. (10). We use , and , where is the power-law index of the temperature profile, as , and au. We normalize , , and by , , and , respectively. and are the dust surface density and the gas pressure at . Then, we obtain
| (B2) |
where is converging if and dust particles are accumulated.
In the drift limited state, we can treat St as a constant value. We introduce a normalization, , at . Then, the dimensionless divergence of the dust mass flux can be expressed as
| (B3) | |||||
We use from MMSN model. Therefore, if , then
| (B4) |
This is the condition for dust grains to be piled up.
To examine the nature of this condition, we consider the situation that both the gas pressure and the dust surface density are expressed by power laws as , . From eq. (B4), we obtain
| (B5) |
In the inward (outward) drift cases with (), () is the condition for the increase of ; in the opposite cases ( for or for ), decreases. is in the steady-state condition for . This can be understood from the mass continuity equation (7). If we neglect the mass loss by the MDW, the variation of dust surface density is
| (B6) |
Here, (eq. 10 with ) has a dependence of because in the present setup. Therefore, , which clearly shows that is the steady-state condition. In the inward drift condition of , from eq. (B6) we can obtain . Relative decrease (or increase) rate of can be written as . When the slope is steeper, , this relative decrease rate is faster for smaller , and then, the slope gets shallower to . Otherwise if , the relative increase rate is again faster for smaller , which makes the slope steeper to . The similar argument can be applied to the outward drift condition of . We can conclude that the slope of tends to approach the steady-state value of if the mass loss by the MDW can be neglected.
References
- Adachi et al. (1976) Adachi, I., Hayashi, C., & Nakazawa, K. 1976, Progress of Theoretical Physics, 56, 1756, doi: 10.1143/PTP.56.1756
- Akiyama et al. (2019) Akiyama, E., Vorobyov, E. I., Baobabu Liu, H., et al. 2019, arXiv e-prints. https://arxiv.org/abs/1902.10306
- Alexander et al. (2006) Alexander, R. D., Clarke, C. J., & Pringle, J. E. 2006, MNRAS, 369, 229, doi: 10.1111/j.1365-2966.2006.10294.x
- ALMA Partnership et al. (2015) ALMA Partnership, Brogan, C. L., Pérez, L. M., et al. 2015, ApJ, 808, L3, doi: 10.1088/2041-8205/808/1/L3
- Andrews et al. (2011) Andrews, S. M., Wilner, D. J., Espaillat, C., et al. 2011, ApJ, 732, 42, doi: 10.1088/0004-637X/732/1/42
- Andrews et al. (2018a) Andrews, S. M., Huang, J., Pérez, L. M., et al. 2018a, The Messenger, 174, 19, doi: 10.18727/0722-6691/5108
- Andrews et al. (2018b) —. 2018b, ApJ, 869, L41, doi: 10.3847/2041-8213/aaf741
- Bai (2013) Bai, X.-N. 2013, ApJ, 772, 96, doi: 10.1088/0004-637X/772/2/96
- Bai (2016) —. 2016, ApJ, 821, 80, doi: 10.3847/0004-637X/821/2/80
- Bai (2017) —. 2017, ApJ, 845, 75, doi: 10.3847/1538-4357/aa7dda
- Bai & Stone (2013) Bai, X.-N., & Stone, J. M. 2013, ApJ, 769, 76, doi: 10.1088/0004-637X/769/1/76
- Balbus & Hawley (1991) Balbus, S. A., & Hawley, J. F. 1991, ApJ, 376, 214, doi: 10.1086/170270
- Benisty et al. (2015) Benisty, M., Juhasz, A., Boccaletti, A., et al. 2015, A&A, 578, L6, doi: 10.1051/0004-6361/201526011
- Benítez-Llambay et al. (2019) Benítez-Llambay, P., Krapp, L., & Pessah, M. E. 2019, ApJS, 241, 25, doi: 10.3847/1538-4365/ab0a0e
- Béthune et al. (2016) Béthune, W., Lesur, G., & Ferreira, J. 2016, A&A, 589, A87, doi: 10.1051/0004-6361/201527874
- Béthune et al. (2017) —. 2017, A&A, 600, A75, doi: 10.1051/0004-6361/201630056
- Birnstiel et al. (2010) Birnstiel, T., Dullemond, C. P., & Brauer, F. 2010, A&A, 513, A79, doi: 10.1051/0004-6361/200913731
- Birnstiel et al. (2012) Birnstiel, T., Klahr, H., & Ercolano, B. 2012, Astronomy & Astrophysics, 539, A148, doi: 10.1051/0004-6361/201118136
- Blandford & Payne (1982) Blandford, R. D., & Payne, D. G. 1982, MNRAS, 199, 883, doi: 10.1093/mnras/199.4.883
- Bouwman et al. (2003) Bouwman, J., de Koter, A., Dominik, C., & Waters, L. B. F. M. 2003, Astronomy & Astrophysics, 401, 577, doi: 10.1051/0004-6361:20030043
- Casassus et al. (2013) Casassus, S., van der Plas, G., M, S. P., et al. 2013, Nature, 493, 191, doi: 10.1038/nature11769
- Chandrasekhar (1960) Chandrasekhar, S. 1960, Proceedings of the National Academy of Science, 46, 253, doi: 10.1073/pnas.46.2.253
- Chandrasekhar (1961) —. 1961, Hydrodynamic and hydromagnetic stability
- Clarke et al. (2001) Clarke, C. J., Gendrin, A., & Sotomayor, M. 2001, MNRAS, 328, 485, doi: 10.1046/j.1365-8711.2001.04891.x
- Dipierro et al. (2018) Dipierro, G., Laibe, G., Alexander, R., & Hutchison, M. 2018, MNRAS, 479, 4187, doi: 10.1093/mnras/sty1701
- Drazkowska et al. (2016) Drazkowska, J., Alibert, Y., & Moore, B. 2016, A&A, 594, A105, doi: 10.1051/0004-6361/201628983
- Dzyurkevich et al. (2010) Dzyurkevich, N., Flock, M., Turner, N. J., Klahr, H., & Henning, T. 2010, A&A, 515, A70, doi: 10.1051/0004-6361/200912834
- Ercolano & Rosotti (2015) Ercolano, B., & Rosotti, G. 2015, MNRAS, 450, 3008, doi: 10.1093/mnras/stv833
- Ferreira et al. (2006) Ferreira, J., Dougados, C., & Cabrit, S. 2006, A&A, 453, 785, doi: 10.1051/0004-6361:20054231
- Fukagawa et al. (2013) Fukagawa, M., Tsukagoshi, T., Momose, M., et al. 2013, PASJ, 65, L14, doi: 10.1093/pasj/65.6.L14
- Gammie (1996) Gammie, C. F. 1996, ApJ, 457, 355, doi: 10.1086/176735
- Gonzalez et al. (2017) Gonzalez, J. F., Laibe, G., & Maddison, S. T. 2017, MNRAS, 467, 1984, doi: 10.1093/mnras/stx016
- Gorti et al. (2009) Gorti, U., Dullemond, C. P., & Hollenbach, D. 2009, ApJ, 705, 1237, doi: 10.1088/0004-637X/705/2/1237
- Gorti et al. (2015) Gorti, U., Hollenbach, D., & Dullemond, C. P. 2015, ApJ, 804, 29, doi: 10.1088/0004-637X/804/1/29
- Gressel et al. (2020) Gressel, O., Ramsey, J. P., Brinch, C., et al. 2020, ApJ, 896, 126, doi: 10.3847/1538-4357/ab91b7
- Haghighipour & Boss (2003a) Haghighipour, N., & Boss, A. P. 2003a, ApJ, 583, 996, doi: 10.1086/345472
- Haghighipour & Boss (2003b) —. 2003b, ApJ, 598, 1301, doi: 10.1086/378950
- Hashimoto et al. (2011) Hashimoto, J., Tamura, M., Muto, T., et al. 2011, ApJ, 729, L17, doi: 10.1088/2041-8205/729/2/L17
- Hawley et al. (1995) Hawley, J. F., Gammie, C. F., & Balbus, S. A. 1995, ApJ, 440, 742, doi: 10.1086/175311
- Hayashi (1981) Hayashi, C. 1981, Progress of Theoretical Physics Supplement, 70, 35, doi: 10.1143/PTPS.70.35
- Hirose & Turner (2011) Hirose, S., & Turner, N. J. 2011, ApJ, 732, L30, doi: 10.1088/2041-8205/732/2/L30
- Hollenbach (2017) Hollenbach, D. 2017, Mem. Soc. Astron. Italiana, 88, 685
- Johansen et al. (2014) Johansen, A., Blum, J., Tanaka, H., et al. 2014, Protostars and Planets VI, 547, doi: 10.2458/azu_uapress_9780816531240-ch024
- Johansen & Youdin (2007) Johansen, A., & Youdin, A. 2007, ApJ, 662, 627, doi: 10.1086/516730
- Johansen et al. (2012) Johansen, A., Youdin, A. N., & Lithwick, Y. 2012, A&A, 537, A125, doi: 10.1051/0004-6361/201117701
- Kanagawa et al. (2018) Kanagawa, K. D., Muto, T., Okuzumi, S., et al. 2018, ApJ, 868, 48, doi: 10.3847/1538-4357/aae837
- Kimura et al. (2015) Kimura, H., Wada, K., Senshu, H., & Kobayashi, H. 2015, ApJ, 812, 67, doi: 10.1088/0004-637X/812/1/67
- Kobayashi & Tanaka (2010) Kobayashi, H., & Tanaka, H. 2010, Icarus, 206, 735, doi: 10.1016/j.icarus.2009.10.004
- Kobayashi et al. (2010) Kobayashi, H., Tanaka, H., Krivov, A. V., & Inaba, S. 2010, Icarus, 209, 836, doi: 10.1016/j.icarus.2010.04.021
- Kobayashi et al. (2016) Kobayashi, H., Tanaka, H., & Okuzumi, S. 2016, ApJ, 817, 105, doi: 10.3847/0004-637X/817/2/105
- Krapp et al. (2018) Krapp, L., Gressel, O., Benítez-Llambay, P., et al. 2018, ApJ, 865, 105, doi: 10.3847/1538-4357/aadcf0
- Kretke & Lin (2007) Kretke, K. A., & Lin, D. N. C. 2007, ApJ, 664, L55, doi: 10.1086/520718
- Kudoh & Shibata (1997) Kudoh, T., & Shibata, K. 1997, ApJ, 474, 362, doi: 10.1086/303437
- Kunitomo et al. (2020) Kunitomo, M., Suzuki, T. K., & Inutsuka, S.-i. 2020, MNRAS, 492, 3849, doi: 10.1093/mnras/staa087
- Lesur et al. (2013) Lesur, G., Ferreira, J., & Ogilvie, G. I. 2013, A&A, 550, A61, doi: 10.1051/0004-6361/201220395
- Lovelace et al. (1999) Lovelace, R. V. E., Li, H., Colgate, S. A., & Nelson, A. F. 1999, ApJ, 513, 805, doi: 10.1086/306900
- Lynden-Bell & Pringle (1974) Lynden-Bell, D., & Pringle, J. E. 1974, MNRAS, 168, 603, doi: 10.1093/mnras/168.3.603
- Lyra et al. (2008) Lyra, W., Johansen, A., Klahr, H., & Piskunov, N. 2008, A&A, 491, L41, doi: 10.1051/0004-6361:200810626
- Lyra et al. (2009) Lyra, W., Johansen, A., Zsom, A., Klahr, H., & Piskunov, N. 2009, A&A, 497, 869, doi: 10.1051/0004-6361/200811265
- Min et al. (2016) Min, M., Bouwman, J., Dominik, C., et al. 2016, Astronomy & Astrophysics, 593, A11, doi: 10.1051/0004-6361/201425432
- Miyake et al. (2016) Miyake, T., Suzuki, T. K., & Inutsuka, S.-i. 2016, ApJ, 821, 3, doi: 10.3847/0004-637X/821/1/3
- Mori & Okuzumi (2016) Mori, S., & Okuzumi, S. 2016, ApJ, 817, 52, doi: 10.3847/0004-637X/817/1/52
- Mulders et al. (2011) Mulders, G. D., Waters, L. B. F. M., Dominik, C., et al. 2011, Astronomy & Astrophysics, 531, A93, doi: 10.1051/0004-6361/201116770
- Nakagawa et al. (1986) Nakagawa, Y., Sekiya, M., & Hayashi, C. 1986, Icarus, 67, 375, doi: 10.1016/0019-1035(86)90121-1
- Nakatani et al. (2018a) Nakatani, R., Hosokawa, T., Yoshida, N., Nomura, H., & Kuiper, R. 2018a, ApJ, 857, 57, doi: 10.3847/1538-4357/aab70b
- Nakatani et al. (2018b) —. 2018b, ApJ, 865, 75, doi: 10.3847/1538-4357/aad9fd
- Oka et al. (2011) Oka, A., Nakamoto, T., & Ida, S. 2011, ApJ, 738, 141, doi: 10.1088/0004-637X/738/2/141
- Okuzumi et al. (2012) Okuzumi, S., Tanaka, H., Kobayashi, H., & Wada, K. 2012, ApJ, 752, 106, doi: 10.1088/0004-637X/752/2/106
- Ono et al. (2016) Ono, T., Muto, T., Takeuchi, T., & Nomura, H. 2016, ApJ, 823, 84, doi: 10.3847/0004-637X/823/2/84
- Ono et al. (2018) Ono, T., Muto, T., Tomida, K., & Zhu, Z. 2018, ApJ, 864, 70, doi: 10.3847/1538-4357/aad54d
- Ormel & Cuzzi (2007) Ormel, C. W., & Cuzzi, J. N. 2007, A&A, 466, 413, doi: 10.1051/0004-6361:20066899
- Owen et al. (2012) Owen, J. E., Clarke, C. J., & Ercolano, B. 2012, MNRAS, 422, 1880, doi: 10.1111/j.1365-2966.2011.20337.x
- Owen et al. (2010) Owen, J. E., Ercolano, B., Clarke, C. J., & Alexand er, R. D. 2010, MNRAS, 401, 1415, doi: 10.1111/j.1365-2966.2009.15771.x
- Sano et al. (2004) Sano, T., Inutsuka, S.-i., Turner, N. J., & Stone, J. M. 2004, ApJ, 605, 321, doi: 10.1086/382184
- Sano & Miyama (1999) Sano, T., & Miyama, S. M. 1999, ApJ, 515, 776, doi: 10.1086/307063
- Sano et al. (2000) Sano, T., Miyama, S. M., Umebayashi, T., & Nakano, T. 2000, ApJ, 543, 486, doi: 10.1086/317075
- Sato et al. (2016) Sato, T., Okuzumi, S., & Ida, S. 2016, A&A, 589, A15, doi: 10.1051/0004-6361/201527069
- Shakura & Sunyaev (1973) Shakura, N. I., & Sunyaev, R. A. 1973, A&A, 500, 33
- Shu et al. (1993) Shu, F. H., Johnstone, D., & Hollenbach, D. 1993, Icarus, 106, 92, doi: 10.1006/icar.1993.1160
- Simon et al. (2015) Simon, J. B., Lesur, G., Kunz, M. W., & Armitage, P. J. 2015, MNRAS, 454, 1117, doi: 10.1093/mnras/stv2070
- Steinpilz et al. (2019) Steinpilz, T., Teiser, J., & Wurm, G. 2019, ApJ, 874, 60, doi: 10.3847/1538-4357/ab07bb
- Suriano et al. (2018) Suriano, S. S., Li, Z.-Y., Krasnopolsky, R., & Shang, H. 2018, MNRAS, 477, 1239, doi: 10.1093/mnras/sty717
- Suriano et al. (2019) Suriano, S. S., Li, Z.-Y., Krasnopolsky, R., Suzuki, T. K., & Shang, H. 2019, MNRAS, 484, 107, doi: 10.1093/mnras/sty3502
- Suzuki & Inutsuka (2009) Suzuki, T. K., & Inutsuka, S.-I. 2009, in American Institute of Physics Conference Series, Vol. 1158, American Institute of Physics Conference Series, ed. T. Usuda, M. Tamura, & M. Ishii, 161–162
- Suzuki et al. (2010) Suzuki, T. K., Muto, T., & Inutsuka, S.-i. 2010, ApJ, 718, 1289, doi: 10.1088/0004-637X/718/2/1289
- Suzuki et al. (2016) Suzuki, T. K., Ogihara, M., Morbidelli, A., Crida, A., & Guillot, T. 2016, A&A, 596, A74, doi: 10.1051/0004-6361/201628955
- Takahashi & Muto (2018) Takahashi, S. Z., & Muto, T. 2018, ApJ, 865, 102, doi: 10.3847/1538-4357/aadda0
- Takeuchi & Lin (2002) Takeuchi, T., & Lin, D. N. C. 2002, ApJ, 581, 1344, doi: 10.1086/344437
- Taki et al. (2016) Taki, T., Fujimoto, M., & Ida, S. 2016, A&A, 591, A86, doi: 10.1051/0004-6361/201527732
- Velikhov (1959) Velikhov, E. 1959, Sov. Phys. JETP, 36, 995
- Wada et al. (2013) Wada, K., Tanaka, H., Okuzumi, S., et al. 2013, A&A, 559, A62, doi: 10.1051/0004-6361/201322259
- Wang et al. (2019) Wang, L., Bai, X.-N., & Goodman, J. 2019, ApJ, 874, 90, doi: 10.3847/1538-4357/ab06fd
- Weidenschilling (1977) Weidenschilling, S. J. 1977, MNRAS, 180, 57, doi: 10.1093/mnras/180.1.57
- Whipple (1972) Whipple, F. L. 1972, in From Plasma to Planet, ed. A. Elvius, 211
- Youdin & Goodman (2005) Youdin, A. N., & Goodman, J. 2005, ApJ, 620, 459, doi: 10.1086/426895
- Youdin & Lithwick (2007) Youdin, A. N., & Lithwick, Y. 2007, Icarus, 192, 588, doi: 10.1016/j.icarus.2007.07.012