Audiovisual Speech-In-Noise (SIN) Performance of Young Adults with ADHD
Abstract.
Adolescents with Attention-deficit/hyperactivity disorder (ADHD) have difficulty processing speech with background noise due to reduced inhibitory control and working memory capacity (WMC). This paper presents a pilot study of an audiovisual Speech-In-Noise (SIN) task for young adults with ADHD compared to age-matched controls using eye-tracking measures. The audiovisual SIN task consists of varying six levels of background babble, accompanied by visual cues. A significant difference between ADHD and neurotypical (NT) groups was observed at 15 dB signal-to-noise ratio (SNR). These results contribute to the literature of young adults with ADHD.
1. Introduction
The recent estimated prevalence of diagnosed ADHD in children and adolescents has increased from 6.1% to 10.2% over the period of 1997 to 2016 in the U.S. (Xu et al., 2018). Adolescents with ADHD have difficulty meeting time limits, controlling anger, inhibiting responses, and processing auditory information (Fields et al., 2017; Fostick, 2017; Barkley, 1997). Processing speech in background noise requires fundamental language abilities, higher working memory, as well as a higher signal-to-noise ratio (SNR) (Schneider et al., 2007). Since a person’s ability to process speech with background noise depends on that person’s auditory and cognitive system (Schneider et al., 2007), young adults with ADHD may experience difficulty processing auditory information in the presence of background noise due to reduced inhibitory control (Barkley, 1997; Woltering et al., 2013; Woods et al., 2002; Pazvantoğlu et al., 2012), and decreased working memory capacity (WMC) (Banich et al., 2009; Alderson et al., 2013; Michalek et al., 2014).
Unlike noise, which degrades listening conditions, the presence of external visual cues such as written, contextual information and facial movements, can enhance the processing of auditory information, especially when accompanied by noise (Jääskeläinen, 2010; Van Wassenhove et al., 2005; von Kriegstein et al., 2008; Rudner et al., 2009; Mishra et al., 2013; Fraser et al., 2010; Michalek et al., 2014; Moradi et al., 2013). At increased noise levels, semantically related visual cues have a positive impact on the perception of spoken sentences (Zekveld et al., 2011). When increased noise is present during face-to-face conversation, adults tend to fixate more on the nose and mouth area of the speaker (Buchan et al., 2008), confirming that oral-motor movements of the speaker aides speech recognition (Bristow et al., 2008).
Neurotypical (NT) individuals are known to perceive audiovisual cues more accurately from the right visual field (RVF) than from the left visual field (LVF) (Kimura, 1973). Multiple studies on this (Carter et al., 1995; Voeller and Heilman, 1988; Mitchell et al., 1990; Heilman et al., 1991) showed the presence of a lateralized deficit in the visual-spatial attention of ADHD subjects, which orients their attention to LVF targets.
Our work presents the performance of young adults with ADHD compared to age-matched controls using eye-tracking measures during an audiovisual SIN task. Our findings are consistent with the possibility that audiovisual cues, in general, are processed in such a way that WMC or cognitive load are not consistently impacted in increasing levels of background noise for NT adults (Michalek et al., 2018).
2. Methodology
2.1. Participants
Our pilot study consisted of five young adults (4 F, 1 M) with a prior diagnosis of ADHD, and six NT young adults (4 F, 2 M) as the control. All participants were aged between 18 - 30 years, with no history of psychotic symptoms and normal vision. Participants with a diagnosis of ADHD confirmed their diagnosis through medical documentation, including records from a physician or licensed psychiatrist. They were asked to remain medication-free for 12 hours prior to study participation. There were no participants who had been prescribed long lasting non-stimulants, so the 12-hour time frame was sufficient for all participants. Information on the risks of avoiding medication were provided prior to the experiment, and participants acknowledged it by signing a consent form approved by University’s Institutional Review Board. Both ADHD and NT participants went through a hearing screening of 20 dB HL at frequencies 500 Hz, 1000 Hz, 2000 Hz, and 4000 Hz, bilaterally, to ensure their hearing was within normal limits.

2.2. Speech-in-Noise Task
We used QuickSIN (Killion et al., 2004) software to simultaneously present a sentence repetition task with background noise (i.e. speech babble) at six SNRs: 25 dB, 20 dB, 15 dB, 10 dB, 5 dB, and 0 dB. Each SNR represents the ratio of the dB level of speech to dB level of noise. The level of background noise increases as the SNR decreases. The audiovisual QuickSIN setup is presented in Figure 1a. Participants were asked to listen to the sentences while simultaneously viewing the speaker’s face and then repeat each sentence verbally. Participants were presented with nine sentence sets, each having six sentences representing all background noise levels. Each sentence had an average of 8-13 words including five keywords (e.g., The weight of the package was seen on the high scale). Participants were scored based on the number of keywords accurately repeated per sentence. The presentation of the nine sentence blocks was randomized and counterbalanced across participants.
2.3. Eye-tracking Setup
We used Tobii Pro X2-60 computer screen-based eye tracker (60 Hz, 0.4∘ accuracy) to record the eye movements of participants during the QuickSIN task. Prior to the experiment, each participant was calibrated using Tobii’s standard calibration methods. We used Tobii Studio analysis software to pre-process gaze metrics using the I-VT filter (velocity threshold set to 30∘/second) to extract eye movement metrics recorded throughout the study.
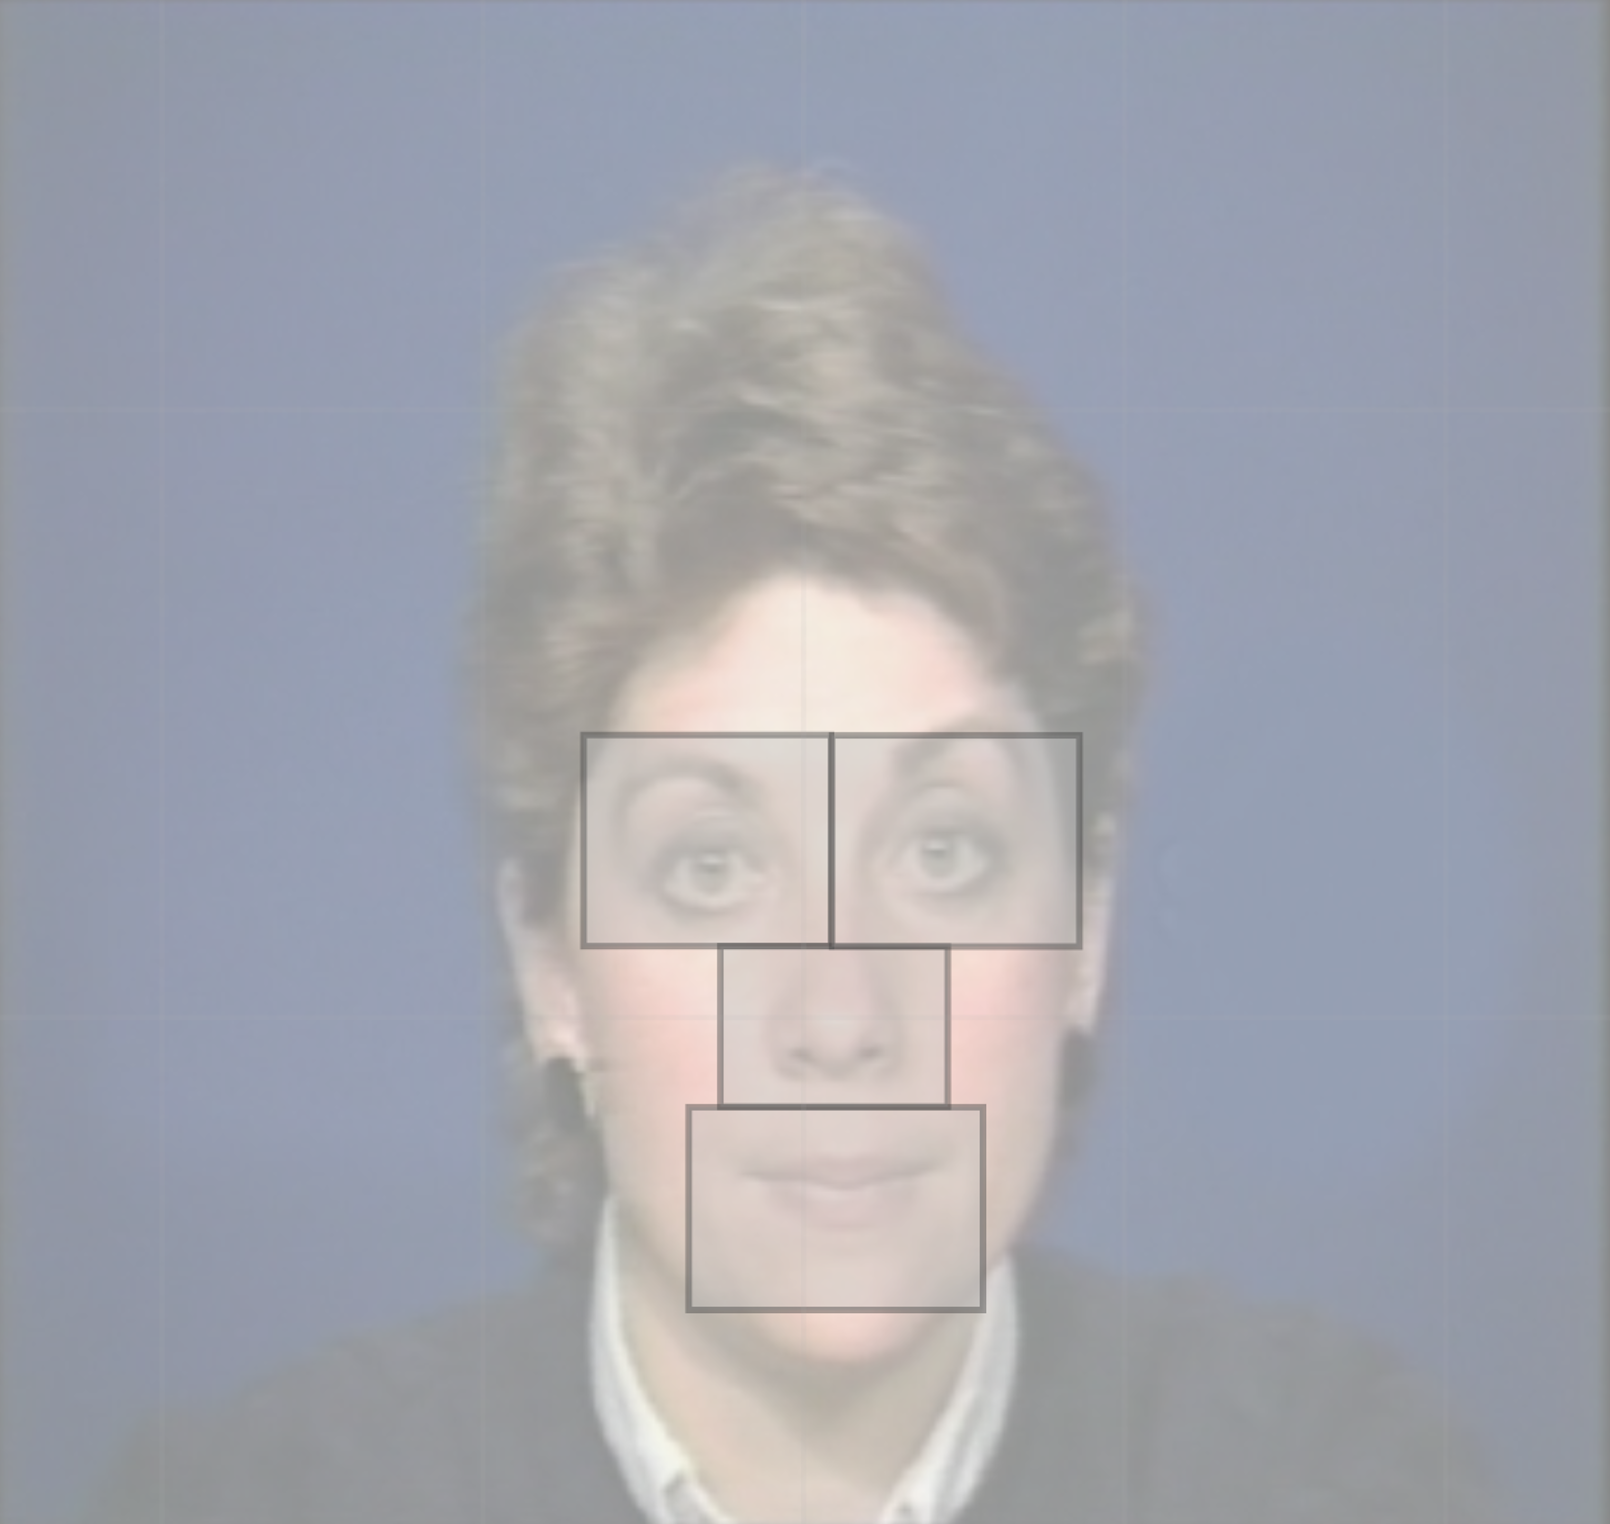
We specified four areas of interest (AOIs): 1) left eye, 2) right eye, 3) nose, and 4) mouth of the eye-tracking stimulus to analyze the eye-movements of participants (see Figure 1b).
2.4. Analysis
To observe how the eye-tracking measurements change with audiovisual cues, we used our RAEMAP (Jayawardena, 2020) eye movement processing pipeline, which is a modified version of gaze analytics pipeline (Duchowski, 2017). Upon correct mapping of variables, the original gaze analytics pipeline has the capability of extracting raw gaze data from various eye trackers (Duchowski, 2017). After extracting raw gaze data, the gaze analytics pipeline: (1) classify raw gaze points into fixations, and (2) aggregate fixations related information for statistical analysis. The gaze analytics pipeline facilitates computation of numerous eye movement metrics. Also, it has the capability of generating visualizations of gaze points, fixations within AOIs, heat maps, ambient/focal fixations, and microsaccades per scan path. The current implementation of the gaze analytics pipeline handles eye-tracking data recorded during each task of each person sequentially. This process is computationally expensive, where the split and merge approach generates large number of intermediate files along the way of eye gaze metrics calculations.
RAEMAP is developed such that calculations of eye gaze metrics utilize distributed computing resources as illustrated in Figure 2. RAEMAP facilitates computation of traditional positional gaze metrics such as fixation count and fixation duration, as well as advanced metrics such as gaze transition entropy (Krejtz et al., 2015), and complex pupillometry measurements such as index of pupillary activity (IPA) (Duchowski et al., 2018) which indicate cognitive load. RAEMAP also has the capability of generating visualizations of gaze points, AOIs, scan paths, and fixations on AOIs (see Figure 1). The architecture of RAEMAP is shown in Figure 2.
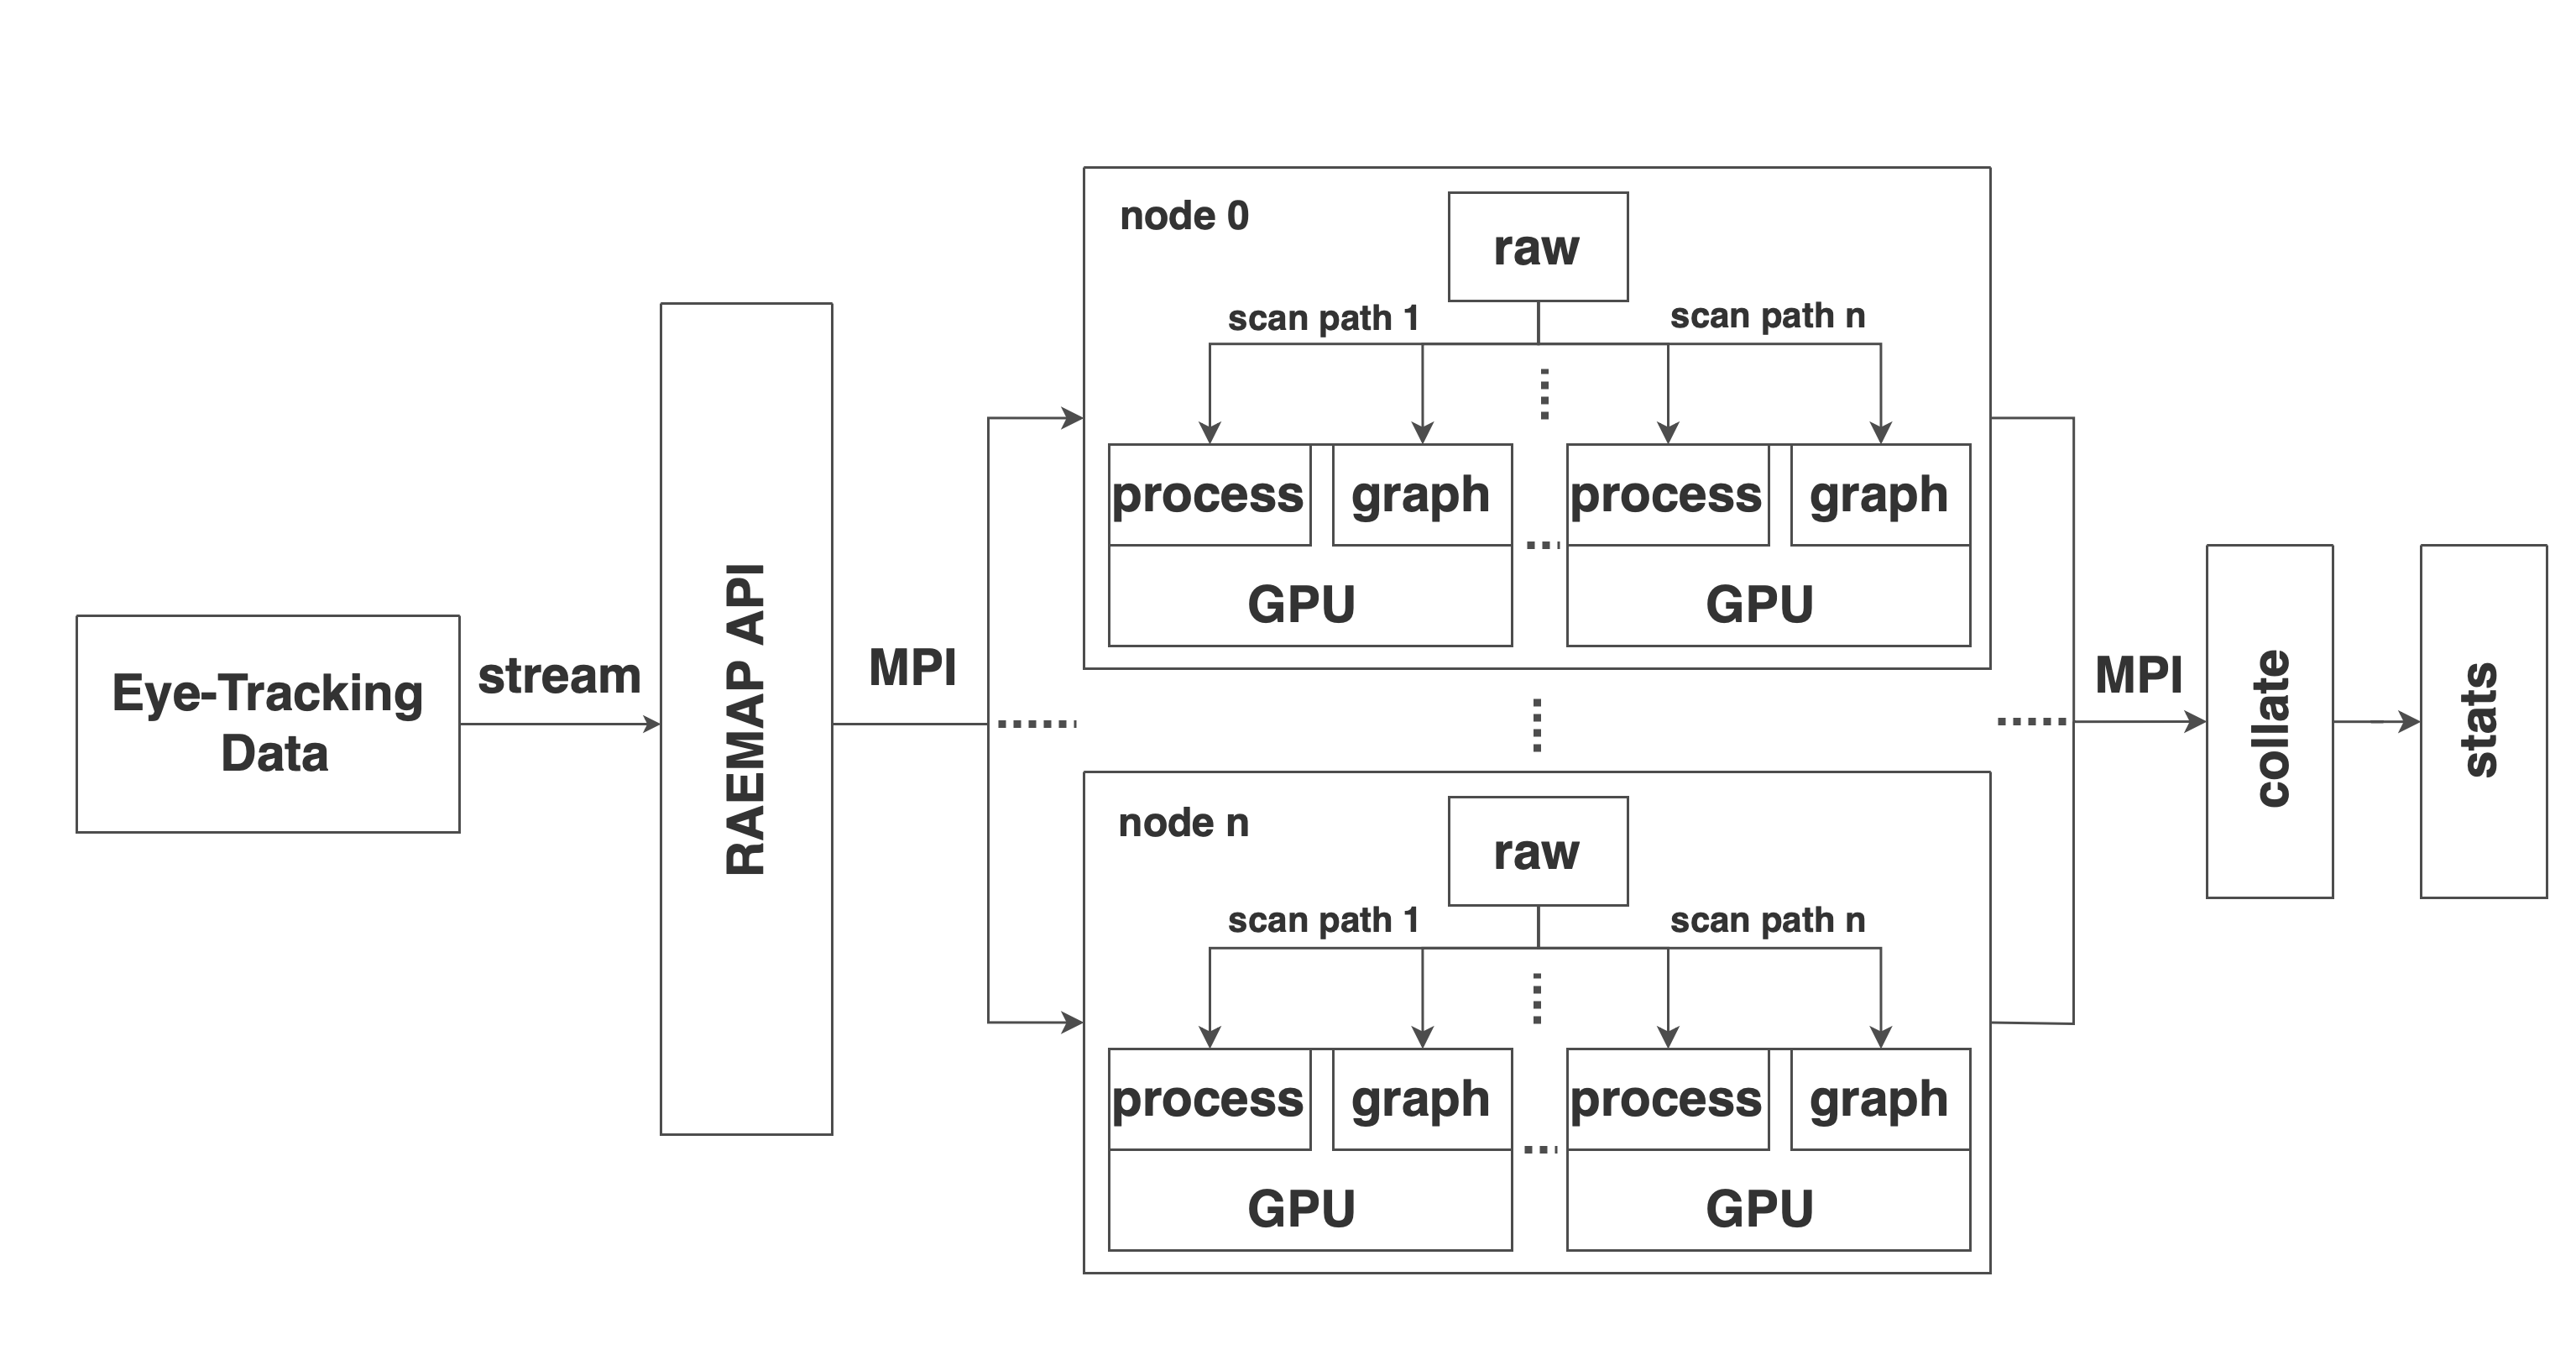
In RAEMAP, the calculations of eye gaze metrics of subjects are done in separate processes utilizing distributed computing resources as illustrated in Figure 2 since they are independent of one another to enhance the efficiency. The aggregation of calculated eye gaze metrics of all participants in each task is done using Message Passing Interface (MPI). In addition, RAEMAP have the stream processing capability to calculate eye gaze metrics and visualize the scan path as data is being streamed by the eye tracker.
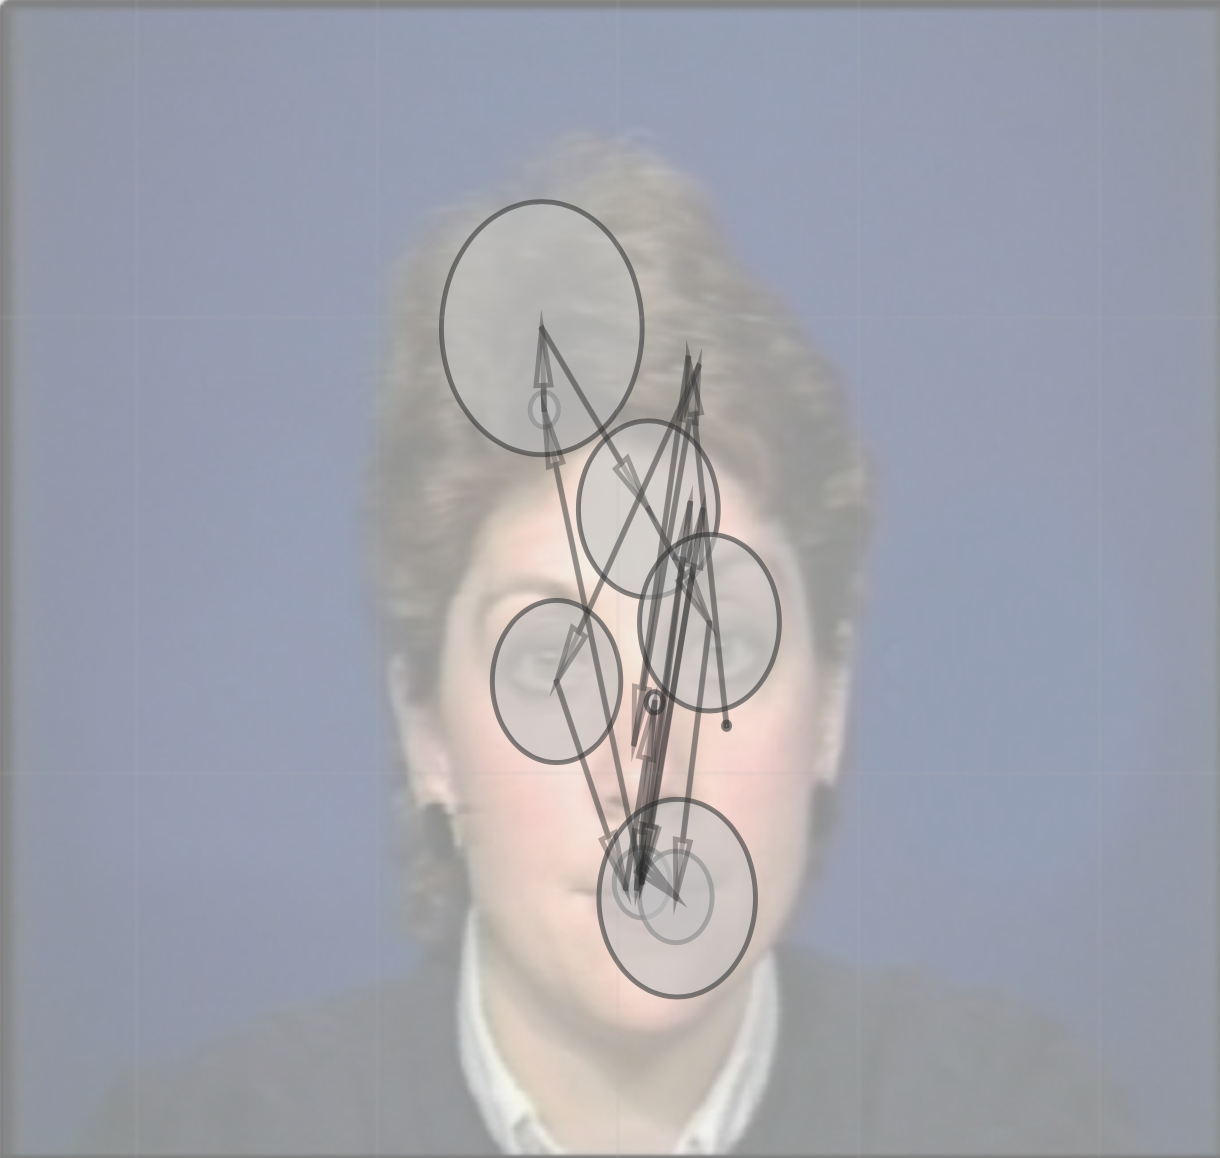
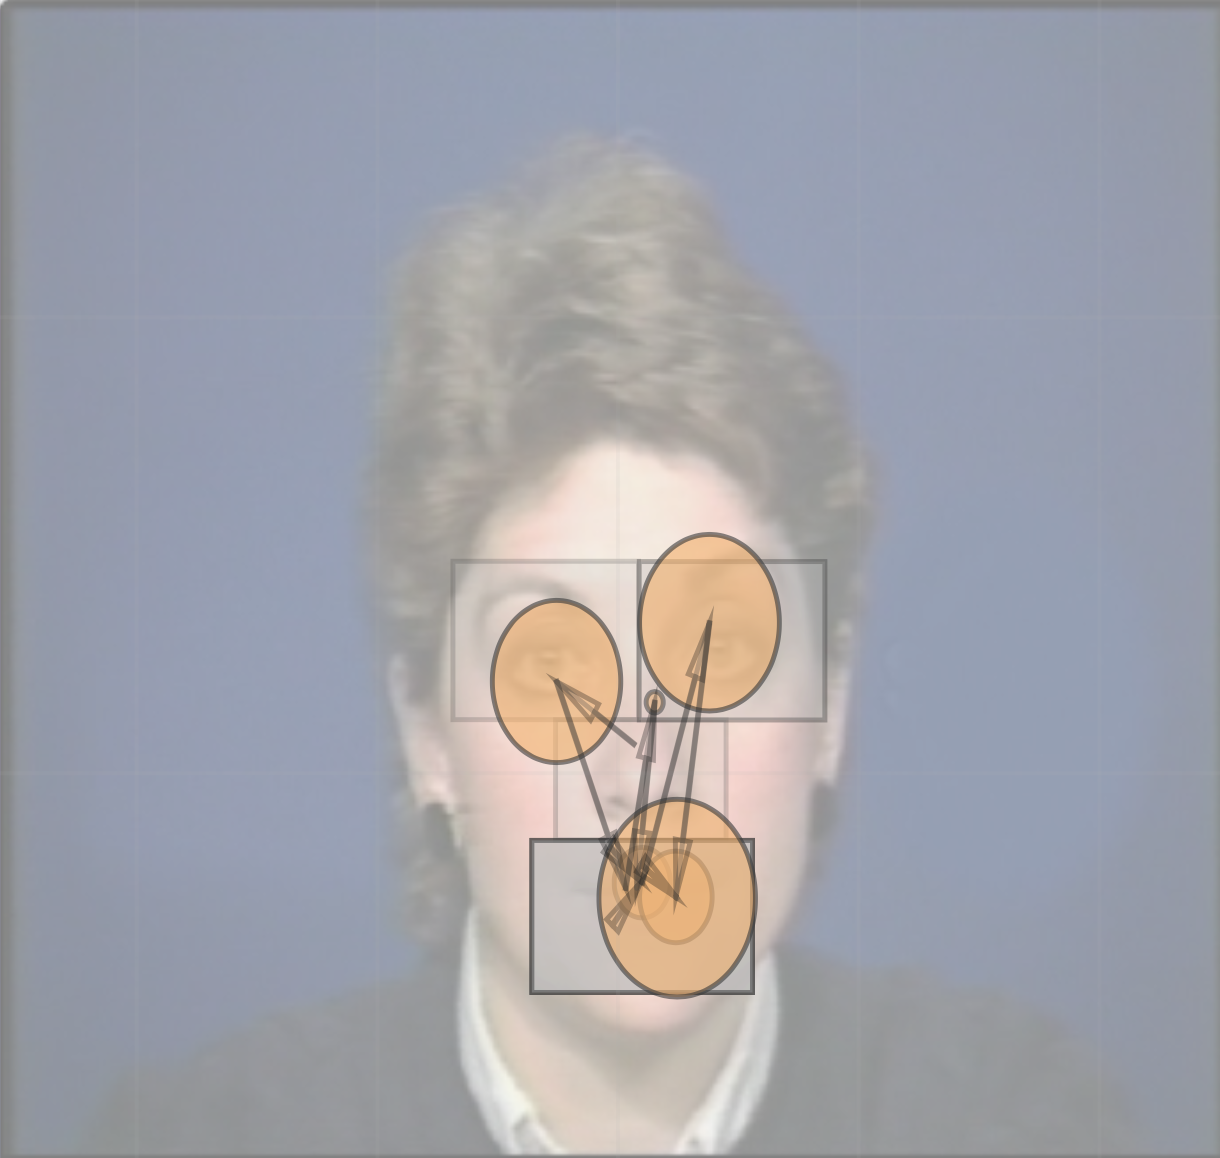
We applied RAEMAP to calculate gaze points, AOIs, scan paths, and fixations on AOIs per each sentence of the QuickSIN task for each participant. Figure 1c shows a visualization of fixations of one participant while watching one sentence in the QuickSIN task. Figure 1d shows a visualization of fixations on pre-defined AOIs. We generated gaze transition matrices and corresponding gaze transition entropies for both participant groups. We also calculated the IPA counts for participants in both groups.
3. Results
We first report the performance of ADHD and NT participants during the QuickSIN task. Next we analyze changes in eye movements in relation to the six SNRs. A mixed, repeated measures ANOVA using a 2x6 design with main factors of group (ADHD or NT) and SNR (0 dB to 25 dB with 5dB increments) was carried out on the performance of QuickSIN task and the eye-tracking measures.
3.1. QuickSIN performance
We first analyze the performance of both ADHD and NT participants at each SNR. Each participant was assigned a score for every sentence, based on the number of keywords accurately repeated out of five. There was no main effect of the participant group for QuickSIN performance , indicating that performance was similar between ADHD and NT participants. There was a significant main effect of the SNR on QuickSIN performance, , indicating that performance was different among SNRs. There was no significant interaction effect between SNR and participant group, . To further evaluate the main effect of the SNR, we conducted a -test for each SNR, identifying a significant difference of QuickSIN performance between the two groups at 15 dB SNR, .
The performance of NT participants was best at 15 dB SNR whereas, the performance of participants with ADHD was best at 20 dB SNR. In general, when the task’s difficulty level was easy (SNR¿15 dB), both ADHD and NT participants performed well by recalling 4.7 keywords out of 5 on average per sentence. In contrast, when the task was difficult (0 dB SNR), both ADHD and NT participants did not perform well by recalling 2.3 keywords out of 5 on average per sentence. At 15 dB SNR, participants with ADHD recalled 4.7 keywords on average and NT participants recalled 4.9 keywords on average.
3.2. Analysis of Fixation Count
Fixation count indicates the number of times eyes fixated on an AOI. We observed that participants with ADHD fixate more on left eye whereas NT participants fixate more on right eye. At SNRs 20 dB, 15 dB, and 10 dB, participants with ADHD fixated mostly on the left eye region.
| SNR | Left Eye | Right Eye | Nose | Mouth | ||||
|---|---|---|---|---|---|---|---|---|
| ADHD | NT | ADHD | NT | ADHD | NT | ADHD | NT | |
| 25 dB | ||||||||
| 20 dB | ||||||||
| 15 dB | ||||||||
| 10 dB | ||||||||
| 5 dB | ||||||||
| 0 dB | ||||||||
We conducted repeated measures 2x6 two-way ANOVA with main factors of group, and SNR on fixation counts on each AOI. We observed a significant main effect of the SNR, as well as group, on fixation counts on left eye indicating that number of fixations differed among ADHD and NT participants as well as different SNRs. There was a significant interaction effect between SNR and group, , indicating that fixation counts on the left eye on different listening conditions differed depending on the ADHD diagnosis.
We observed a significant main effect of the SNR for fixations on right eye, nose, and mouth, all , but no main effect of the group, all . Also, there was no significant interaction effect between SNR and group for right eye, nose, and mouth, all . Contrasts of the SNR revealed that the number of fixations on the nose significantly differed when compared 25 dB, 20 dB, and 15 dB SNRs against 0 dB, all among the two groups. The number of fixations on left eye, right eye, and mouth on all SNRs significantly differed when compared 0 dB, (see Table 1).
3.3. Gaze Transition Matrices
The gaze transition matrices (Krejtz et al., 2015) indicate the probability of transition of gaze between two AOIs. Figure 3 shows the computed gaze transition matrices for ADHD and NT participants at gradually increasing levels of background noise.


Gaze transition matrices for different listening conditions suggest that, in general, participants with ADHD tend to make unpredictable gaze transitions at different difficulty levels of the task whereas NT participants tend to make gaze transition from any AOI to mouth region regardless the difficulty level of the task. Interestingly, it can be observed that participants with ADHD tend to re-fixate on the left eye region at 20 dB SNR, where the task is relatively easy.
We calculated the gaze transition entropy to determine the overall distribution of attention over AOIs. Small entropy values indicate predictable gaze transitions among AOIs, while large entropy values indicate less predictable gaze transitions among AOIs when transitioning from any source AOI to any destination AOI with similar probabilities (Krejtz et al., 2015).
Corresponding transition entropies of computed gaze transition matrices are shown in Table 2. There was no significant main effect of the SNR, , or the group, on transition entropies, indicating no difference among participant groups or SNRs. Also, there was no significant interaction effect between SNR and participant group, . Table 2 shows a tendency of higher entropy for both ADHD and NT participants during the most difficult listening condition (0 dB), indicating less predictability in gaze transitions. Also, -tests on transition entropies of participants at each SNR (i.e. without aggregating per participant) showed a significant effect for the NT group, at 0 dB compared to the other listening conditions (all ).
3.4. The index of pupillary activity (IPA)
The IPA is calculated using a wavelet-based algorithm that relies on wavelet decomposition of the pupil diameter signal, and its wavelet analysis. For the IPA calculation, we used Daubechies-4 wavelet for a 60 Hz signal as suggested in (Duchowski et al., 2018). Low IPA counts reflect little cognitive load whereas high IPA counts indicate strong cognitive load (Duchowski et al., 2018).
| SNR | Entropy | IPA | ||
|---|---|---|---|---|
| ADHD | NT | ADHD | NT | |
| 25 dB | ||||
| 20 dB | ||||
| 15 dB | ||||
| 10 dB | ||||
| 5 dB | ||||
| 0 dB | ||||
There was no significant main effect of the SNR, , or of the group, on IPA counts, indicating that cognitive load did not differ among participant groups or SNRs. We observed a significant interaction effect between SNR and group, on IPA counts such that cognitive load on different SNRs differed in ADHD and NT groups. Contrasts revealed significant interactions when comparing SNRs 25 dB and 0 dB,, and SNRs 20 dB and 0 dB, . These effects reflect that the cognitive load differed significantly among hardest and easiest listening conditions between the two groups (see Table 2). The remaining contrasts revealed no significant interaction when comparing two groups to different listening conditions, .
At the hardest listening condition, we expect listening demands to be greater for participants with ADHD, yielding a significant difference in IPA counts, because their innate WMC is lower compared to the NT participants (Banich et al., 2009; Alderson et al., 2013; Michalek et al., 2014), thus perform significantly different on QuickSIN task. But, -tests on IPA counts of participants at sentence level (i.e. without aggregating per participant) yielded no significant difference between the ADHD and NT groups, for all SNRs, except 15 dB SNR. Interestingly, at 15 dB SNR, IPA counts of participants at sentence level yielded a significant difference between the ADHD and NT groups, indicating a significant difference in cognitive load between the two groups. Since cognitive load inherently reduces WMC (Chandler and Sweller, 1991; Sweller et al., 1990), we expected participants with ADHD to do worse at 15 dB SNR, as their cognitive load is high and their WMC does not commensurate with NT participants. The expected behavior is confirmed by the significant performance difference observed in the evaluation of the number of keywords recalled between ADHD and NT groups at 15 dB SNR.
4. Discussion
Our results indicate ADHD, and NT adolescents perform equally likely in the SIN task where audiovisual cues are present when the task difficulty is very high or very low. However, significant differences of QuickSIN performance between participants groups were observed at 15 dB SNR where ADHD and NT participants recalled 4.7 and 4.9 keywords on average respectively. Fixation counts on AOIs suggested that both groups had a strong preference to look at the mouth of the speaker at the easiest listening condition whereas, both groups looked at the nose of the speaker at the hardest listening condition. In all other listening conditions, NT participants preferred to look at the mouth whereas participants with ADHD mostly looked at the left eye. The NT individuals perceive audiovisual cues more accurately from the RVF (Kimura, 1973), whereas ADHD orient attention to LVF targets due to the lateralized deficit in visual-spatial attention (Carter et al., 1995; Voeller and Heilman, 1988; Mitchell et al., 1990; Heilman et al., 1991). Our eye tracking observations align with literature, confirming that young adults with ADHD orient attention to LVF when perceiving audiovisual cues. Gaze transition matrices and transition entropies show that participants with ADHD tend to make unpredictable gaze transitions at different difficulty levels of the task whereas NT participants tend to re-fixate on the mouth region.
Interestingly, only at 15 dB SNR, IPA counts yielded a significant difference between the two groups, where QuickSIN performance also yielded a significant difference between them. This indicates that 15 dB SNR is when the noise shifts to a point where processing of speech becomes less automatic and relies more on increased cognitive load. These findings are consistent with the possibility that audiovisual cues, in general, are processed in such a way that WMC or cognitive load are not consistently impacted in increasing levels of background noise for NT group (Michalek et al., 2018).
5. Conclusion
Our work presents an analysis of audiovisual SIN performance for young adults with ADHD compared to age-matched controls using eye-tracking measures. We analyzed the performance of the participants and eye-movement parameters such as fixation count on AOIs, gaze transition entropy, and IPA. We observed that participants with ADHD primarily fixated on the left eye of the speaker whereas NT group fixated on the right eye,supporting the literature that ADHD orients attention to the LVF whereas NT individuals orient attention to the RVF. When the task difficulty was at a medium level with 15 dB SNR, we observed a significant difference in cognitive load as well as performance between the two groups.
In the future we expect to explore eye movement behavior when scanning the speaker’s face in terms of advanced eye movement metrics such as coefficient of measurement of focal or ambient viewing , and a larger representation of ADHD and NT adolescents.
References
- (1)
- Alderson et al. (2013) R Matt Alderson, Lisa J Kasper, Kristen L Hudec, and Connor HG Patros. 2013. Attention-deficit/hyperactivity disorder (ADHD) and working memory in adults: a meta-analytic review. Neuropsychology 27, 3 (2013), 287.
- Banich et al. (2009) Marie T Banich, Gregory C Burgess, Brendan E Depue, Luka Ruzic, L Cinnamon Bidwell, Sena Hitt-Laustsen, Yiping P Du, and Erik G Willcutt. 2009. The neural basis of sustained and transient attentional control in young adults with ADHD. Neuropsychologia 47, 14 (2009), 3095–3104.
- Barkley (1997) Russell A Barkley. 1997. Behavioral inhibition, sustained attention, and executive functions: constructing a unifying theory of ADHD. Psychological bulletin 121, 1 (1997), 65.
- Bristow et al. (2008) Davina Bristow, Ghislaine Dehaene-Lambertz, Jeremie Mattout, Catherine Soares, Teodora Gliga, Sylvain Baillet, and Jean-François Mangin. 2008. Hearing faces: how the infant brain matches the face it sees with the speech it hears. Journal of cognitive neuroscience 21, 5 (2008), 905–921.
- Buchan et al. (2008) Julie N Buchan, Martin Paré, and Kevin G Munhall. 2008. The effect of varying talker identity and listening conditions on gaze behavior during audiovisual speech perception. Brain research 1242 (2008), 162–171.
- Carter et al. (1995) Cameron S Carter, Penelope Krener, Marc Chaderjian, Cherise Northcutt, and Virginia Wolfe. 1995. Asymmetrical visual-spatial attentional performance in ADHD: evidence for a right hemispheric deficit. Biological psychiatry 37, 11 (1995), 789–797.
- Chandler and Sweller (1991) Paul Chandler and John Sweller. 1991. Cognitive load theory and the format of instruction. Cognition and instruction 8, 4 (1991), 293–332.
- Duchowski (2017) Andrew T Duchowski. 2017. The Gaze Analytics Pipeline. In Eye Tracking Methodology. Springer, New York, NY, 175–191.
- Duchowski et al. (2018) Andrew T Duchowski, Krzysztof Krejtz, Izabela Krejtz, Cezary Biele, Anna Niedzielska, Peter Kiefer, Martin Raubal, and Ioannis Giannopoulos. 2018. The index of pupillary activity: measuring cognitive load vis-à-vis task difficulty with pupil oscillation. In Proceedings of the 2018 CHI Conference on Human Factors in Computing Systems. ACM, Montréal, QC, Canada, 282.
- Fields et al. (2017) Scott A Fields, William Michael Johnson, and Madison B Hassig. 2017. Adult ADHD: Addressing a unique set of challenges. The journal of family practice 66, 2 (2017), 68–74.
- Fostick (2017) Leah Fostick. 2017. The effect of attention-deficit/hyperactivity disorder and methylphenidate treatment on the adult auditory temporal order judgment threshold. Journal of Speech, Language, and Hearing Research 60, 7 (2017), 2124–2128.
- Fraser et al. (2010) Sarah Fraser, Jean-Pierre Gagné, Majolaine Alepins, and Pascale Dubois. 2010. Evaluating the effort expended to understand speech in noise using a dual-task paradigm: The effects of providing visual speech cues. Journal of Speech, Language, and Hearing Research 53, 1 (2010), 18–33. https://doi.org/10.1044/1092-4388(2009/08-0140)
- Heilman et al. (1991) Kenneth M Heilman, Kytja KS Voeller, and Stephen E Nadeau. 1991. A possible pathophysiologic substrate of attention deficit hyperactivity disorder. Journal of Child Neurology 6, 1_suppl (1991), S76–S81.
- Jääskeläinen (2010) Iiro P Jääskeläinen. 2010. The role of speech production system in audiovisual speech perception. The open neuroimaging journal 4 (2010), 30.
- Jayawardena (2020) Gavindya Jayawardena. 2020. RAEMAP: Real-Time Advanced Eye Movements Analysis Pipeline. In Symposium on Eye Tracking Research and Applications 2020. ACM, Stuttgart, Germany.
- Killion et al. (2004) Mead C Killion, Patricia A Niquette, Gail I Gudmundsen, Lawrence J Revit, and Shilpi Banerjee. 2004. Development of a quick speech-in-noise test for measuring signal-to-noise ratio loss in normal-hearing and hearing-impaired listeners. The Journal of the Acoustical Society of America 116, 4 (2004), 2395–2405.
- Kimura (1973) Doreen Kimura. 1973. The asymmetry of the human brain. Scientific American 228, 3 (1973), 70–80.
- Krejtz et al. (2015) Krzysztof Krejtz, Andrew Duchowski, Tomasz Szmidt, Izabela Krejtz, Fernando González Perilli, Ana Pires, Anna Vilaro, and Natalia Villalobos. 2015. Gaze transition entropy. ACM Transactions on Applied Perception (TAP) 13, 1 (2015), 4.
- Michalek et al. (2018) Anne MP Michalek, Ivan Ash, and Kathryn Schwartz. 2018. The independence of working memory capacity and audiovisual cues when listening in noise. Scandinavian journal of psychology 59, 6 (2018), 578–585.
- Michalek et al. (2014) Anne MP Michalek, Silvana M Watson, Ivan Ash, Stacie Ringleb, and Anastasia Raymer. 2014. Effects of noise and audiovisual cues on speech processing in adults with and without ADHD. International journal of audiology 53, 3 (2014), 145–152.
- Mishra et al. (2013) Sushmit Mishra, Thomas Lunner, Stefan Stenfelt, Jerker Rönnberg, and Mary Rudner. 2013. Seeing the talker’s face supports executive processing of speech in steady state noise. Frontiers in Systems Neuroscience 7 (2013), 96.
- Mitchell et al. (1990) Wendy G Mitchell, John M Chavez, Sherryl A Baker, Bianca L Guzman, and Stanley P Azen. 1990. Reaction time, impulsivity, and attention in hyperactive children and controls: A video game technique. Journal of Child Neurology 5, 3 (1990), 195–204.
- Moradi et al. (2013) Shahram Moradi, Björn Lidestam, and Jerker Rönnberg. 2013. Gated audiovisual speech identification in silence vs. noise: Effects on time and accuracy. Frontiers in Psychology 4 (2013), 359.
- Pazvantoğlu et al. (2012) Ozan Pazvantoğlu, Arzu Alptekin Aker, Koray Karabekiroğlu, Seher Akbaş, Gökhan Sarısoy, Saliha Baykal, Işıl Zabun Korkmaz, Emel Alkan Pazvantoğlu, Ömer Böke, and Ahmet Rifat Şahin. 2012. Neuropsychological weaknesses in adult ADHD; cognitive functions as core deficit and roles of them in persistence to adulthood. Journal of the International Neuropsychological Society 18, 5 (2012), 819–826.
- Rudner et al. (2009) Mary Rudner, Catharina Foo, Jerker Rönnberg, and Thomas Lunner. 2009. Cognition and aided speech recognition in noise: Specific role for cognitive factors following nine-week experience with adjusted compression settings in hearing aids. Scandinavian Journal of Psychology 50, 5 (2009), 405–418.
- Schneider et al. (2007) Bruce A Schneider, Liang Li, and Meredyth Daneman. 2007. How competing speech interferes with speech comprehension in everyday listening situations. Journal of the American Academy of Audiology 18, 7 (2007), 559–572.
- Sweller et al. (1990) John Sweller, Paul Chandler, Paul Tierney, and Martin Cooper. 1990. Cognitive load as a factor in the structuring of technical material. Journal of experimental psychology: general 119, 2 (1990), 176.
- Van Wassenhove et al. (2005) Virginie Van Wassenhove, Ken W Grant, and David Poeppel. 2005. Visual speech speeds up the neural processing of auditory speech. Proceedings of the National Academy of Sciences 102, 4 (2005), 1181–1186.
- Voeller and Heilman (1988) Kytja KS Voeller and Kenneth M Heilman. 1988. Attention deficit disorder in children: A neglect syndrome? Neurology 38, 5 (1988), 806–806.
- von Kriegstein et al. (2008) Katharina von Kriegstein, Özgür Dogan, Martina Grüter, Anne-Lise Giraud, Christian A Kell, Thomas Grüter, Andreas Kleinschmidt, and Stefan J Kiebel. 2008. Simulation of talking faces in the human brain improves auditory speech recognition. Proceedings of the National Academy of Sciences 105, 18 (2008), 6747–6752.
- Woltering et al. (2013) Steven Woltering, Zhongxu Liu, Alan Rokeach, and Rosemary Tannock. 2013. Neurophysiological differences in inhibitory control between adults with ADHD and their peers. Neuropsychologia 51, 10 (2013), 1888–1895.
- Woods et al. (2002) Steven Paul Woods, David W Lovejoy, and JD Ball. 2002. Neuropsychological characteristics of adults with ADHD: A comprehensive review of initial studies. The Clinical Neuropsychologist 16, 1 (2002), 12–34.
- Xu et al. (2018) Guifeng Xu, Lane Strathearn, Buyun Liu, Binrang Yang, and Wei Bao. 2018. Twenty-year trends in diagnosed attention-deficit/hyperactivity disorder among US children and adolescents, 1997-2016. In JAMA Network Open. American Medical Association, Iowa City, IA, e181471–e181471.
- Zekveld et al. (2011) Adriana A Zekveld, Mary Rudner, Ingrid S Johnsrude, Joost M Festen, Johannes HM Van Beek, and Jerker Rönnberg. 2011. The influence of semantically related and unrelated text cues on the intelligibility of sentences in noise. Ear and hearing 32, 6 (2011), e16–e25.