CrossCheck: Rapid, Reproducible, and Interpretable Model Evaluation
Abstract
Evaluation beyond aggregate performance metrics, e.g. F1-score, is crucial to both establish an appropriate level of trust in machine learning models and identify future model improvements. In this paper we demonstrate CrossCheck, an interactive visualization tool for rapid cross-model comparison and reproducible error analysis. We describe the tool and discuss design and implementation details. We then present three use cases (named entity recognition, reading comprehension, and clickbait detection) that show the benefits of using the tool for model evaluation. CrossCheck allows data scientists to make informed decisions to choose between multiple models, identify when the models are correct and for which examples, investigate whether the models are making the same mistakes as humans, evaluate models’ generalizability and highlight models’ limitations, strengths and weaknesses. Furthermore, CrossCheck is implemented as a Jupyter widget, which allows rapid and convenient integration into data scientists’ model development workflows.
1 Motivation
Complex machine learning (ML) models for NLP are imperfect, opaque, and often brittle. Gaining an effective understanding and actionable insights about model strengths and weaknesses is challenging because simple metrics like accuracy or F1-score are not sufficient to capture the complex relationships between model inputs and outputs. Therefore, standard performance metrics should be augmented with exploratory model performance analysis, where a user can interact with inputs and outputs to find patterns or biases in the way the model makes mistakes to answer the questions of when, how, and why the model fails. Many researchers agree that ML models have to be optimized not only for expected task performance but for other important criteria such as explainability, interpretability, reliability, and fairness that are prerequisites for trust (Lipton, 2016; Doshi-Velez and Kim, 2017; Poursabzi-Sangdeh et al., 2018).
To support ML model evaluation beyond standard performance metrics we developed a novel interactive tool CrossCheck 111https://github.com/pnnl/crosscheck. Unlike several recently developed tools for analyzing model errors (Agarwal et al., 2014; Wu et al., 2019), understanding model outputs (Lee et al., 2019; Hohman et al., 2019) and model interpretation and diagnostics (Kahng et al., 2017, 2016; Zhang et al., 2018), CrossCheck is designed to allow rapid prototyping and cross-model comparison to support comprehensive experimental setup and gain interpretable and informative insights into model performance.
Many visualization tools have been developed recently, e.g., ConvNetJS222https://github.com/karpathy/convnetjs, TensorFlow Playground333https://playground.tensorflow.org/, that focus on structural interpretability (Kulesza et al., 2013; Hoffman et al., 2018) and operate in the neuron activation space to explain models’ internal decision making processes (Kahng et al., 2017) or focus on visualizing a model’s decision boundary to increase user trust (Ribeiro et al., 2016). Instead, CrossCheck targets functional interpretability and operates in the model output space to diagnose and contrast model performance.
Similar work to CrossCheck includes AllenNLP Interpret (Wallace et al., 2019) and Errudite Wu et al. (2019). AllenNLP Interpret relies on saliency map visualizations to uncover model biases, find decision rules, and diagnose model errors. Errudite implements a domain specific language for counterfactual explanations. Errudite and AllenNLP Interpret focus primarily on error analysis for a single model, while our tool is specifically designed for contrastive evaluation across multiple models e.g., neural architectures with different parameters, datasets, languages, domains, etc.
Manifold (Zhang et al., 2018) supports cross-model evaluation, however the tool is narrowly focused on model confidence and errors via pairwise model comparison with scatter plots. CrossCheck enables users to investigate “where” and “what” types of errors the model makes and, most importantly, assists the user with answering the question “why” the model makes that error by relying on a set of derived attributes from the input like inter-annotator agreement, question type, length of the answer, the input paragraph, etc.
Before implementing CrossCheck our error analysis process was manual, time-consuming, ad hoc, and difficult to reproduce. Thus, we endeavored to build a tool to make our process faster and more principled, but based on the successful error analysis techniques we had practiced. CrossCheck helps to calibrate users’ trust by enabling users to:
-
•
choose between multiple models,
-
•
see when the model is right (or wrong) and further examine those examples,
-
•
investigate whether the model makes the same mistakes as humans,
-
•
highlight model limitations, and
-
•
understand how models generalize across domains, languages and datasets.
2 CrossCheck
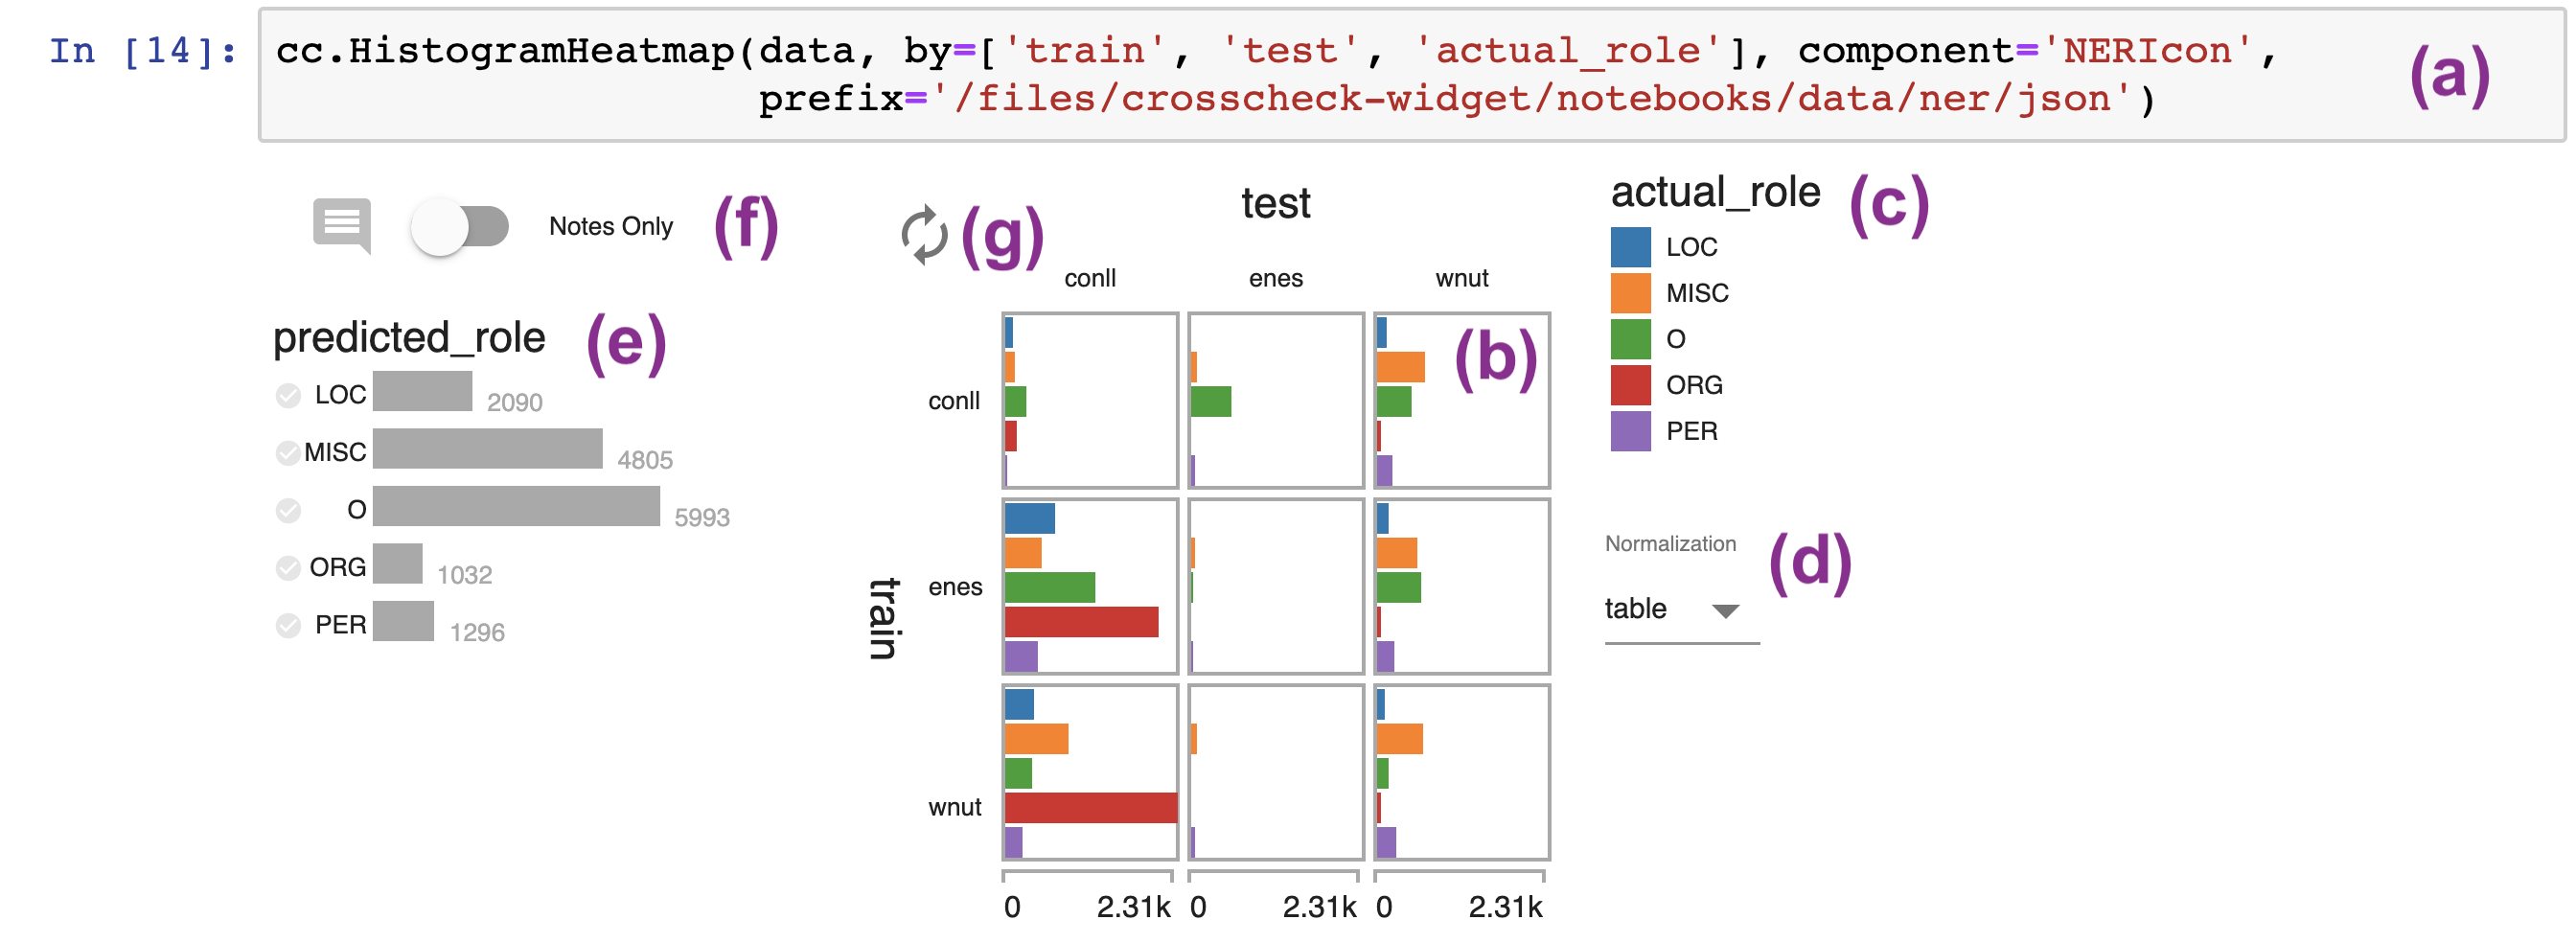
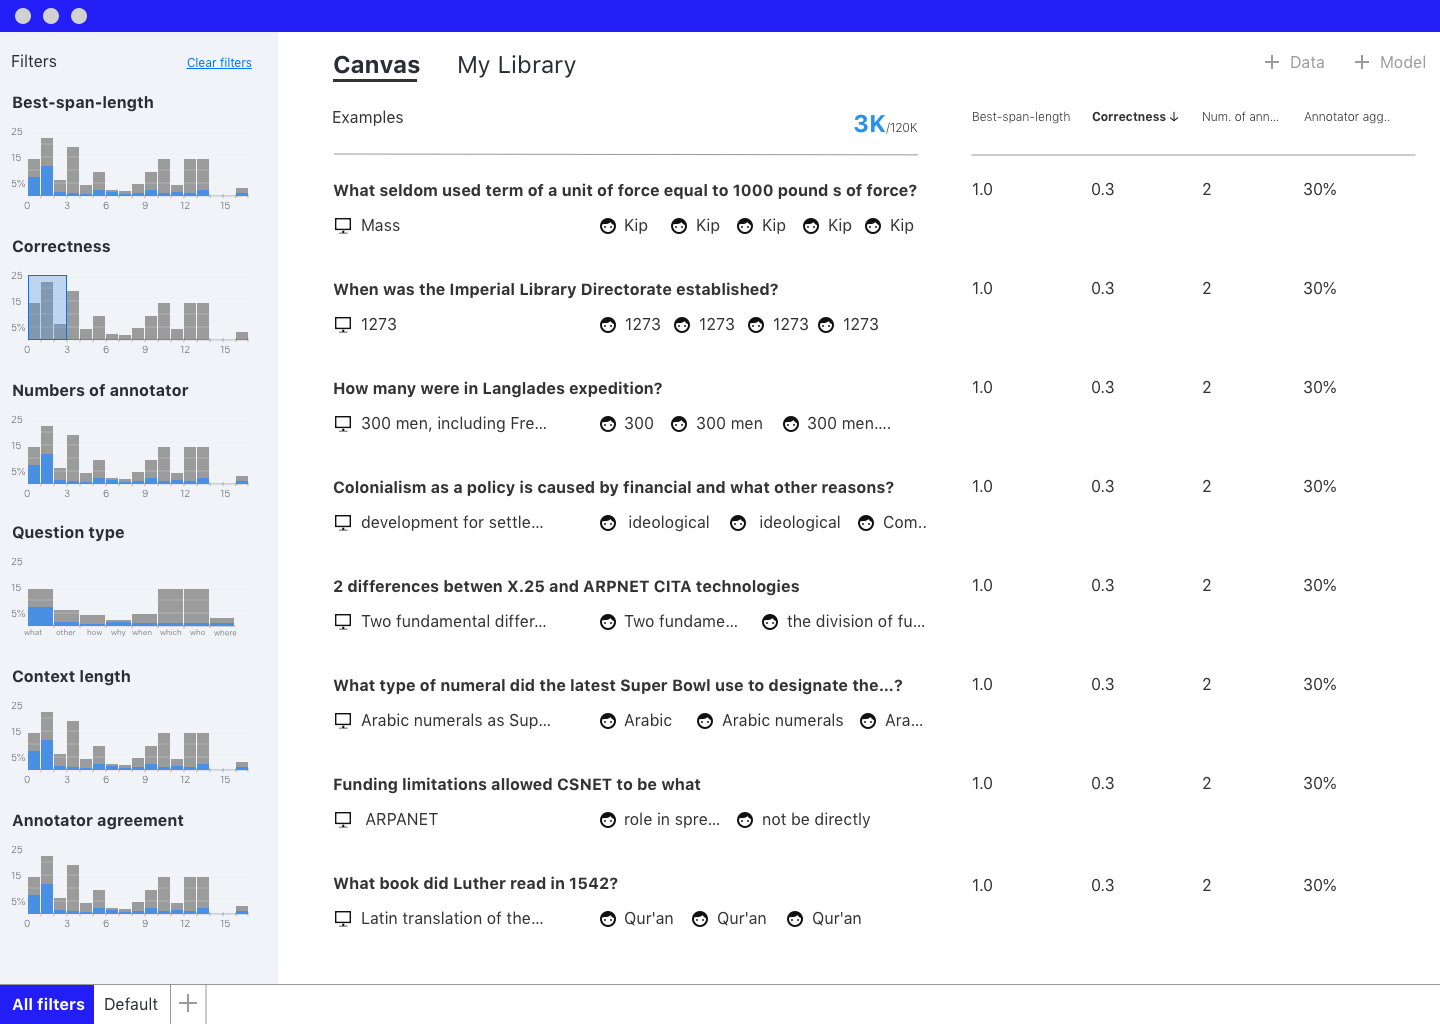
CrossCheck’s input is a single mixed-type table, i.e. a pandas DataFrame444http://pandas.pydata.org. It is embedded in a Jupyter555https://jupyter.org notebook to allow for tight integration with data scientists’ workflows (see Figure 1a). Below we outline the features of CrossCheck in detail.
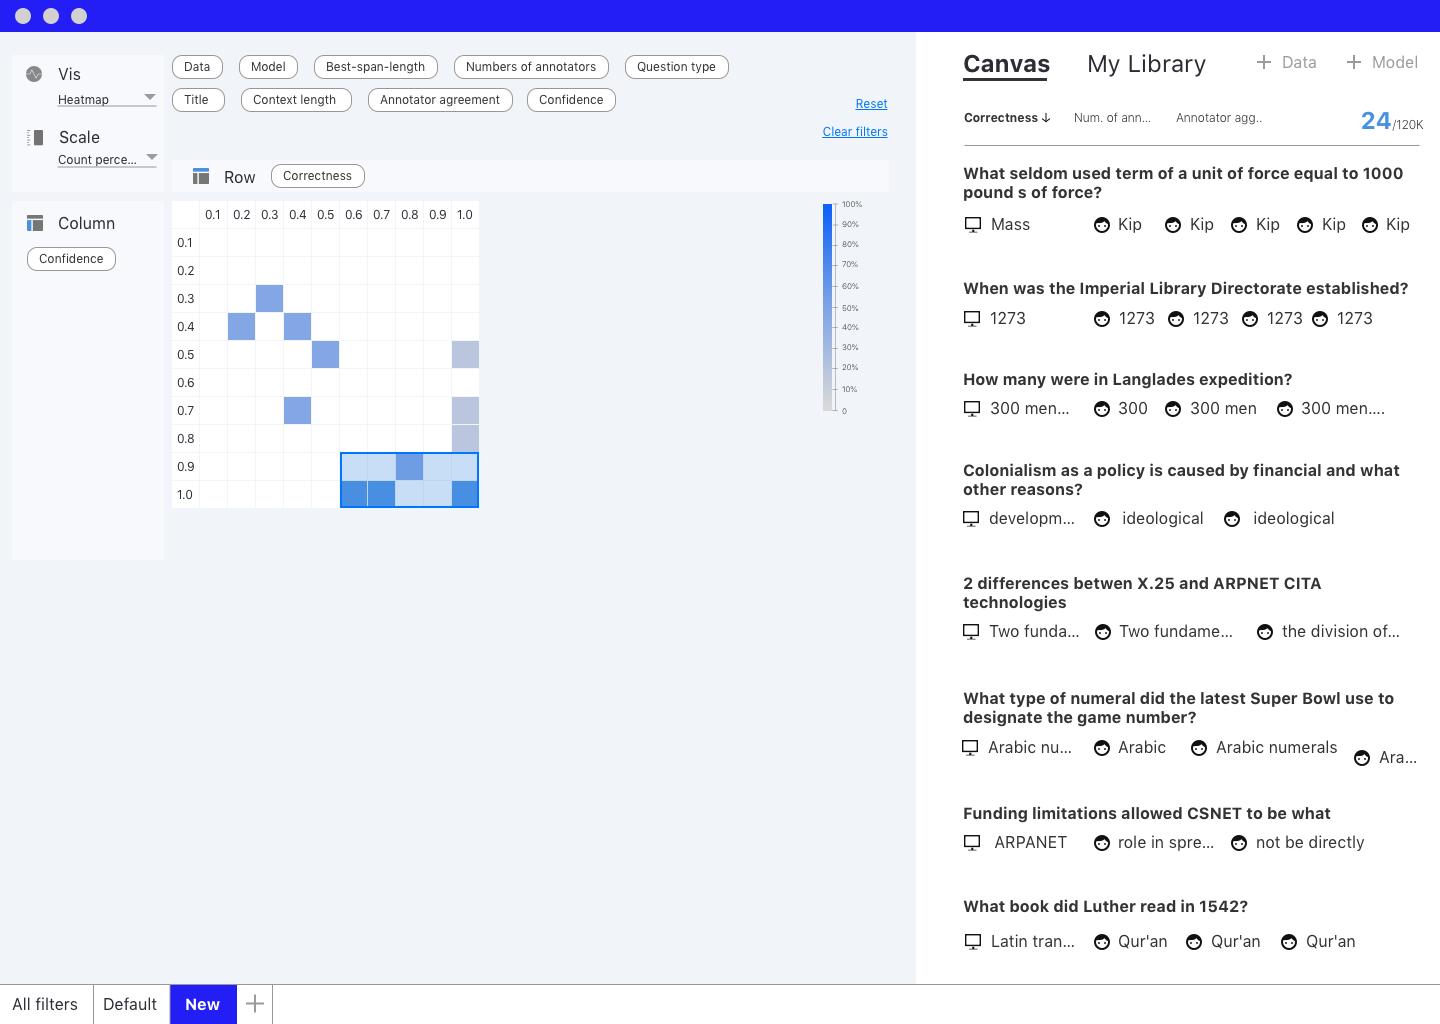
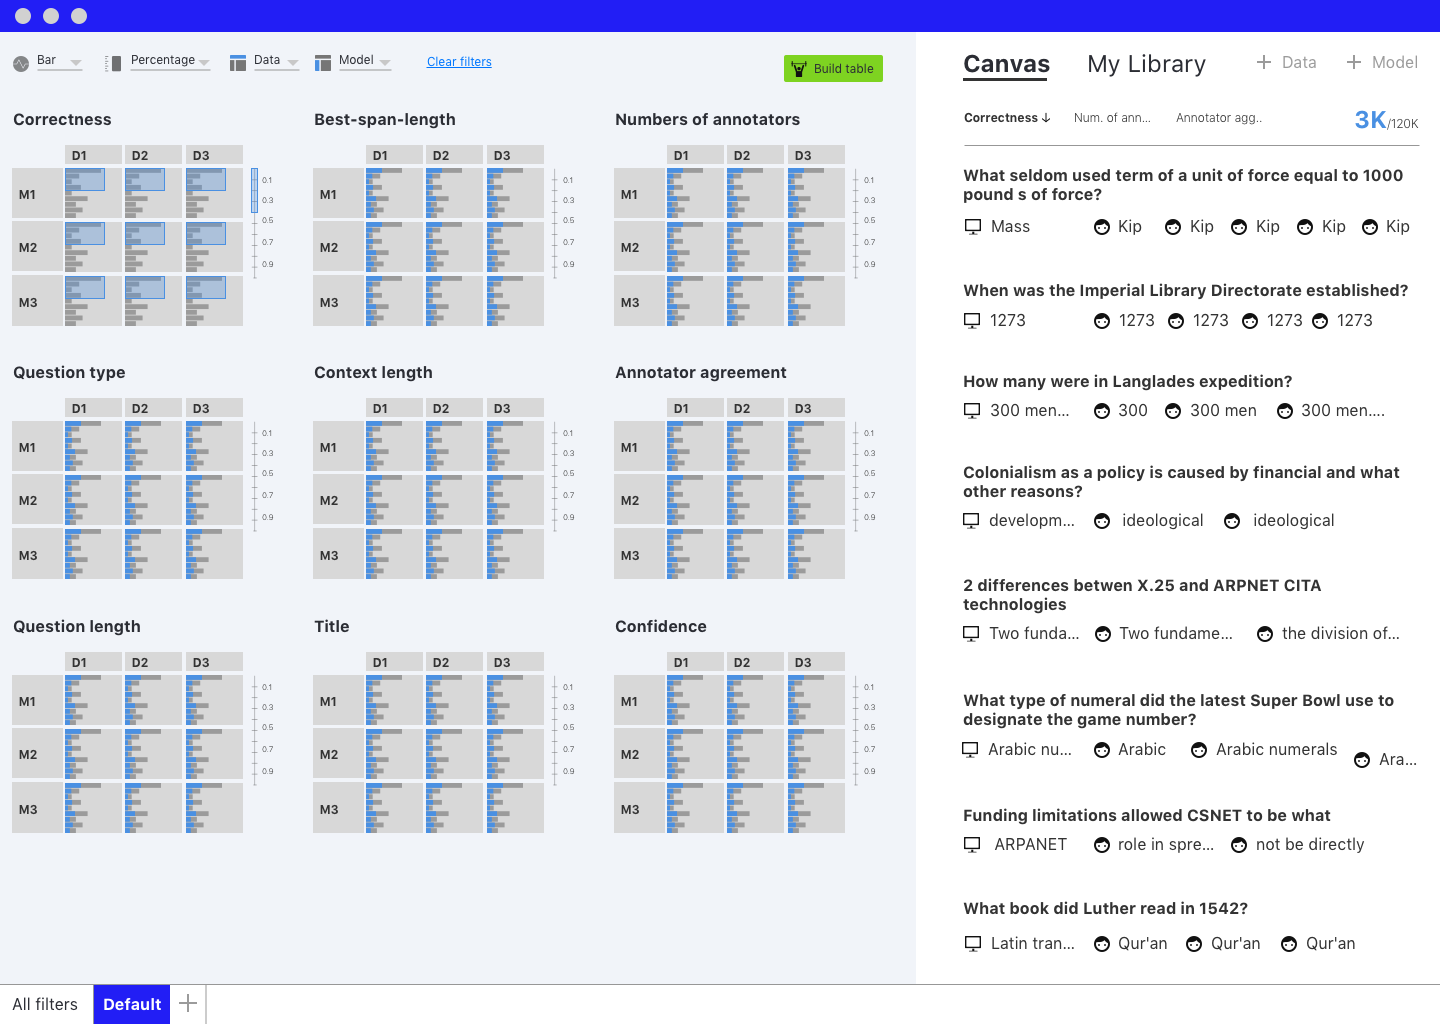
CrossCheck’s main view (see Figure 1b) extends the confusion matrix visualization technique by replacing each cell in the matrix with a histogram — we call this view the histogram heatmap. Each cell shows the distribution of a third variable conditioned on the values of the corresponding row and column variables. Every bar represents a subset of instances, i.e., rows in the input table, and encodes the relative size of that group. This view also contains a legend showing the bins or categories for this third variable (see Figure 1c).
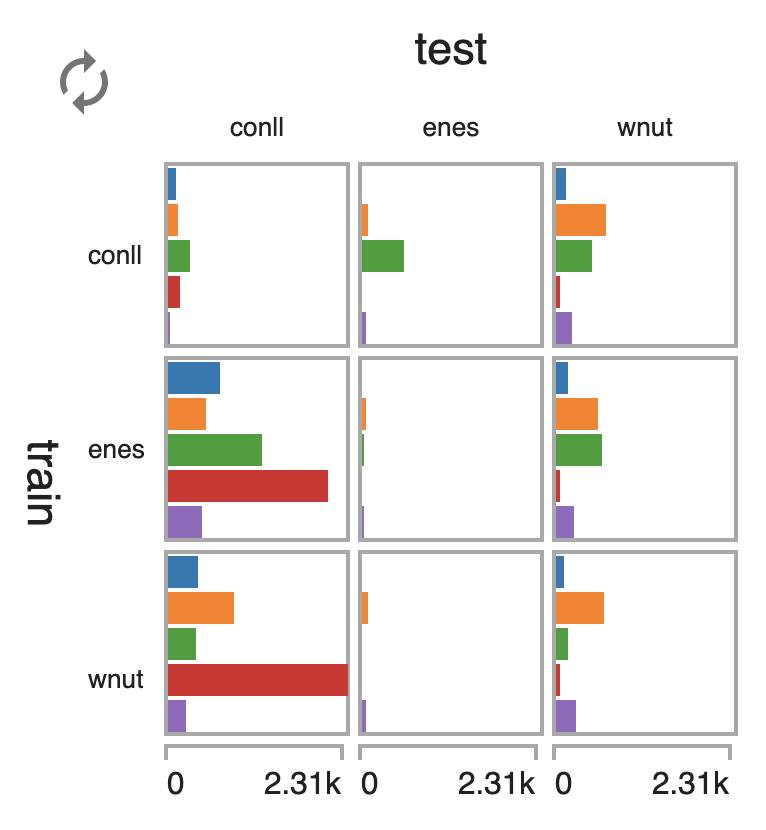
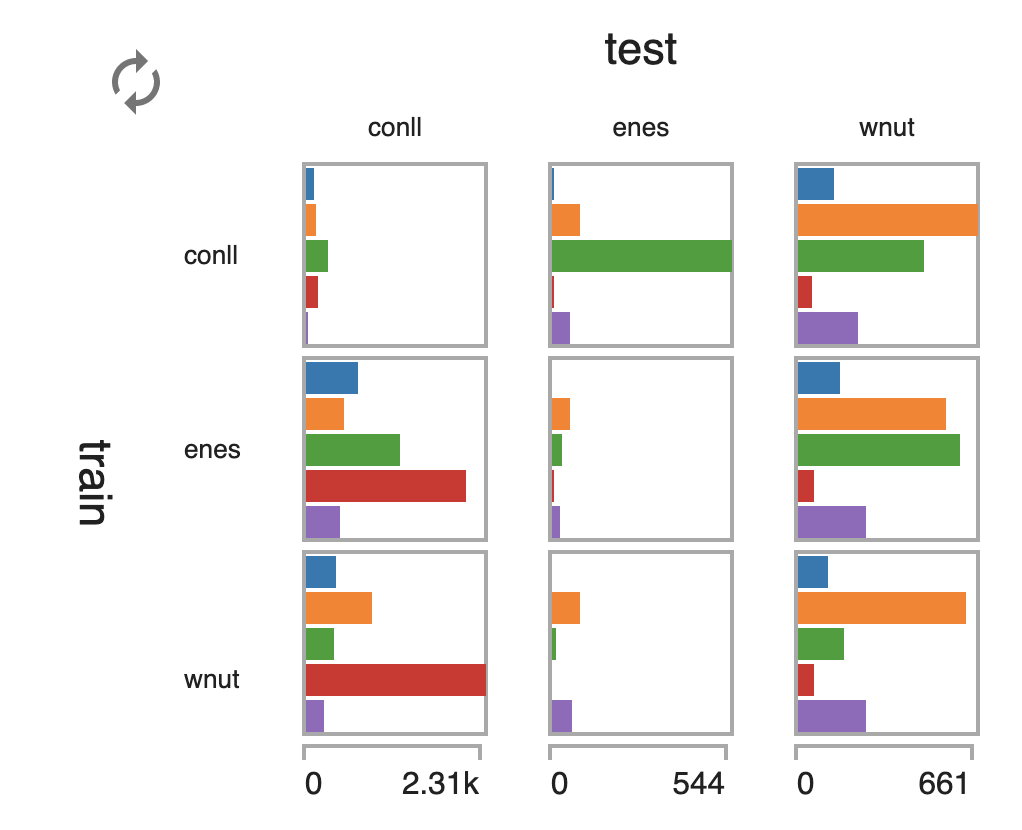
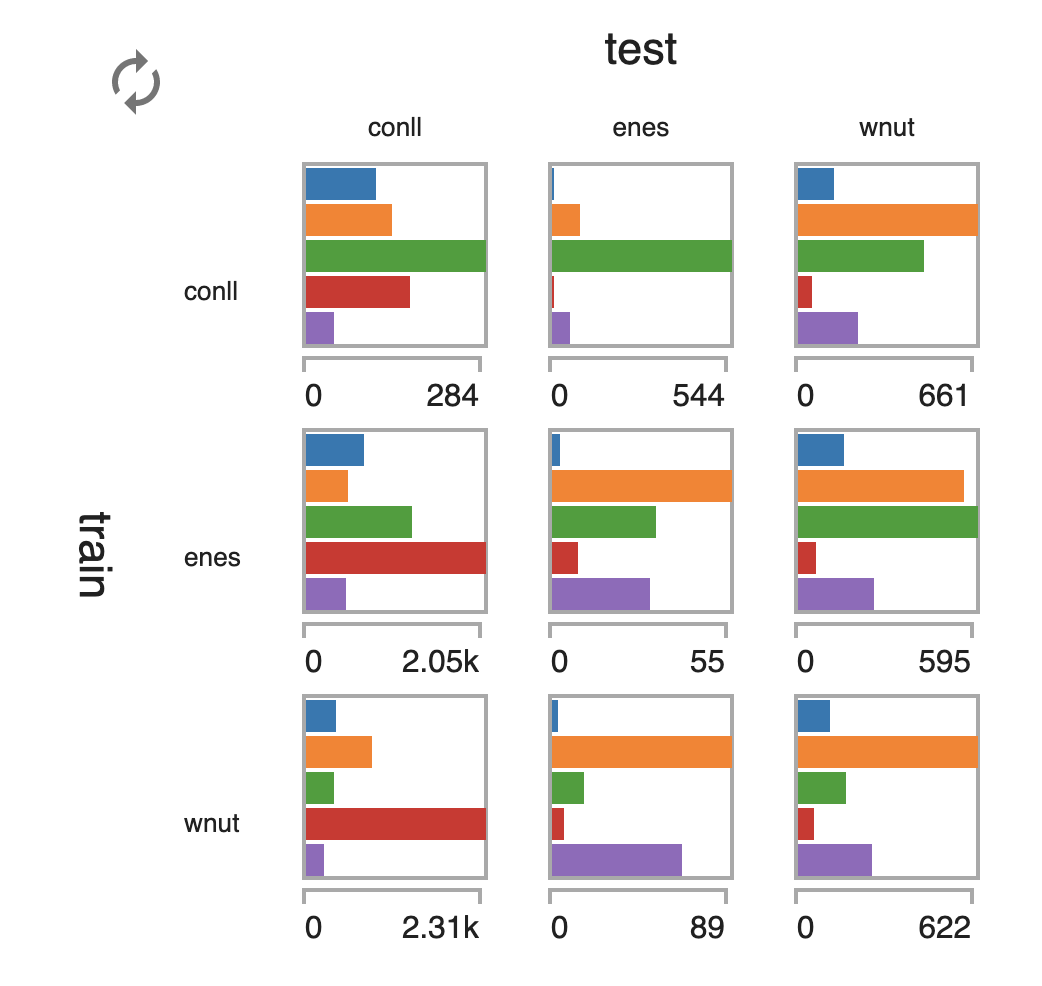
The histograms in each cell in CrossCheck are drawn horizontally to encourage comparison across cells in the vertical direction. CrossCheck supports three normalization schemes (see Figure 1d), i.e., setting the maximum x-value in each cell: normalizing by the maximum count within the entire matrix, within each column, or within each cell. To emphasize the current normalization scheme, we also selectively show certain axes and adjust the padding between cells. Figure 2 illustrates how these different normalization options appear in CrossCheck. By design, there is no equivalent row normalization option, but the matrix can be transposed (see Figure 1g) to swap the rows and columns for an equivalent effect.
Any variables not directly compared in the histogram heatmap are visualized on the left side of the widget as histograms (see Figure 1e). These histograms also allow the user to filter data when it is rendered in the main view by clicking on the bar(s) corresponding to the data they want to keep.
We also allow users to take notes on instances to support their evaluation workflow. Clicking the switch labeled “Notes Only” (see Figure 1f) filters out all instances that are not annotated in the main view, showing the user what has been annotated in the context of the current variable groupings.
3 Use Cases and Evaluation
In this section, we highlight how CrossCheck can be used in core NLP tasks such as named entity recognition (NER) and reading comprehension (RC) or practical applications of NLP such as clickbait detection (CB). We present an overview of the datasets used for each task below:
-
•
NER: CoNLL Sang (2003), ENES Aguilar et al. (2018), WNUT 17 Emerging Entities Derczynski et al. (2017)666github.com/leondz/emerging_entities_17,
-
•
MC: Stanford Question Answering Dataset (SQuAD) Rajpurkar et al. (2016)777 rajpurkar.github.io/SQuAD-explorer/,
-
•
CB: Clickbait Challenge 2017 Potthast et al. (2018)888 www.clickbait-challenge.org/#data.
3.1 Named Entity Recognition (NER)
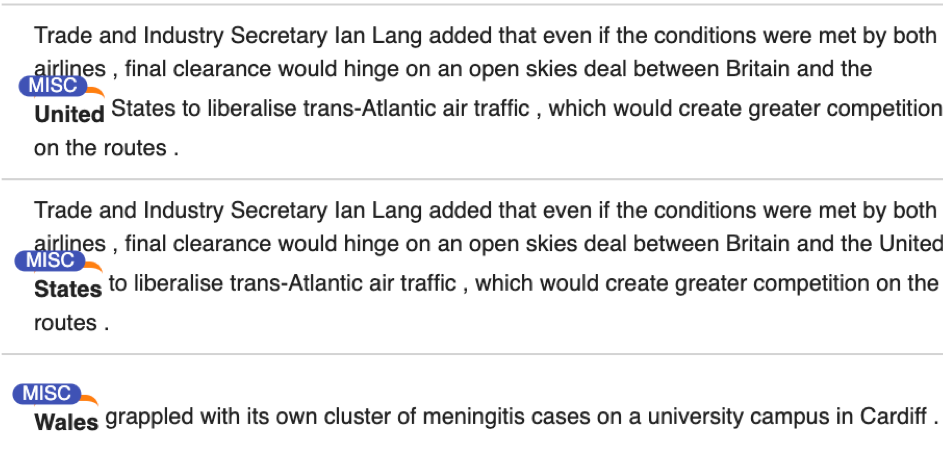
To showcase CrossCheck, we trained and evaluated the AllenNLP NER model Peters et al. (2017) across three benchmark datasets – CoNLL, WNUT, and ENES, producing nine different evaluations. The model output includes, on a per-token level, the model prediction, the ground truth, the original sentence (for context), and what the training and testing datasets were as shown in Figure 3a.
This experiment was designed to let us understand how models trained on different datasets generalize to the same test data (shown in columns), how models trained on the same training data transfer to predict across different test datasets (shown in rows). Figure 2 illustrates the CrossCheck grid of train versus test datasets. The data has been filtered so that only errors contribute to the bars so we can see a distribution of errors per train-test combination across the actual role. Since the CoNLL dataset is much larger, we can allow normalization within columns in Figure 2b to look for patterns within those sub-groups.
For the same experimental setup, Table 1 summarizes performance with F1-scores. Unlike the F1-score table, CrossCheck reveals that models trained on social media data misclassify ORG on the news data, and the news models overpredict named entities on social media data.
| Train Test | CoNLL | WNUT | ENES |
|---|---|---|---|
| CoNLL | 92.51 | 40.10 | 11.88 |
| WNUT | 55.75 | 44.73 | 33.33 |
| ENES | 50.78 | 57.48 | 64.00 |
3.2 Reading Comprehension (RC)
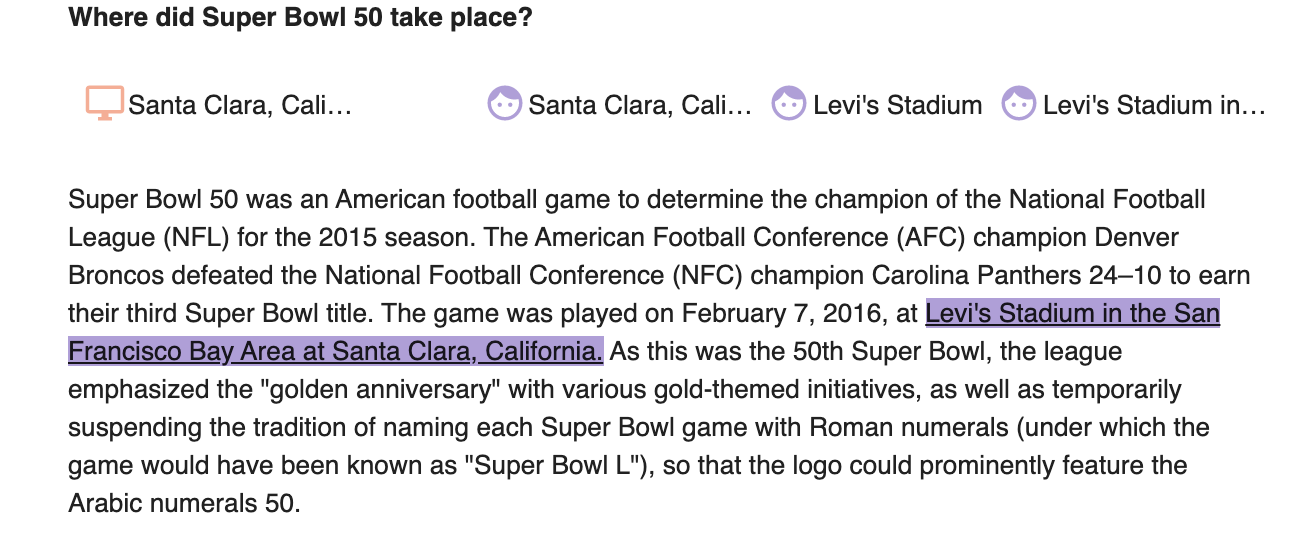
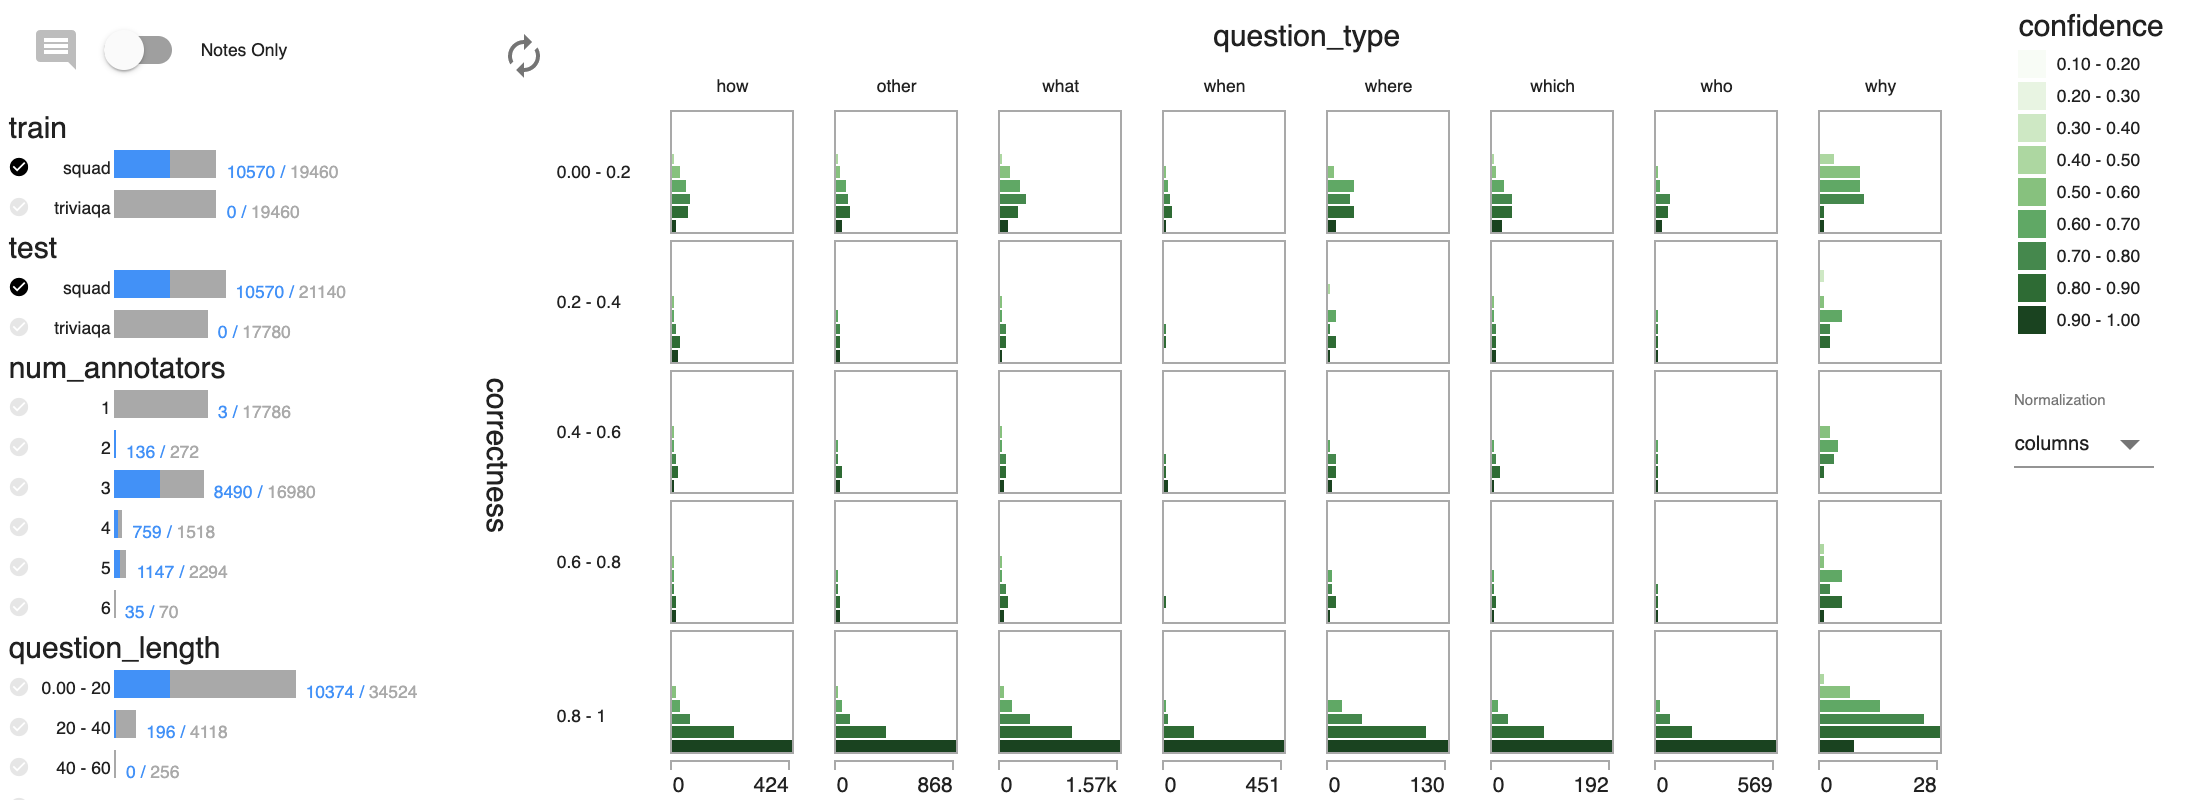
Similar to NER, we trained an AllenNLP model for reading comprehension Seo et al. (2016) that is designed to find the most relevant span for a question and paragraph input pair. The model output includes, on a question-paragraph level: the model prediction span, ground truth span, model confidence, question type and length, the number of annotators per question, and what the train and test datasets were, as shown in Figure 3b.999We evaluated RC on SQuAD and TriviaQA datasets, but with space limitations only present results for SQuAD. Figure 4 presents the CrossCheck view of the model’s correctness and confidence across question types. We can see that across all types of questions when the model is correct it has higher confidence (bottom row), and lower confidence when incorrect (top row). In addition, we see model behavior has higher variability when predicting “why” questions compared to other types.
3.3 Clickbait Detection
Finally, we demonstrate CrossCheck for comparison of regression models. We use a relevant application of NLP in the domain of deception detection (clickbait detection) that was the focus of the Clickbait Challenge 2017, a shared task focused on identifying a score (from 0 to 1) of how “clickbait-y” a social media post (i.e., tweet on Twitter) is, given the content of the post (text and images) and the linked article webpages. We use the validation dataset that contains 19,538 posts (4,761 identified as clickbait) and pre-trained models released on GitHub after the challenge by two teams (blobfish and striped-bass)101010Models and code available via github.com/clickbait-challenge/ repositories..
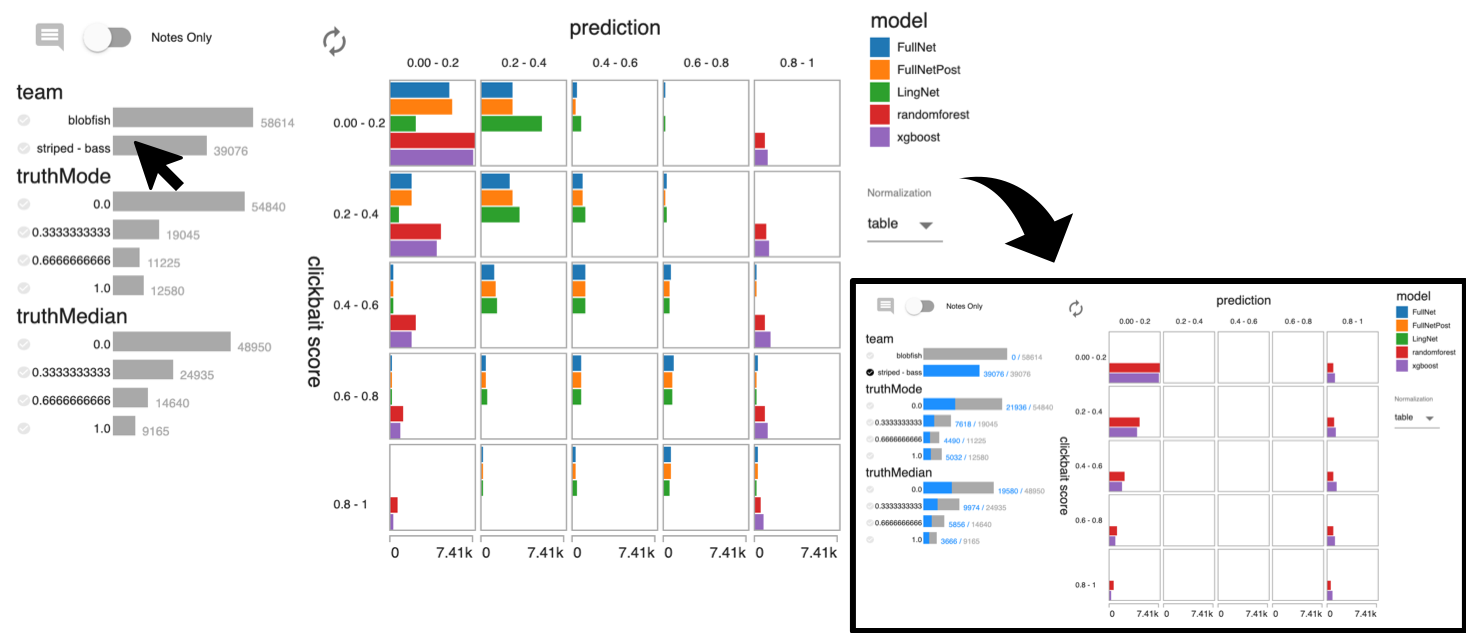
In Figure 5 we illustrate how CrossCheck can be used to compare across multiple models and across multiple classes of models.111111Note, models could also be grouped by any number of shared characteristics such as the algorithms or architectures used (e.g., different neural architectures used in deep learning models, or models that use deep learning versus those that do not), hyper-parameter settings, granularity of prediction outputs, ensembles versus single models, etc. When filtered to show only the striped-bass models (shown at right), a strategy to predict coarse (0 or 1) clickbait scores versus fine-grained clickbait scores is clearly evident in the striped-bass model predictions. Here, there is a complete lack of predictions falling within the center three columns so even with no filters selected (shown at left), CrossCheck provides indications that there may be this disparity in outcomes between models (an explanation for the disparity in F1-scores in Table 2. In cases where there is a more nuanced or subtle disparity, shallow exploration with different filters within CrossCheck can lead to efficient, effective identification of these key differences in model behavior.
| Team | Model | MSE | MAE |
|---|---|---|---|
| blobfish | FullNetPost | 0.026 | 0.126 |
| FullNet | 0.027 | 0.130 | |
| LingNet | 0.038 | 0.157 | |
| striped-bass | xgboost | 0.171 | 0.326 |
| randomforest | 0.180 | 0.336 |
4 Design and Implementation
We designed CrossCheck following a user-centered design methodology. This is a continuous, iterative process where we identify needs and goals, implement prototypes, and solicit feedback from our users to incorporate in the tool. Our users were data scientists, specifically NLP researchers and practitioners, tasked with the aforementioned model evaluation challenge. We identified CrossCheck’s goals as allowing the user to: understand how instance attributes relate to model errors; provide convenient access to raw instance data; integrate into a data scientists workflow; and reveal and understand disagreement across models, and support core NLP tasks and applications.
4.1 Design Iterations
Round 1—Heatmaps (functional prototype)
Our first iteration extended the confusion matrix visualization technique with a functional prototype that grouped the data by one variable, and showed a separate heatmap for each distinct value in that group. User feedback: though heatmaps are familiar, the grouping made the visualization misleading and difficult to learn.
Round 2—Table & Heatmap (wireframes)
We wireframed a standalone tool with histogram filters, a sortable table, and a more traditional heatmap visualization with a rectangular brush to reveal raw instance data. User feedback: the sortable table and brushing would be useful, but the heatmap has essentially the same limitations as confusion matrices.
Round 3—Histogram Heatmap (wireframes)
We wireframed a modified heatmap where each cell was replaced with a histogram showing the distribution of a third variable conditioned on the row and column variables. This modified heatmap was repeated for each variable in the dataset except for the row and column variables. User feedback: Putting the histogram inside the heatmap seems useful, but multiple copies would be overwhelming and too small to read. We would prefer to work with just one histogram heatmap.
Round 4—CrossCheck (functional prototype)
We implemented a single “histogram heatmap” inside a Jupyter widget, and made raw instance data available to explore by clicking on any bar. Additionally we incorporated histogram filters from the Round 2 design and allowed the user to change the histogram normalization. User feedback: the tool was very useful, but could use minor improvements e.g., labeled axes and filtering, as well as ability to add annotation on raw data.
Round 5—CrossCheck (polished prototype)
We added minor features like a legend, a matrix transpose button, axis labels, dynamic padding between rows and columns (based on normalization), and the ability to annotate instances with notes. User feedback: the tool works very well, but screenshots aren’t suitable to use in publications.
4.2 Implementation Challenges
To overcome the rate limit between the python kernel and the web browser (see the NotebookApp.iopub_data_rate_limit Jupyter argument) our implementation separates raw instance data from tabular data to be visualized in CrossCheck’s histogram heatmap. The tool groups tabular data by each field in the table and passed as a list of each unique field/value combinations and the corresponding instances within that bin. This is computed efficiently within the python kernel (via a pandas groupby). This pre-grouping reduces the size of the payload passed from the python kernel to the web browser and allows for the widget to behave more responsively because visualization and filtering routines do not need to iterate over every instance in the dataset. The tool stores raw instance data as individual JSON files on disk in a path visible to the Jupyter notebook environment. When the user clicks to reveal raw instance data, this data is retrieved asynchronously using the web browser’s XMLHttpRequest (XHR). This allows the web browser to only retrieve and render the few detailed instances the user is viewing at a time.
5 Discussion
CrossCheck is designed to quickly and easily explore a myriad of combinations of characteristics of both models (e.g., parameter settings, network architectures) and datasets used for training or evaluation. It also provides users the ability to efficiently compare and explore model behavior in specific situations and generalizability of models across datasets or domains. Most importantly, CrossCheck can easily generalize to evaluate models on unlabeled data based on model agreement.
With its simple and convenient integration into data scientists’ workflows, CrossCheck enables users to perform extensive error analysis in an efficient and reproducible manner. The tool can be used to evaluate across models trained on image, video, tabular data, or combinations of data types with interactive exploration of specific instances (e.g., those responsible for different types of model errors) on demand.
Limitations
While pairwise model comparison with CrossCheck is straightforward by assigning each model to a row and column in the histogram heatmap, comparing more than two models requires concessions. Effective approaches we have taken for -way comparisons include computing an agreement score across the models per instance or using a long instead of wide table format (as was used in Figure 5) that is less efficient.
Our users also had difficulty directly incorporating findings in CrossCheck into scientific publications, due to a tradeoff between effective exploration versus communication. In this case the major concerns were that text and axes that were designed for quick, at-a-glance consumption were not appropriate after screen capturing and insertion into documents for publication.
Future Work
Another challenge with the tool is that adding visualizations for new use cases requires custom JavaScript code to be written, requiring end-users to work with a development version of the tool. Future work may include writing a generic set of components that cover the basics for most potential NLP use cases, or otherwise allow the tool to be extended with custom JavaScript source without re-compiling the packages.
6 Conclusions
We have presented CrossCheck 121212https://github.com/pnnl/crosscheck, a new interactive visualization tool that enables rapid, interpretable model evaluation and error analysis. There are several key benefits to performing evaluation and analyses using our tool, especially compared to i.e., adhoc or manual approaches because CrossCheck:
-
•
is generalizable across text, images, video, tabular, or combinations of multiple data types,
-
•
can be integrated directly into existing workflows for rapid and highly reproducible error analysis during and after model development,
-
•
users can interactively explore errors conditioning on different model/data features, and
-
•
users can view specific instances of inputs that cause model errors or other interesting behavior within the tool itself.
Acknowledgments
The project depicted was sponsored by the Department of the Defense, Defense Threat Reduction Agency. The content of the information does not necessarily reflect the position or the policy of the Federal Government, and no official endorsement should be inferred. Subsequent evaluation of the tool described in this paper was conducted under the Laboratory Directed Research and Development Program at Pacific Northwest National Laboratory, a multiprogram national laboratory operated by Battelle for the U.S. Department of Energy.
References
- Agarwal et al. (2014) Apoorv Agarwal, Ankit Agarwal, and Deepak Mittal. 2014. An error analysis tool for natural language processing and applied machine learning. In Proceedings of COLING 2014, the 25th International Conference on Computational Linguistics: System Demonstrations, pages 1–5.
- Aguilar et al. (2018) Gustavo Aguilar, Fahad AlGhamdi, Victor Soto, Mona Diab, Julia Hirschberg, and Thamar Solorio. 2018. Named entity recognition on code-switched data: Overview of the calcs 2018 shared task. In Proceedings of the Third Workshop on Computational Approaches to Linguistic Code-Switching, pages 138–147.
- Derczynski et al. (2017) Leon Derczynski, Eric Nichols, Marieke van Erp, and Nut Limsopatham. 2017. Results of the wnut2017 shared task on novel and emerging entity recognition. In Proceedings of the 3rd Workshop on Noisy User-generated Text, pages 140–147.
- Doshi-Velez and Kim (2017) Finale Doshi-Velez and Been Kim. 2017. Towards a rigorous science of interpretable machine learning. arXiv preprint arXiv:1702.08608.
- Hoffman et al. (2018) Robert Hoffman, Tim Miller, Shane T Mueller, Gary Klein, and William J Clancey. 2018. Explaining explanation, part 4: a deep dive on deep nets. IEEE Intelligent Systems, 33(3):87–95.
- Hohman et al. (2019) Fred Hohman, Andrew Head, Rich Caruana, Robert DeLine, and Steven M Drucker. 2019. Gamut: A design probe to understand how data scientists understand machine learning models. In Proceedings of the 2019 CHI Conference on Human Factors in Computing Systems, page 579. ACM.
- Kahng et al. (2017) Minsuk Kahng, Pierre Y Andrews, Aditya Kalro, and Duen Horng Polo Chau. 2017. ActiVis: Visual exploration of industry-scale deep neural network models. IEEE Transactions on Visualization and Computer Graphics, 24(1):88–97.
- Kahng et al. (2016) Minsuk Kahng, Dezhi Fang, and Duen Horng Polo Chau. 2016. Visual exploration of machine learning results using data cube analysis. In Proceedings of the Workshop on Human-In-the-Loop Data Analytics, page 1. ACM.
- Kulesza et al. (2013) Todd Kulesza, Simone Stumpf, Margaret Burnett, Sherry Yang, Irwin Kwan, and Weng-Keen Wong. 2013. Too much, too little, or just right? ways explanations impact end users’ mental models. In 2013 IEEE Symposium on Visual Languages and Human Centric Computing, pages 3–10. IEEE.
- Lee et al. (2019) Gyeongbok Lee, Sungdong Kim, and Seung-won Hwang. 2019. Qadiver: Interactive framework for diagnosing qa models. In Proceedings of the AAAI Conference on Artificial Intelligence, volume 33, pages 9861–9862.
- Lipton (2016) Zachary C Lipton. 2016. The mythos of model interpretability. arXiv preprint arXiv:1606.03490.
- Peters et al. (2017) Matthew E Peters, Waleed Ammar, Chandra Bhagavatula, and Russell Power. 2017. Semi-supervised sequence tagging with bidirectional language models. arXiv preprint arXiv:1705.00108.
- Potthast et al. (2018) Martin Potthast, Tim Gollub, Kristof Komlossy, Sebastian Schuster, Matti Wiegmann, Erika Patricia Garces Fernandez, Matthias Hagen, and Benno Stein. 2018. Crowdsourcing a large corpus of clickbait on twitter. In Proceedings of the 27th International Conference on Computational Linguistics, pages 1498–1507.
- Poursabzi-Sangdeh et al. (2018) Forough Poursabzi-Sangdeh, Daniel G Goldstein, Jake M Hofman, Jennifer Wortman Vaughan, and Hanna Wallach. 2018. Manipulating and measuring model interpretability. arXiv preprint arXiv:1802.07810.
- Rajpurkar et al. (2016) Pranav Rajpurkar, Jian Zhang, Konstantin Lopyrev, and Percy Liang. 2016. Squad: 100,000+ questions for machine comprehension of text. arXiv preprint arXiv:1606.05250.
- Ribeiro et al. (2016) Marco Tulio Ribeiro, Sameer Singh, and Carlos Guestrin. 2016. Why should i trust you?: Explaining the predictions of any classifier. In Proceedings of the 22nd ACM SIGKDD international conference on knowledge discovery and data mining, pages 1135–1144. ACM.
- Sang (2003) Tjong Kim Sang. 2003. De meulder, 2003. tjong kim sang, ef, & de meulder, f.(2003). introduction to the conll-2003 shared task: language-independent named entity recognition. In Proceedings of the Conference on Computational Natural Language Learning. Edmonton, Canada, pages 142–147.
- Seo et al. (2016) Minjoon Seo, Aniruddha Kembhavi, Ali Farhadi, and Hannaneh Hajishirzi. 2016. Bidirectional attention flow for machine comprehension. arXiv preprint arXiv:1611.01603.
- Wallace et al. (2019) Eric Wallace, Jens Tuyls, Junlin Wang, Sanjay Subramanian, Matt Gardner, and Sameer Singh. 2019. Allennlp interpret: A framework for explaining predictions of nlp models. arXiv preprint arXiv:1909.09251.
- Wu et al. (2019) Tongshuang Wu, Marco Tulio Ribeiro, Jeffrey Heer, and Daniel S Weld. 2019. Errudite: Scalable, reproducible, and testable error analysis. In Proceedings of the 57th Annual Meeting of the Association for Computational Linguistics, pages 747–763.
- Zhang et al. (2018) Jiawei Zhang, Yang Wang, Piero Molino, Lezhi Li, and David S Ebert. 2018. Manifold: A model-agnostic framework for interpretation and diagnosis of machine learning models. IEEE Transactions on Visualization and Computer Graphics, 25(1):364–373.
Appendix A Appendices
A.1 Preliminary Designs
Figures 6 and 7 supplement the design rounds discussed in Section 4. We produced these wireframes to elicit feedback from our users without implementing a full prototype.
A.2 JavaScript and Python Packaging
Determining an appropriate project structure was nontrivial. We packaged CrossCheck as two separate but interdependent modules. The visualization (JavaScript) portion of the code is a standalone React131313https://reactjs.org component packaged via NWB141414https://github.com/insin/nwb. This retains the possibility of re-using the front-end of our tool in another web-based application with minimal re-engineering.
The second half of CrossCheck is a python module that interfaces with the Jupyter notebook environment. We started with widget-cookiecutter151515https://github.com/jupyter-widgets/widget-cookiecutter to follow best practices for Jupyter widget development, then augmented this code to support React components. This module also performs the data prepossessing (see Section 4.2 below) before transmitting the data from the python kernel to the web browser. During the build process, the “transpiled” JavaScript code is copied into the python module, allowing the python module to be distributed and installed independently.