Centrifugally Driven Mass Loss and Outbursts of Massive Stars
Abstract
Rotation and mass loss are crucially interlinked properties of massive stars, strongly affecting their evolution and ultimate fate. Massive stars rotating near their breakup limit shed mass centrifugally, creating Be stars with circumstellar disks and possibly driving outbursts. Using the MESA stellar evolution code, we examine the effects of efficient angular momentum transport on the main sequence and post-main sequence rotational evolution of massive stars. In rapid rotators, angular momentum transported from the contracting core to the expanding envelope can spin up the surface layers past the breakup rate, particularly for stars near (or beyond) the end of the main sequence and in low-metallicity environments. We also demonstrate that centrifugal instabilities could arise in rapidly rotating massive stars, potentially triggering the S Doradus outbursts observed in luminous blue variable stars. Prior mass accretion from a binary companion increases both the likelihood and the intensity of centrifugal mass loss. We discuss implications for massive stellar evolution, Be stars, and luminous blue variables.
keywords:
stars: rotation – stars: mass-loss – stars: massive – stars: evolution1 Introduction
Massive stars lose a significant fraction of their mass over the course of their lives. For single star models, most of this mass loss arises from line-driven winds propelled by photons scattering off absorption lines of iron-group elements (e.g., Castor et al. 1975; Vink & Gräfener 2012; Owocki 2014). However, some massive stars also lose mass through outbursts such as eruptions from luminous blue variable (LBV) stars (e.g., Humphreys & Davidson 1994; Smith 2017). While the physics of line-driven mass loss is largely understood, the mechanisms driving the sporadic outbursts of stars like LBVs are not (see Smith 2014 and Owocki 2015 for reviews).
Rotation is a crucial ingredient in the evolution of massive stars, greatly affecting the appearance, evolution, and mass loss rates (see Maeder & Meynet 2000a, 2012 for reviews). For instance, Be stars rotate near their breakup velocity and are surrounded by a disk of centrifugally expelled matter (see review in Rivinius et al. 2013). In stars near the Eddington limit, the breakup velocity is reduced by radiation force, such that that even modest rotation could potentially significantly increase mass loss rates (Friend & Abbott, 1986; Langer et al., 1999; Maeder & Meynet, 2000b; Dwarkadas & Owocki, 2002; Aerts et al., 2004; Gagnier et al., 2019). Rotational effects are especially important in low-metallicity stars with weak line-driven winds where AM loss through winds is less important (Hirschi & et al., 2006; Georgy et al., 2013). However, many existing studies focus on main-sequence (MS) evolution, and do not incorporate realistic angular momentum (AM) transport in stellar models.
A well-known yet underappreciated aspect of massive stars is that their maximum AM content (assuming rigid rotation) decreases strongly as they evolve off the MS. The reason is that massive stars have very large cores and very tenuous envelopes compared to lower mass stars. As massive stars evolve off the MS, the contraction of the core can outweigh the expansion of the envelope, such that the radius of gyration (defined as , where is the moment of inertia) can decrease by multiple orders of magnitude ( ure 1). The maximum AM content also decreases, such that a star rotating under breakup on the MS may find itself rotating faster than breakup as it evolves off the MS.
This concept of centrifugally driven mass loss has been explored (Langer, 1998; Maeder & Meynet, 2001; Ekström et al., 2008) but has not received a great deal of attention, perhaps because its operation depends on the AM transport between the core and the envelope. Without AM transport, the envelope will simply expand and spin down, but it can be forced to rotate faster than breakup in the presence of efficient AM transport. Fortunately, asteroseismology of low-mass stars has clearly demonstrated that an efficient AM transport process is at work (e.g., Mosser et al. 2012; Deheuvels et al. 2014; Cantiello et al. 2014; Eggenberger et al. 2017; Van Reeth et al. 2018; Fuller et al. 2019), motivating new investigations into the rotational evolution of massive stars.
In this paper, we explore the consequences of centrifugally driven mass loss in stars evolving off the MS, employing AM transport that roughly matches observations of low-mass stars (Fuller et al. 2019, though see also Eggenberger et al. 2019). In many cases, ordinary stellar winds remove too much AM during the MS for centrifugally driven mass loss to occur. However, centrifugal mass loss can be very important for moderate-mass and low-metallicity stars with lower mass loss rates. It can also be crucial for stars that have been spun up via accreted mass and AM from a companion star. Furthermore, we begin a preliminary investigation of centrifugally driven instabilities that may drive mass loss through outbursts rather than gradual equatorial or wind mass loss. We discuss implications for stellar evolution, Be stars, and LBVs.
2 Rotationally Driven Mass Loss
2.1 Effects of Stellar Evolution
As stars evolve, their cores typically contract and decrease their moment of inertia, while their envelopes expand and increase their moment of inertia. In the presence of efficient angular momentum (AM) coupling, the surface rotation is then determined by the evolution of the star’s total moment of inertia via , where is the star’s AM. Simultaneously, the star’s centrifugal breakup rotation rate scales as and decreases rapidly as the star’s radius increases. Hence, if the star’s mass and AM are conserved, its surface rotation rate can eventually exceed the rotational breakup rate, and the star will be forced to centrifugally expel mass. In later sections, we will account for complications arising from non-rigid rotation, radiation pressure, and mass/AM loss via stellar winds.
Figure 1 illustrates the evolution of stellar properties that determine how their rotation rates change, for several massive star models. We see that stellar radii nearly always increase, while their temperatures decrease, as they evolve through the main sequence, and then across the Hertzsprung–Russell (HR) diagram as they expand into helium-burning red supergiants. The only exception is the small hook at core hydrogen exhaustion, typically at for these models. However, we see that the star’s moment of inertia does not always increase strongly, because the expansion of the surface layers is partially compensated by the contraction of the core. This is especially evident for the most massive stars, where the core has a much larger extent on the MS (in both mas and radius), and therefore has a larger influence on the rotational evolution. To demonstrate this, the third panel plots the radius of gyration , which decreases sharply as stars evolve off the MS and become increasingly centrally concentrated.

Consequently, the star’s spin rate , which is inversely proportional to for a rigidly rotating body, can decrease much slower than the break-up limit, such that stars reach break-up and lose mass. We can determine when this occurs by computing the star’s maximum AM content , shown in the bottom panel of Figure 1. The value of typically decreases by 1-2 orders of magnitude as massive stars cross the HR diagram, such that they can easily reach their breakup limit, , as they evolve off the MS, simply due to their structural evolution. Because of the large change in , this can naturally occur for stars rotating far below their breakup limits on the MS. Again, note that drops faster for more massive stars, suggesting that centrifugally driven mass loss could be more common and more intense for more massive stars.
The estimates above assume the star can maintain rigid rotation, which is likely not a good assumption for post-MS stars. In our computations below, in order to compute stars’ surface rotation rates, we use asteroseismically calibrated AM transport prescriptions that allow for differential rotation. These calculations thus allow for more realistic predictions of centrifugally driven mass loss rates.
2.2 Centrifugal Mass Loss Rate
At the surface of a rotating star, mass loss happens when the centrifugal acceleration and effective gravitational acceleration are balanced, which implies the surface rotation rate reaches the break-up limit . Due to the centrifugal acceleration, the star then ejects mass that carries away AM to keep the surface rotation rate at the break-up limit. To account for this effect, prior works (e.g., Langer 1998; Maeder & Meynet 2000a) typically increase the wind mass loss rate when approaches . However, the magnitude of this effect is not clear because it depends on the latitudinal surface temperature and wind driving, and some work (Owocki et al., 1998; Müller & Vink, 2014) suggests the wind mass loss rate may actually decrease. We instead choose to estimate the centrifugal mass loss rate purely from the rate at which AM is transported to the surface layers, causing them to be ejected. We note that similar procedures have been performed in Granada et al. (2013); Georgy et al. (2013).
Assuming that the star rotates rigidly with , the change in AM per unit time is
| (1) |
Note this relation holds as long as . On the other hand, mass loss carries away AM at a rate
| (2) |
where accounts for the specific AM of the mass that is lost, in units of . For equatorial mass loss, , while for spherically averaged mass loss. Setting equations 1 and 2 equal, we have the expression for mass loss rate:
| (3) |
In massive stars, (see Figure 1), so the first term in parentheses dominates, and
| (4) |
We only employ this mass loss in our models if approaches . While this estimate assumes rigid rotation, which is not strictly valid (especially during post-MS evolution), it has the advantage of being independent of the wind mass loss rate. Equation 3 may not be precise on a given time step, but it allows mass to be lost at a high rate if , and at a small rate otherwise. Hence, our method is reliable for computing the long-term average mass loss rate when the star evolves such that its surface rotation rate tracks the breakup rotation rate.
In principle, it is possible that the effective value of could be much larger than unity if a star’s AM is transported outward through a circumstellar disk with little corresponding mass loss. We cannot discount such a possibility, so our mass loss rates should perhaps be considered upper limits. However, the AM loss still depends on the production of a disk through centrifugal mass loss, so our predictions for when centrifugal mass loss occurs will not be strongly affected.
2.3 The Eddington Limit
In the discussion above, we neglected radiative effects, but the radiative force in fact can be large in a massive star, whose Eddington factor is defined as
| (5) |
where is the star’s luminosity and is the Rosseland mean opacity at the surface. Radiative forces balance the gravitational force when the Eddington factor approaches unity, i.e.:
| (6) |
It is therefore necessary to add a new criterion implementing radiative effects to the mass loss rate, especially when the star is close to the Eddington limit. We shall find below that the centrifugal mass loss timescale is much larger than the stellar expansion timescale, so that the change in with mass loss can be neglected when deriving equation 1 and in equation 3.
However, the radiative force is important when defining the value of above which centrifugal mass loss occurs. Considering radiative effects, mass loss generally happens when the total acceleration equals zero in a rotating star:
| (7) |
By using the von Zeipel theorem (von Zeipel, 1924) and its generalization (Zahn, 1992; Maeder, 1999), Maeder & Meynet (2000b) expressed the total gravity at colatitude as
| (8) |
where , and is the local Eddington ratio defined as
| (9) |
Here, is the average density of the star, while and are evaluated at isobaric surfaces (i.e., we assume the baroclinicity of the star is very small Zahn 1992; Maeder 1999; Maeder & Meynet 2000b).
Equation 7 has two roots, one is that given by , which corresponds to the classical break-up limit:
| (10) |
The other root corresponds to the condition , and the lower value of these two roots will dominate since mass loss will start as soon as the lower critical velocity is reached. Maeder & Meynet (2000b) argued that only for an Eddington factor larger than 0.639, the second root has a lower value than and is given by:
| (11) |
Here, is the largest value of the Eddington factor over the stellar surface, and are the equatorial and polar radius respectively satisfying at break-up, and is the ratio of the actual volume of a star to the volume of a sphere of radius , i.e. . Maeder & Meynet (2000b) further pointed out that the ratio when and when . The trend in is approximately a linear decrease above . We therefore use the following approximation for the second root:
| (12) |
Since is not strongly by centrifigual mass loss, and both scale as , so the mass loss rate formula (3) still applies for the second critical rotation rate .
While there has been substantial debate regarding the effect of rotation on massive star wind mass loss rates (e.g., Langer 1998; Glatzel 1998; Owocki et al. 1998; Maeder & Meynet 2000a; Gagnier et al. 2019), we emphasize that our predicted mass loss rates do not depend directly on this relationship, but only on whether the star can approach the breakup limit. If rotationally enhanced mass loss of the form advocated by Langer (1998) can prevent near-critical rotation from being realized, centrifugal mass loss will not occur. However, in light of recent two-dimensional results (Müller & Vink, 2014; Gagnier et al., 2019), this appears unlikely, since rotation only enhances wind mass loss very close to the breakup limit.
3 Results
3.1 Models
Constructing stellar models with the MESA stellar evolution code (Paxton et al., 2011; Paxton et al., 2013, 2015, 2018, 2019), we compute the evolution of rotating massive stars with large initial mass ranging from 5 to 55. Our models have an initial surface rotational velocity of 200 km/s, a fairly typical ZAMS value for O/B type stars in the Milky Way and Magellanic clouds (Mokiem et al., 2006; Dufton et al., 2006b; Hunter et al., 2008; Ramírez-Agudelo et al., 2013; Dufton et al., 2013). We will study stars with solar metallicity and LMC metallicity . Rotational mixing is included via Eddington-Sweet circulation with the usual rotational mixing factor of (see Appendix B for a model inlist). The models use the default centrifugal distortion in MESA with limited maximum centrifugal forces, and the AM transport prescription from Fuller et al. (2019).
Our models use MESA’s MLT++ prescription to handle the structure of super-Eddington near-surface layers. The structure of these layers (typically from the iron opacity peak outward) is dependent on this approximation, as is the radius of the star. Hence, our models do not exhibit the same envelope inflation seen in models without a similar prescription (e.g., Gräfener et al. 2012). We shall discuss uncertainties associated with this issue in Section 5.
We include centrifgual mass loss as discussed in Section 2.3. To summarize, we approximate the surface rotational break-up limit to be:
| (13) |
For surface rotation rates above , we impose a mass loss rate of
| (14) |
with . To aid numerical convergence, we smoothly increase mass loss towards equation 14 as the critical rotation rate is approached, allowing some centrifugal mass loss at lower rotation rates. We run our models until most of the helium in the core has been burned into carbon and oxygen, i.e. the helium mass fraction in the core is below 10%.
3.2 Results without Wind
To better understand the effects of stellar evolution and centrifugally driven mass loss, we first construct models without mass loss via radiatively driven winds. These models conserve mass and AM, unless they lose mass centrifugally, and are simpler to understand. While real stars do lose mass and AM through winds, our models in this section are similar to very low-metallicity stars, for which mass loss is irrelevant. They also resemble the post-mass transfer evolution of stars whose AM has been rejuvinated by accretion from a companion.
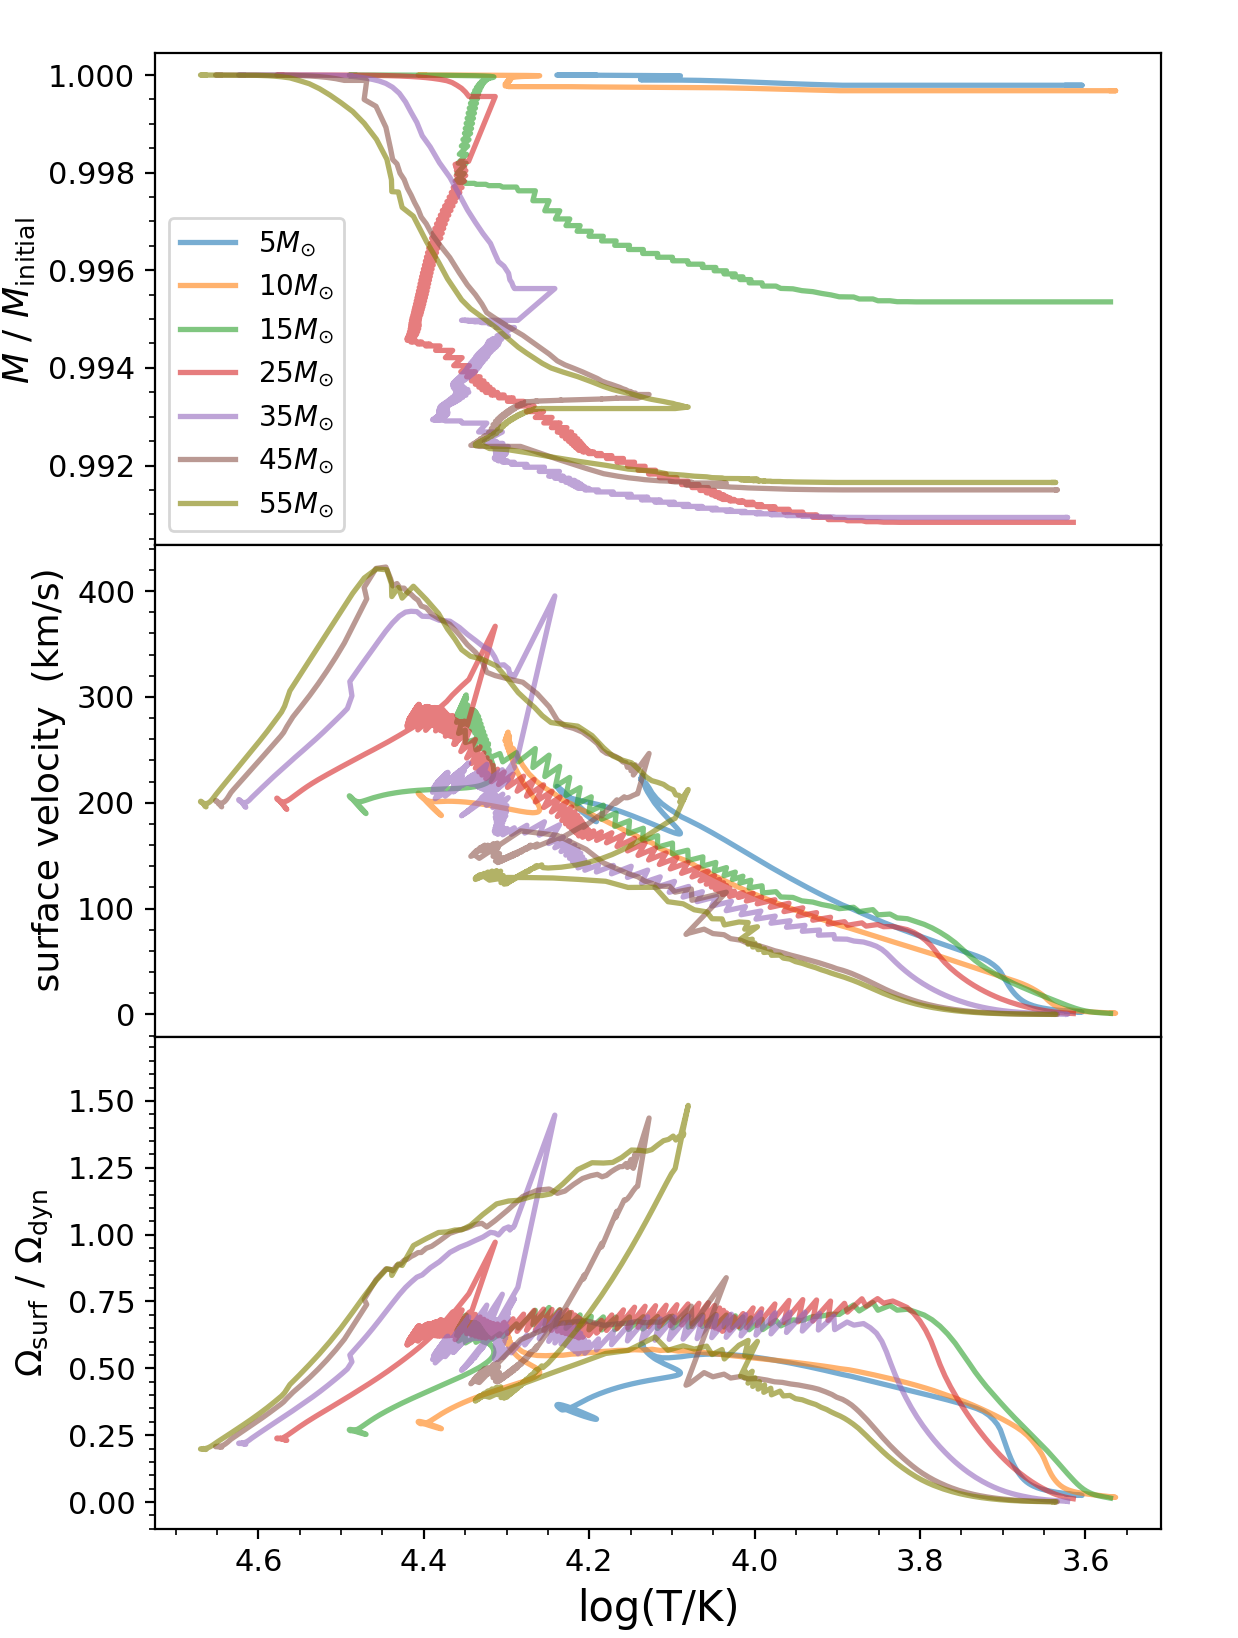
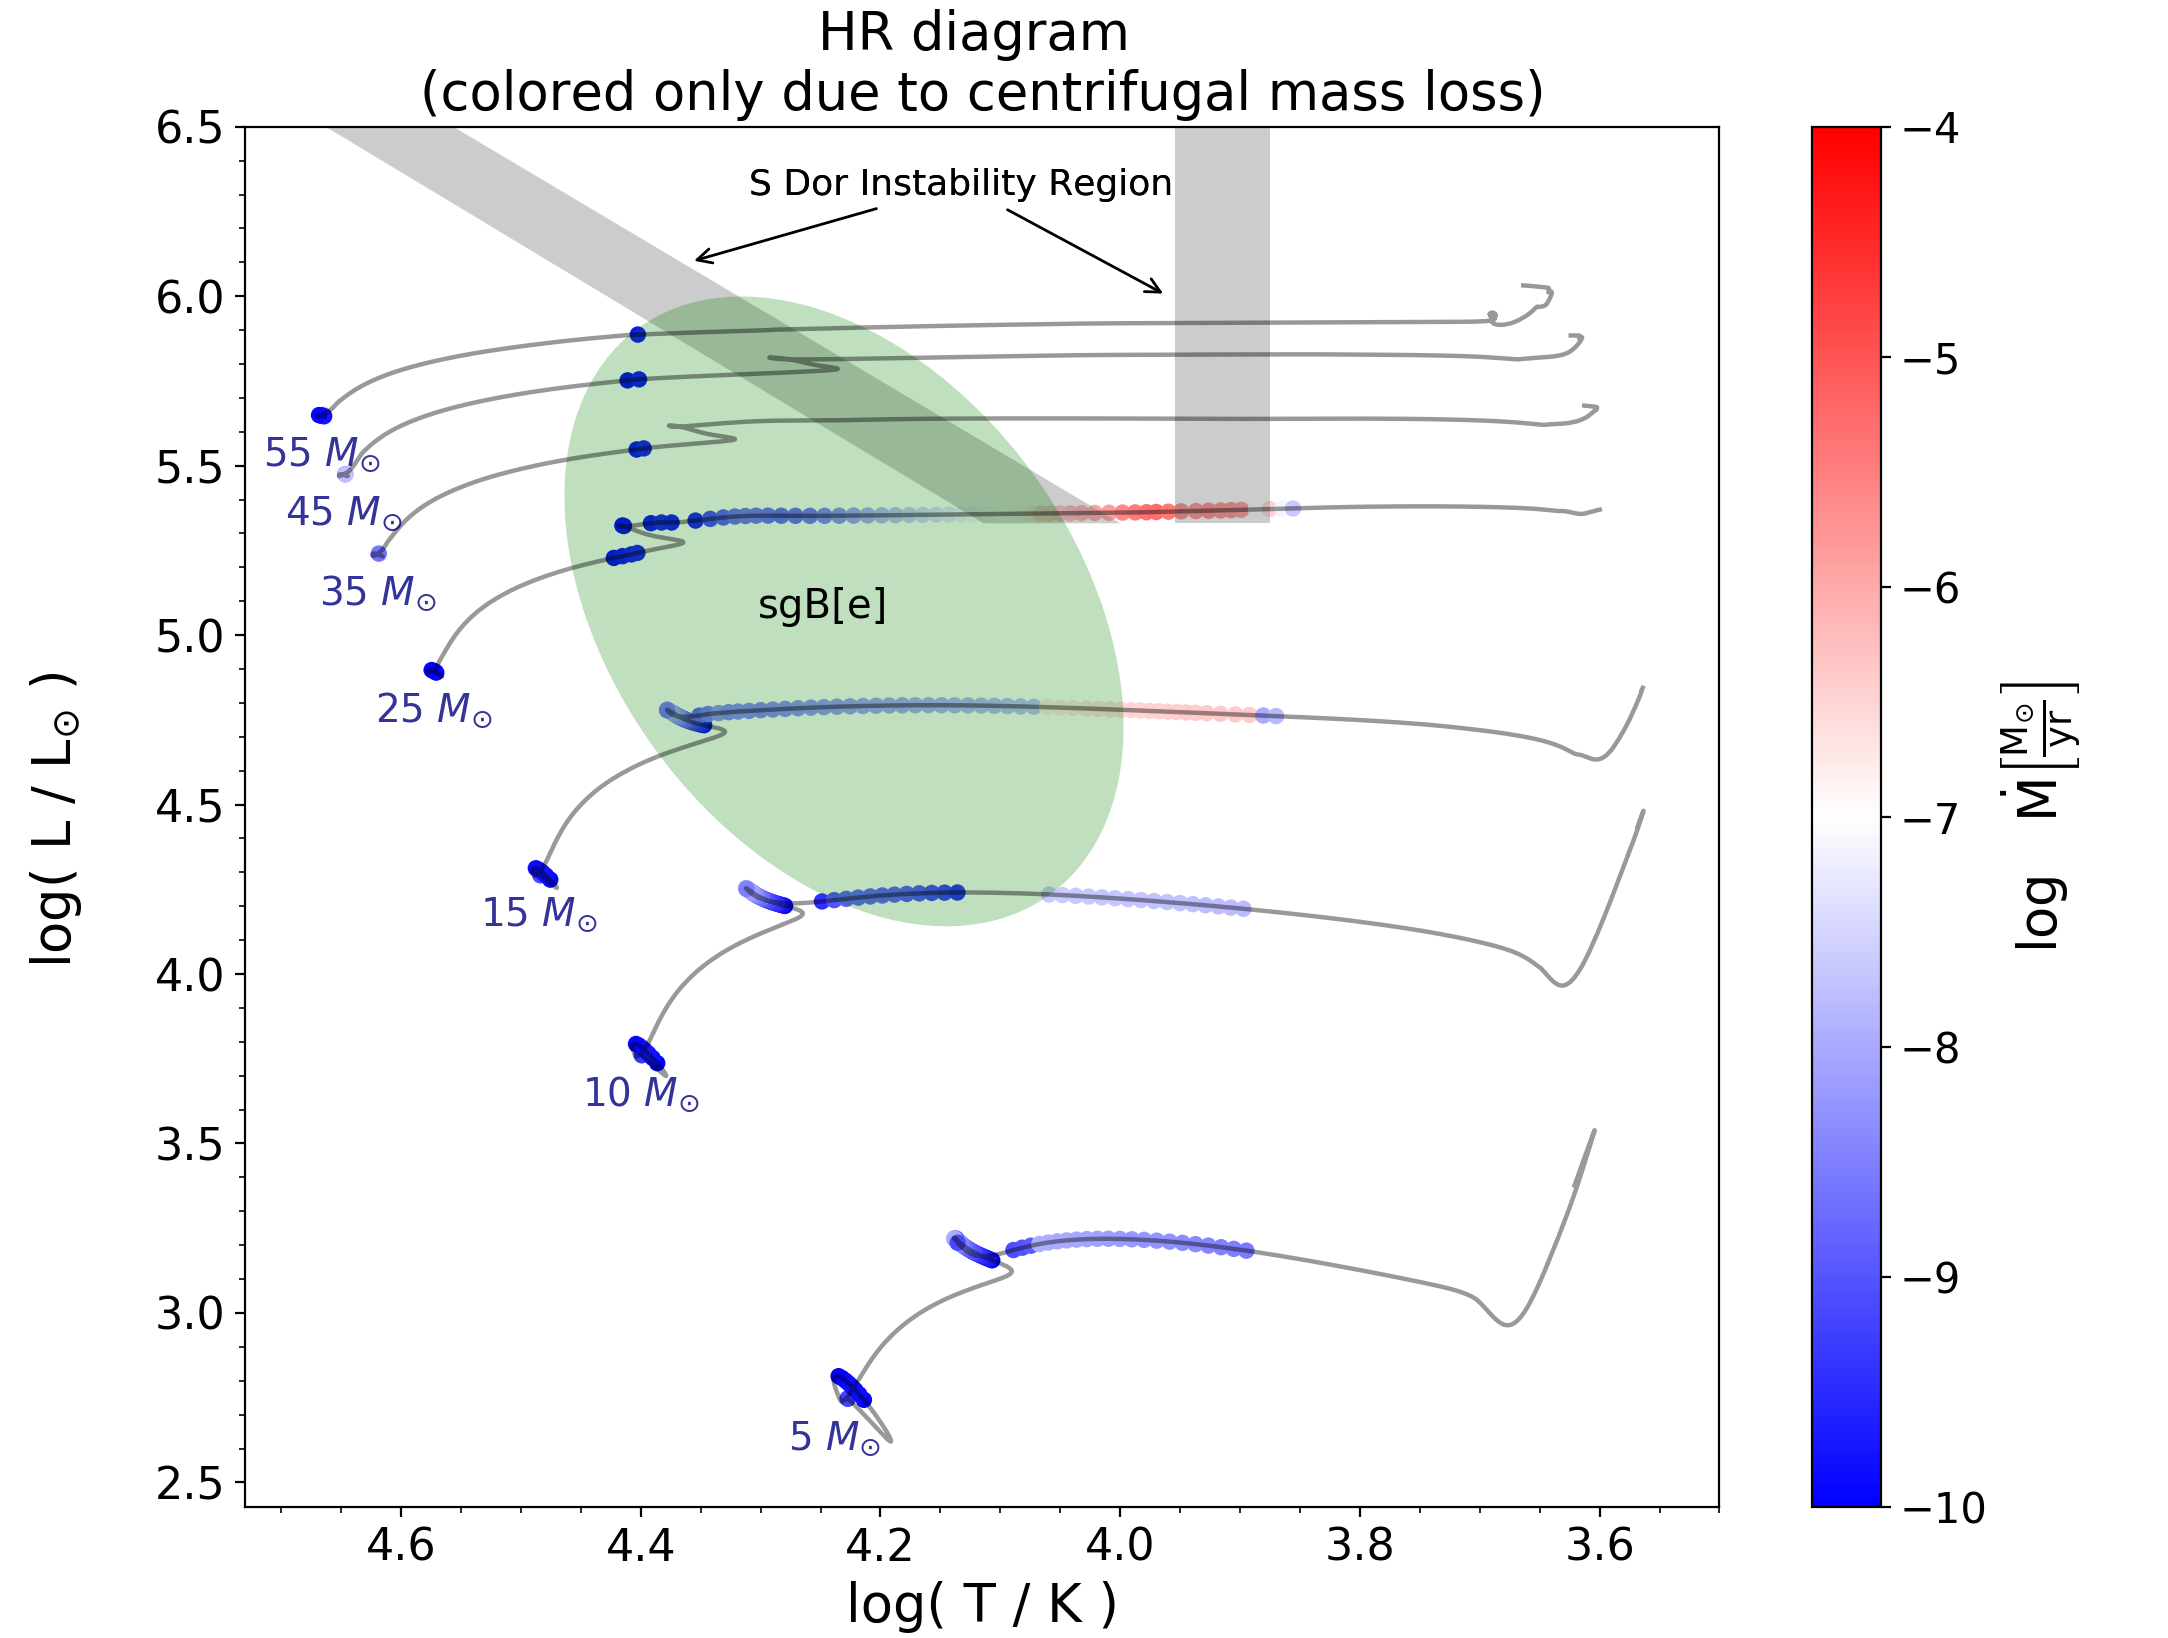
Figure 2 displays the evolution of stellar mass and rotation velocity as a function of effective temperature for our stellar models. During most of the MS, centrifugal mass loss does not occur (or occurs at low levels) because our models are born rotating well below their breakup velocity, and they must evolve substantially before any centrifugal mass loss can occur. During this stage, the stellar mass is nearly constant as stars evolve to cooler temperatures. Stars with larger initial rotational velocities would lose mass earlier along the MS, and could create Oe/Be stars, though the MS mass loss rate is typically modest, as shown in Figure 3.
However, the centrifugal mass loss rate can increase by orders of magnitude near and just after the TAMS, typically at surface temperatures . It is at this stage of evolution that core contraction is fastest, driving centrifugal mass loss at rates up to /yr, with higher mass loss rates for more massive stars. Higher mass models typically lose more total mass than low-mass stars, though none of our models lose more than 1% of their mass via centrifugal mass loss. Mass loss typically ceases at temperatures of , when stars start to develop massive convective envelopes, causing the moment of inertia and to increase sharply, such that stars no longer rotate above their breakup velocities.
The total amount of centrifugal mass loss is easily understood, assuming near rigid rotation. The ejected mass carries away an AM content of
| (15) |
Hence, in order for a star to lose all of its AM, , and assuming the amount of mass lost is simply
| (16) |
As shown in Figure 1, when centrifugal mass loss is occurring, which together with equation 16 accounts for the small fraction of mass lost. In a real star with differential rotation, the core rotates faster than the surface and the star has more AM, thus more mass can be lost than predicted by equation 16, but our numerical calculations indicate the total mass loss remains small.
Figure 2 also shows the evolution of the surface rotation rate of our windless models. For less massive stars (), the core contraction and envelope expansion roughly balance, such the surface rotation velocity is nearly constant. However, in massive stars, the large contracting core overwhelms the expanding envelope, donating enough AM to increase the surface rotation rate of the star towards breakup, even during the MS. Once centrifugal mass loss begins, the surface velocity tracks the breakup rotation velocity (apart from numerical inaccuracies) until the mass loss ceases at cooler temperatures where the star’s maximum allowable AM content increases. At this point, the surface rotation rate approaches zero as the star’s moment of inertia becomes very large.
3.3 Results with wind
Real stars lose mass and AM through line-driven winds, complicating the evolution from the simple scenario above. We examine the coupled effects of centrifugal mass loss and wind mass loss using the ’Dutch wind’ prescription in our MESA models, with a scaling factor of 0.5. We use this value because a reduction factor of at least 2-3 from prior estimates, due to wind clumping, is necessary to reproduce observational data (see e.g., Smith 2014; Vink 2017).
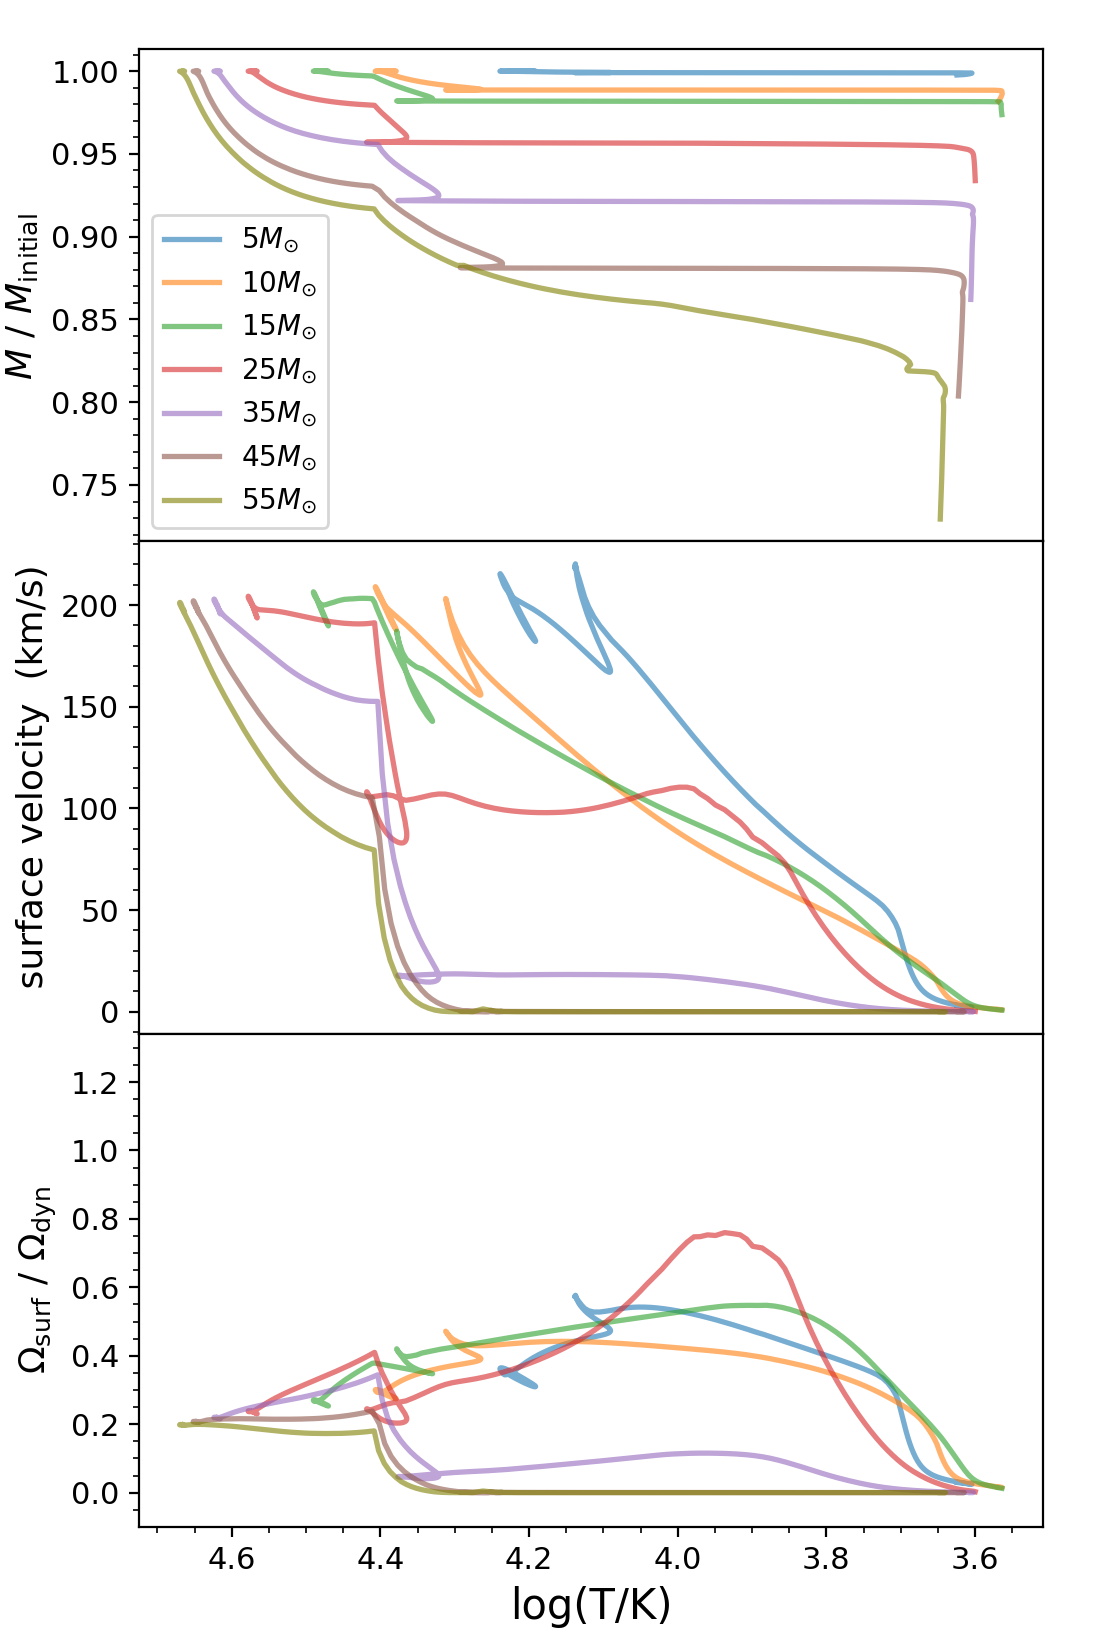
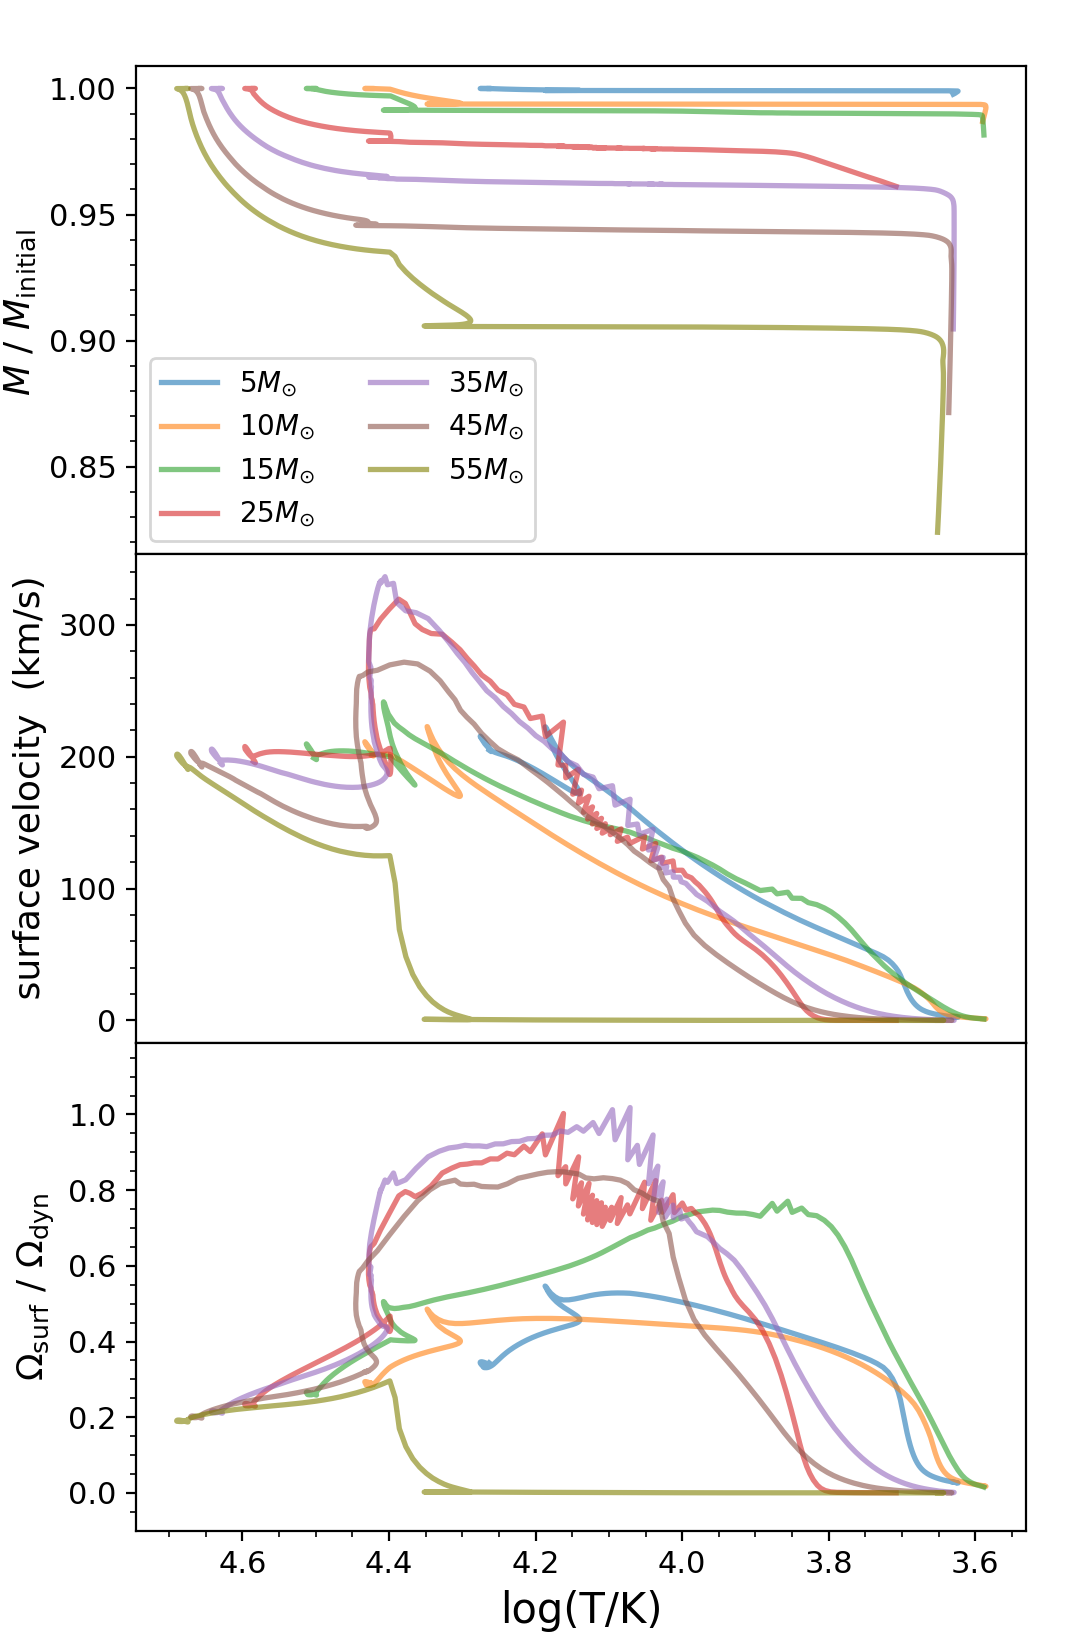
Figure 4 illustrates the evolution of mass and surface rotational velocity of our models with wind mass loss. Compared to Figure 2, it is obvious that models with wind lose much more mass, and their surface rotational velocities decrease more quickly. Such differences are especially prominent for stars with larger initial mass because the wind carries away enough AM to prevent the star from ever rotating near breakup. We note the sudden decrease in rotational velocity at , due to the bi-stability jump at which the wind mass loss rate increases sharply. Stars with are not strongly affected due to their low wind mass loss rates. We note that these models never rotate faster than breakup, yet they still lose mass according to our numerical prescription (Appendix B.2), which ramps up the mass loss smoothly as the star approaches breakup. The actual threshold of for centrifugal mass loss in Be stars is still debated, but is likely significantly less than unity (Huang et al., 2010; Zorec et al., 2016). While our numerical implementation is far from perfect, it is clear that centrifugal mass loss does begin at sub-critical rotation rates and likely intensifies as the breakup limit is approached.
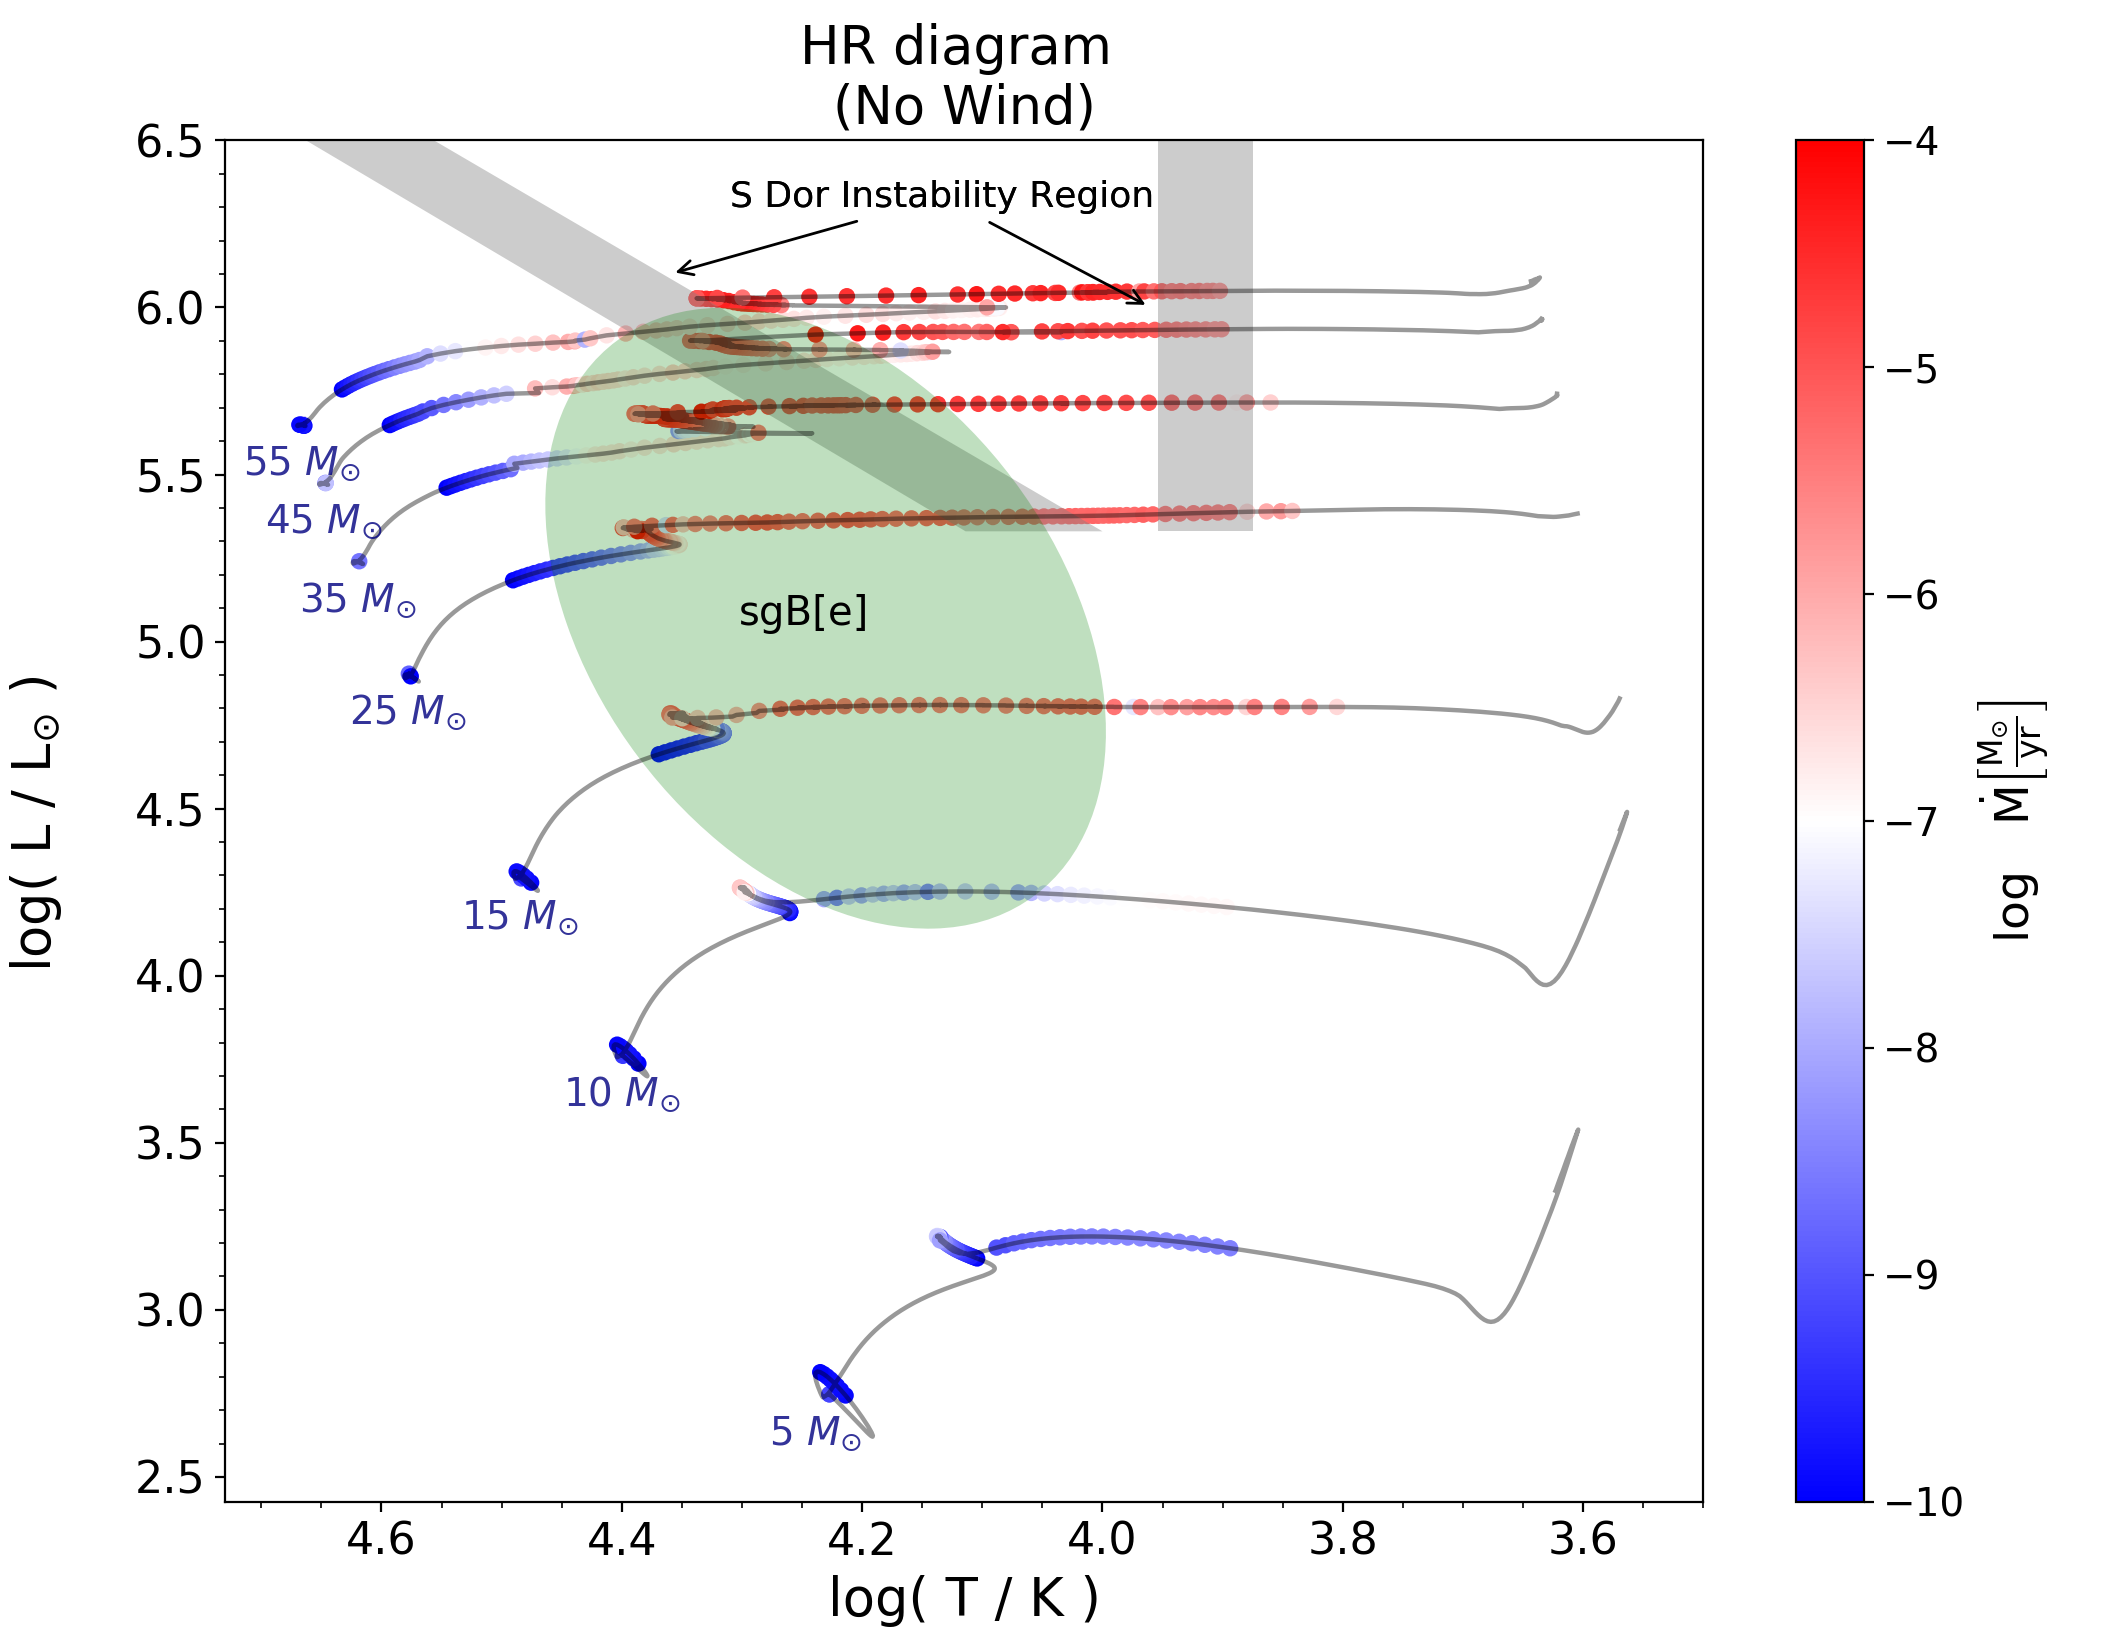
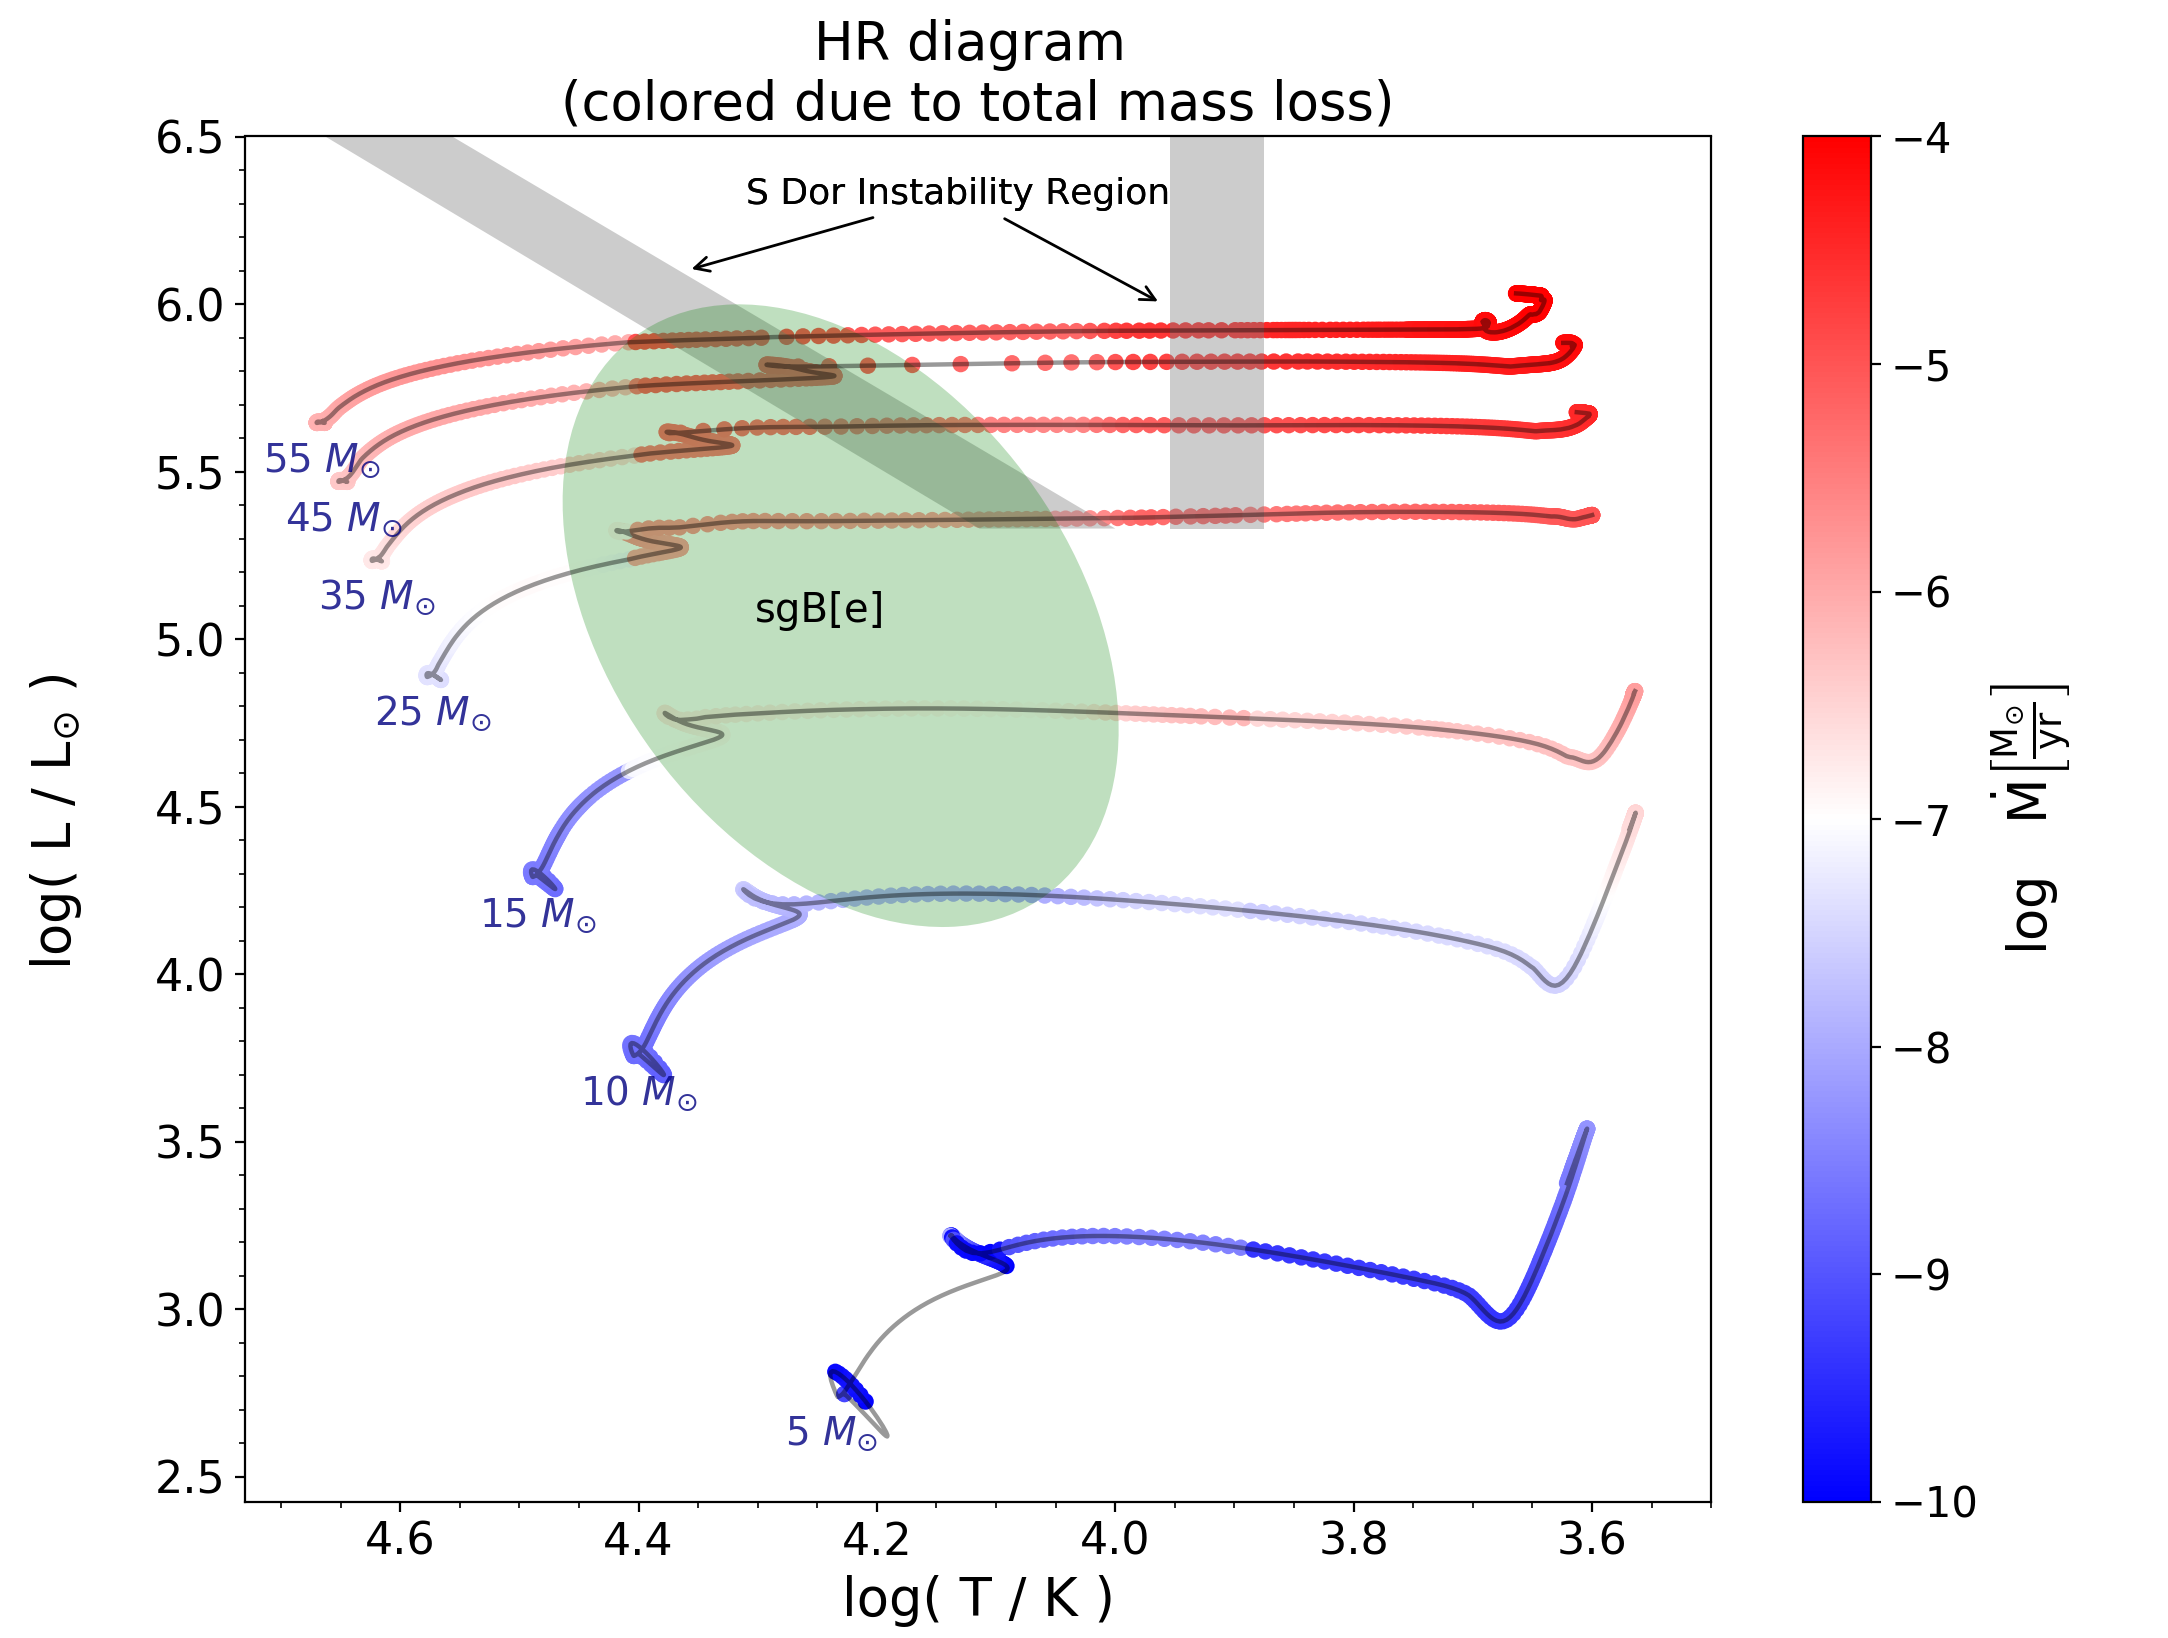
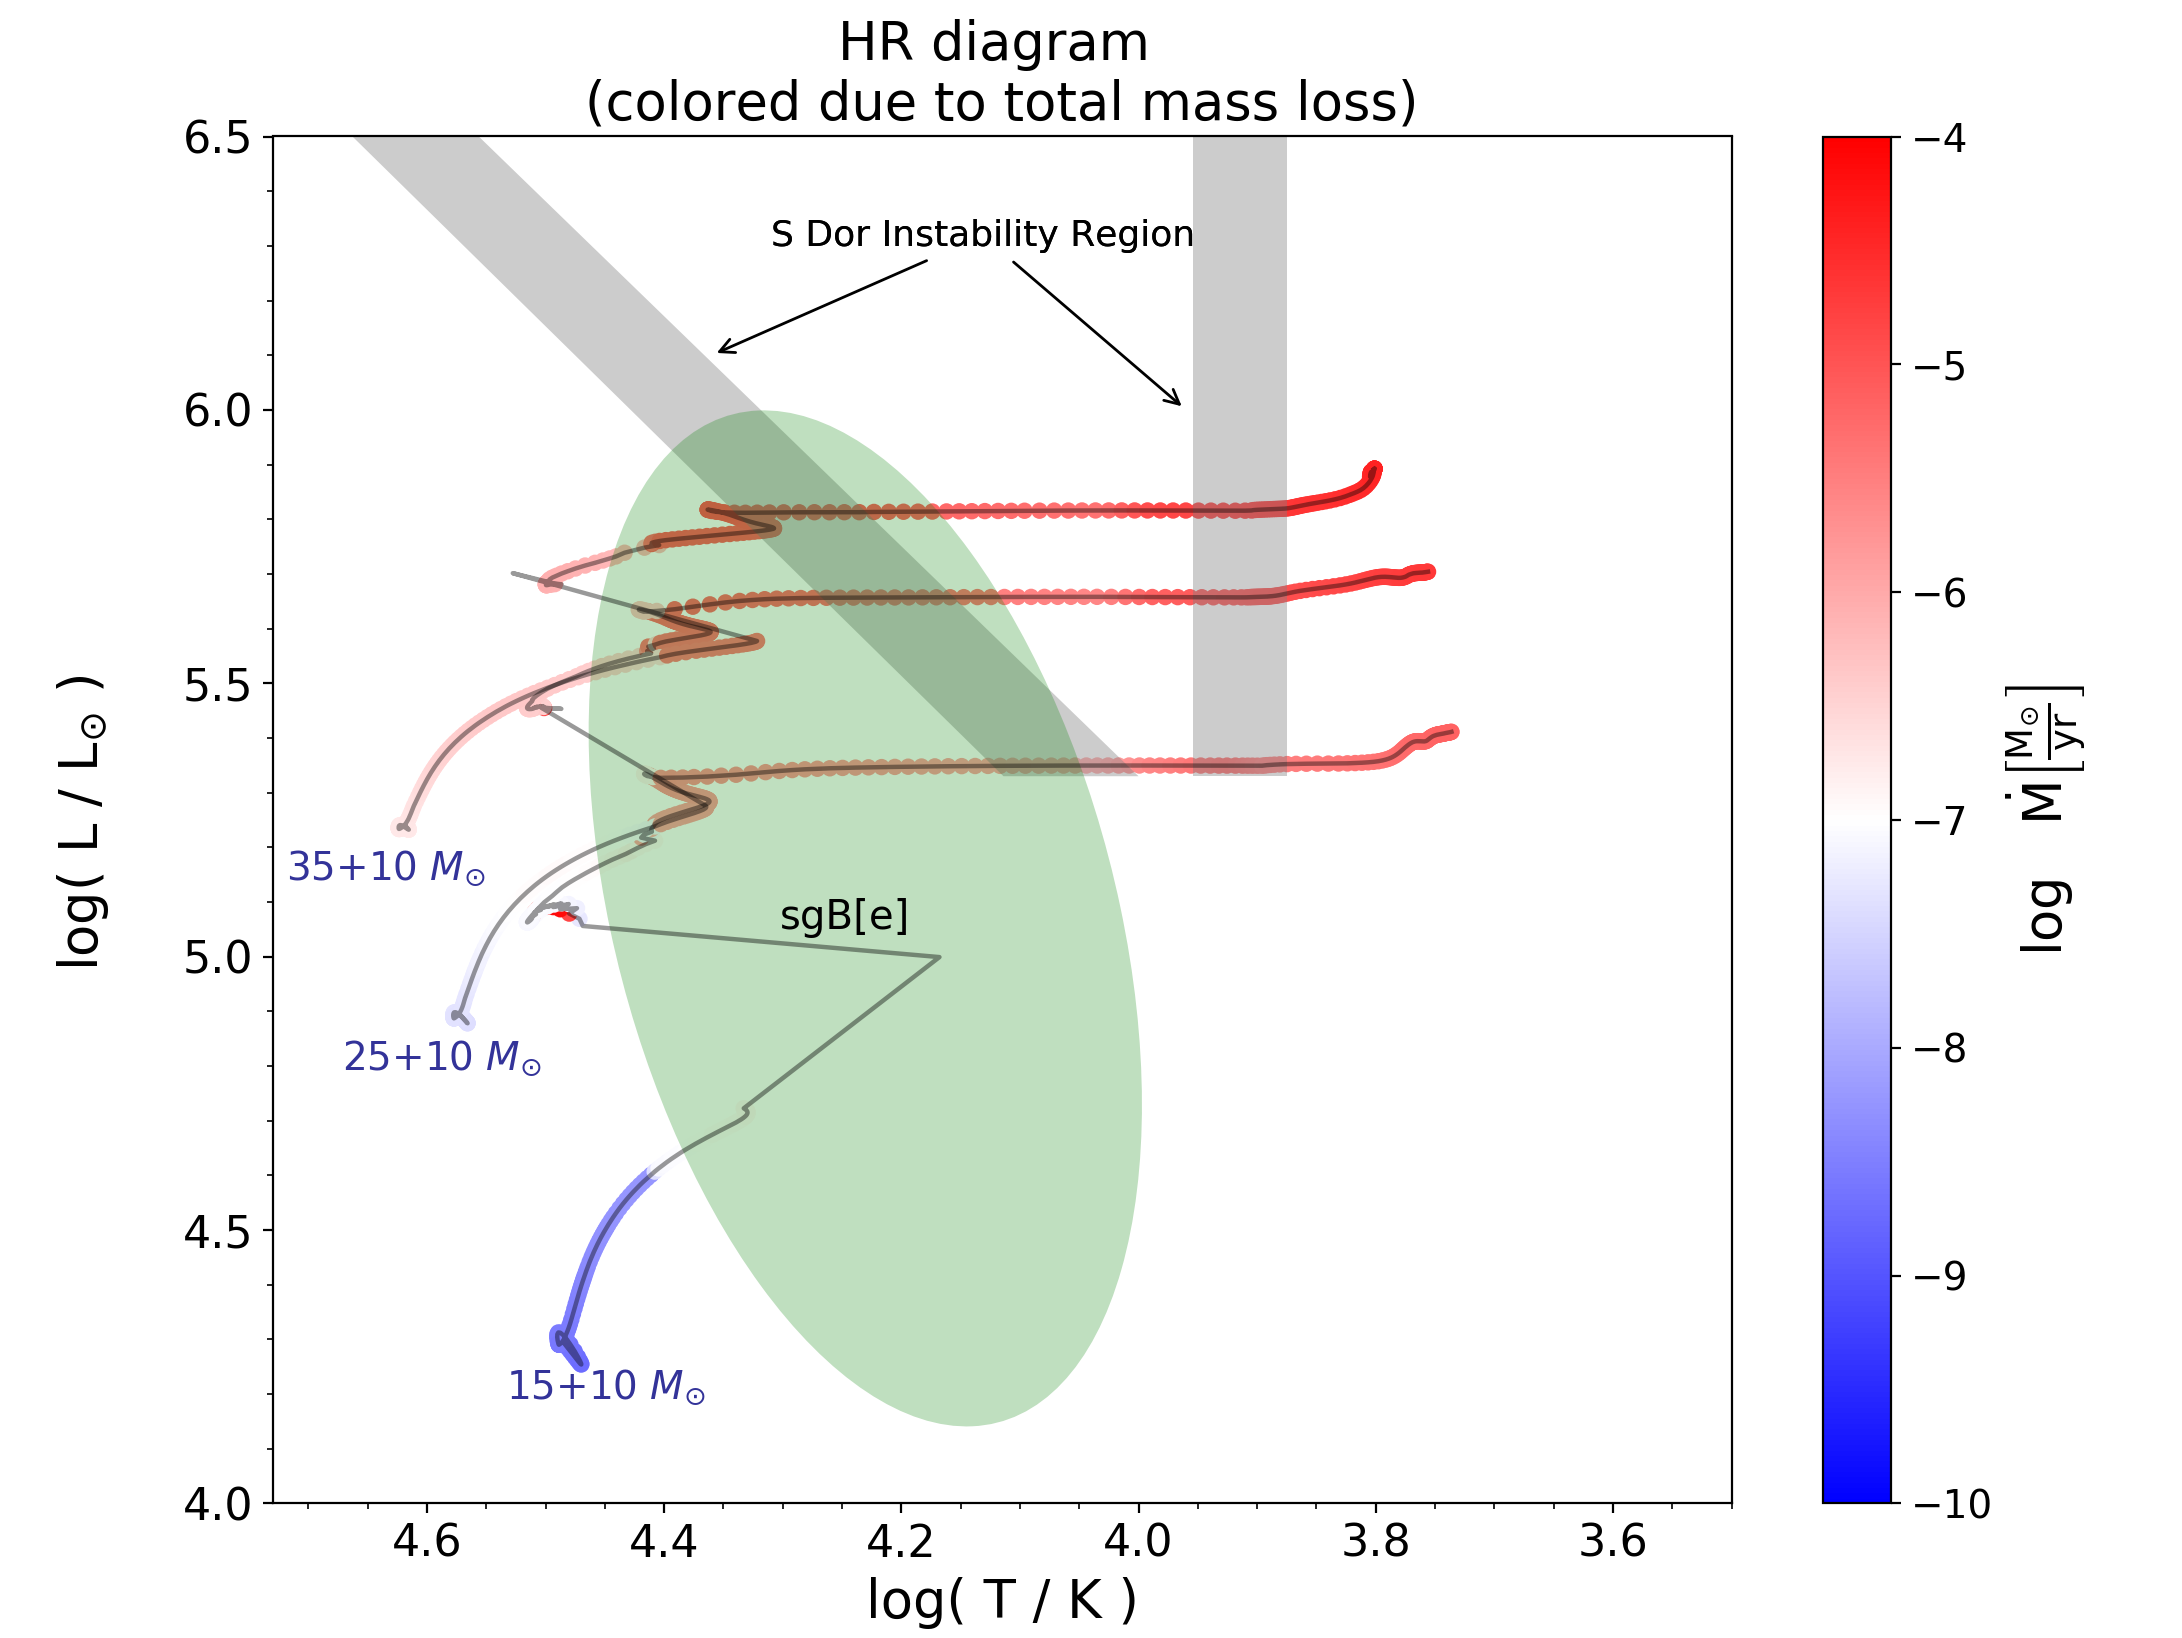
In Figure 5, we present Hertzsprung–Russell diagrams of stars with centrifugal mass loss and stellar winds, with points again colored by mass loss rate. It is clear that most mass loss results from stellar winds, while centrifugal mass loss only accounts for a very small fraction. However, even in these models, the centrifugal mass loss does become substantial for stars crossing the Hertzsprung gap. Centrifugal mass loss is most prominent in the mass range because lower mass stars experience less evolution-induced spin-up, and higher mass stars lose too much AM through winds. While centrifugal mass loss is negligible compared to the total mass lost, it may cause stellar outbursts in this part of the HR diagram (see Section 4) if centrifugal mass loss occurs episodically. Interestingly, this mass loss is largest (and would likely produce more violent outbursts) in stars near the S Doradus instability region, and near the sgB[e] stars, both of which are known to exhibit outbursts that eject mass.
3.4 Effects of Metallicity
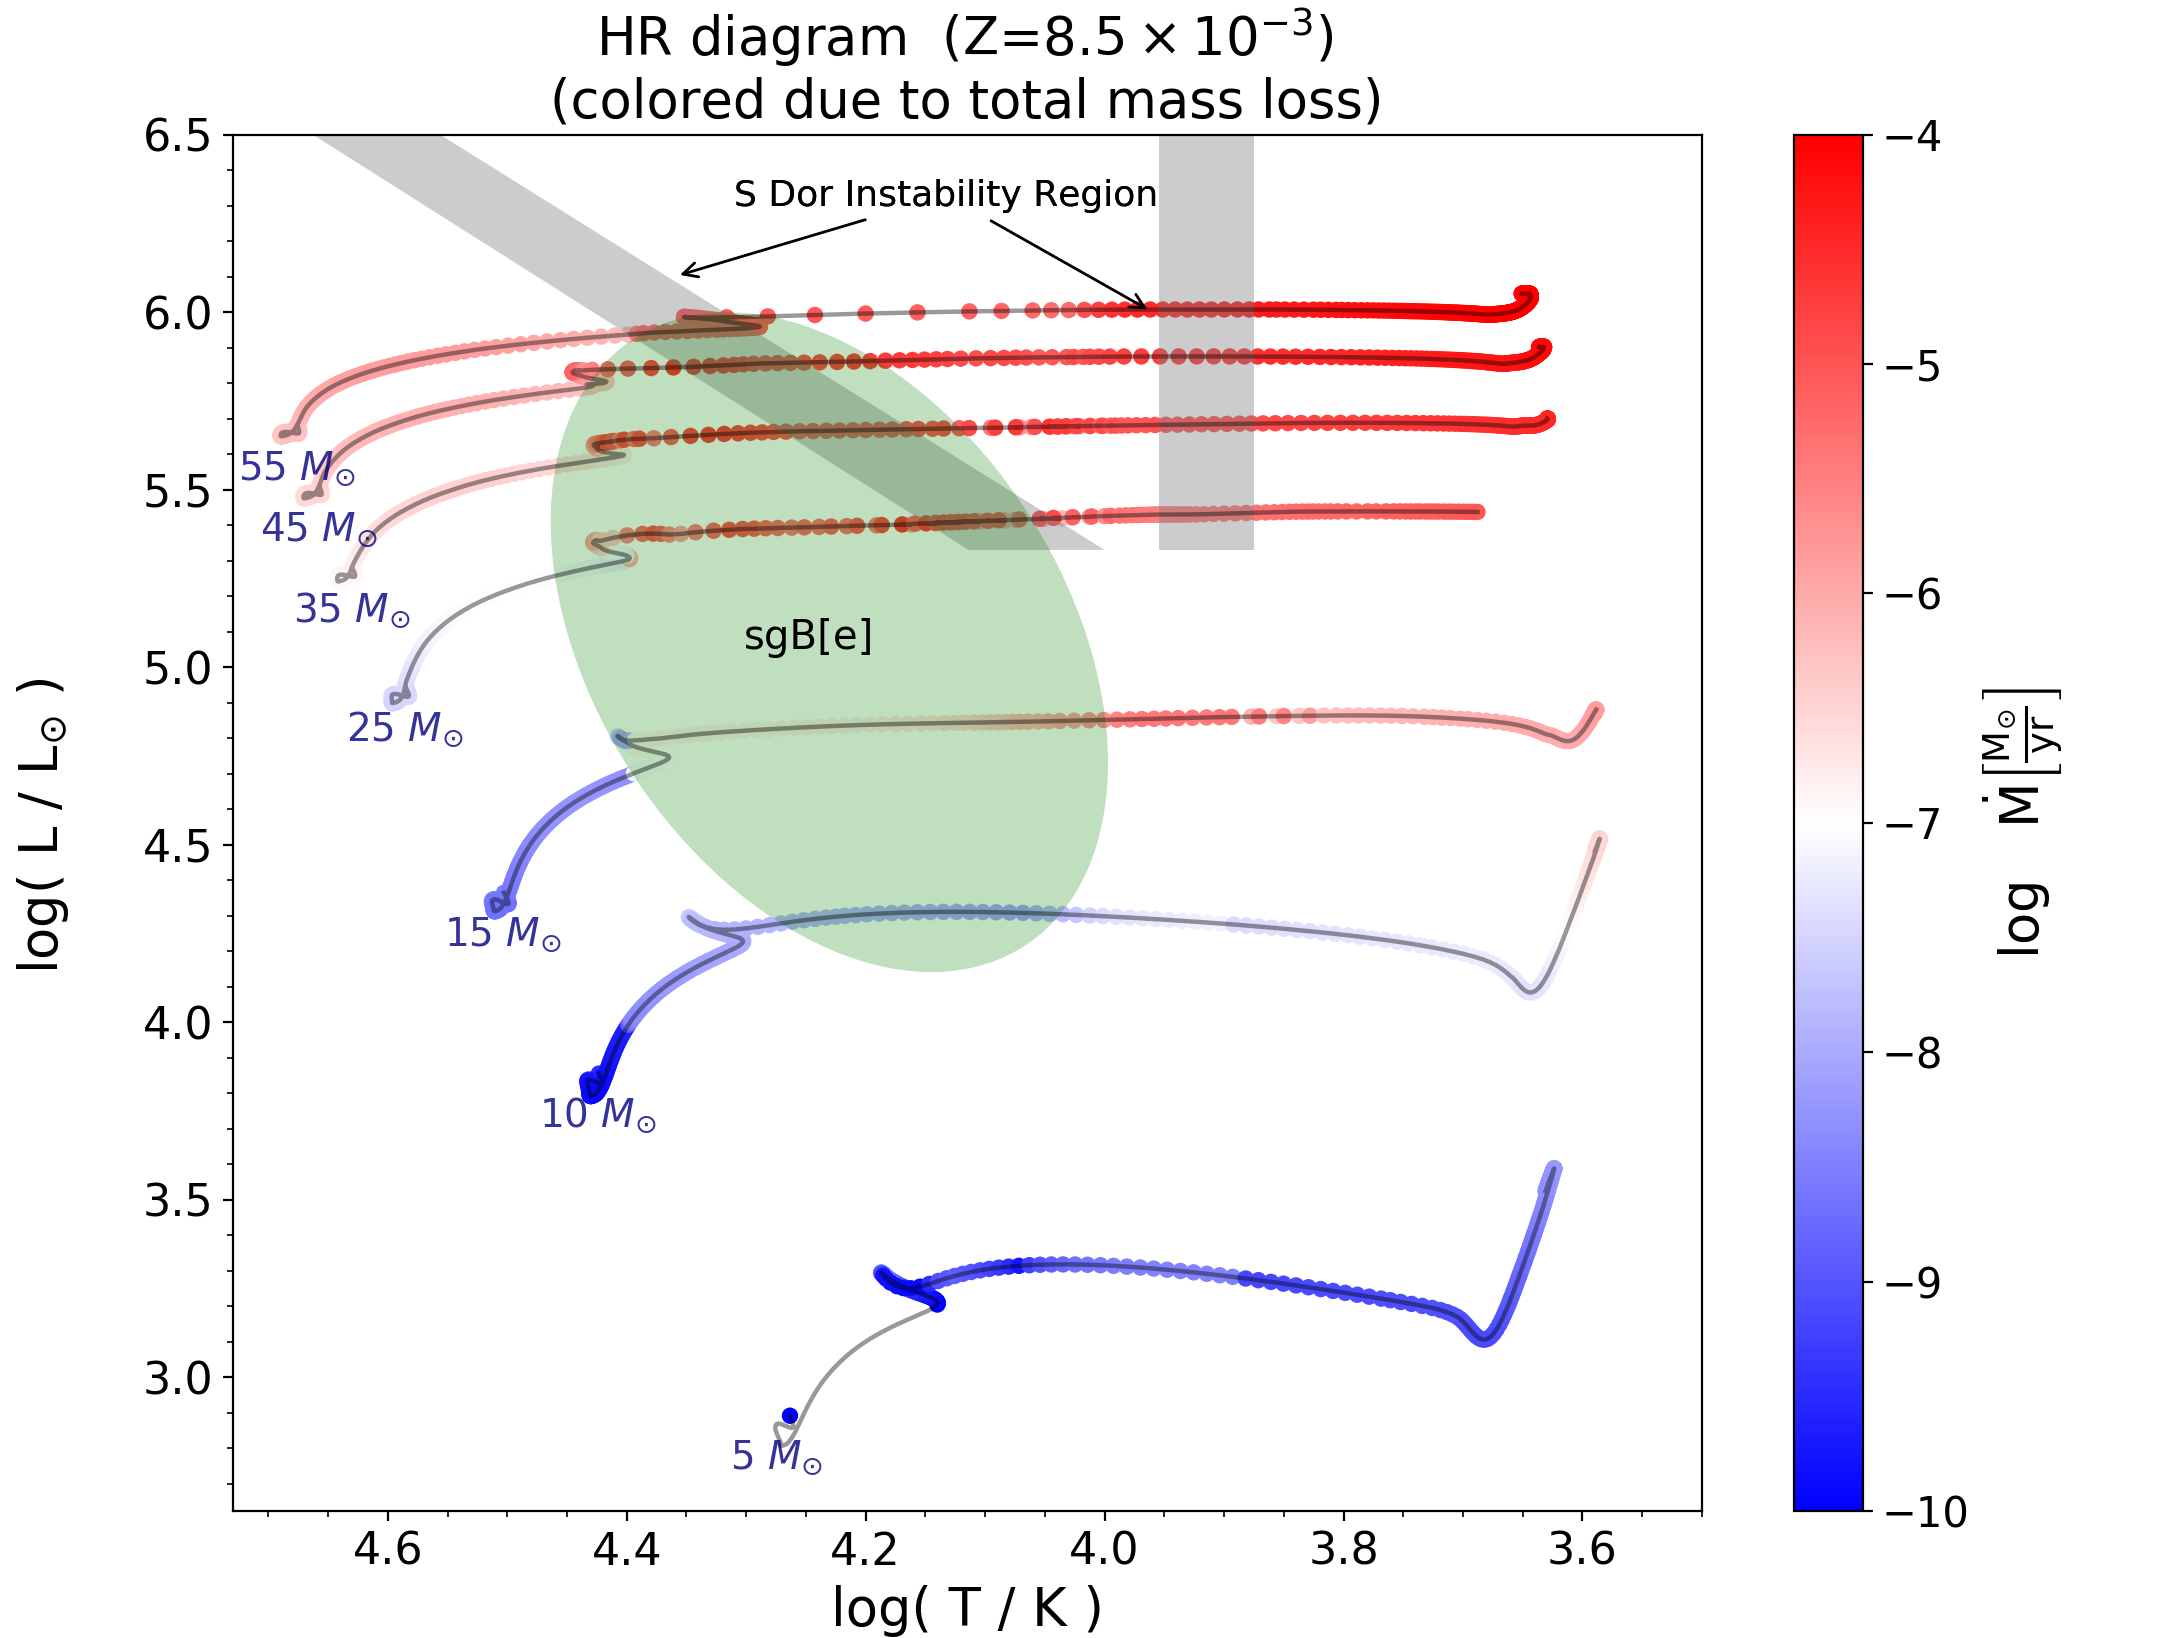
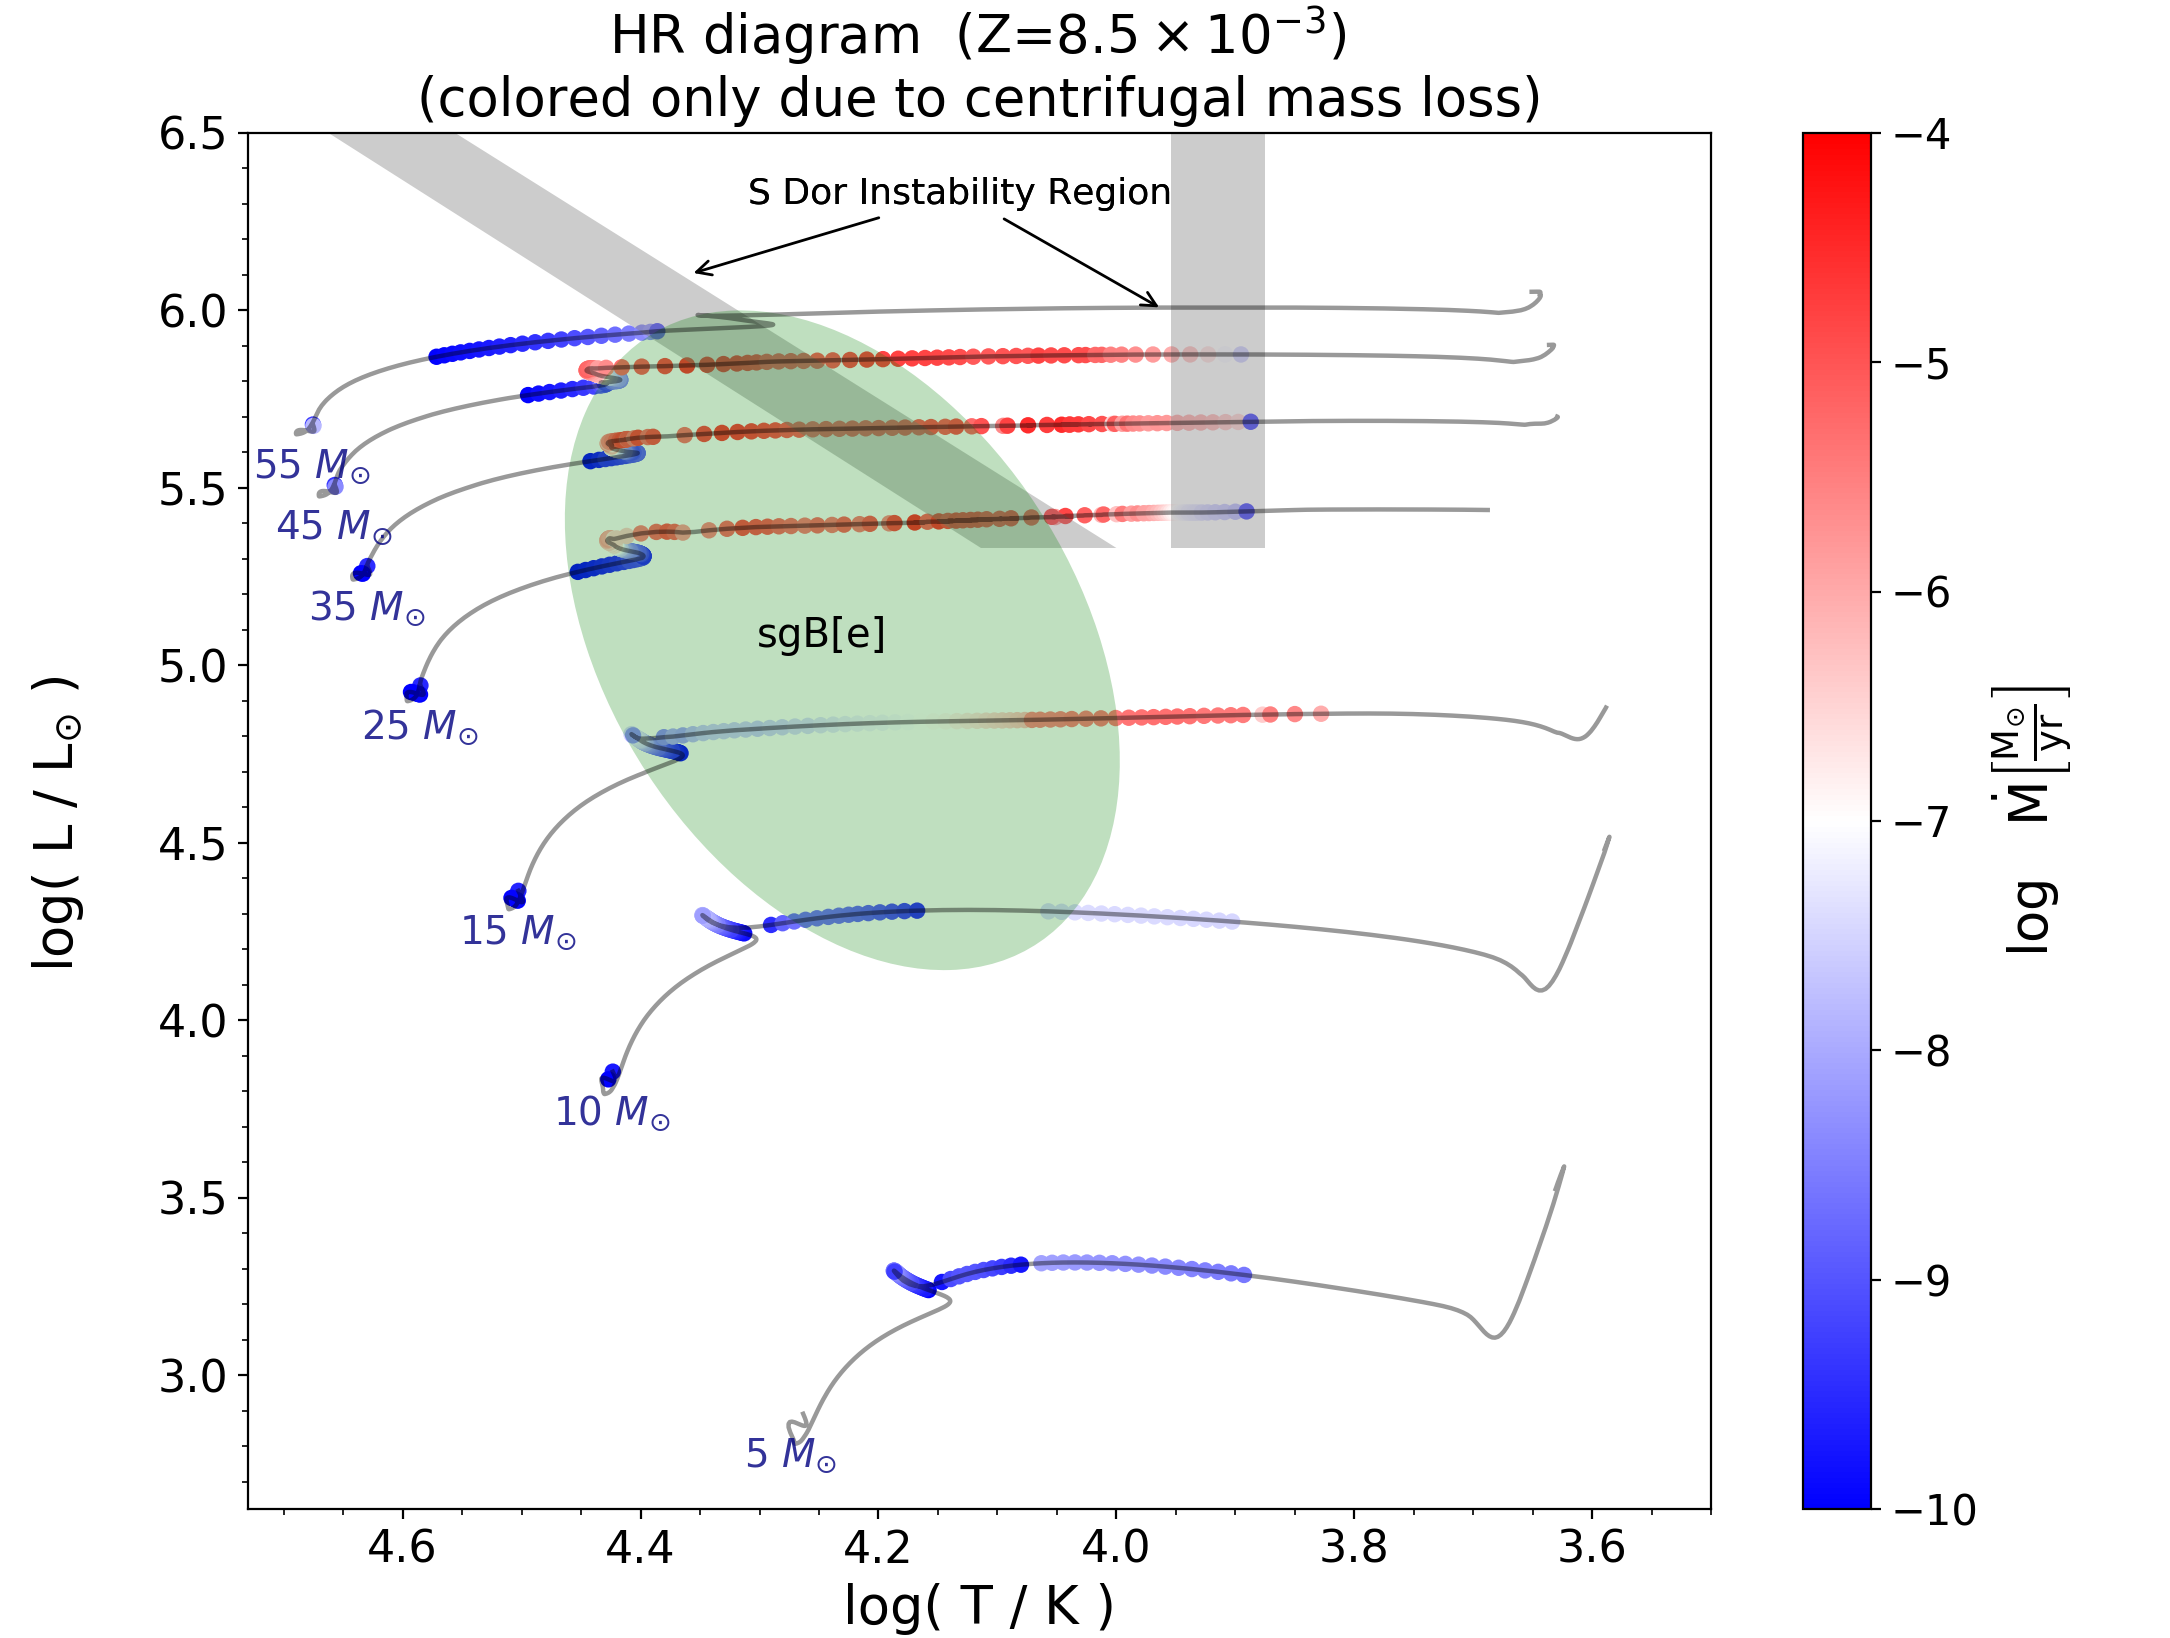
Massive star winds are sensitive to stellar metallicity since they are driven by absorption lines of iron group elements. Hence, we expect lower metallicity stars to lose less mass and AM via line-driven winds, potentially increasing the importance of centrifugal mass loss. To demonstrate the shifting emphasis from stellar winds to centrifugally driven mass loss in low-metallicity regions, we construct models with initial metallicity half of the previous ones, i.e., .
Figure 6 illustrates the evolution of mass and surface rotational velocity of our low-metallicity models, and Figure 7 shows the centrifugal mass loss rates. We can see that, compared to solar-metallicity stars, the surface rotation velocities of low-metallicity stars remain larger because winds remove much less AM. The higher AM fuels much larger centrifugal mass loss rates, especially for high-mass stars. We see high post-MS centrifugal mass loss extending up to , compared to only for solar metallicity. The centrifugal mass loss also occurs over a broader span of the HR diagram, but remains largest as stars cross the HR gap, near the locations of sgB[e] and S Doradus stars. While centrifugal mass loss remains a small fraction of the total mass loss, it can dominate the mass loss rate for post-MS B/A/F-type supergiants evolving into red supergiants.
These results suggest that centrifugal mass loss should be much more prominent in low-metallicity environments. If the formation of Be stars, sgB[e] stars, and LBV outbursts is linked to centrifugal mass loss, we expect these phenomena to be more common in low-metallicity galaxies such as the LMC and SMC. For Be stars, this appears to be the case (e.g., Peters et al. 2019). In particular, these single-star models predict more high-mass, high-temperature, and high-luminosity Be stars in low-metallicity environments, whereas the increase for lower mass stars is more mild. While these lower mass stars dominate Be rates due to the steep initial mass function, the mass-sensitivity of centrifugal mass loss may help distinguish it from binary Be star formation models.
3.5 Binary Interaction
Centrifugally driven mass loss may be more pronounced in binary systems where the primary star has accreted mass via stable mass transfer or a stellar merger. The accretion event can replenish the AM of the star, causing it to spin much more rapidly at the end of the MS, intensifying centrifugal mass loss.
To simulate such a binary scenario in our MESA models, we evolve them until the central hydrogen mass fraction is , and then add using relax_mass. This mimics a stellar merger as the star expands near the end of the MS. After the mass change, we use relax_omega_div_omega_crit to adjust the surface rotation rate until , which is reasonable because a star need only gain in order to spin up to breakup, and from Figure 1 we see that typically near the end of the MS. We then let the star evolve with both stellar wind and centrifugal mass loss until the central helium mass fraction is below 10%.
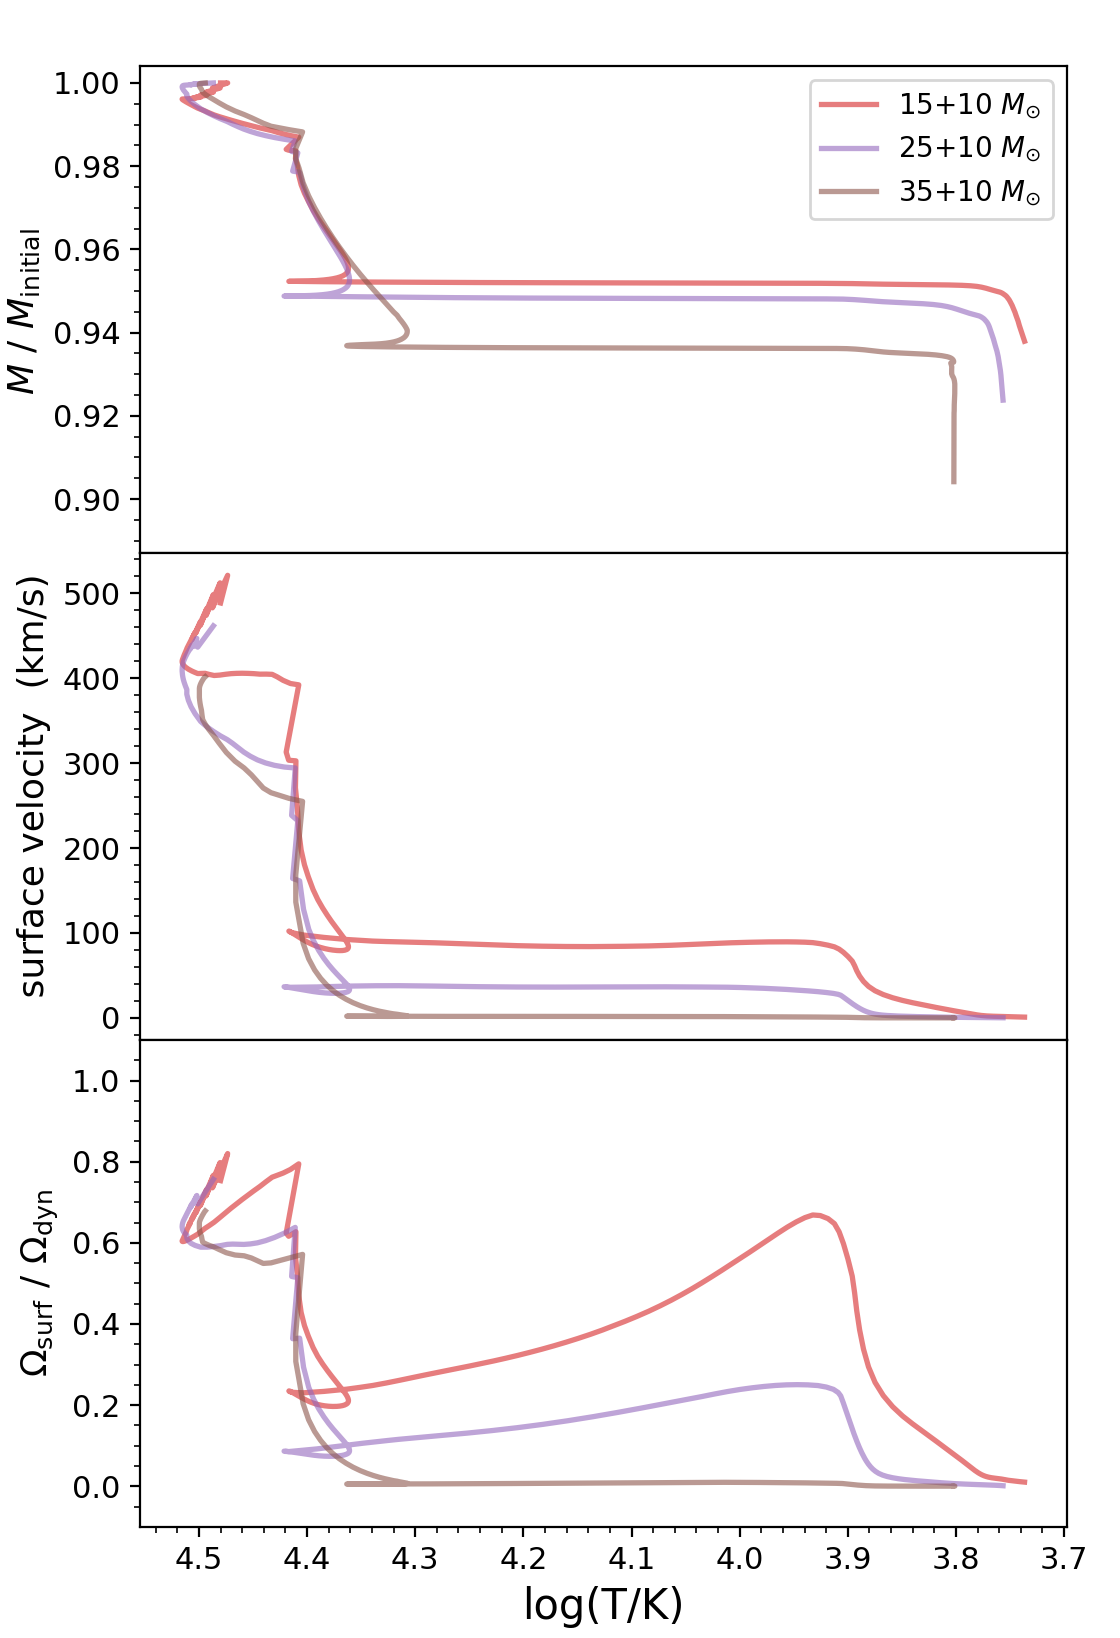
Implementing the aforementioned binary prescriptions, we run models with initial masses of 15, 25, and 35 . Figure 8 displays the evolution of mass and surface rotational velocity, beginning after the accretion event. In each of these models, the hydrogen-burning core grows and ingests new hydrogen after accretion, so that the star returns to the MS, behaving similar to a MS star of the new mass. However, because much of the core hydrogen has already been burnt, the models spend less time on the MS after accretion, and they lose less AM to winds by the time they evolve off the MS again. Hence, upon leaving the MS, our binary models have greater surface velocities and are closer to the break-up limit, intensifying centrifugal mass loss.
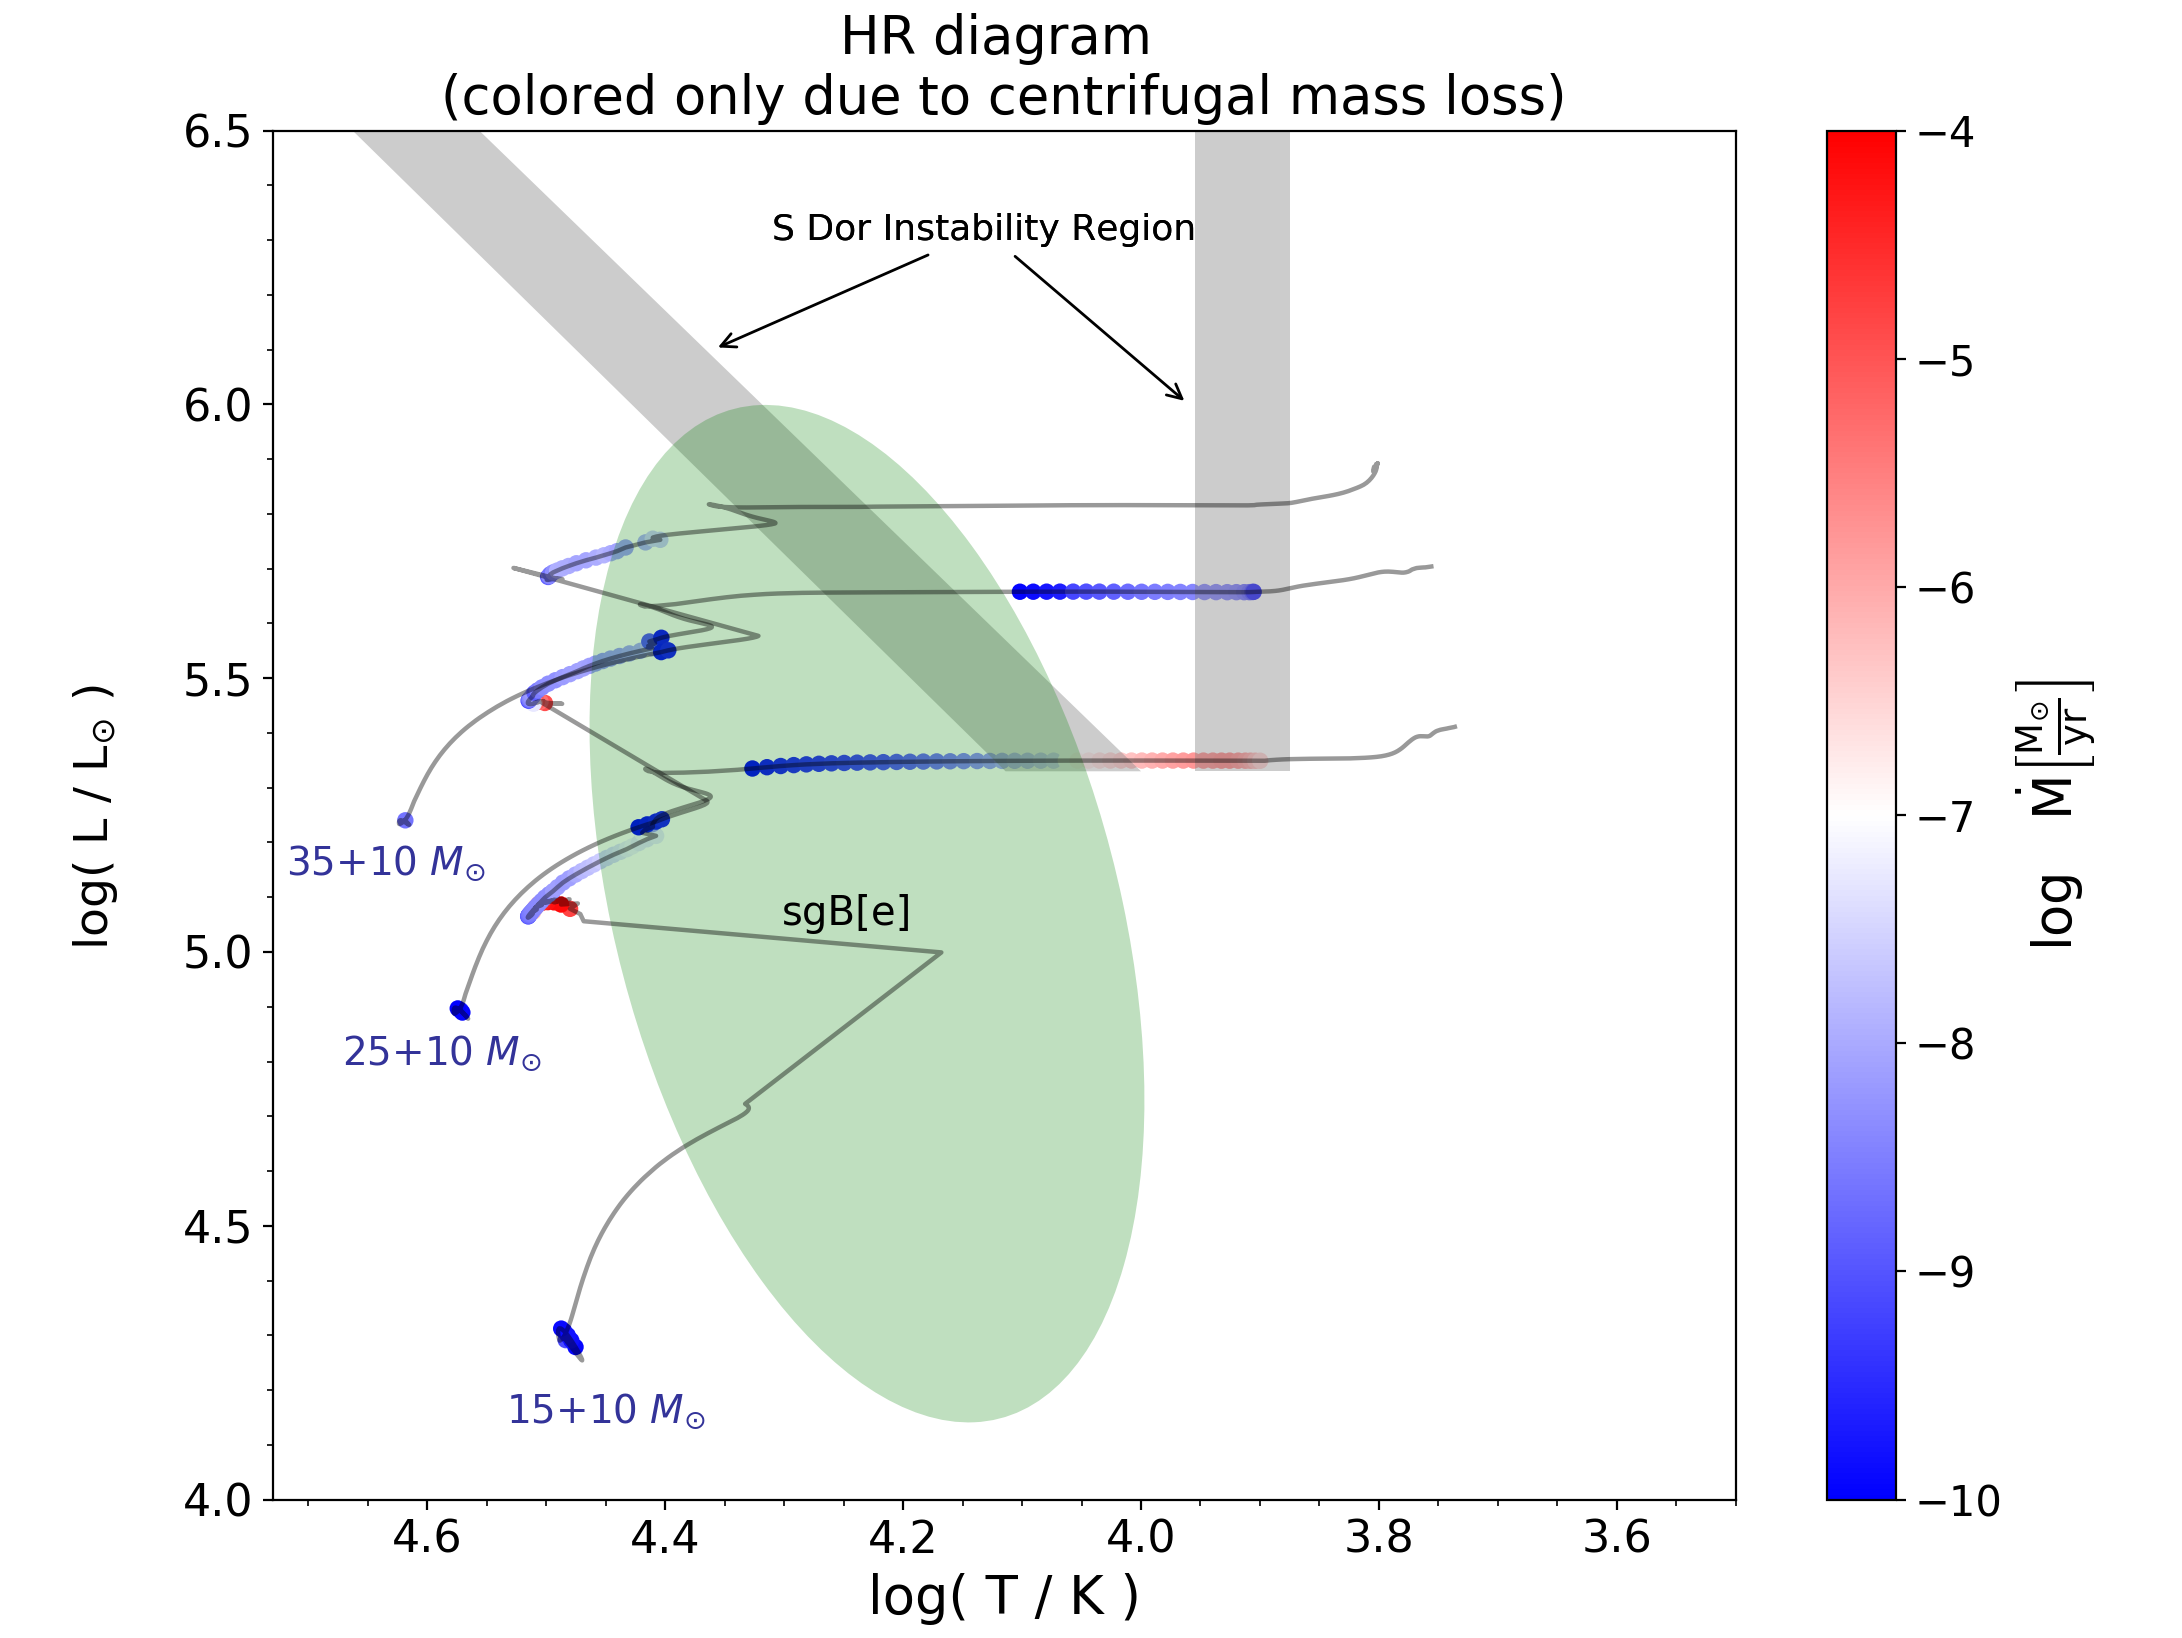
Figure 9 shows HR diagrams of our binary models. We can see that centrifugal mass loss rates of are achieved for the 15+10 model as it crosses the Hertzsprung gap, similar to the model in Figure 5. The more massive models lose more AM via winds, but the 25+10 model exhibits more centrifugal mass loss than a 35 single star due to the replenished AM described above. Hence, stellar merger events that occur near the end of the MS can generate more rapidly rotating stars that are more likely to exhibit centrifugally driven outbursts.
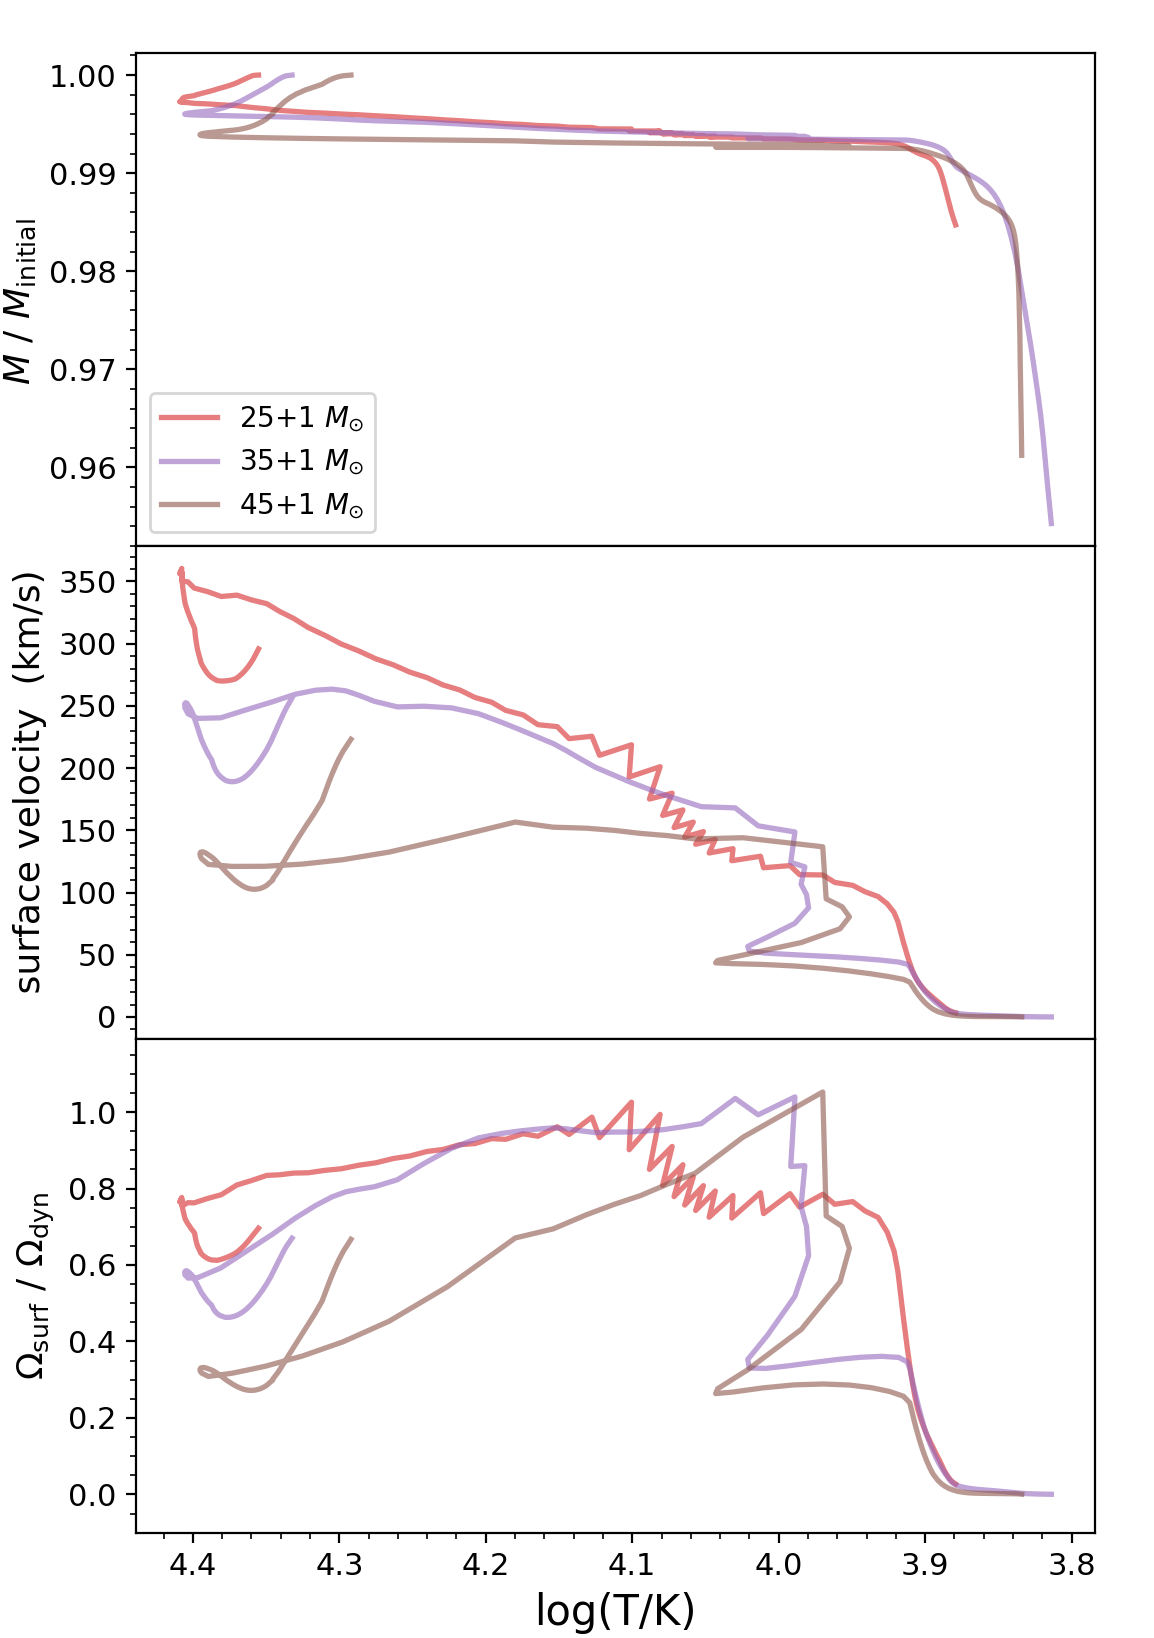
Massive stars have small moments of inertia, with near the end of the MS (Figure 1), such that only small amounts of mass accretion can greatly increase their spin. A large increase in the AM of the primary star can be achieved after accreting a small mass , and a merger suffices to spin up the primary to the break-up limit and trigger centrifugal effects. To demonstrate the centrifugal mass loss generated by ingesting a small companion, we run models with the same ingredients as described above, except that they have initial masses of 25, 35, and 45 and they gain 1 during mass transfer.
Figure 10 displays the evolution of these models. Compared with Figure 4 and 8, the post-MS ratio substantially increases, making centrifugal mass loss much more important. The reason is that ingesting only spins the primary up to breakup, but it hardly increases the MS lifetime, so the primary is unable to lose much mass through stellar winds after the accretion event. These stars thus enter the post-MS with much more AM, making them more prone to centrifugal mass loss when the core contracts and the star crosses the HR diagram.
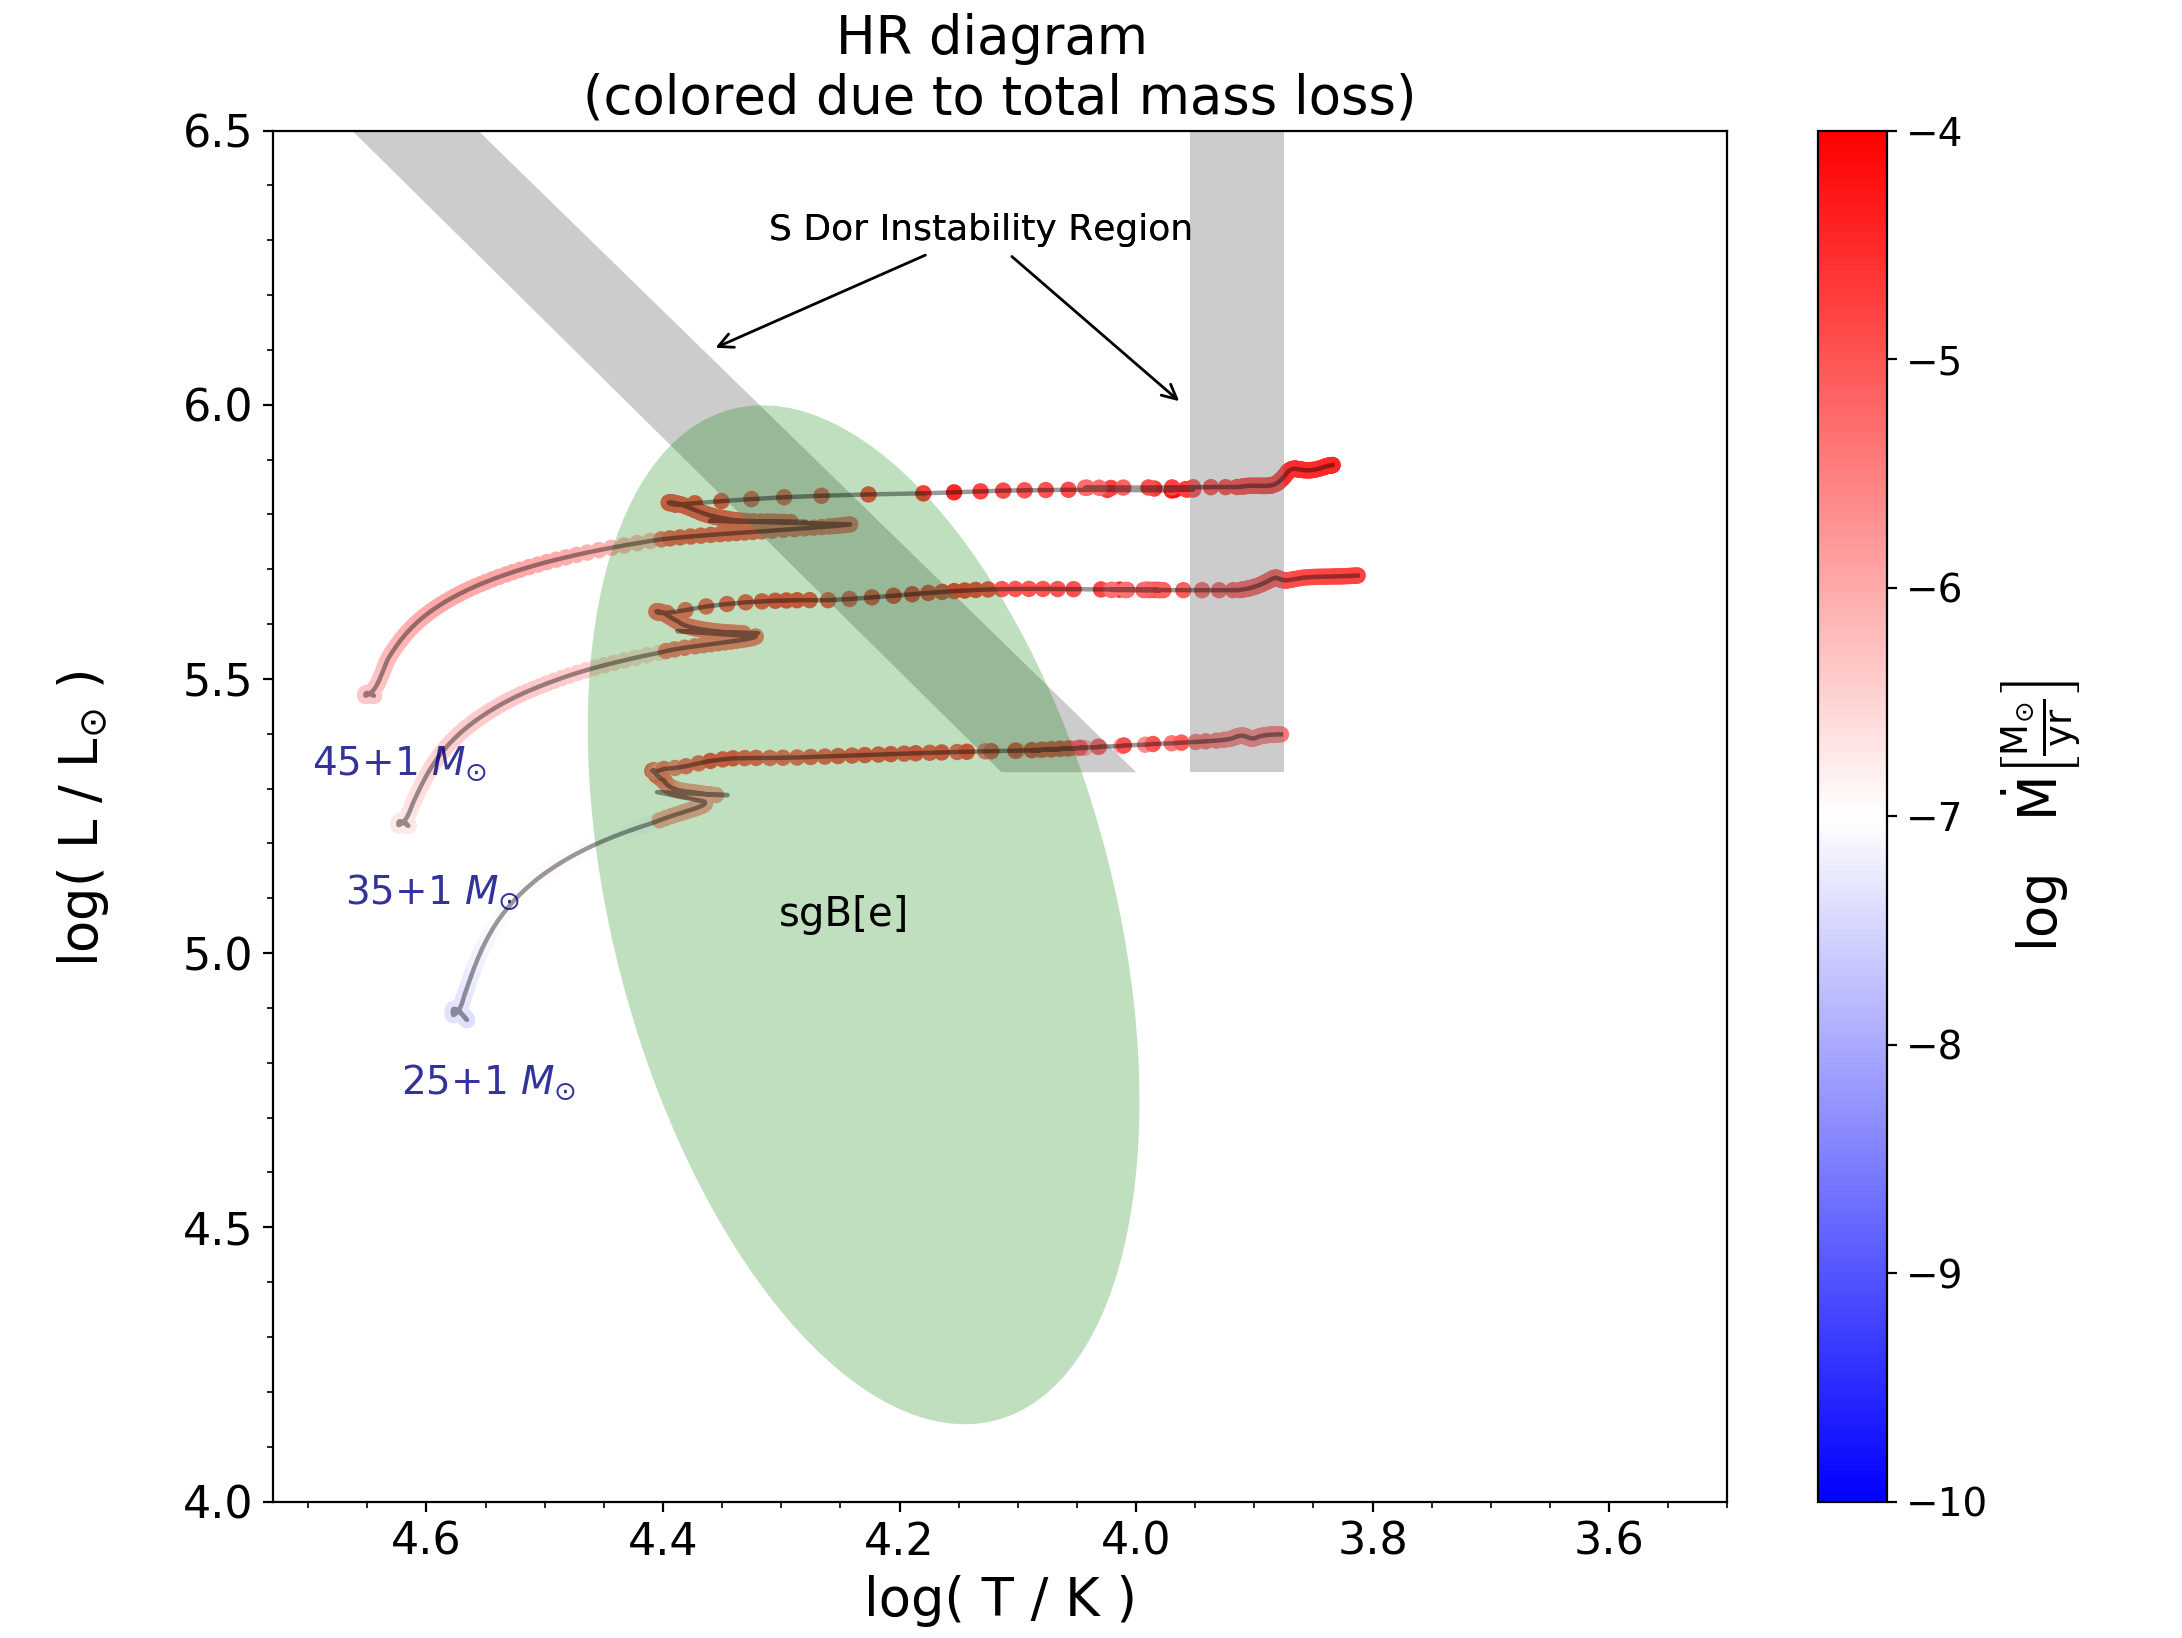
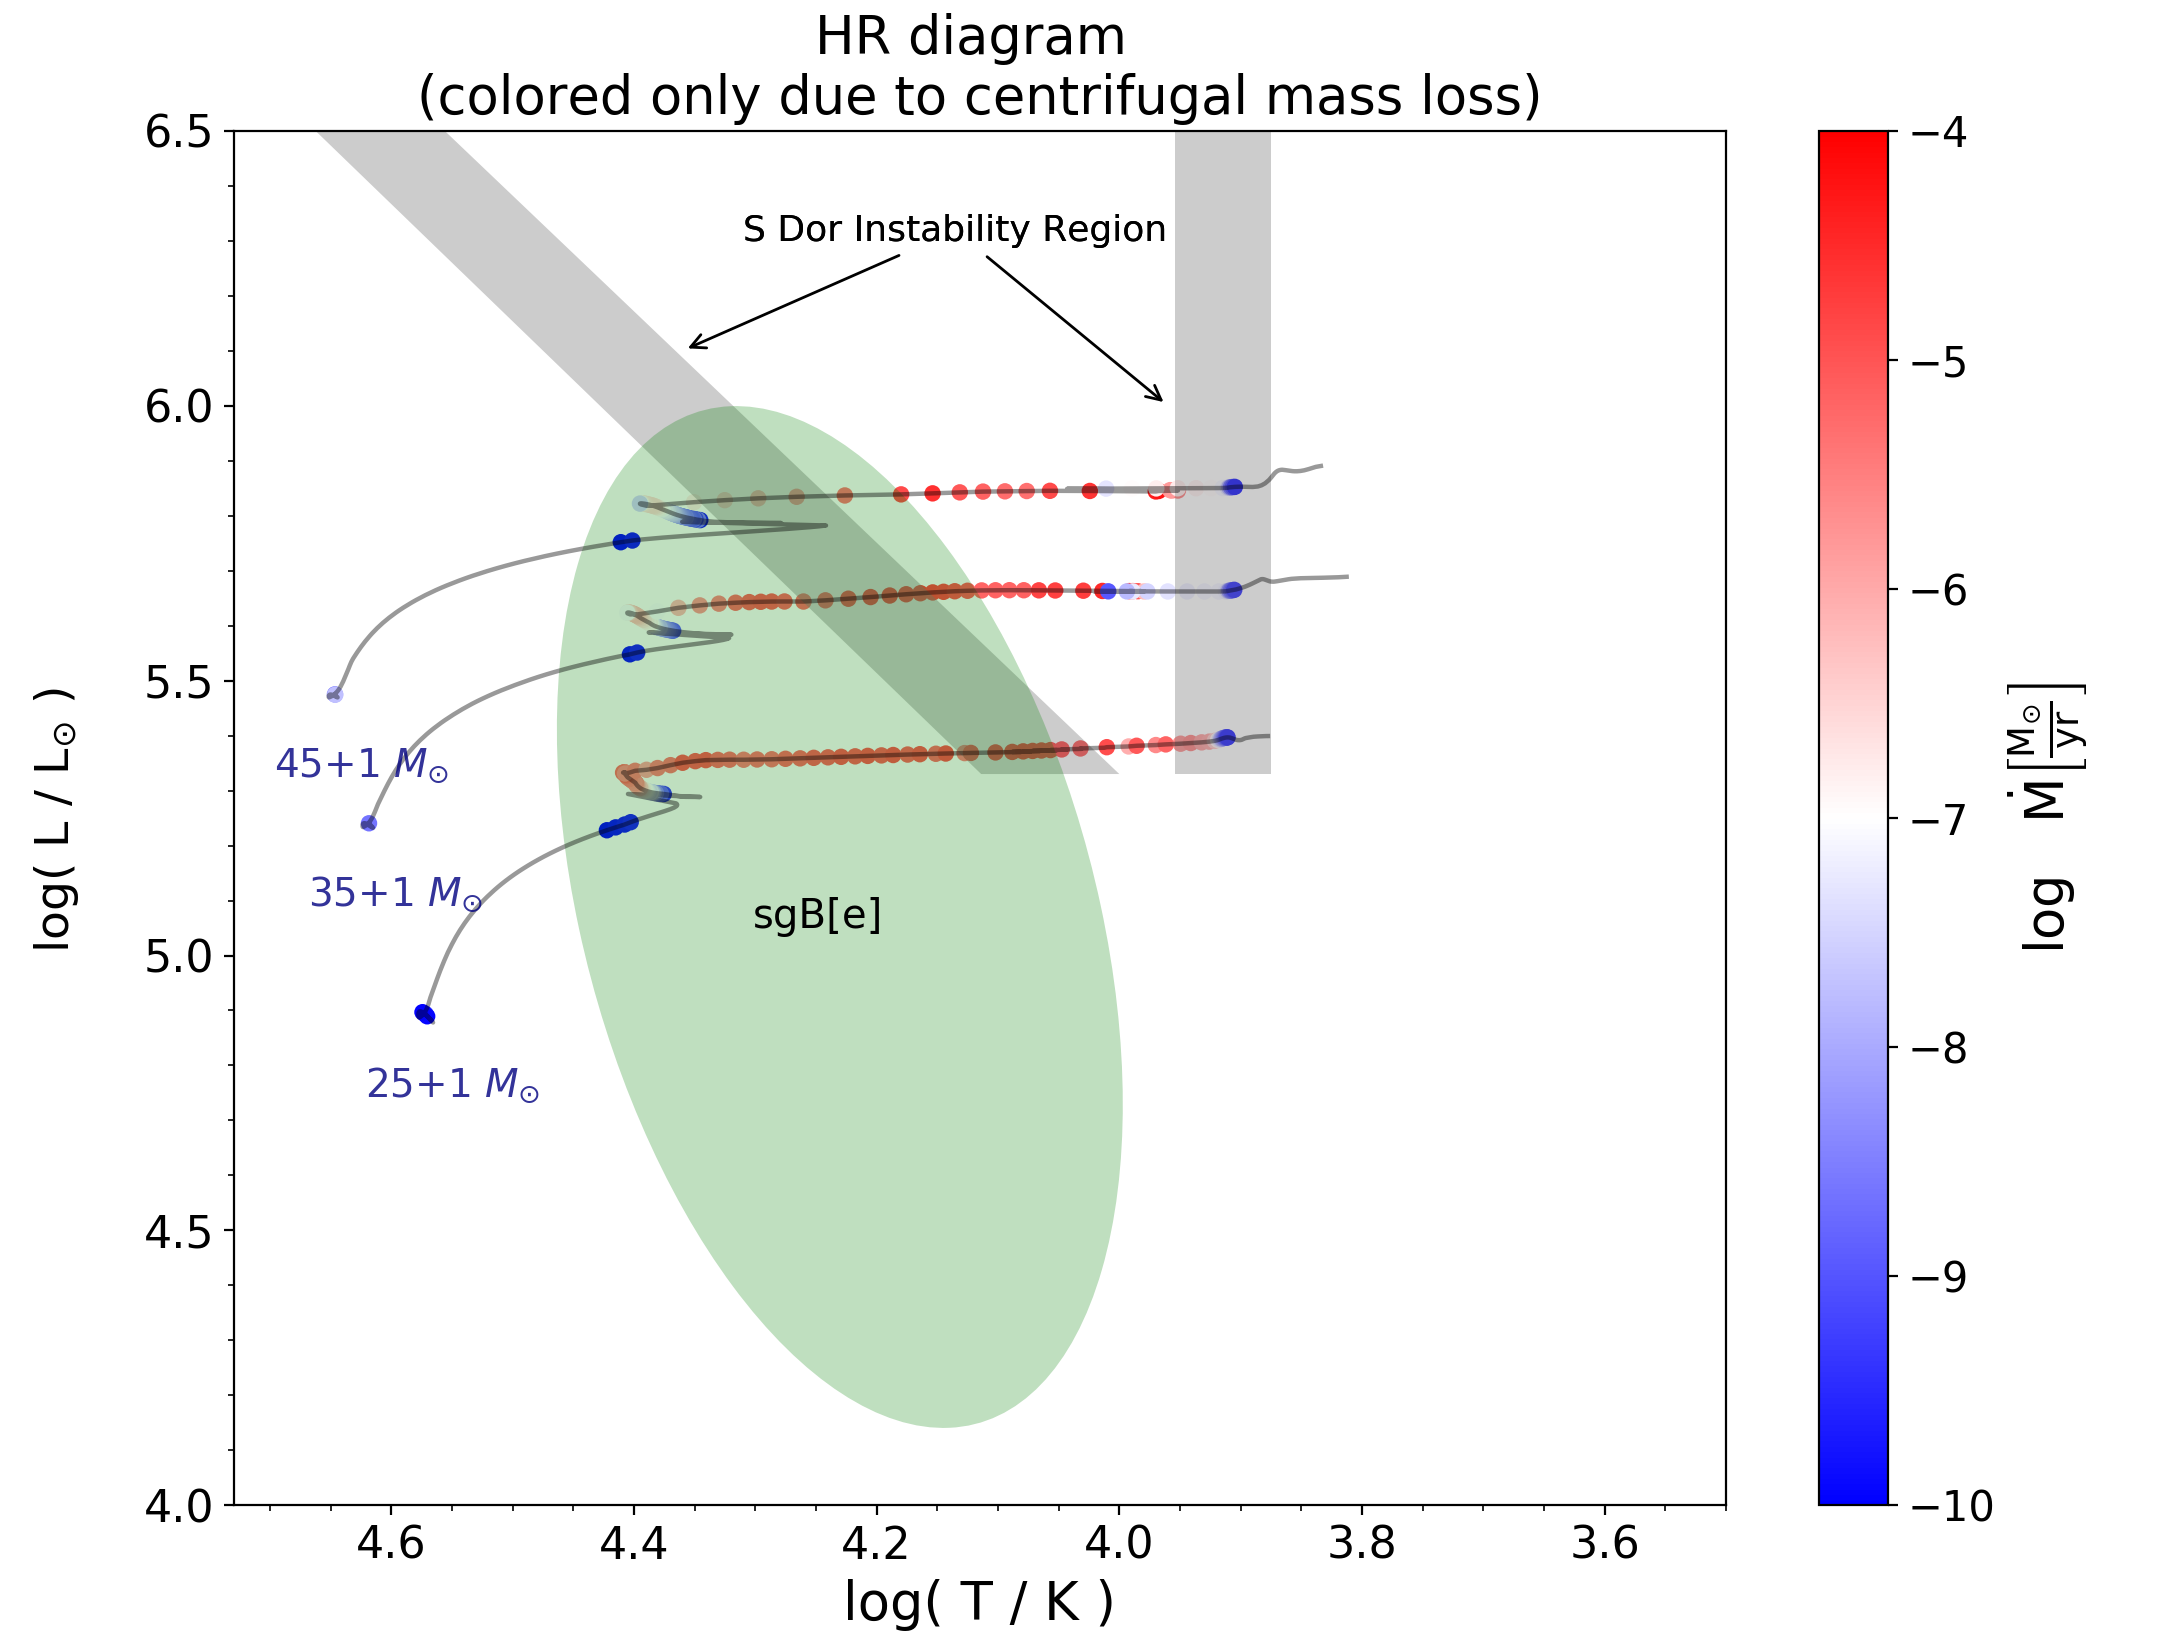
From the HR diagram in Figure 11, it is clear that small amounts of mass accretion greatly intensify centrifugal mass loss rates of all models. The effect is most prominent for the model, where large centrifugal mass loss rates of greater than are achieved within the S Doradus instability region. In contrast, centrifugal effects are nearly negligible when there is no mass gain, due to AM loss by winds (Figure 5). Hence, assimilating a small companion at the end of MS can fuel vigorous centrifugal mass loss during the post-MS, which could play a role in the variability or outbursts of some LBVs.
4 Centrifugal Instability
When centrifugal mass loss occurs, it could occur steadily, or in sporadic outbursts. To investigate the latter possibility, we perform a stability analysis of perturbations in rotating stars, including the centrifugal force. In our simplified calculation, we focus on adiabatic quasi-radial perturbations. Consider the perturbation of a shell with radius inside the star, such that the perturbed radial coordinate is:
| (17) |
with time-dependence
| (18) |
Unstable perturbations occur when , and the existence of growing modes signals an instability that could result in mass loss through outbursts.
The Lagrangian perturbation to the specific angular momentum is
| (19) |
where is a shellular rotation rate. We now introduce a factor describing the change in rotation rate
| (20) |
For conserved specific AM , we have , while for efficient AM transport during the pulsation, we have hence . Usually AM is thought to be conserved, but if the plasma is threaded by a magnetic field, for example, magnetic torques could enforce nearly constant rotation and an increased specific AM (at the expense of AM from other layers). The spherically averaged radial component of the centrifugal force over a shell is computed as:
| (21) |
The spherically averaged perturbation to the centrifugal force is then
| (22) |

Next, we have the perturbed continuity equations
| (23) |
For simplicity, we consider homologous perturbations to the stars such that , so that
| (24) |
This assumption essentially restricts our analysis to modes with long wavelengths in the outer part of the star, i.e., similar to radial fundamental modes in the envelope (though potentially with more complicated dependence in the core). We also assume adiabatic pulsations such that
| (25) |
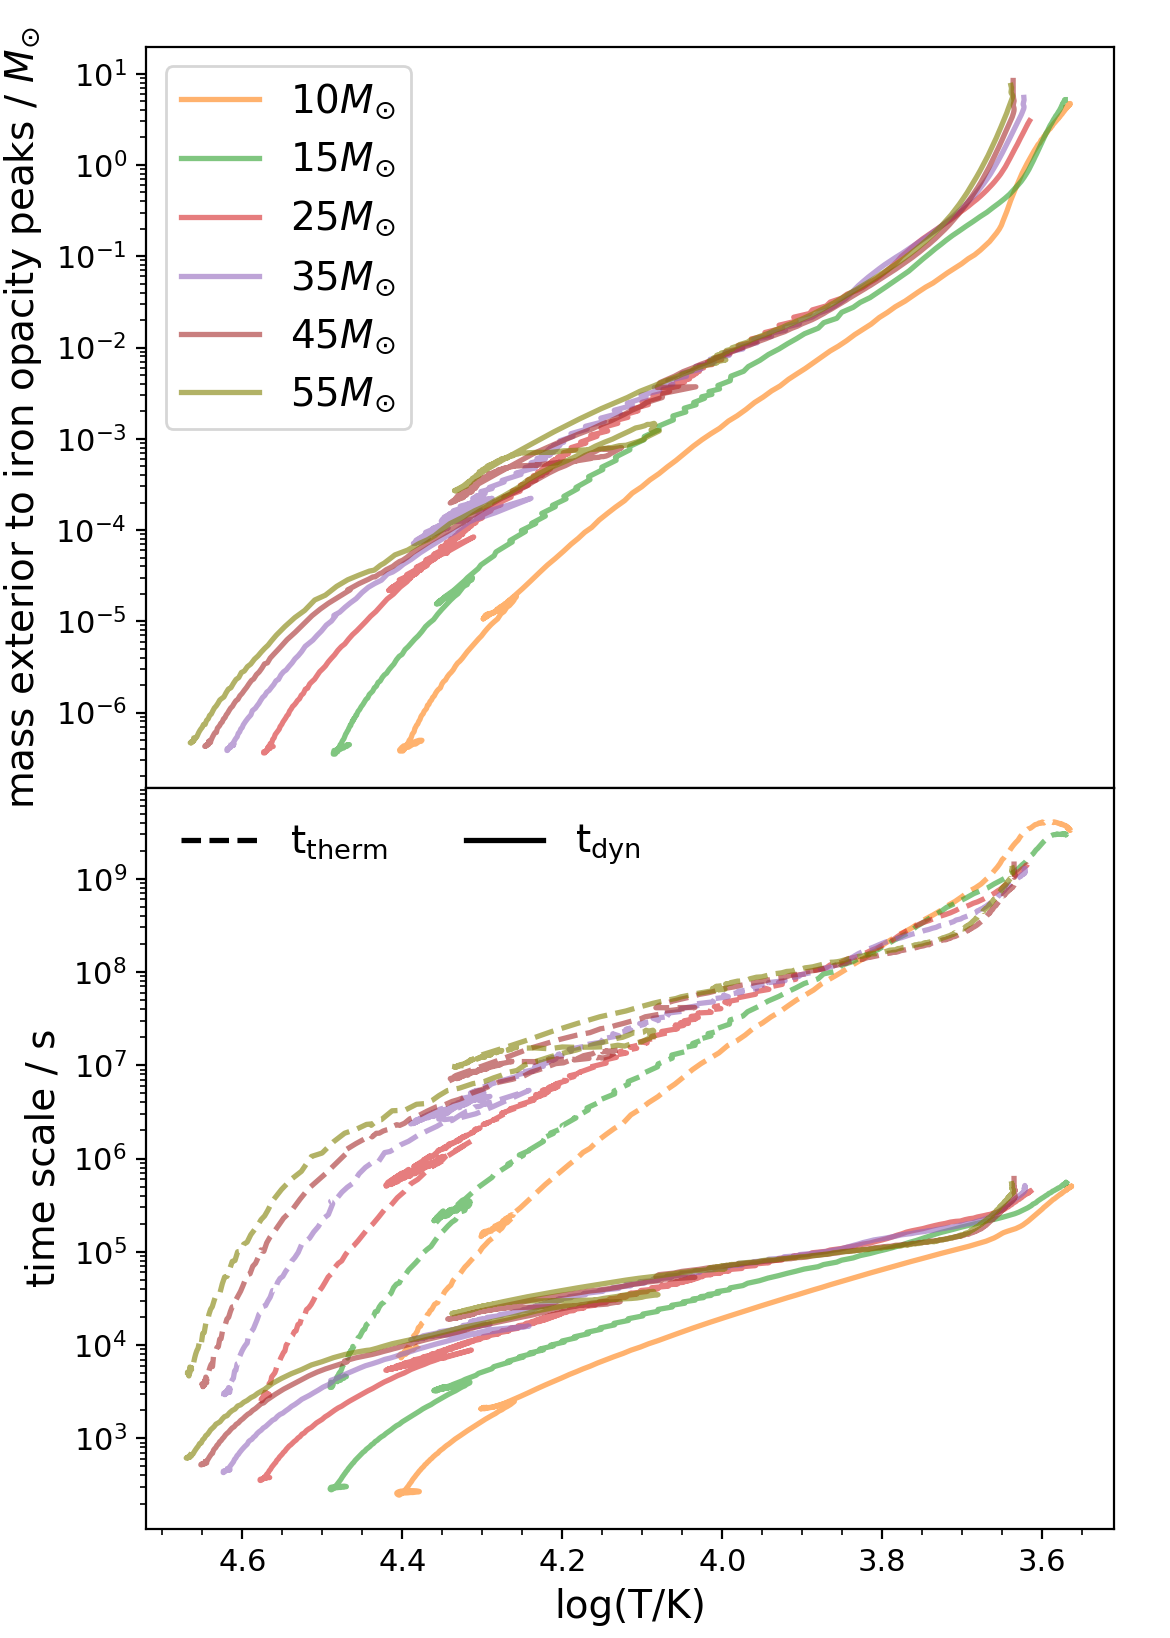
We shall see that instability is most likely to occur near the iron opacity bump in the outer layers of the star. To justify our adiabatic approxiation, Figure 13 shows the thermal time scale and dynamical timescale near the iron opacity peak, where is the pressure scale height. The thermal timescale is typically a few orders of magnitude larger than the dynamical time scale, indicating that heat can not diffuse efficiently and an adiabatic approximation is reasonable. Consequently, our analysis does not include strange modes trapped in outermost layers where non-adiabatic growth/damping rates can be very large.
Next, by perturbing the radial Navier-Stokes equation, we have:
| (26) |
where is the perturbed radial velocity, and the background on which we perturb satisfies . Note we have ignored the Coriolis force, which we justify in Appendix A under certain conditions.
The perturbed gravitational force is:
| (27) |
To compute , recall in equation 4 we have , and
| (28) |
The last line follows from our assumption that varies slowly, whereas varies over a pressure scale height that is typically much smaller than near the iron opacity peak.
To summarize, the relation between and other perturbed quantities is
| (29) |
From hydrostatic equilibrium, . Then, plugging in equations 18, 4, and 4 into 4, we finally obtain an expression for :
| (30) |
Equation 30 is similar to the classic result for non-rotating stars, which become less stable as decreases toward , but with an extra term proportional to the centrifugal force. We note that our local result is very similar to the global result derived in Ledoux (1945) (see also Tassoul 1978), in the limit that AM is conserved (), in which case the centrifugal term is actually stabilizing for as we expect in massive stars. However, our formula allows for the destabilizing influence of torques that conserve rotation rate instead of AM (), in which case the centrifugal term is destabilizing. In this case, instability occurs even at relatively small values of , as small as for , and even smaller values for .
In Figure 12, we examine the structure of a star with an effective temperature K. The iron opacity peak occurs at a mass coordinate of , and is also associated with a peak in internal energy density, sound speed, and outward radiation force, as well as a dip in . At mass coordinates above this location, we see the local value of becomes negative, indicating an instability could originate from this location in the star. While the value of is even more negative closer to the surface of the star, our adiabatic approximation could break down there.
Our perturbation analysis is crude and not suitable for robust predictions. The main point is to highlight the destabilizing influence of the centrifugal force for any perturbation in which AM can be transported rapidly (i.e., shorter than an oscillation time scale). Since the fundamental mode frequencies of polytropes approach zero in the absence of rotation, their long pulsation periods will allow for more AM transport during the pulsation cycle, further destabiliizing them relative to polytropes of higher . The growth of such a perturbation is fueled by energy added to the outwardly perturbed fluid element via these (presumably magnetic) torques. Of course, the star must conserve its total AM, so the inner layers must contract (or at least expand by a smaller fraction) in order for the outer layers to gain energy and AM during the pulsation cycle. Hence, the pulsation mode cannot everywhere have the dependence we have assumed, but must have more complex spatial structure, as we should expect for realistic stars with kinks in their density profiles (Figure 13).
Crucially, this centrifugal instability does not require super-Eddington luminosities or near-breakup rotation at the surface of the star, which are the criteria usually examined for massive stars. Instead, the instability is promoted by a low adiabatic index and high rotation rate inside the star, and it feeds on the internal energy and rotational energy of sub-surface layers. The instability is most likely to occur in the outer layers of post-MS massive stars where approaches over a significant fraction of the stellar radius, unlike some MS models where the iron opacity bump is located at a radius very close to the photosphere. Hence, instabilities causing outbursts are more likely to occur in very luminous stars post-MS such as LBVs, and are less likely to occur in MS stars such as Be stars.
We have performed exploratory one-dimensional hydrodynamic simulations with MESA, including centrifugal forces and AM transport. These simulations do indeed give rise to an instability near the end of the MS, approximately when we find near the iron opacity bump. The instability only occurs in rotating models, but it occurs even at moderate rotation rates well below breakup. Hence we believe the instability is essentially the same as that predicted by equation 30. The outcome can be a steady centrifugally driven wind, or a periodic expansion and contraction of the stellar envelope. While such expansion/contraction does occur in S Doradus outbursts, it typically occurs on a timescale of weeks in these models, much faster than the slow observed variability of S Doradus cycles. The instability may saturate when the expanding envelope expands and cools, increasing its adiabatic index and the value of . A detailed investigation requires much more work, but these preliminary numerical calculations (which are global and include non-linear effects) do indicate the presence of a centrifugally driven instability.
If an instability does occur, the outcome is not clear, but it could result in centrifugal ejection of material overlying the iron opacity peak. Figure 13 plots the mass exterior to the iron opacity peak for stars evolving across the HR diagram. Where centrifugally driven mass loss is most likely to occur, i.e., , the associated mass is . While centrifugal instability may be able to power Be star outbursts and S Doradus outbursts, it likely cannot power giant eruptions from LBVs that eject more than of material.
5 Discussion
The centrifugal effect included in our models is an important factor in stellar evolution since many massive stars will reach the break-up limit when they evolve off the MS. We find that such an effect is greater for more massive and lower metallicity stars, especially when they are crossing the Hertzsprung gap. At this stage, centrifugal mass loss rates as large as are achieved as shown in Figures 3, 5, and 7. However, for massive stars in high-metallicity regions with strong line-driven winds, centrifugal mass loss becomes less important because stellar winds carry away most of the star’s AM, preventing the star from reaching the break-up limit during the post-MS. Below we discuss implications and caveats of our findings.
5.1 The Be Star Phenomenon
Be stars are known to be very rapidly rotating, often near their breakup velocities (Rivinius et al., 2013), but their formation is not totally understood. Our work suggests that some Be stars can be produced as a result of core contraction and surface rotational acceleration due to efficient AM transport. This single star scenario, proposed by Maeder & Meynet (2001), also explains the higher abundance of Be stars in slightly aged populations (older than 10 Myr) and stars near the TAMS (Keller et al., 2000; Aidelman et al., 2018), because more envelope spin-up occurs as stars age and evolve toward the TAMS. Additionally, the larger abundance of Be stars in low-metallicity environments (Peters et al. 2019 and references therein) is naturally explained by the smaller mass/AM loss through winds (rather than having to appeal to larger rotation rates at birth), allowing more stars to reach their breakup rotation rate.
Ekström et al. (2008) predicted the number of stars that reach breakup via this channel during the MS and then compare with the observed fraction of Be stars in clusters at various metallicities. However, they underpredict the observed fraction of Be stars by a factor of a few. While a few effects could account for this discrepancy, an important difference is that their AM transport prescription only accounts for Eddington-Sweet circulation and hydrodynamic turbulence. Consequently, their models (and those in most papers by the Geneva group) exhibit significant differential rotation on the MS, with surface rotation reduced by inefficient AM transport from core to surface. Ekström et al. (2008) agrees that inclusion of magnetic torques via the Tayler-Spruit (TS) dynamo (Spruit, 2002) would increase AM transport and Be star formation. In the late stages of preparation of this manuscript, Hastings et al. (2019) examined Be star formation in models including AM transport via the TS dynamo. They indeed find a higher rate of Be star formation, approximately consistent with observations if Be star are formed when .
Since we now know that AM transport in radiative regions of stars is even more efficient than the TS dynamo predicts (Cantiello et al., 2014), a larger fraction of Be stars should be produced. Because our AM transport prescription and the TS dynamo predict nearly rigid rotation during the MS, we expect to find similar results to Hastings et al. (2019) for MS stars, though we have not performed a full population synthesis calculation. Like Hastings et al. (2019), we find a ’goldilocks’ range of (at solar metallicity) where Be star formation is most efficient, the lower bound arising from a smaller core mass and the upper bound from larger wind AM losses. The upper bound extends to larger mass/luminosity in low-metallicity environments. If AM is transported in radiative zones via fossil fields (Kissin & Thompson, 2015), AM transport is even more efficient than our estimates, further promoting Be star formation. Our results show that Be formation is most likely to occur in stars just beyond the MS and could also contribute to the population of B[e] supergiants (Kraus, 2019). However, because stars evolve across the HR gap extremely quickly, post-MS Be stars will likely be outnumbered by MS Be stars.
Some aspects of Be stars remain difficult to explain with our single star models. For instance, like Hastings et al. (2019), our single star models predict that Be stars are much more common near the TAMS, whereas only a mild increase is observed. Additionally, we may expect higher levels of nitrogen enrichment than observed. Furthermore, we cannot readily explain the higher incidence of Be stars in massive clusters (Bastian et al., 2017) and the apparent bimodal spin distribution, which may require binary and/or environmental effects. All of this evidence may point to a large fraction of Be stars arising from binary channels in which the Be progenitor accreted mass/AM from a companion star. Indeed, binary models of Be star formation (Pols et al., 1991; Shao & Li, 2014) can account for a large fraction of the Be star population. de Mink et al. (2013) showed that the fraction of rapidly rotating post-mass transfer systems expected from binary population synthesis is similar to the observed number of Be stars. Our binary models in Section 3.5 show that Be star formation is certainly promoted by mass accretion, either via stable mass transfer or stellar mergers. Hence, we agree that a substantial fraction of Be stars arise from binary interactions, but we reaffirm that they can produced by single stars, especially in low-metallicity environments.
5.2 The LBV Phenomenon
An implication of our work is that centrifugally driven mass loss could be related to LBV outbursts, especially S Doradus variations. Indeed, the centrifugal mass loss rates we predict are similar to LBV mass loss rates of a few /yr during S Doradus outbursts (Smith, 2014, 2017). Intriguingly, we predict the highest mass loss rates for stars near the S Doradus instability region (Figure 3), because this is when the cores of very massive stars are contracting rapidly and providing AM to the surface layers, driving rapid centrifugal mass loss. While measuring the rotation rates of LBVs is difficult, Groh et al. (2006); Groh et al. (2009) has indeed demonstrated that some LBVs exhibit very rapid rotation, near their breakup rates, consistent with our suggestion of centrifugally driven outbursts.
We note that our models predict post-MS centrifugally driven mass loss to be most common for solar metallicity at masses of , or luminosities of , near or below the bottom of the LBV region shown in Figure 5. In light of the lower masses and luminosities recently measured for some LBVs (Smith & Tombleson, 2015; Smith, 2019; Smith et al., 2019), the instability region should be revised downward. Since our models do not rely on super-Eddington mass loss, these low-luminosity LBVs could naturally be explained by the centrifugal mass loss processes we have investigated. Smith et al. (2019) also showed that some LBVs lie to the left of the classical S Doradus instability strip, a feature also seen in many of our models (e.g., Figures 7 and 11). Our models also predict high-luminosity LBVs to be more common in low-metallicity environments where wind mass loss is less important.
In this picture, LBVs may simply represent stars at the luminous end of a continuum of stars exhibiting centrifugal mass loss. This continuum could extend from Be stars at luminosities of just , through sgB[e] stars with luminoisties of , all the way to LBVs with . The observational characteristics may be quite different, especially since the massive end of this continuum has near-Eddington luminosities, while radiative acceleration is negligible for ordinary Be stars. Hence, we may not expect to see centrifugally expelled decretion disks around LBVs like we do in Be stars, because such disks would quickly blown away by radiation force, or they would collapse due to ’Poynting-Robertson’ drag (Owocki et al., 1998) on lines of iron-group elements.
The centrifgual mass loss and/or outburst process may also be quite different in stars of different types. In MS Be stars, the iron opacity peak is relatively near the photosphere, where the overlying mass is small (, Figure 13) and the thermal time is small, promoting shorter and less violent (or non-existent) outbursts. In contrast, for post-MS LBV stars, the mass of the iron opacity peak can be much deeper, where the overlying mass is larger () and the thermal time is large, promoting longer and more violent outbursts. Outbursts of more massive stars may also be more common and more violent due to the role of radiation pressure, though a detailed prediction of centrifugally driven outbursts in LBVs awaits future work. For now, it remains difficult to explain the giant eruptions of LBVs like Carina, which can expel more than of material (Smith et al., 2003; Smith & Ferland, 2007). While the iron opacity peak can extend to such depths in yellow/red supergiants, this occurs when the surface convection zone becomes very deep, the star’s moment of inertia and spin period increases rapidly, and centrifugally driven mass loss is not expected to occur.
5.3 Case B Stellar Mergers
In Section 3.5, we showed how case A mass accretion near the end of the MS (as could result from a stellar merger) can intensify centrifugal mass loss when the star evolves off the MS. It would also be interesting to investigate case B mass accretion that can occur when the star crosses the Hertzsprung gap and can swallow a small companion. Justham et al. (2014) performs a detailed investigation of the evolution of such merger products (not including updated AM transport prescriptions). Unlike our case A merger products that resemble single stars of increased mass that usually evolve into red supergiants, case B mass accretion produces stars that typically spend the rest of their lives as blue/yellow supergiants residing near the LBV instability strip. These stars do not evolve into red supergiants with large moments of inertia, and their cores continue to contract as they evolve. Hence, they could potentially exhibit centrifugal mass loss throughout helium-burning until core-collapse. Centrifugal mass loss from such stars could produce some LBV stars, and it could contribute to pre-SN outbursts of type IIn progenitor stars, some of which are known to resemble LBVs (e.g., Gal-Yam & Leonard 2009; Smith et al. 2010; Mauerhan et al. 2013; Ofek et al. 2013; Ofek et al. 2014; Smith et al. 2014; Smith 2014; Elias-Rosa et al. 2016; Tartaglia et al. 2016).
5.4 Comparison with Observed Rotational Velocities
It is useful to compare our predictions with observed rotation rates of evolving massive stars, and with prior stellar models. Several studies (Huang & Gies, 2006a; Hunter et al., 2008; Dufton et al., 2013) have indicated a range of initial rotation rates for MS massive stars, with typical rotation rates in the range km/s, and a small tail extending to higher velocities. Our models with 200 km/s are thus fairly typical massive stars, or perhaps slightly more rapidly rotating than average.
Measurements of post-MS rotation rates are more sparse but very informative, and have been made both in the LMC and SMC (Dufton et al., 2006a; McEvoy et al., 2015) and in the Galaxy (Fukuda, 1982; Verdugo et al., 1999; Abt et al., 2002; Abt, 2003; Huang & Gies, 2006b). These works find fairly small rotational velocities for most A/B-type supergiant stars (which presumably have just evolved off the MS), with many in the range 0-100 km/s, and decreasing rotation towards lower temperature/gravity. For relatively low-mass () sub-giants, nearly solid body rotation and nearly constant rotational velocity on the MS appears to match the data fairly well (Abt et al., 2002; Huang et al., 2010). Agreement with our models and others (e.g., Meynet & Maeder 2000; Heger et al. 2000; Ekström et al. 2008) is fairly good on the MS where they predict smaller amounts of differential rotation. However, our modeled rotational evolution (Figures 4 and 6) predict slightly faster rotation than typically observed after the TAMS. In post-MS stars, the surface rotational velocity falls faster than expected from solid-body rotation (Verdugo et al., 1999; Abt, 2003), and is below the predictions of our models. While our models do develop differential rotation after the TAMS, the level of differential rotation is less than most other models.
Possible explanations for these discrepancies are that our AM transport prescription predicts too much core-envelope coupling, or that our wind prescription predicts too little mass loss. However, the works presented above point out that models with weaker AM transport and stronger winds (e.g., Meynet & Maeder 2000, 2003) also predict rotation rates somewhat larger than observed in many cases. So, the source of the discrepancy is unclear. Some blue supergiants could be helium-burning stars on a blue loop that could have spun down via mass loss during a red supergiant phase (though blue loops can also cause fast rotation if the star did not lose much AM as a supergiant, Heger & Langer 1998). It has also been pointed out (Townsend et al., 2004) that in stars with significant centrifugal distortion, the spectrum is dominated by polar regions (due to gravity darkening near the equator) where the rotational velocity is small, so observed rotational velocities do not represent surface-averaged rotation speeds. Lastly, many of the studies discussed above do not include Be stars, which are the fastest rotating stars, and so those studies are biased towards the slowly rotating end of the distribution.
A final important possibility to consider is that convective regions do not rotate rigidly as assumed in nearly all stellar evolution codes, but instead exhibit strong differential rotation as suggested by Kissin & Thompson (2015). Massive post-MS stars begin to develop deep convective envelopes due to helium/iron opacity peaks for surface temperatures smaller than 20,000 K, or even higher temperatures for stars near the Eddington limit. If these convective zones rotate differentially, the surface rotation rate can be slower than the rotation rate at the top of the radiative region. In this case, modeled surface rotation rates may better agree with data and may remain smaller than the surface breakup rate. The internal rotation rate, however, could still exceed the breakup rate, and centrifugal mass loss could occur via instabilities as discussed in Section 4. This could help explain why post-MS mass loss sometimes occurs via large eruptions emanating from deeper layers of the star, in contrast to the small outbursts typical of Be stars apparently originating near the surface. We hope to explore this possibility in future work.
5.5 Model Uncertanties
A significant uncertainty in our analysis is the structure of the outer layers of very luminous models, where convection becomes inefficient and the flux is locally super-Eddington due to iron and helium opacity bumps. Our models use MESA’s MLT++ prescription for handling these layers (Paxton et al., 2013), resulting in a more compact envelope than models without a similar prescription (e.g., Sanyal et al. 2017). Neither set of models is perfect, and radiation hydrodynamics simulations (Jiang et al., 2015, 2017, 2018b, 2018a) may be needed to guide the construction of better models. In any case, we suspect centrifugal mass loss will be more important if stars develop inflated envelopes. Since these envelopes have very low masses but large radial extents (especially at high metallicity), they decrease the star’s rotational breakup rate without significantly increasing the star’s moment of inertia. Hence the maximum AM content of such stars may be smaller than our models, making them more susceptible to centrifugal mass loss.
A second uncertainty is that of line-driven wind mass loss rates. For hot stars, we adopt the widely used Vink prescription (Vink et al., 2001), but reduced by a factor of two. If the appropriate reduction factor is even larger, as advocated in many recent works (see review in Smith 2014), then stars will lose less AM on the MS and centrifugal mass loss will become more important. The main effect of less efficient winds is similar to that of lower metallicity: an upward shift in the maximum stellar mass/luminosity to which centrifgual mass loss extends.
6 Conclusion
We have examined the rotational evolution of massive stars, examining whether their outer layers can spin fast enough to centrifugally expel matter. Unlike most prior analyses (e.g., Ekström et al. 2008; Hastings et al. 2019), we incorporate very efficient angular momentum (AM) transport within our stellar models as required by asteroseismic observations (e.g., Mosser et al. 2012; Cantiello et al. 2014; Gehan et al. 2018; Fuller et al. 2019). Additionally, we extend our models past the main sequence to investigate post-main sequence centrifugal mass loss. We find that efficient AM transport from the contracting core to the expanding envelope can sometimes spin up the surface layers to breakup, necessitating centrifugal mass loss. Centrifugal mass loss is most prolific near the end of the main sequence and the early post-main sequence as massive stars cross the Hertzsprung gap. During these phases of evolution, the expanding envelope contains very little mass and the core contracts rapidly, donating enough AM to spin up surface layers towards breakup velocities.
At solar metallicity, this effect is strongest for stars (Figure 5), with some dependence on wind mass loss rates. Lower mass stars have smaller core masses/radii such that the core’s contraction is not sufficient to spin up outer layers. Higher mass stars lose most of their AM via line-driven winds, preventing centrifugal mass loss. At low metallicity, the line-driven mass loss weakens, promoting centrifugal mass loss, especially in more massive stars (Figure 7). While centrifugal mass loss may generate circumstellar ’decretion’ disks and could drive outbursts, it cannot expel the entire hydrogen envelope, and radiatively driven winds or binary interactions are still responsible for the bulk of mass loss. We confirm that some Be stars can form from rapidly rotating single stars due to outward AM transport within the star. However, in many stars, accretion from a binary companion is likely crucial for supplying enough AM to drive centrifugal mass loss. Hence, both effectively single and binary stellar evolution may contribute substantially to the Be star phenomenon. Interestingly, stars that accrete a small amount of mass () near the end of the MS are most prone to post-MS centrifugal mass loss (Figure 11), because the merger spins them up without significant extending the MS lifetime and hence the AM loss due to line-driven winds.
We predict the largest centrifugal mass loss rates (/yr) for massive post-main sequence stars near the S Doradus instability strip. Hence, we posit that S Doradus variations and outbursts from some luminous blue variable stars (LBVs) are driven by centrifugal mass loss, in agreement with the apparent rapid rotation of some LBVs (Groh et al., 2006; Groh et al., 2009). Our prediction of extreme centrifugal mass loss extending down to masses of is similar to the lower end of LBVs observed in the Milky Way (Smith et al., 2019). However, the absence of such low-luminosity LBVs in the Magellanic clouds suggest metallicity may also be an important factor in driving LBV outbursts, perhaps due to a radiation-centrifugal instability (Section 4). Preliminary analytical and numerical calculations indicate a centrifugal instability could operate in massive stars crossing the Hertzspung gap, driven by AM transport into outwardly perturbed fluid elements. The instability can originate deep in the star (at the iron or helium opacity bumps) and could potentially drive outbursts that partially expel overlying layers. We hope to examine this instability and its relation to LBV outbursts in future work.
7 Acknowledgments
We thank Nathan Smith and Matteo Cantiello for very helpful suggestions. This research is funded in part by an Innovator Grant from The Rose Hills Foundation, and the Sloan Foundation through grant FG-2018-10515.
References
- Abt (2003) Abt H. A., 2003, ApJ, 582, 420
- Abt et al. (2002) Abt H. A., Levato H., Grosso M., 2002, ApJ, 573, 359
- Aerts et al. (2004) Aerts C., Lamers H. J. G. L. M., Molenberghs G., 2004, A&A, 418, 639
- Aidelman et al. (2018) Aidelman Y., Cidale L. S., Zorec J., Panei J. A., 2018, A&A, 610, A30
- Bastian et al. (2017) Bastian N., et al., 2017, MNRAS, 465, 4795
- Cantiello et al. (2014) Cantiello M., Mankovich C., Bildsten L., Christensen-Dalsgaard J., Paxton B., 2014, ApJ, 788, 93
- Castor et al. (1975) Castor J. I., Abbott D. C., Klein R. I., 1975, ApJ, 195, 157
- Deheuvels et al. (2014) Deheuvels S., et al., 2014, A&A, 564, A27
- Dufton et al. (2006a) Dufton P. L., Ryans R. S. I., Simón-Díaz S., Trundle C., Lennon D. J., 2006a, A&A, 451, 603
- Dufton et al. (2006b) Dufton P. L., et al., 2006b, A&A, 457, 265
- Dufton et al. (2013) Dufton P. L., et al., 2013, A&A, 550, A109
- Dwarkadas & Owocki (2002) Dwarkadas V. V., Owocki S. P., 2002, ApJ, 581, 1337
- Eggenberger et al. (2017) Eggenberger P., et al., 2017, A&A, 599, A18
- Eggenberger et al. (2019) Eggenberger P., den Hartogh J. W., Buldgen G., Meynet G., Salmon S. J. A. J., Deheuvels S., 2019, A&A, 631, L6
- Ekström et al. (2008) Ekström S., Meynet G., Maeder A., Barblan F., 2008, A&A, 478, 467
- Elias-Rosa et al. (2016) Elias-Rosa N., et al., 2016, MNRAS, 463, 3894
- Friend & Abbott (1986) Friend D. B., Abbott D. C., 1986, ApJ, 311, 701
- Fukuda (1982) Fukuda I., 1982, PASP, 94, 271
- Fuller et al. (2019) Fuller J., Piro A. L., Jermyn A. S., 2019, MNRAS, 485, 3661
- Gagnier et al. (2019) Gagnier D., Rieutord M., Charbonnel C., Putigny B., Espinosa Lara F., 2019, A&A, 625, A88
- Gal-Yam & Leonard (2009) Gal-Yam A., Leonard D. C., 2009, Nature, 458, 865
- Gehan et al. (2018) Gehan C., Mosser B., Michel E., Samadi R., Kallinger T., 2018, A&A, 616, A24
- Georgy et al. (2013) Georgy C., Ekström S., Granada A., Meynet G., Mowlavi N., Eggenberger P., Maeder A., 2013, A&A, 553, A24
- Glatzel (1998) Glatzel W., 1998, A&A, 339, L5
- Gräfener et al. (2012) Gräfener G., Owocki S. P., Vink J. S., 2012, A&A, 538, A40
- Granada et al. (2013) Granada A., Ekström S., Georgy C., Krtička J., Owocki S., Meynet G., Maeder A., 2013, A&A, 553, A25
- Groh et al. (2006) Groh J. H., Hillier D. J., Damineli A., 2006, ApJ, 638, L33
- Groh et al. (2009) Groh J. H., et al., 2009, ApJ, 705, L25
- Hastings et al. (2019) Hastings B., Wang C., Langer N., 2019, arXiv e-prints, p. arXiv:1912.05290
- Heger & Langer (1998) Heger A., Langer N., 1998, A&A, 334, 210
- Heger et al. (2000) Heger A., Langer N., Woosley S. E., 2000, ApJ, 528, 368
- Hirschi & et al. (2006) Hirschi R., et al. 2006, Reviews in Modern Astronomy, 19, 101
- Huang & Gies (2006a) Huang W., Gies D. R., 2006a, ApJ, 648, 580
- Huang & Gies (2006b) Huang W., Gies D. R., 2006b, ApJ, 648, 591
- Huang et al. (2010) Huang W., Gies D. R., McSwain M. V., 2010, ApJ, 722, 605
- Humphreys & Davidson (1994) Humphreys R. M., Davidson K., 1994, PASP, 106, 1025
- Hunter et al. (2008) Hunter I., Lennon D. J., Dufton P. L., Trundle C., Simón-Díaz S., Smartt S. J., Ryans R. S. I., Evans C. J., 2008, A&A, 479, 541
- Jiang et al. (2015) Jiang Y.-F., Cantiello M., Bildsten L., Quataert E., Blaes O., 2015, ApJ, 813, 74
- Jiang et al. (2017) Jiang Y.-F., Cantiello M., Bildsten L., Quataert E., Blaes O., 2017, ApJ, 843, 68
- Jiang et al. (2018a) Jiang Y.-F., Cantiello M., Bildsten L., Quataert E., Blaes O., Stone J., 2018a, arXiv e-prints, p. arXiv:1809.10187
- Jiang et al. (2018b) Jiang Y.-F., Cantiello M., Bildsten L., Quataert E., Blaes O., Stone J., 2018b, Nature, 561, 498
- Justham et al. (2014) Justham S., Podsiadlowski P., Vink J. S., 2014, ApJ, 796, 121
- Keller et al. (2000) Keller S. C., Bessell M. S., Da Costa G. S., 2000, AJ, 119, 1748
- Kissin & Thompson (2015) Kissin Y., Thompson C., 2015, ApJ, 808, 35
- Kraus (2019) Kraus M., 2019, Galaxies, 7, 83
- Langer (1998) Langer N., 1998, A&A, 329, 551
- Langer et al. (1999) Langer N., García-Segura G., Mac Low M.-M., 1999, ApJ, 520, L49
- Ledoux (1945) Ledoux P., 1945, ApJ, 102, 143
- Maeder (1999) Maeder A., 1999, A&A, 347, 185
- Maeder & Meynet (2000a) Maeder A., Meynet G., 2000a, Annual Review of Astronomy and Astrophysics, 38, 143
- Maeder & Meynet (2000b) Maeder A., Meynet G., 2000b, A&A, 361, 159
- Maeder & Meynet (2001) Maeder A., Meynet G., 2001, A&A, 373, 555
- Maeder & Meynet (2012) Maeder A., Meynet G., 2012, Reviews of Modern Physics, 84, 25
- Mauerhan et al. (2013) Mauerhan J. C., et al., 2013, MNRAS, 430, 1801
- McEvoy et al. (2015) McEvoy C. M., et al., 2015, A&A, 575, A70
- Meynet & Maeder (2000) Meynet G., Maeder A., 2000, A&A, 361, 101
- Meynet & Maeder (2003) Meynet G., Maeder A., 2003, A&A, 404, 975
- Mokiem et al. (2006) Mokiem M. R., et al., 2006, A&A, 456, 1131
- Mosser et al. (2012) Mosser B., et al., 2012, A&A, 548, A10
- Müller & Vink (2014) Müller P. E., Vink J. S., 2014, A&A, 564, A57
- Ofek et al. (2013) Ofek E. O., et al., 2013, Nature, 494, 65
- Ofek et al. (2014) Ofek E. O., et al., 2014, ApJ, 789, 104
- Owocki (2014) Owocki S., 2014, arXiv e-prints, p. arXiv:1409.2084
- Owocki (2015) Owocki S. P., 2015, in Vink J. S., ed., Astrophysics and Space Science Library Vol. 412, Very Massive Stars in the Local Universe. p. 113 (arXiv:1403.6745), doi:10.1007/978-3-319-09596-7_5
- Owocki et al. (1998) Owocki S. P., Cranmer S. R., Gayley K. G., 1998, Ap&SS, 260, 149
- Paxton et al. (2011) Paxton B., Bildsten L., Dotter A., Herwig F., Lesaffre P., Timmes F., 2011, ApJS, 192, 3
- Paxton et al. (2013) Paxton B., et al., 2013, ApJS, 208, 4
- Paxton et al. (2015) Paxton B., et al., 2015, ApJS, 220, 15
- Paxton et al. (2018) Paxton B., et al., 2018, ApJS, 234, 34
- Paxton et al. (2019) Paxton B., et al., 2019, arXiv e-prints, p. arXiv:1903.01426
- Peters et al. (2019) Peters M., et al., 2019, arXiv e-prints, p. arXiv:1912.05627
- Pols et al. (1991) Pols O. R., Cote J., Waters L. B. F. M., Heise J., 1991, A&A, 241, 419
- Ramírez-Agudelo et al. (2013) Ramírez-Agudelo O. H., et al., 2013, A&A, 560, A29
- Rivinius et al. (2013) Rivinius T., Carciofi A. C., Martayan C., 2013, A&A Rev., 21, 69
- Sanyal et al. (2017) Sanyal D., Langer N., Szécsi D., -C Yoon S., Grassitelli L., 2017, A&A, 597, A71
- Shao & Li (2014) Shao Y., Li X.-D., 2014, ApJ, 796, 37
- Smith (2014) Smith N., 2014, ARA&A, 52, 487
- Smith (2017) Smith N., 2017, Philosophical Transactions of the Royal Society of London Series A, 375, 20160268
- Smith (2019) Smith N., 2019, MNRAS, 489, 4378
- Smith & Ferland (2007) Smith N., Ferland G. J., 2007, ApJ, 655, 911
- Smith & Tombleson (2015) Smith N., Tombleson R., 2015, MNRAS, 447, 598
- Smith et al. (2003) Smith N., Gehrz R. D., Hinz P. M., Hoffmann W. F., Hora J. L., Mamajek E. E., Meyer M. R., 2003, AJ, 125, 1458
- Smith et al. (2010) Smith N., et al., 2010, AJ, 139, 1451
- Smith et al. (2014) Smith N., Mauerhan J. C., Prieto J. L., 2014, MNRAS, 438, 1191
- Smith et al. (2019) Smith N., Aghakhanloo M., Murphy J. W., Drout M. R., Stassun K. G., Groh J. H., 2019, MNRAS, 488, 1760
- Spruit (2002) Spruit H. C., 2002, A&A, 381, 923
- Tartaglia et al. (2016) Tartaglia L., et al., 2016, MNRAS, 459, 1039
- Tassoul (1978) Tassoul J.-L., 1978, Theory of rotating stars
- Townsend et al. (2004) Townsend R. H. D., Owocki S. P., Howarth I. D., 2004, MNRAS, 350, 189
- Van Reeth et al. (2018) Van Reeth T., et al., 2018, preprint, (arXiv:1806.03586)
- Verdugo et al. (1999) Verdugo E., Talavera A., Gómez de Castro A. I., 1999, A&A, 346, 819
- Vink (2017) Vink J. S., 2017, Philosophical Transactions of the Royal Society of London Series A, 375, 20160269
- Vink & Gräfener (2012) Vink J. S., Gräfener G., 2012, ApJ, 751, L34
- Vink et al. (2001) Vink J. S., de Koter A., Lamers H. J. G. L. M., 2001, A&A, 369, 574
- Zahn (1992) Zahn J.-P., 1992, A&A, 265, 115
- Zorec et al. (2016) Zorec J., et al., 2016, A&A, 595, A132
- de Mink et al. (2013) de Mink S. E., Langer N., Izzard R. G., Sana H., de Koter A., 2013, ApJ, 764, 166
- von Zeipel (1924) von Zeipel H., 1924, MNRAS, 84, 665
Appendix A Neglect of Coriolis Force
We have ignored the Coriolis force in equation 4, which may not always be appropriate. However, we note that Ledoux (1945) eliminated the Coriolis forces by considering a frame that changes rotation rate throughout the pulsation cycle. In principle, such a frame could be used in our analysis as well.
Inclusion of the Coriolis force would add a term to the right-hand side, where is the displacement in the -direction. The Coriolis force can thus be neglected if . One could imagine strong torques (due to magnetic tension forces or convective Reynold’s stresses) that overwhelm the Coriolis force and prevent fluid elements from moving horizontally and satisfying this approximation. To see this, consider the effect of a radial magnetic field. The component of the momentum equation (assuming axisymmetry), is
| (31) |
The last term in equation 31 represents magnetic tension forces, assuming the magnetic fields and horizontal displacements vary on a length scale of . For convective torques, the Alfvén frequency should be replaced by a convective turnover frequency . Hence, Coriolis forces can be ignored in this equation if . Combining this requirement with that from the radial momentum equation, Coriolis forces are negligible if . In other words, torques due to magnetic fields or convection should be stronger than Coriolis torques to justify a spherical treatment of the problem.
Since the instability originates in the outer layers of stars, it is certainly possible that or will be large enough to overwhelm Coriolis forces near the surface of the star. In these layers, and become large as the density becomes small, whereas is nearly constant. In the Sun, for example, both and are a couple orders of magnitude larger than near the surface. While both and decrease deeper in the star, the shallow density gradient near the surfaces of massive stars (Figure 13) helps them remain large. Additionally, for stars near the Eddington limit or near , the rotation rate can be much less than breakup when the instability sets in, decreasing the Coriolis force. Third, due to the very high luminosities and low densities of the envelopes, the convective velocities approach the sound speed deep in the star (e.g., near the iron opacity bump) increasing the magnetic/convective torques.
Appendix B MESA MODEL INLISTS
We construct our stellar models using the MESA stellar evolution code Paxton et al. (2011); Paxton et al. (2013, 2015, 2018, 2019) version 11701. The inlist is as follows:
B.1 MESA Inlist
&star_job
pgstar_flag = .true.
relax_initial_Z = .true.
new_Z = 0.017d0
new_rotation_flag = .true.
change_rotation_flag = .true.
set_initial_surface_rotation_v = .true.
new_surface_rotation_v = 200
/ ! end of star_job namelist
&controls
use_other_wind = .true.
fitted_fp_ft_i_rot = .true.
w_div_wcrit_max = 0.7
!-------------------------------- Convergence
okay_to_reduce_gradT_excess = .true.
gradT_excess_age_fraction = 0.999d0
gradT_excess_max_change = 0.01d0
timestep_factor_for_retries = 0.8
timestep_factor_for_backups = 0.8
min_timestep_factor = 0.9
max_timestep_factor = 1.2d0
backup_hold = 10
retry_hold = 3
redo_limit = -1
relax_hard_limits_after_retry = .false.
newton_iterations_limit = 7
max_model_number = 30000
max_number_retries = 5000
! Fixing the position of the Lagrangian region
! of the mesh helps
! convergence near the Eddington limit
max_logT_for_k_below_const_q = 100
max_q_for_k_below_const_q = 0.995
min_q_for_k_below_const_q = 0.995
max_logT_for_k_const_mass = 100
max_q_for_k_const_mass = 0.99
min_q_for_k_const_mass = 0.99
!extra spatial resolution
max_dq = 0.02
fix_eps_grav_transition_to_grid = .true.
! extra controls for timestep
! these are for changes in mdot at the onset of
! mass transfer
delta_lg_star_mass_limit = 1d-3
delta_lg_star_mass_hard_limit = 2d-3
! these are to properly resolve core hydrogen
! depletion
delta_lg_XH_cntr_limit = 0.04d0
delta_lg_XH_cntr_max = 0.0d0
delta_lg_XH_cntr_min = -4.0d0
delta_lg_XH_cntr_hard_limit = 0.06d0
! this is mainly to resolve properly when the star
! goes off the main sequence
delta_HR_limit = 0.01d0
! relax default dHe/He, otherwise growing He core
! can cause things to go at a snail pace
dHe_div_He_limit = 2.0
! we’re not looking for much precision at the
! very late stages
dX_nuc_drop_limit = 5d-2
!-------------------------------- Rotation
am_nu_ST_factor = 0
smooth_nu_ST = 5
smooth_D_ST = 5
use_other_am_mixing = .true.
am_time_average = .true.
premix_omega = .true.
recalc_mixing_info_each_substep = .true.
am_nu_factor = 1
am_nu_non_rotation_factor = 1d0
am_nu_visc_factor = 1
am_nu_ES_factor = 1
angsml = 0.0
am_D_mix_factor = 3.33d-2
D_ES_factor = 1
! this is to avoid odd behaviour when a star
! switches from accreting to mass losing
max_mdot_jump_for_rotation = 1d99
!------------------------------------ MAIN
initial_mass = 35
initial_z = 0.02
use_Type2_opacities = .true.
Zbase = 0.017d0
predictive_mix(1) = .true.
predictive_superad_thresh(1) = 0.005
predictive_avoid_reversal(1) = ’he4’
predictive_zone_type(1) = ’any’
predictive_zone_loc(1) = ’core’
predictive_bdy_loc(1) = ’top’
dX_div_X_limit_min_X = 1d-4
dX_div_X_limit = 5d-2
dX_nuc_drop_min_X_limit = 1d-4
dX_nuc_drop_limit = 5d-2
!------------------------------------ WIND
hot_wind_scheme = ’Dutch’
cool_wind_RGB_scheme = ’Dutch’
cool_wind_AGB_scheme = ’Dutch’
RGB_to_AGB_wind_switch = 1d-4
Dutch_scaling_factor = 0.0 !0.5
mdot_omega_power = 0.0d0
!---------------------------- OVERSHOOTING
overshoot_f_above_nonburn_core = 0.025
overshoot_f0_above_nonburn_core = 0.005
overshoot_f_above_nonburn_shell = 0.025
overshoot_f0_above_nonburn_shell = 0.005
overshoot_f_below_nonburn_shell = 0.025
overshoot_f0_below_nonburn_shell = 0.005
overshoot_f_above_burn_h_core = 0.025
overshoot_f0_above_burn_h_core = 0.005
overshoot_f_above_burn_h_shell = 0.025
overshoot_f0_above_burn_h_shell = 0.005
overshoot_f_below_burn_h_shell = 0.025
overshoot_f0_below_burn_h_shell = 0.005
set_min_D_mix = .true.
min_D_mix = 1d2
!------------------------------------- MISC
photo_interval = 25
profile_interval = 25
max_num_profile_models = 3000
history_interval = 1
terminal_interval = 10
write_header_frequency = 10
max_number_backups = 500
relax_max_number_retries = 2000
max_number_retries = 4000
!------------------------------------- MESH
mesh_delta_coeff = 1.0
varcontrol_target = 5d-4
/ ! end of controls namelist
B.2 Implementation of Mass Loss Wind
Our code in run_star_extras.f implementing mass loss wind is as follows:
subroutine my_other_wind(id, Lsurf, Msurf,
Rsurf, Tsurf, w, ierr)
use star_def, only: star_info
use star_lib, only: star_ptr
integer, intent(in) :: id
real(dp), intent(in) :: Lsurf, Msurf
real(dp), intent(in) :: Rsurf, Tsurf
!surface values (cgs)
real(dp), intent(out) :: w
!wind in units of Msun/year (value is >= 0)
integer, intent(out) :: ierr
integer :: y
!used for tanh smoothing
real(dp) :: I, r, r_old
!moment of inertia
!radius or the current model
!radius of the previous model
real(dp) :: cen_wind,omega_crit
!centrifugal mass loss rate
!critical rotational velocity
real(dp) :: Dutch_wind
real(dp) :: w1,w2,alfa,temp
!used to calculate Dutch_wind
type (star_info), pointer :: s
call star_ptr(id, s, ierr)
if (ierr /= 0) then ! OOPS
return
end if
w = 0
ierr = 0
temp = 0
cen_wind = 0
Dutch_wind = 0
I =
dot_product(s%i_rot(:s%nz),s%dm(:s%nz))
r = exp(s% xh(s% i_lnR,1))
r_old = exp(s% xh_older(s% i_lnR,1))
y = 5 !used for tanh smoothing
cen_wind = &
-(I-s% xtra1 - 3.0*I*(r-r_old)/r/2.0)
/(r**2-I/2.0/s% mstar)
/s% time_step/1.9892e33
if (s%Lrad_div_Ledd_avg_surf.ge.0.639) then
omega_crit=
sqrt(2.0/3.0*6.67428e-8*s%mstar/r**3)
*(1-s%Lrad_div_Ledd_avg_surf)/0.361
else
omega_crit=
sqrt(2.0/3.0*6.67428e-8*s%mstar/r**3)
end if
!omega_crit depending on Eddington factor
cen_wind =
0.5*(1+tanh(y*log(s%omega(1)/omega_crit)))
*cen_wind
!tanh smoothing
s% xtra1 = I
!save current moment of inertia
if (cen_wind .lt. 0.0) then
cen_wind = 0.0
end if
!guarantee the star is losing mass
if (s% Dutch_scaling_factor == 0) then
Dutch_wind = 0
else if (Tsurf <= 10000.0) then
call lowT_Dutch(Lsurf,Msurf,
Rsurf,Tsurf,Dutch_wind,
s%Dutch_wind_lowT_scheme)
else if (Tsurf >= 11000.0) then
call highT_Dutch(id,Lsurf,Msurf,
Tsurf,Dutch_wind,ierr)
else ! transition
call lowT_Dutch(Lsurf,Msurf,
Rsurf,Tsurf,w1,
s%Dutch_wind_lowT_scheme)
call highT_Dutch(id,Lsurf,Msurf,
Tsurf,w2,ierr)
alfa = (Tsurf - 10000.0)/1000.0
Dutch_wind = (1-alfa)*w1 + alfa*w2
end if
!calculate Dutch_wind as MESA source code
Dutch_wind =
s%Dutch_scaling_factor*Dutch_wind
w = cen_wind + Dutch_wind
!total = centrifugal + line-driven
end subroutine my_other_wind
To run the my_other_wind routine, one must employ subroutines from MESA source code. They are eval_highT_Dutch, eval_lowT_Dutch, and other subroutines related to them. These subroutines are in the private/winds.f90 file. Additionally, we include the TSF subroutine from Fuller
et al. (2019) with minor modifications to implement angular momentum transport. We use a tanh function to smooth the transition of centrifugal mass loss rate from 0 to a positive number when as:
| (32) |
where is calculated as in equation (14), and in our code . This tanh smoothing represses numerical instabilities, and we find results with different values of are similar.