Antisite disorder in the battery material LiFePO4
Abstract
We report detailed magnetometry and high-frequency electron spin resonance (HF-ESR) measurements which allow detailed investigation on Li-Fe antisite disorder in single-crystalline LiFePO4, i.e., exchange of Fe2+- and Li+-ions. The data imply that magnetic moments of Fe2+-ions at Li-positions do not participate in long-range antiferromagnetic order in LiFePO4 but form quasi-free moments. Anisotropy axes of the magnetic moments at antisite defects are attached to the main crystallographic directions. The local character of these moments is confirmed by associated linear resonance branches detected by HF-ESR studies. Magnetic anisotropy shows up in significant zero-field splittings of GHz, GHz and a highly anisotropic -factor, i.e., , , and . We demonstrate a general method to precisely determine Fe-antisite disorder in LiFePO4 from magnetic studies which implies a density of paramagnetic Fe2+-ions at Li-positions of 0.53%.
I Introduction
Electronic and ionic conductivity crucially affect the performance of electrode materials for lithium-ion batteries (LIB), including the charge and discharge rates, cycling stability and practically accessible capacity. Therefore, it is essential to understand the properties of defects unavoidably appearing in real materials as a precondition to understanding conductivity and eventually battery performance. In systems like the commercialised battery material LiFePO4, where ionic diffusion is supposed to be promoted along channels of the lattice structure, i.e., of one-dimensional (1D) nature, defects particularly affect actual conductivity as channels are easily blocked Gardiner and Islam (2010). However, defects are not necessarily detrimental to high-performance electrodes but may significantly enhance it by enabling additional low-energy ionic pathways Wang and Hong (2007); Malik et al. (2010). This is particularly true for Li-Fe anti-site disorder which is an intrinsic type of defect in olivine-like transition metal phosphates. Due to the similar covalent radii of Li- and Fe-ions both can change places and form a so-called anti-site defect. Calculations in Ref. Yang and Tse, 2011 suggest that ionic migration perpendicular to the 1D channels is energetically more favourable than along the blocked channels, and might even yield ionic migration of higher dimensionality by supporting channel crossoverMalik et al. (2010); Gardiner and Islam (2010). In this respect, activation energies for ionic diffusion along the crystallographic directions perpendicular to the channels can be interpreted as activation of channel crossover via anti-site defects Liu et al. (2017). It has been shown that the essentially 1D transport in LiFePO4 becomes 3D when the percolation threshold of only a few % of antisite disordered Li-/Fe-positions is reached Adams (2010) which evidently would have strong implication for understanding and designing actual battery materials. Ionic migration of higher dimensionality is indeed observed experimentally in single crystals studies Amin et al. (2008a); Neef et al. (2020). Understanding the nature of Li-Fe antisite defects is hence crucial to calculate relevant input parameters for modelling LiFePO4 as an electrode material Dathar et al. (2011).
Experimental studies on antisite disorder are challenging as conventional x-ray scattering is not sensitive to Li. In this paper we apply magnetic probes to study the intrinsic properties of antisite defects in LiFePO4 single crystals, i.e., tunable high magnetic field/high-frequency electron spin resonance (HF-ESR) spectroscopy and static magnetisation. We exploit the fact that antisite defects are magnetic in a sense that paramagnetic Fe-ions reside in different crystallographic environments and are hence distinguishable and detectable while, at low-temperatures below the magnetic ordering temperature, Li-ions form local non-magnetic defects in the long-range antiferromagnetic ordered magnetic lattice of Fe-moments. We show that the density of antisite defects is straightforwardly and precisely determined. In addition, energy levels of the Fe2+-ions at the Li-position are studied in high magnetic fields by HF-ESR. We observe significant zero field splittings of GHz and GHz of antisite Fe2+-moments and highly anisotropic effective -values along the different crystallographic axes, i.e., , , and for the -, -, and -axis, respectively (space group ). This anisotropy of the g-factor is resembled by magnetic susceptibility which shows a strongly anisotropic Curie-Weiss-like upturn at low temperatures.
II Experimental
Single crystals of LiFePO4 were grown by the high-pressure optical floating-zone method as reported in detail in Ref. Neef et al., 2017. Magnetization in static magnetic fields up to 7 T was studied by means of a Quantum Design MPMS-3 SQUID magnetometer. HF-ESR measurements were performed in a transmission type ESR spectrometer in Faraday geometry. ESR measurements in static fields up to 16 T were done by means of a phase-sensitive millimeter-wave vector network analyzer (MVNA) from AB Millimetré Comba et al. (2015). HF-ESR experiments in pulsed fields up to 50 T were performed at the Dresden High Magnetic Field Laboratory (HLD) using VDI modular transmitters (product of Virginia Diodes Inc., USA) as sub-mm radiation sources and InSb hot-electron bolometer as a radiation detector.
III Results
III.1 Magnetisation
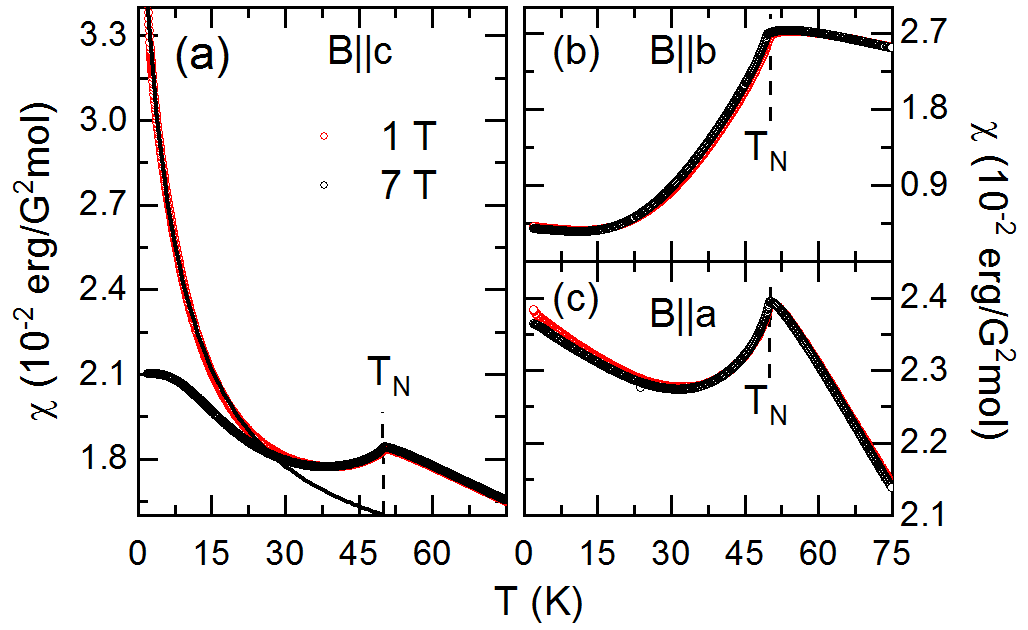
LiFePO4 exhibits long range antiferromagnetic order of the spins of the magnetic Fe2+-ions, which evolves at = 50.0(5) K Santoro and Newnham (1967); Werner et al. (2019); Li et al. (2006); Zhi et al. (2004). In the ordered phase, the spins are mainly directed along the crystallographic -axis Rousse et al. (2003) with a small collinear rotation towards the -axis and spin canting along the -axis with an overall rotation of the ordered moments of 1.3(1)∘ off the -axis Toft-Petersen et al. (2015); Yiu et al. (2017). The onset of magnetic order, i.e., , is reflected by kinks in the static magnetic susceptibility shown in Fig. 2, and the easy axis is evident from Fig. 2b. Notably, in contrast to rather constant values of which are expected for a typical antiferromagnet Nagamiya et al. (1955), the susceptibility , i.e., applied along the hard axis, strongly increases upon cooling (see Fig. 2a). We note that this magnetic field is far below any metamagnetic transition in LiFePO4 Werner et al. (2019). In contrast, there is only a weak temperature dependence for -axis (intermediate axis). Phenomenologically, the strong upturn of is described by a Curie-Weiss law , with the Curie constant erg K G-2 mol-1 and the Weiss-temperature K (see black line in Fig. 2a). This suggests the presence of only weakly correlated (i.e., ’quasi-free’ with respect to the main antiferromagnetic ordering phenomenon at ) magnetic moments which do not participate in long-range antiferromagnetic spin order. The fact that only a weak Curie-like increase is observed below 30 K for the other directions implies the anisotropic nature of these quasi-free spins Baumann et al. (2006). This is confirmed by application of T which nearly does not affect and while the steep upturn in is suppressed towards a rather expected behaviour. is almost unchanged either. Please note, that interpreting the steep upturn as the response of moments not involved in the overall spin structure implies that the parameters obtained by Curie-Weiss fitting must be taken cautiously as the response of the long range order phase is not precisely known. As will be shown, precise quantitative separation is feasible if data are exploited.
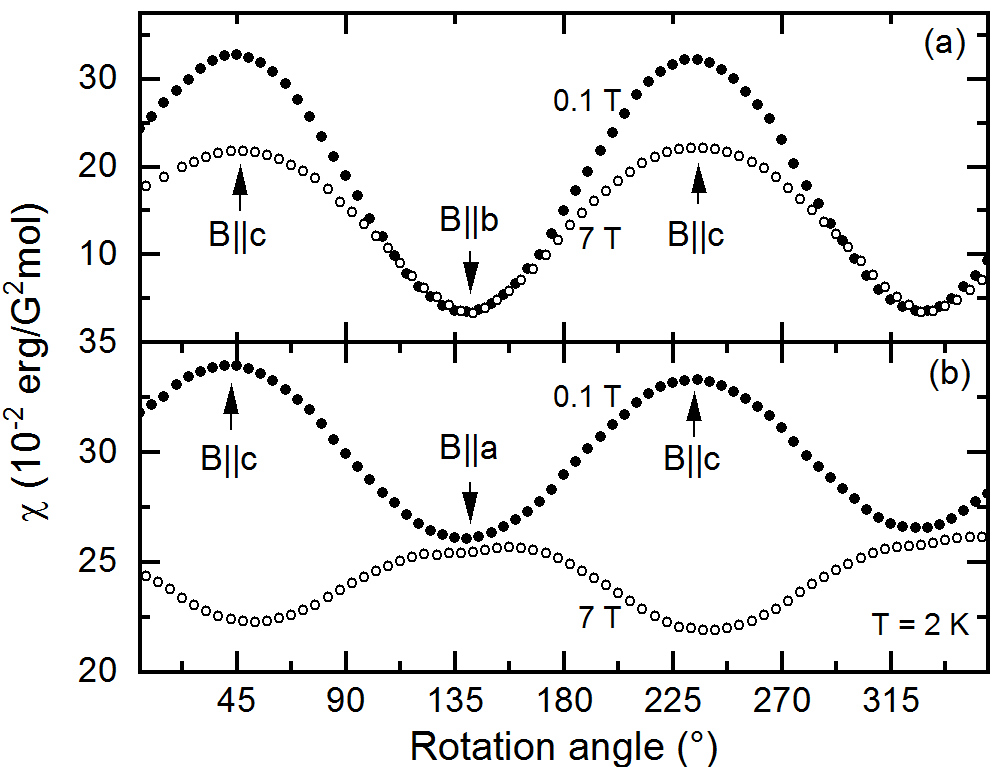
Anisotropy of the low-temperature magnetisation is further elucidated in Fig. 3, where the susceptibility at K is shown in dependence of the field direction for and 7 T. At T, the expected behaviour for antiferromagnets is observed, i.e., the susceptibility is smallest for (easy axis) while it is highest for (intermediate axis). This differs from the finding at small magnetic field where the quasi-free moments significantly contribute. At T, the susceptibility is almost unchanged with respect to the high-field values for and . In contrast, is much larger which must be attributed to the quasi-free moments. The data hence imply that the -tensor of the quasi-free moments is strongly anisotropic and attached to the main crystallographic directions of LiFePO4. The discrepancies of minima and maxima for the different measurements are within the error bars of the MPMS-3 rotor of approximately 5∘.
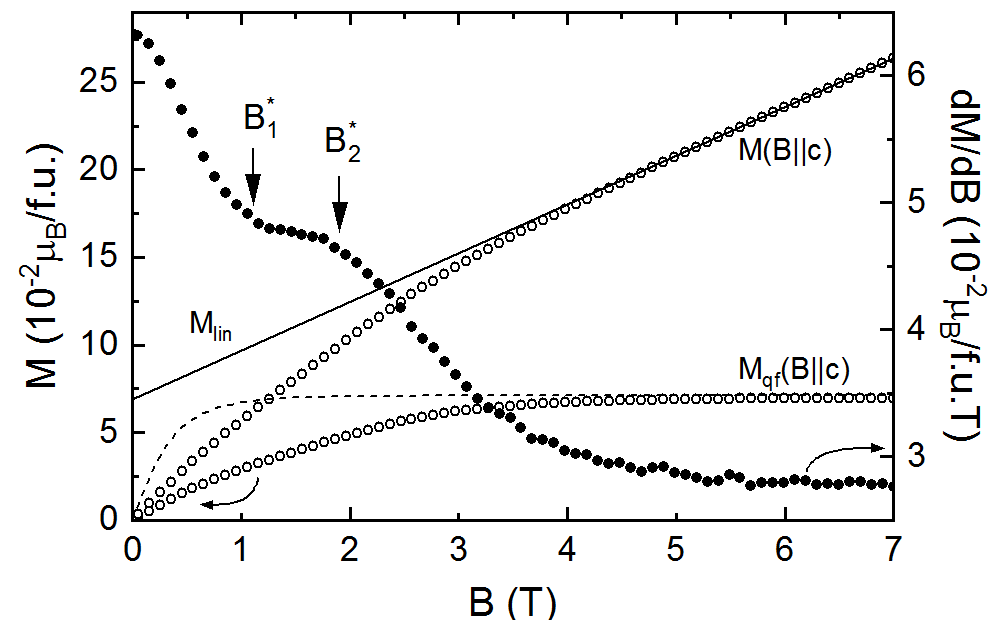
Measurements of the magnetization in dependence of the external magnetic field (Fig. 4) reflect the unusual anisotropic behaviour of the low-temperature susceptibility as well. While for magnetic fields only tiny right bending is observed, significant curvature is only observed for (cf. Ref. Werner et al., 2019). This right bending is superimposed by a linear-in-field contribution to the magnetisation up to the highest measured fields of T Werner et al. (2019), except for metamagnetic transitions appearing at T. Such linear field effect is typical for three-dimensional antiferromagnets and is attributed to the response of the antiferomagnetically ordered spins . In contrast, right bending at rather low energy fields clearly signals the alignment of magnetic moments which are not expected in a conventional antiferromagnet. Note, that these extra moments are not explained by small canting of the Fe spins of away from the easy -axis Toft-Petersen et al. (2015); Yiu et al. (2017) as will be shown below by HF-ESR data.
In order to further analyse the observed quasi-free moments, we have separated the non linear from the linear part by fitting the high-field behaviour with a linear function and subtracted the resulting straight line from the data Klingeler et al. (2005). This procedure gives as shown in Fig. 4. It shows the alignment of quasi-free moments towards their saturation value of at around 5.5 T. This is in-line with the vs. data in Fig. 2a which imply suppression of the steep Curie-like upturn at 7 T. The data presented in Figs. 2 and 4 hence clearly evidence the presence of only weakly correlated anisotropic magnetic moments in LiFePO4. Comparing the non-linear contribution with a simple Brillouin function (see Fig. 4) indicates a more complex behaviour of the extra moment as compared to completely isolated spins . This is particularly evident when the derivative is considered which – in addition to general right-bending of – shows two anomalies at T and T.
III.2 High-frequency electron spin resonance
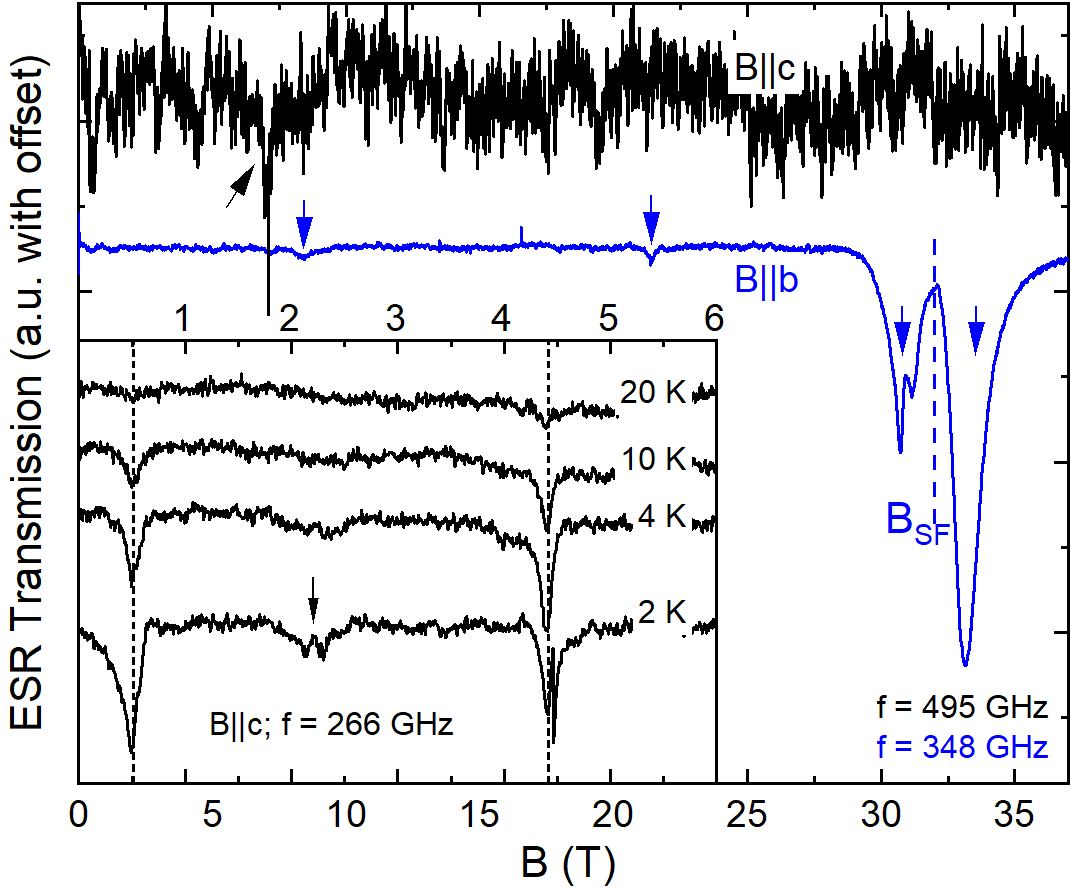
While HF-ESR is susceptible to collective magnetic excitations, at , observation of magnon modes in LiFePO4 is challenging due to large single-ion anisotropy and strong exchange interactions which lead to large excitation gaps at zero magnetic field of 1446 GHz and 2072 GHz Li et al. (2006); Toft-Petersen et al. (2015); Yiu et al. (2017). When external magnetic fields are applied along the magnetic easy -axis, collective resonance modes are however expected to soften in fields similar to the spin-reorientation field Nagamiya et al. (1955). This is indeed observed in the HF-ESR spectra measured for . The spectrum obtained at 348 GHz (Fig. 5, blue line) features the two expected resonances close to = 32 T. In addition, two resonances with less intensity at lower fields are observed. Applying magnetic fields , i.e., where below the zero field splitting no magnon modes are expected, yields a spectrum (black line) with at least one clear resonance of low intensity. One has to conclude that the weak features are not associated with magnon modes. Instead, the temperature evolution of the intensities of the weak resonance features implies a Curie-like behaviour. This is demonstrated by spectra taken at 266 GHz and for displayed in the inset of Fig. 5. The spectra display rather intense peaks at T and T as well as weaker slightly split resonances at T. All these features show Curie-like behaviour as the integrated intensities decrease upon heating, thereby resembling the Curie-like upturn of magnetic susceptibility (see Fig. 2a).
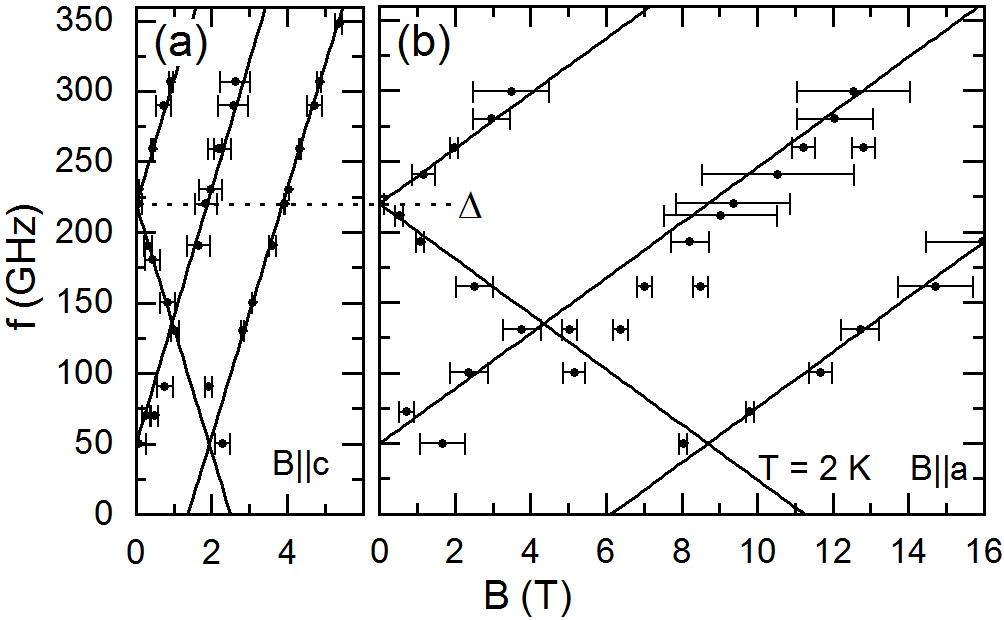
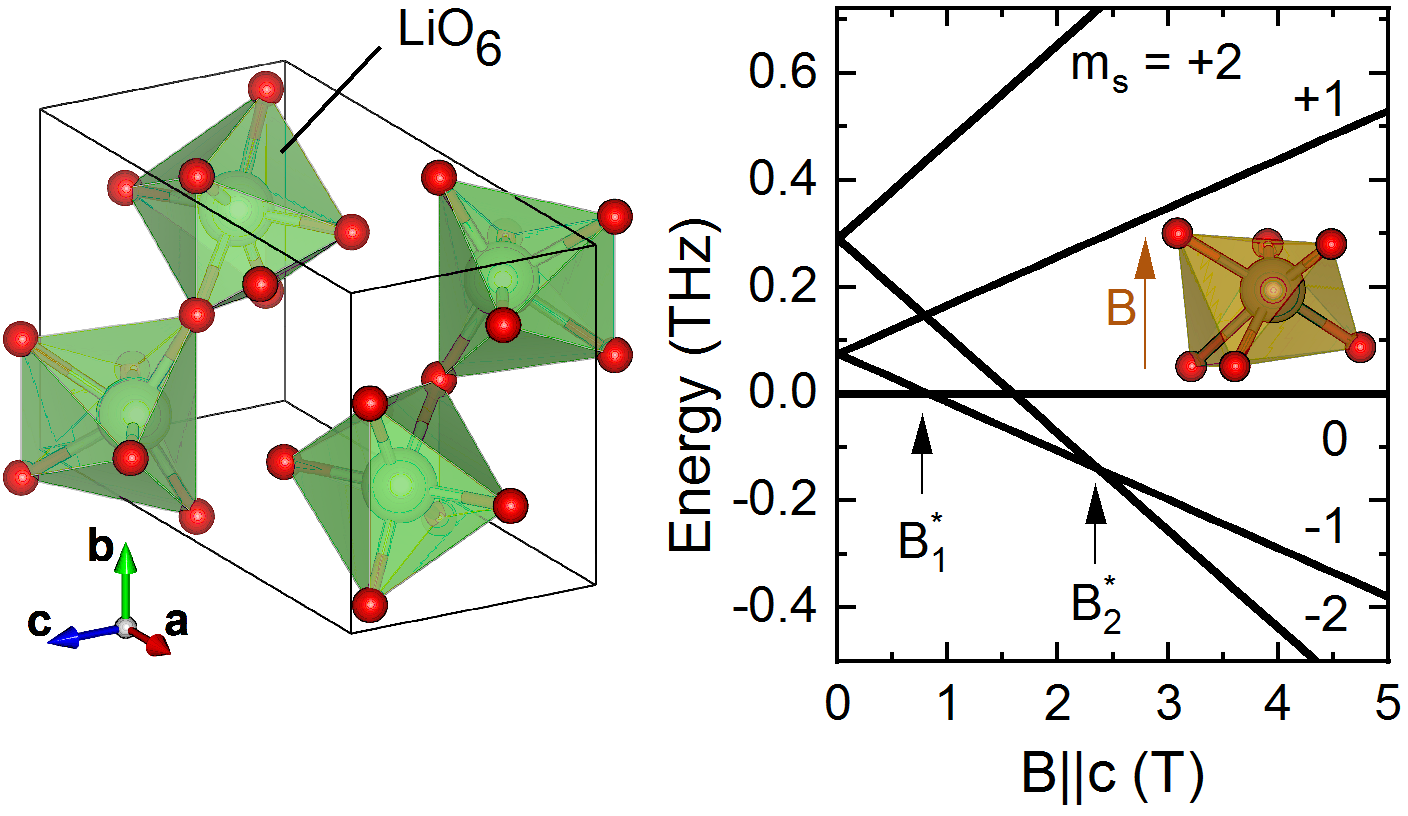
The measured frequency dependencies of the resonance fields displayed in Fig. 6 for magnetic fields and , respectively, allows to clarify the microscopic origin of the these resonances. The general behaviour of the resonance branches is similar for both magnetic field directions. All resonances are associated with resonance branches with linear field dependence of resonance frequency and, except for the sign, similar slopes for a given field direction. In addition, for each field direction we observe two gapped modes of opposite slope with zero field splitting of GHz. At approximately GHz, the falling branches crosses or turn into an increasing mode. Such crossing of spin states is typically associated with anomalies in the static magnetisation and it indeed nicely accounts for the anomaly (see Fig. 4). Finally, there is an additional mode with positive slope with zero field splitting of GHz.
The slopes of the branches allow determining the respective effective -values which in the following will be just named -values. As mentioned above, the slopes and hence the -values of all branches of each direction are equal within error bars while there are large differences for the different field orientations. Quantitatively, the data in Fig. 6 imply and 111Applying magnetic fields along the -axis results in a more complex frequency dependence of the resonance fields with a -value of the main resonance lines of . The observation of a large -value for and a rather small one for is fully consistent with the anisotropic Curie-like upturn of the susceptibility. The measured anisotropy would yield erg K/G2 mol.
IV Discussion
Both static and dynamic magnetic studies evidence the presence of anisotropic magnetic moments which are not involved in long-range antiferromagnetic order. As Fe moments in the ground state are slightly tilted, it is illustrative to compare the resonance branches presented above with modes originating from tilted moments which, e.g., are observed in -Fe2O3 Pincus (1960), -Cu2V2O7 Wang et al. (2018), and Sr2IrO4 Bahr et al. (2014). In all examples, low-energy excitation modes show bending, i.e., are clearly non-linear and exhibit stronger anisotropy of the effective -values as observed in LiFePO4. In addition, the resonance modes of tilted moments are usually not observed for all magnetic field directions. This further confirms that extra moments in LiFePO4 are not associated with the long-range ordered ground state of Fe2+ moments on Fe lattice sites. Instead, defects which are strongly associated with the crystallographic lattice of LiFePO4 are accountable for the observed anisotropic Curie-like response. We note that this conclusion is supported by the fact that the saturation value of the quasi-free component of the magnetisation is sample dependent.
The obtained Curie-constant , the saturation magnetization of the extra moments , and the -value enable determining the effective total angular momentum quantum number
| (1) |
of the impurities. This procedure yields which is close to the integer and hence suggests attributing the anisotropic moments to Fe impurities with high spin and quenched orbital momentum . This leads to a density of impurities of .
Low-temperature increase of the susceptibility is not only observed for LiFePO4 but was reported previously for other phosphates, too. In LiMnPO4 it however shows isotropic Curie-like behaviour Neef et al. (2017). This discrepancy is attributed to an isotropic -factor expected for half-filled d-shell of Mn2+-ions. For LiMn1-xFexPO4 it was observed, that with increasing iron content the Curie-like susceptibility upturn is getting more anisotropic Neef et al. (2017). An even stronger increase of the susceptibility in -direction is reported for LiFePO4 doped with non-magnetic Mg-ions Chen et al. (2007). Our results suggest that this behaviour is directly linked to the increase of anti-site disorder.
The crystal structure exhibits four different Li-sites with the same local distorted octahedral oxygen environment. The distorted octahedra exhibit symmetry and are positioned in the crystal structure in a way, that always the same facet of the octahedron is normal to the -axis of the crystal structure. The octahedra are however rotated in the -plane. For Fe at a Li-position, the low-symmetry coordination hence fully lifts orbital degeneracy which results in orbital splitting into separated and doublets and a singlet . This general energy level schema is confirmed by the HF-ESR data as the observed low-field ESR branches are straightforwardly associated with allowed transitions between split spin states of localised (see Fig. 1). In particular, the modes with zero-field gap of GHz display transitions between and states and quantifies their splitting in zero field. While, the resonance branch with GHz is associated with transitions between and states. Consequently, anomalies and in the magnetisation curve signal the changes of the magnetic ground state from to and to , respectively.
Comparing our experimental results to materials with paramagnetic Fe2+ ions in a low-symmetry coordination, the here observed zero-field splitting of the energy levels is in the common rage Krzystek et al. (2006); Rudowicz and Wai-fong Sung (2003). In contrast, the effective -value respectively the -value anisotropy observed in our study is unusually high as, e.g., in Mg2SiO4:Fe where Fe2+-ions are on octahedral sites of the forsterite structure, anisotropic -values of and are observed Shakurov et al. (2011).
Since formation of defects depends on details of the synthesis process, Fe2+-antisite density is supposed to vary between different samples and different parts of the crystalline rod obtained by our optical floating-zone method. Indeed, while % is obtained from the analysis of magnetic data above, a different part of the same single crystalline batch which exhibits identical shows % (see the the supplement). Both values are in perfect accordance with the expected equilibrium defect concentration of 0.1 to 0.5% for the used solid-state synthesis temperatures Malik et al. (2010).
In comparison with other experimental methods, our results quantitatively agree to determination of antisite disorder by lithium diffusion experiments on crystalline nanoplatelets of LiFePO4, where 0.5% antisite concentration was obtained Liu et al. (2017). Diffraction studies illustrate the large regime of potential antisite defect concentrations in LiFePO4. High concentrations can be, e.g., due to insufficient solid state diffusion so that values of 7 to 8% have been reported for materials from hydrothermal and high-temperature solid state synthesis methods Yang et al. (2002). The growth method of single crystals implies rather diverse antisite concentrations as flux-grown LiFePO4 is reported to exhibit no evidence for antisite defects in these samples Janssen et al. (2013) from a combination of powder and single crystal diffraction (X-ray and neutron). While, synchrotron powder X-ray diffraction data on ground crystals grown by the optical floating-zone (TSFZ) method at ambient pressure imply values of 2.5% Amin et al. (2008b). Laboratory powder XRD data on single crystals of the same batch as studied here have been best refined when antisite concentration of Neef et al. (2017) was considered which is larger than the concentration of quasi-free . We attribute this to the uncertainty of the powder XRD method with respect to a particular kind of defects. Janssen et al. (2013) We conclude, that in addition to the particular paramagnetic-like type of defects associated with Fe2+ on Li-sites further defects-types may be included in the values provided by Rietveld analysis of conventional x-ray patterns. We emphasize in this respect, that our magnetic studies can discriminate between different defects. While non-magnetic ones are not detected, different magnetic defects would result in different -factors and zero-field splittings which is not observed. We mention that failure of detecting Li-Fe antisite defects by means of X-band ESR in Ref. Amin et al., 2006 is fully in-line with the fact that zero-field splitting is larger than 10 GHz (see Fig. 6) which prevents detection in conventional X-band ESR.
In addition, our results imply that in theoretical studies on electronic properties and antisite-defect mediated diffusion in LiFePO4 orbital degrees of freedom should be taken into account, which can be concluded from the highly anisotropic -factor of the defect moments. In particular, a local structure model as used in Ref. Adams, 2010 can not account for these features. In general, DFT calculations of antisite defects Dathar et al. (2011) should yield the anisotropic -values as well as zero-field splitting due to crystal field effects which may be used to confirm the validity of a numerical approach.
Knowledge of the strongly anisotropic -values also enables to quantitatively determine antisite disorder by static magnetometry even in LiFePO4 powders. A Curie-Weiss fit to the volume magnetic susceptibility in the temperature region of 2 K to 20 K results in a powder averaged Curie constant from which the defect concentration
| (2) |
is obtained by using , and .
IV.1 Summary
Our detailed studies of the static and dynamic magnetic properties on single crystals by means of magnetisation and high-frequency electron spin resonance measurements enable qualitative and quantitative conclusions on the nature and the properties of antisite defects in LiFePO4. The presence of rather localised moments which are only weakly magnetically interacting with the magnetic subsystem on the crystallographic Fe-positions is attributed with Fe2+-ions on Li-positions. The fingerprint of these moments includes linear resonance branches, a highly anisotropic -factor with , , and , and significant zero-field splittings of GHz and GHz. We demonstrate a procedure to precisely determine the defect concentration by static magnetisation measurements on powder materials.
Acknowledgements.
The project is supported by Deutsche Forschungsgemeinschaft (DFG) through KL 1824/13-1. We acknowledge the support of the HLD at HZDR, member of the European Magnetic Field Laboratory (EMFL).References
- Gardiner and Islam (2010) G. R. Gardiner and M. S. Islam, Chemistry of Materials 22, 1242 (2010).
- Wang and Hong (2007) C. Wang and J. Hong, Electrochemical and Solid State Letters 10, A65 (2007).
- Malik et al. (2010) R. Malik, D. Burch, M. Bazant, and G. Ceder, Nano letters 10, 4123 (2010).
- Yang and Tse (2011) J. Yang and J. S. Tse, The Journal of Physical Chemistry A 115, 13045 (2011).
- Liu et al. (2017) H. Liu, M.-J. Choe, R. A. Enrique, B. Orvañanos, L. Zhou, T. Liu, K. Thornton, and C. P. Grey, The Journal of Physical Chemistry C 121, 12025 (2017).
- Adams (2010) S. Adams, Journal of Solid State Electrochemistry 14, 1787 (2010).
- Amin et al. (2008a) R. Amin, C. Lin, and J. Maier, Physical Chemistry Chemical Physics 10, 3524 (2008a).
- Neef et al. (2020) C. Neef, A. Reiser, E. Thauer, and R. Klingeler, Solid State Ionics 346, 115197 (2020).
- Dathar et al. (2011) G. K. P. Dathar, D. Sheppard, K. J. Stevenson, and G. Henkelman, Chemistry of Materials 23, 4032 (2011).
- Neef et al. (2017) C. Neef, H. Wadepohl, H.-P. Meyer, and R. Klingeler, Journal of Crystal Growth 462, 50 (2017).
- Comba et al. (2015) P. Comba, M. Großhauser, R. Klingeler, C. Koo, Y. Lan, D. Müller, J. Park, A. Powell, M. J. Riley, and H. Wadepohl, Inorganic chemistry 54, 11247 (2015).
- Momma and Izumi (2011) K. Momma and F. Izumi, Journal of applied crystallography 44, 1272 (2011).
- Santoro and Newnham (1967) R. Santoro and R. Newnham, Acta Crystallographica 22, 344 (1967).
- Werner et al. (2019) J. Werner, S. Sauerland, C. Koo, C. Neef, A. Pollithy, Y. Skourski, and R. Klingeler, Physical Review B 99, 214432 (2019).
- Li et al. (2006) J. Li, V. O. Garlea, J. L. Zarestky, and D. Vaknin, Physical Review B 73, 024410 (2006).
- Zhi et al. (2004) L. Zhi, D. Nai-Li, K. Zhi-Qi, C. Zhao-Hua, L. Li-Jun, C. Li-Quan, and H. Xue-Jie, Chinese Physics 13, 2158 (2004).
- Rousse et al. (2003) G. Rousse, J. Rodriguez-Carvajal, S. Patoux, and C. Masquelier, Chemistry of materials 15, 4082 (2003).
- Toft-Petersen et al. (2015) R. Toft-Petersen, M. Reehuis, T. B. Jensen, N. H. Andersen, J. Li, M. D. Le, M. Laver, C. Niedermayer, B. Klemke, K. Lefmann, et al., Physical Review B 92, 024404 (2015).
- Yiu et al. (2017) Y. Yiu, M. D. Le, R. Toft-Petersen, G. Ehlers, R. J. McQueeney, and D. Vaknin, Physical Review B 95, 104409 (2017).
- Nagamiya et al. (1955) T. Nagamiya, K. Yosida, and R. Kubo, Advances in Physics 4, 1 (1955).
- Baumann et al. (2006) C. Baumann, G. Allodi, A. Amato, B. Büchner, D. Cattani, R. De Renzi, R. Klingeler, P. Reutler, and A. Revcolevschi, Physica B: Condensed Matter 374, 83 (2006).
- Klingeler et al. (2005) R. Klingeler, B. Büchner, S.-W. Cheong, and M. Hücker, Physical Review B 72, 104424 (2005).
- Pincus (1960) P. Pincus, Physical Review Letters 5, 13 (1960).
- Wang et al. (2018) L. Wang, J. Werner, A. Ottmann, R. Weis, M. Abdel-Hafiez, J. Sannigrahi, S. Majumdar, C. Koo, and R. Klingeler, New Journal of Physics 20, 063045 (2018).
- Bahr et al. (2014) S. Bahr, A. Alfonsov, G. Jackeli, G. Khaliullin, A. Matsumoto, T. Takayama, H. Takagi, B. Büchner, and V. Kataev, Physical Review B 89, 180401 (2014).
- Chen et al. (2007) D. Chen, X. Wang, Y. Hu, C. Lin, S. Dou, and R. Nigam, Journal of applied physics 101, 09N512 (2007).
- Krzystek et al. (2006) J. Krzystek, A. Ozarowski, and J. Telser, Coordination chemistry reviews 250, 2308 (2006).
- Rudowicz and Wai-fong Sung (2003) C. Rudowicz and H. Wai-fong Sung, Journal of the Physical Society of Japan 72, 61 (2003).
- Shakurov et al. (2011) G. Shakurov, T. Shcherbakova, and V. Shustov, Applied Magnetic Resonance 40, 135 (2011).
- Yang et al. (2002) S. Yang, Y. Song, P. Y. Zavalij, and M. S. Whittingham, Electrochemistry communications 4, 239 (2002).
- Janssen et al. (2013) Y. Janssen, D. Santhanagopalan, D. Qian, M. Chi, X. Wang, C. Hoffmann, Y. S. Meng, and P. G. Khalifah, Chemistry of Materials 25, 4574 (2013).
- Amin et al. (2008b) R. Amin, J. Maier, P. Balaya, D. Chen, and C. Lin, Solid State Ionics 179, 1683 (2008b).
- Amin et al. (2006) R. Amin, P. Balaya, and J. Maier, Electrochemical and Solid State Letters 10, A13 (2006).