Alzheimer’s Dementia Recognition through Spontaneous Speech:
The ADReSS Challenge
Abstract
The ADReSS Challenge at INTERSPEECH 2020 defines a shared task through which different approaches to the automated recognition of Alzheimer’s dementia based on spontaneous speech can be compared. ADReSS provides researchers with a benchmark speech dataset which has been acoustically pre-processed and balanced in terms of age and gender, defining two cognitive assessment tasks, namely: the Alzheimer’s speech classification task and the neuropsychological score regression task. In the Alzheimer’s speech classification task, ADReSS challenge participants create models for classifying speech as dementia or healthy control speech. In the the neuropsychological score regression task, participants create models to predict mini-mental state examination scores. This paper describes the ADReSS Challenge in detail and presents a baseline for both tasks, including feature extraction procedures and results for classification and regression models. ADReSS aims to provide the speech and language Alzheimer’s research community with a platform for comprehensive methodological comparisons. This will hopefully contribute to addressing the lack of standardisation that currently affects the field and shed light on avenues for future research and clinical applicability.
Index Terms: Cognitive Decline Detection, Affective Computing, computational paralinguistics
1 Introduction
Alzheimer’s Disease (AD) is a neurodegenerative disease that entails a long-term and usually gradual decrease of cognitive functioning [1]. It is also the most common underlying cause for dementia. The main risk factor for AD is age, and therefore its greatest incidence is amongst the elderly. Given the current demographics in the Western world, where the population aged 65 years or more has been predicted to triple between years 2000 and 2050 [2], institutions are investing considerably on dementia prevention, early detection and disease management. There is a need for cost-effective and scalable methods that are able to identify the most subtle forms of AD, from the preclinical stage of Subjective Cognitive Decline (SCI), to more severe conditions like Mild Cognitive Impairment (MCI) and Alzheimer’s Dementia (AD) itself.
Whilst memory is often considered the main symptom of AD, language is also deemed as a valuable source of clinical information. Furthermore, the ubiquity of speech has led to a number of studies investigating speech and language features for the detection of AD, such as [3, 4, 5, 6] to cite some examples. Although these studies propose various signal processing and machine learning methods for this task, the field still lacks balanced and standardised datasets on which these different approaches could be systematically compared.
Consequently, the main objective of the ADReSS Challenge of INTERSPEECH 2020 is to define a shared task through which different approaches to AD detection, based on spontaneous speech, could be compared. This aims to address one of the main problems of this active research field, the lack of standardisation, which hinders its translation into clinical practice. The ADReSS Challenge will therefore: 1) target a difficult automatic prediction problem of societal and medical relevance, namely, the detection of cognitive impairment and Alzheimer’s Dementia (AD); 2) to provide a forum for those different research groups to test their existing methods (or develop novel approaches) on a new shared standardized dataset; 3) mitigate common biases often overlooked in evaluations of AD detection methods, including repeated occurrences of speech from the same participant (common in longitudinal datasets), variations in audio quality, and imbalances of gender and age distribution; and 4) focus on AD recognition using spontaneous speech, rather than speech samples that are collected under laboratory conditions.
To the best of our knowledge, this will be the first such shared-task focused on AD. Unlike some tests performed in clinical settings, where short speech samples are collected under controlled conditions, this task focuses on AD recognition using spontaneous speech. While a number of researchers have proposed speech processing and natural language processing approaches to AD recognition through speech, their studies have used different, often unbalanced and acoustically varied datasets, consequently hindering reproducibility, replicability, and comparability of approaches. The ADReSS Challenge will provide a forum for those different research groups to test their existing methods (or develop novel approaches) on a shared dataset which consists of a statistically balanced, acoustically enhanced set of recordings of spontaneous speech sessions along with segmentation and detailed timestamped transcriptions. The use of spontaneous speech also sets the ADReSS Challenge apart from tests performed in clinical settings where short speech samples are collected under controlled conditions which are arguably less suitable for the development of large-scale monitoring technology than spontaneous speech [7].
As data scarcity and heterogeneity have hindered research into the relationship between speech and AD, the ADReSS Challenge provides researchers with the very first available benchmark, acoustically pre-processed and balanced in terms of age and gender. ADReSS defines two different prediction tasks: (a) the AD recognition task, which requires researchers to model participants’ speech data to perform a binary classification of speech samples into AD and non-AD classes; and (b) the MMSE prediction task, which requires researchers to create regression models of the participants’ speech in order to predict their scores in the Mini-Mental State Examination (MMSE).
This paper presents baselines for both tasks, including feature extraction procedures and initial results for a classification and a regression model.
2 ADReSS Challenge Dataset
A dataset has been created for this challenge which is matched for age and gender, as shown in Table 1 and Table 2, so as to minimise risk of bias in the prediction tasks. The data consists of speech recordings and transcripts of spoken picture descriptions elicited from participants through the Cookie Theft picture from the Boston Diagnostic Aphasia Exam [8, 9]. Transcripts were annotated using the CHAT coding system [10]. The recorded speech has been segmented for voice activity using a simple voice activity detection algorithm based on signal energy threshold. We set the log energy threshold parameter to 65 dB with a maximum duration of 10 seconds per speech segment. The segmented dataset contains 1,955 speech segments from 78 non-AD subjects and 2,122 speech segments from 78 AD subjects. The average number of speech segments produced by each participant was 24.86 (standard deviation ). Recordings were acoustically enhanced with stationary noise removal and audio volume normalisation was applied across all speech segments to control for variation caused by recording conditions such as microphone placement.
| AD | non-AD | |||||
|---|---|---|---|---|---|---|
| Age | M | F | MMSE (sd) | M | F | MMSE (sd) |
| 1 | 0 | 30.0 (n/a) | 1 | 0 | 29.0 (n/a) | |
| 5 | 4 | 16.3 (4.9) | 5 | 4 | 29.0 (1.3) | |
| 3 | 6 | 18.3 (6.1) | 3 | 6 | 29.3 (1.3) | |
| 6 | 10 | 16.9 (5.8) | 6 | 10 | 29.1 (0.9) | |
| 6 | 8 | 15.8 (4.5) | 6 | 8 | 29.1 (0.8) | |
| 3 | 2 | 17.2 (5.4) | 3 | 2 | 28.8 (0.4) | |
| Total | 24 | 30 | 17.0 (5.5) | 24 | 30 | 29.1 (1.0) |
| AD | non-AD | |||||
|---|---|---|---|---|---|---|
| Age | M | F | MMSE (sd) | M | F | MMSE (sd) |
| 1 | 0 | 23.0 (n.a) | 1 | 0 | 28.0 (n.a) | |
| 2 | 2 | 18.7 (1.0) | 2 | 2 | 28.5 (1.2) | |
| 1 | 3 | 14.7 (3.7) | 1 | 3 | 28.7 (0.9) | |
| 3 | 4 | 23.2 (4.0) | 3 | 4 | 29.4 (0.7) | |
| 3 | 3 | 17.3 (6.9) | 3 | 3 | 28.0 (2.4) | |
| 1 | 1 | 21.5 (6.3) | 1 | 1 | 30.0 (0.0) | |
| Total | 11 | 13 | 19.5 (5.3) | 11 | 13 | 28.8 (1.5) |
3 Acoustic and Linguistic Features
Acoustic feature extraction was performed on the speech segments using the openSMILE v2.1 toolkit which is an open-source software suite for automatic extraction of features from speech, widely used for emotion and affect recognition in speech [11], and with in-house software [bib:Luz18vocaldia]. As the purpose of this paper is to describe the prediction tasks and set simple baselines that can be attained without extensive optimisation, we did not perform any feature set reduction procedures. The following is a brief description of the acoustic feature sets used in the experiments described in this paper:
emobase: This feature set contains the mel-frequency cepstral coefficients (MFCC) voice quality, fundamental frequency (F0), F0 envelope, line spectral pairs (LSP) and intensity features with their first and second order derivatives. Several statistical functions are applied to these features, resulting in a total of 988 features for every speech segment [11].
ComParE: The ComParE 2013 [12] feature set includes energy, spectral, MFCC, and voicing related low-level descriptors (LLDs). LLDs include logarithmic harmonic-to-noise ratio, voice quality features, Viterbi smoothing for F0, spectral harmonicity and psychoacoustic spectral sharpness. Statistical functionals are also computed, bringing the total to 6,373 features.
eGeMAPS: The eGeMAPS [13] feature set resulted from an attempt to reduce the somewhat unwieldy feature sets above to a basic set of acoustic features based on their potential to detect physiological changes in voice production, as well as theoretical significance and proven usefulness in previous studies [14]. It contains the F0 semitone, loudness, spectral flux, MFCC, jitter, shimmer, F1, F2, F3, alpha ratio, Hammarberg index and slope V0 features, as well as their most common statistical functionals, for a total of 88 features per speech segment.
MRCG functionals: Multi-resolution Cochleagram features (MRCGs) were proposed by Chen et al. [15] and have since been used in speech related applications such as voice activity detection [16], speech separation [15], and more recently for attitude recognition [17]. MRCG features are based on cochleagrams [18]. A cochleagram is generated by applying the gammatone filter to the audio signal, decomposing it in the frequency domain so as to mimic the human auditory filters. MRCG uses the time-frequency representation to encode the multi-resolution power distribution of the audio signal. Four cochleagram features were generated at different levels of resolution. The high resolution level encodes local information while the remaining three lower resolution levels capture spectrotemporal information. A total of 768 features were extracted from each frame: 256 MRCG features (frame length of 20 ms and frame shift of 10 ms), along with 256 MRCG and 256 MRCG features. The statistical functionals (mean, standard deviation, minimum, maximum, range, mode, median, skewness and kurtosis) were applied on the 768 MRCG features for a total of 6,912 features.
Minimal: this feature set consists of basic statistics (mean, standard deviation, median, minimum and maximum) of the duration of vocalisations and pauses and speech rate, and a vocalisation count, similarly to [7].
In sum, we extracted 88 eGeMAPS, 988 emobase, 6,373 ComParE, 6,912 MRCG, and 13 minimal features from 4,077 speech segments. Excepting the minimal feature set, Pearson’s correlation test was performed to remove acoustic features that were significantly correlated with duration (when ). Hence, 72 eGeMAPS, 599 emobase, 3,056 ComParE, and 3,253 MRCG features were not correlated with the duration of the speech chunks, and were therefore selected for the machine learning experiments. Examples of features from the ComParE feature set by the above described procedure include L1-norms of segment length functionals smoothed by a moving average filter (including their means, maxima and standard deviations), and the relative spectral transform applied to auditory spectrum (RASTA) functionals (including the percentage of time the signal is above 25%, 50% and 75% of range plus minimum).
In addition, we used the EVAL command in the CLAN program [bib:MacWhinneyt2017] to compute a basic set of 34 language outcome measures (e.g., duration, total utterances, MLU, type-token ratio, open-closed class word ratio, percentages of 9 parts of speech) on the CHAT transcripts.
4 AD classification task
The AD classification task consists of creating a binary classification models to distinguish between AD and non-AD patient speech. These models may use speech data, transcribed speech, or both. Any methodological approach may be taken, but participants will work with the same dataset. The evaluation metric for this task are , precision , recall , and , where N is the number of patients, TP, FP and FN are the number of true positives, false positives and false negatives, respectively.
We performed our baseline classification experiments using five different methods, namely linear discriminant analysis (LDA), decision trees (DT, with leaf size of 20 and the CART algorithm), nearest neighbour (1NN, for KNN with K=1), random forests (RF, with 50 trees and a leaf size of 20) and support vector machines (SVM, with a linear kernel with box constraint of 0.1, and sequential minimal optimisation solver). The classification methods were implemented in MATLAB [19] using the statistics and machine learning toolbox. A leave-one-subject-out (LOSO) cross-validation setting was adopted, where the training data do not contain any information from validation subjects.
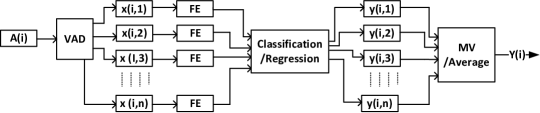
Two-step classification experiments were conducted to detect cognitive impairment due to AD (as shown in Figure 1). This consisted of segment-level (SL) classification, where classifiers were trained and tested to predict whether a speech segment was uttered by a non-AD or AD patient, and majority vote (MV) classification, which assigned each subject a class label based on the majority labels of SL classification.
4.1 Results
The classification accuracy is shown in Tables 3 and 4 for LOSO and test settings respectively. These results show that the 1NN (0.574) provides the best accuracy for acoustic features using ComParE set for AD detection, with accuracy above the chance level of 0.50. From the results shown in Table 3, we note that even though 1NN provides the best result (0.574), DT and LDA also exhibit promising performance, being in fact more stable across all feature sets than the other classifiers (the best average accuracy of 0.559 for LDA and 0.570 for DT). We also note that Minimal, ComParE and linguistic also exhibit promising performance, being in fact more stable across all classifiers than the other features (the best average accuracy of 0.552 for Minimal, 0.541 for Compare and 0.713 for linguistic). Based on these findings we have selected the LDA model trained using ComParE as our baseline model for acoustic features.
Table 4 shows that 1NN provides less accurate results on the test set than in LOSO cross validation. However, the results of LDA (0.625) and DT (0.625) improve on the test data for acoustic features. The linguistic features provide an accuracy of 0.75, which is better than automatically extracted acoustic features though it relies on manual transcription. The challenge baseline accuracy for the classification task are therefore 0.625 for acoustic features and 0.75 for linguistic features. The precision, recall and F1 Score are reported in Table 5.
| Features | LDA | DT | 1NN | SVM | RF | mean |
|---|---|---|---|---|---|---|
| emobase | 0.500 | 0.519 | 0.398 | 0.491 | 0.472 | 0.476 |
| ComParE | 0.565 | 0.528 | 0.574 | 0.528 | 0.509 | 0.541 |
| eGeMAPS | 0.482 | 0.500 | 0.380 | 0.333 | 0.482 | 0.435 |
| MRCG | 0.519 | 0.500 | 0.482 | 0.528 | 0.509 | 0.507 |
| Minimal | 0.519 | 0.667 | 0.426 | 0.565 | 0.583 | 0.552 |
| linguistic | 0.768 | 0.704 | 0.740 | 0.602 | 0.750 | 0.713 |
| mean | 0.559 | 0.570 | 0.500 | 0.508 | 0.551 | – |
| Features | LDA | DT | 1NN | SVM | RF | mean |
|---|---|---|---|---|---|---|
| emobase | 0.542 | 0.688 | 0.604 | 0.500 | 0.729 | 0.613 |
| ComParE | 0.625 | 0.625 | 0.458 | 0.500 | 0.542 | 0.550 |
| eGeMAPS | 0.583 | 0.542 | 0.688 | 0.563 | 0.604 | 0.596 |
| MRCG | 0.542 | 0.563 | 0.417 | 0.521 | 0.542 | 0.517 |
| Minimal | 0.604 | 0.562 | 0.604 | 0.667 | 0.583 | 0.604 |
| linguistic | 0.750 | 0.625 | 0.667 | 0.792 | 0.750 | 0.717 |
| mean | 0.608 | 0.601 | 0.573 | 0.590 | 0.625 | – |
| class | Precision | Recall | F1 Score | Accuracy | |
|---|---|---|---|---|---|
| non-AD | 0.56 | 0.61 | 0.58 | 0.56 | |
| AD | 0.57 | 0.52 | 0.54 | ||
| non-AD | 0.67 | 0.50 | 0.57 | 0.62 | |
| AD | 0.60 | 0.75 | 0.67 | ||
| non-AD | 0.76 | 0.78 | 0.77 | 0.77 | |
| AD | 0.77 | 0.76 | 0.77 | ||
| non-AD | 0.70 | 0.87 | 0.78 | 0.75 | |
| AD | 0.83 | 0.62 | 0.71 |
5 MMSE prediction task
The MMSE prediction task consists of generating a regression model for prediction of MMSE scores of individual participants from the AD and non-AD groups. Unlike classification, MMSE prediction is relatively uncommon in the literature, despite MMSE scores often being available. While models may use speech (acoustic) or linguistic data individually or in combination, the baseline described here report results of acoustic and linguistic models built separately.
5.1 Baseline regression
We performed our baseline regression experiments using five different methods, namely decision trees (DT, with leaf size of 20 and CART algorithm), linear regression (LR), gaussian process regression (GPR, with a squared exponential kernel), least-squares boosting (LSBoost, which contains the results of boosting 100 regression trees) and support vector machines (SVM, with a radial basis function kernel with box constraint of 0.1, and sequential minimal optimisation solver). The regression methods are implemented in MATLAB [19] using the statistics and machine learning toolbox. As with classification, the regression experiments were conducted in two steps for acoustic features (Figure 1), with SL regression followed by averaging of predicted MMSE values.
5.2 Results
The regression results are reported as root mean squared error (RMSE) scores in Tables 6 and 7 for LOSOCV and test data. These results show that DT (7.28) provides the best RMSE using MRCG features for MMSE prediction with , being more stable across all acoustic feature sets than the other classifiers (the best average RMSE of 6.86 for DT). We also note that Minimal and eGeMaPs also exhibit promising performance, with RMSE of 7.46 and 8.02 respectively across models. Based on this, the DT model trained using the MRCG feature was chosen as the baseline model for the regression task for acoustic features. For linguistic features, we selected the DT model as baseline with RMSE of 4.38 ().
Table 7 shows the results of regression methods on test data. The baseline model (DT with MRCG features) provides an RMSE of 6.14 () in the test setting. Hence the challenge baseline accuracy for this task is 6.14 for acoustic features. The linguistic feature model provides an RMSE of 5.20 (), which therefore corresponds to the ADReSS challenge baseline accuracy for linguistic features in this task.
| Features | Linear | DT | GP | SVM | LSBoost | mean |
|---|---|---|---|---|---|---|
| emobase | 7.44 | 7.29 | 7.71 | 7.71 | 8.33 | 7.70 |
| ComParE | 15.69 | 7.29 | 7.67 | 7.63 | 7.84 | 9.22 |
| eGeMAPS | 8.08 | 7.31 | 7.72 | 8.55 | 8.68 | 8.07 |
| MRCG | 13.46 | 7.28, r= -0.76 | 7.65 | 7.50 | 8.02 | 8.78 |
| Minimal | 7.39 | 7.60 | 7.18 | 8.01 | 7.14 | 7.46 |
| Linguistic | 6.15 | 4.38, r=0.79 | 7.92 | 6.34 | 7.44 | 6.45 |
| mean | 9.70 | 6.86 | 7.64 | 7.62 | 7.91 | – |
| Features | Linear | DT | GP | SVM | LSBoost | mean |
|---|---|---|---|---|---|---|
| emobase | 6.80 | 6.78 | 6.36 | 6.18 | 6.73 | 6.57 |
| ComParE | 6.47 | 6.52 | 6.33 | 6.19 | 6.72 | 6.45 |
| eGeMAPS | 6.90 | 5.99 | 6.28 | 6.12 | 6.41 | 6.34 |
| MRCG | 6.70 | 6.14, r=0.22 | 6.33 | 6.20 | 6.31 | 6.33 |
| Minimal | 6.29 | 6.84 | 6.58 | 6.19 | 7.71 | 6.72 |
| Linguistic | 4.78 | 5.20, r= 0.57 | 5.54 | 6.24 | 6.62 | 5.68 |
| mean | 6.32 | 6.25 | 6.24 | 6.19 | 6.75 | – |
6 Discussion
These results of the classification baseline are comparable to those attained by models based on speech recordings available from spontaneous speech samples in DementiaBank’s Pitt corpus [8], which is widely used. Accuracy scores of 81.92%, 80% and 79% and 64% have been reported in the literature [3, 20, 21, 7]. Although these studies report higher accuracy than ours, all of those (except [7]) include information from the manual transcripts, and were conducted on an unbalanced dataset (in terms of age, gender and number of subjects in the AD and non-AD classes). It is also worth noting that accuracy for the best performing of these models drops to 58.5% when feature selection is not performed on their original set of 370 linguistic and acoustic features [3]. The performance of a model without the information from transcripts, that is, relying only on acoustic features as we do, is only reported in [7] (64%) and [21], where its SVM model drops to an average accuracy of 62%. It is also noted that previous studies do not evaluate their methods in a complete subject-independent setting (i.e. they consider multiple sessions for a subject and classify a session instead of a subject). This could lead to overfitting, as the model might learn speaker dependent features from a session and then, based on those features, classify the next session of the same speaker.
One strength of our method is its speaker independent nature. Ambrosini et al. reported an accuracy of 80% while using acoustic (pitch, unvoiced duration, shimmer, pause duration, speech rate), age and educational level features for cognitive decline detection using an Italian dataset of an episodic story telling setting [22]. However, this dataset is less easily comparable to ours, as it is elicited differently, and is not age and gender balanced.
Yancheva and colleagues [23] predicted MMSE scores with speech-related features using the full DementiaBank Pitt dataset, which is not balanced and includes longitudinal observations. Their model yielded a mean absolute error (MAE) of 3.83 in predicting MMSE. However, they employed lexicosyntactic and semantic features derived from manual transcription, rather than automatically extracted acoustic features as we used in our analysis. In [23], those linguistic features were the main features selected from a group of 477, with acoustic features typically not being among the most relevant. Therefore no quantitative results were reported for acoustic features.
7 Conclusions
This paper described the ADReSS challenge, and set simple baselines for its tasks, demonstrating the relevance of acoustic and linguistic features of spontaneous speech for cognitive impairment detection in the context of Alzheimer’s Disease diagnosis and MMSE prediction. Machine learning methods operating on automatically extracted voice features provide a baseline accuracy of up to 62.5% on the AD classification task, while linguistic features extracted from manually produced transcripts yielded 76.85% accuracy on the same task. These results are well above the chance level of 50%. A baseline RMSE of 6.14 and 5.21 for acoustic and linguistic features respectively on test has been established for the MMSE regression task. It is reasonable to expect that the ADReSS Challenge’s participants will attain better accuracy scores by employing further pre-processing, feature set reduction, and more complex models than the ones employed in this paper. By bringing the research community together in order to work on a shared task on the same dataset, ADReSS intends to make comprehensive methodological comparisons. This will hopefully highlight research caveats and shed light on avenues for clinical applicability and future research directions.
8 Acknowledgements
This research is funded by the European Union’s Horizon 2020 research programme, under grant agreement 769661, SAAM project. SdlFG is supported by the Medical Research Council.
References
- [1] American Psychiatric Association, “Delirium, dementia, and amnestic and other cognitive disorders,” in Diagnostic and Statistical Manual of Mental Disorders, Text Revision (DSM-IV-TR), 2000, ch. 2.
- [2] World Health Organization, “Mental health action plan 2013-2020,” WHO Library Cataloguing-in-Publication DataLibrary Cataloguing-in-Publication Data, pp. 1–44, 2013.
- [3] K. C. Fraser, J. A. Meltzer, and F. Rudzicz, “Linguistic features identify Alzheimer’s disease in narrative speech,” Journal of Alzheimer’s Disease, vol. 49, no. 2, pp. 407–422, 2016.
- [4] S. Luz, S. D. la Fuente, and P. Albert, “A method for analysis of patient speech in dialogue for dementia detection,” in Procs. of LREC’18, D. Kokkinakis, Ed. Paris, France: ELRA, may 2018.
- [5] B. Mirheidari, D. Blackburn, T. Walker, A. Venneri, M. Reuber, and H. Christensen, “Detecting signs of dementia using word vector representations.” in INSTERSPEECH, 2018, pp. 1893–1897.
- [6] F. Haider, S. De La Fuente Garcia, and S. Luz, “An assessment of paralinguistic acoustic features for detection of alzheimer’s dementia in spontaneous speech,” IEEE Journal of Selected Topics in Signal Processing, 2019.
- [7] S. Luz, “Longitudinal monitoring and detection of Alzheimer’s type dementia from spontaneous speech data,” in Procs. of the Intl. Symp on Comp. Based Medical Systems (CBMS). IEEE, 2017, pp. 45–46.
- [8] J. T. Becker, F. Boller, O. L. Lopez, J. Saxton, and K. L. McGonigle, “The Natural History of Alzheimer’s Disease,” Archives of Neurology, vol. 51, no. 6, p. 585, 1994.
- [9] H. Goodglass, E. Kaplan, and B. Barresi, BDAE-3: Boston Diagnostic Aphasia Examination – Third Edition. Lippincott Williams & Wilkins Philadelphia, PA, 2001.
- [10] B. MacWhinney, The CHILDES project: Tools for analyzing talk, Volume II: The database. Psychology Press, 2014.
- [11] F. Eyben, M. Wöllmer, and B. Schuller, “openSMILE: the Munich versatile and fast open-source audio feature extractor,” in Procs. of ACM-MM. ACM, 2010, pp. 1459–1462.
- [12] F. Eyben, F. Weninger, F. Groß, and B. Schuller, “Recent developments in openSMILE, the Munich open-source multimedia feature extractor,” in ACM-MM. ACM, 2013, pp. 835–838.
- [13] F. Eyben, K. R. Scherer, B. W. Schuller, J. Sundberg, E. André, C. Busso, L. Y. Devillers, J. Epps, P. Laukka, S. S. Narayanan et al., “The Geneva minimalistic acoustic parameter set GeMAPS for voice research and affective computing,” vol. 7, no. 2, pp. 190–202, 2016.
- [14] ——, “The geneva minimalistic acoustic parameter set (gemaps) for voice research and affective computing,” vol. 7, no. 2, pp. 190–202, 2016.
- [15] J. Chen, Y. Wang, and D. Wang, “A feature study for classification-based speech separation at low signal-to-noise ratios,” vol. 22, no. 12, pp. 1993–2002, 2014.
- [16] J. Kim and M. Hahn, “Voice activity detection using an adaptive context attention model,” IEEE Signal Processing Letters, 2018.
- [17] F. Haider and S. Luz, “Attitude recognition using multi-resolution cochleagram features,” in Procs. of ICASSP, 2019, pp. 3737–3741.
- [18] D. Wang, “On ideal binary mask as the computational goal of auditory scene analysis,” in Speech Separation by Humans and Machines. Springer, 2005, pp. 181–197.
- [19] MATLAB, version 9.6 (R2019a). Natick, Massachusetts: The MathWorks Inc., 2019.
- [20] M. Yancheva and F. Rudzicz, “Vector-space topic models for detecting Alzheimer’s disease,” in Procs. of ACL, 2016, pp. 2337–2346.
- [21] L. Hernández-Domínguez, S. Ratté, G. Sierra-Martínez, and A. Roche-Bergua, “Computer-based evaluation of Alzheimer’s disease and mild cognitive impairment patients during a picture description task,” Alzheimer’s & Dementia: Diagn., Asses. & Dis. Mon., vol. 10, pp. 260–268, 2018.
- [22] E. Ambrosini, M. Caielli, M. Milis, C. Loizou, D. Azzolino, S. Damanti, L. Bertagnoli, M. Cesari, S. Moccia, M. Cid et al., “Automatic speech analysis to early detect functional cognitive decline in elderly population,” in 2019 41st Annual International Conference of the IEEE Engineering in Medicine and Biology Society (EMBC). IEEE, 2019, pp. 212–216.
- [23] M. Yancheva, K. Fraser, and F. Rudzicz, “Using linguistic features longitudinally to predict clinical scores for Alzheimer’s disease and related dementias,” in Proceedings of SLPAT 2015: 6th Workshop on Speech and Language Processing for Assistive Technologies, 2015, pp. 134–139.