∎
22email: massimo.dellavalle@inaf.it 33institutetext: L. Izzo 44institutetext: DARK/NBI, Copenhagen, Denmark & IAA/CSIC, Granada, Spain
Observations of galactic and extragalactic novae
Abstract
The recent GAIA DR2 measurements of distances to galactic novae have allowed to re-analyse some properties of nova populations in the Milky Way and in external galaxies on new and more solid empirical bases. In some cases we have been able to confirm results previously obtained, such as the concept of nova populations into two classes of objects, that is disk and bulge novae and their link with the Tololo spectroscopic classification in Fe II and He/N novae. The recent and robust estimates of nova rates in the Magellanic Clouds galaxies provided by the OGLE team have confirmed the dependence of the normalized nova rate (i.e., the nova rate per unit of luminosity of the host galaxy) with the colors and/or class of luminosity of the parent galaxies. The nova rates in the Milky Way and in external galaxies have been collected from literature and critically discussed. They are the necessary ingredient to asses the contribution of novae to the nucleosynthesis of the respective host galaxies, particularly to explain the origin of the overabundance of lithium observed in young stellar populations. A direct comparison between distances obtained via GAIA DR2 and Maximum Magnitude vs. Rate of Decline (MMRD) relationship points out that the MMRD can provide distances with an uncertainty better than 30%. Multiwavelength observations of novae along the whole electromagnetic spectrum, from radio to gamma-rays, have revealed that novae undergo a complex evolution characterized by several emission phases and a non-spherical geometry for the nova ejecta.
Keywords:
Novae, cataclysmic variables Distance scale Nuclear reactions, nucleosynthesis, abundances Supernovae: general Galaxy: stellar content1 Observations of guest stars
In the ancient chronicles, particularly in the almanacs of the Chinese astronomers, all “temporary” or “transient” phenomena that suddenly appeared in the sky, to then fade and disappear after days or months, were generally indicated with the name of “guest stars” or “visitor stars”. This definition was very broad and it was used to classify a large number of astronomical events such as comets, planets in opposition or conjunction, and new stars. In those days there were no clues about the different origin of these phenomena and the common idea was that they were somehow related to each others. In Europe these events were also reported as “Stella Nova”, the Latin name for “New Star” (Stellae Novae in his plural form). Unlike the locution Supernova that is a recent term, coined in the 1930s, Stella Nova in astronomy was used for the first time about 2000 years ago in the Natural History of Pliny the Elder. In his second book111Out of 37 that constitute his entire work dedicated to Astronomy and Meteorology, Pliny reports:
“Hipparchus himself …detected a “new star” that led him to wonder whether this was a frequent occurrence” and “he dared to prepare a list of stars for posterity to indicate their positions and magnitudes, in order that from that time onward it might be possible to discern not only whether stars perish and are born, transit and in motion, and also whether they increase and decrease in magnitude”
To preserve the Aristotle’s dogma on the perfection and immutability of the heavens, in which Stellae Novae obviously did not fit, the ancient astronomers considered nova stars sub-lunar phenomena or even Earth’s atmosphere occurrences. Therefore, in this view, these objects did not belong to the “octave sphere” the so called “sphere of fixed stars”: the skies beyond Saturn were indeed immutable by definition. Despite these ideological prejudices, the observation of new stars was never abandoned, and therefore today we know, at least approximately, the positions in the sky of many remnants of those stellar explosions and some of them have been targeted with modern instrumentation (see, e.g., Shara et al 2017b). The reason for which the ancient observers keep alive the interest in observing these phenomena was simple. Until few centuries ago, very little or even nothing was known about the real nature of the stars and planets. According to the Italian poet, Giacomo Leopardi (1798–1837):
“the knowledge of the effects and the ignorance of the causes produced astrology”,
therefore, we should not be surprised to learn that in those times astrology and astronomy were indistinguishable. They were both part of a culture that considered the earthly events announced in the sky through the manifestation of strange and unusual phenomena, such the sudden appearance of comets or “new stars”. We can only imagine what was the apprehension or excitement in the naive and unprepared observers of those strange phenomena. Due to the way in which nova stars appeared in the sky, suddenly and without any warning signs, these events were often considered omens of misfortune, so their observational follow-up was extremely important: it could help in predicting the “unknown” that a little later would have happened on Earth. This climate is well represented by the chronicles of observations made in the Benedictine Abbey of St. Gall, today in Switzerland, about the “nova star” of 1006 that we know today to have been a Supernova explosion indeed. The monks reported an immense light that blinded sight and aroused a certain fear.
Novae and Supernovae were not considered two distinct families of objects until last century. The rapidly increasing number of nova discovery in Spiral Nebulae due to systematic searches (Ritchey, 1917a, b, 1918; Curtis, 1917b, c; Pease, 1917; Duncan, 1918; Sanford, 1918, 1919) started to cast the first doubts about a common origin of these phenomena. In those years, novae played a pivotal role in the debate about the galactic or extra-galactic nature of the nebulae. For example, in his paper on “Novae in Spiral Nebulae and the Island Universe Theory” Heber Curtis at the end of his short note (Curtis, 1917a) correctly inferred:
“If we assume equality of absolute magnitude for galactic and spiral novae, then the latter, being apparently 10 magnitudes the fainter, are of the order of 100 times as far away as the former.”
However, this simple conclusion was questioned by the strange case of S Andromedae (And). This nova occurred in M31 in 1885 and today is classified as sub-luminous SN-Ia. The 6th magnitude achieved by S And at peak luminosity was much brighter than the apparent magnitudes of all other nova stars in Andromeda Galaxy and in other spiral Nebulae. As noted by Shapley (1917):
“…the average [magnitude] for the eleven [novae] given in the table is at least magnitude , and the maximum for S Andromedae is at least , a luminosity nearly a hundred million times that of our Sun, the equivalent of the light emission of a million stars of zero absolute magnitude, and probably, therefore, much greater than the total light of all the stars seen with naked eye …”
an argument that led him to conclude:
“ …hence stellar luminosities of these orders seem out of the question and accordingly the close comparability of spirals containing such Novae to our Galaxy appears inadmissible …”.
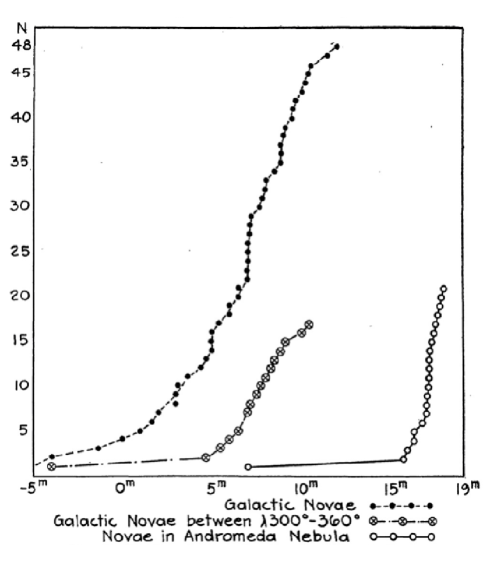
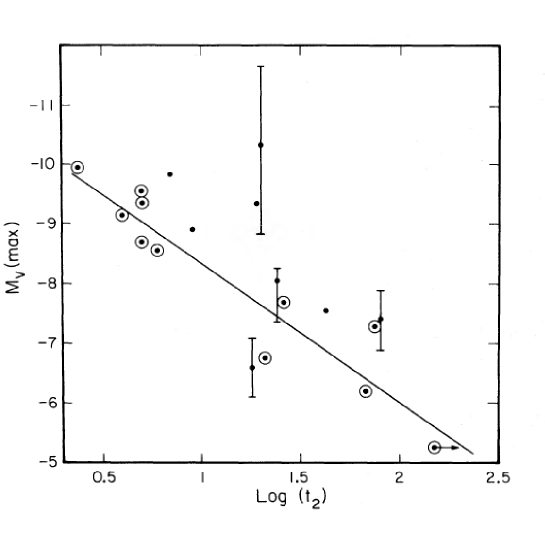
For many decades novae have been used as rulers of distance outside our Galaxy (Pritchet and van den Bergh, 1987; Della Valle and Livio, 1995; Shara et al, 2018), so it appears somehow ironic that the erroneous interpretation of S And in terms of nova explosion has significantly delayed the correct measurements of the distance to M31 and more generally the correct interpretation of the spiral Nebulae as systems external to the Milky Way. However, this conundrum was taken by Lundmark (1923) the other way around, he assumed that spiral Nebulae were extragalactic systems and in a series of paper published between 1920 and 1923 he realized first that “…Spiral Nebulae were extragalactic objects …some Nova got very bright…”, and therefore “…a division into two magnitude classes is not impossible.” (see Fig. 1).
The brightest class of explosive variables was labelled in the following decades in different ways. Lundmark (1927) called them upper-class novae, while Hubble (1929) calls S Andromedae exceptional case and finally Baade and Zwicky (1934) proposed the definition currently adopted of Super-novae. In the following years the hyphen has disappeared. Lundmark (1935) pointed out the existence, at the faint tail of the luminosity distribution of novae, of two other groups of “temporary stars”: the U Gem or Dwarf Novae and nova-like objects. He also provided the first classification in terms of luminosity at maximum for the whole family of explosive variables:
-
A.
The upper-class novae or super-novae, having an absolute magnitude at maximum () around mag;
-
B.
The middle-class novae, or ordinary novae, with an absolute magnitude at maximum very close to mag;
-
C.
The lower-class novae, or the dwarf novae, having an absolute magnitude at maximum around +3 mag or +4 mag.
Lundmark also provided the first estimate of their frequency of occurrence in the Milky Way: 1 in 50 years for super-novae and about 50 ordinary novae per year. “Thus the ordinary Novae are at least 2500 times more frequent than the super-Novae.” We note that current estimates of this ratio for spirals galaxies range between – (Della Valle and Livio, 1994).
1.1 First theories
Since the times of Riccioli (1596–1671), Hevelius (1611–1687) and Fabricious (1564–1617) many theories were developed to explain the nature of the nova phenomenon. Gian Battista Riccioli, in the ninth book of its encyclopedic work “Almagestum Novum”, dedicated to “Comets and New Stars”, listed a dozen of theories to explain the nature of these transients phenomena. At that time the physical understanding of nova explosions was completely inaccessible, so it is not surprising that the theories presented in the Riccioli’s work appear today as naive and extravagant. For example, it was assumed that these “temporary” stars were not “new” but in fact they were “old” and that they were hidden in the depths of the ether, invisible to us, because of their vast distance. These stars were supposed to be in motion and when they approached the Earth, they became visible and when they moved away they became invisible again. This idea was initially conceived to explain the behaviour of Tycho’s new star, but it was also used to explain the appearance and disappearance of periodic stars as Mira Ceti. Many other theories were devised in the following centuries and in some cases they were characterized by more physical insight with respect to the oldest ones. For example, de Maupertuis (1732) suggested that the appearance and disappearance of new stars could be originated by the unbalanced action of planets around stars that were flattened by their very high angular momentum. When the geometrical alignment between the flattened star and the observer turned from edge-on to face-on, the observer could measure a dramatic change in the brightness of the star. According to Newton (1729), novae were old stars that had exhausted their reserve of light and vapors and therefore were not anymore visible in the sky. They could have returned to “new splendor” after being fed with fresh supply of gas provided by comets that fell upon them. In this case the idea that a nova was an “old” star that could be rejuvenated or reinvigorated by gas coming from another external celestial body, appears remarkable and not distant, at least in its general principle, from modern ideas, in which the fuel source are not comets but a companion star. Finally, we note the very imaginative hypothesis elaborated by Monck (1885) to explain the nature of S Andromedae:
“Gaseous nebulae sometimes occupy degrees in the sky …The rush of a star through a gaseous nebula is therefore no improbable event and it is certain that if occurred the star would be highly heated, and its light greatly intensified. An idea that was borrowed by shooting stars events that are known to be dark bodies rendered luminous for a short time by rushing through our atmosphere …”
1.2 Modern times
We had to wait for the 20th century, particularly the 1950s and 1960s to come to understand the nova phenomenon in its general lines. The beginning of “modern times” might be set by the work of Schatzman (1951) who highlighted the role of 3He in triggering “une onde de detonation” that might be at the origin of the nova phenomenon. The following steps, i.e., the discovery that DQ Her was a binary system (Walker, 1954) and that the binary condition was common to all cataclysmic variables including novae (Kraft, 1964), laid the physical basis to conclude that nova outbursts are related to mass accretion phenomena onto the surface of degenerate hot companion (Kraft, 1965; Paczyński, 1965). All previous items, complemented with the first hydrodynamic studies of nova ejections (Sparks, 1969), provided the pillars on which the modern studies on nova explosions have then progressed (Starrfield et al, 1975; Prialnik et al, 1978; Nariai et al, 1980).
The current framework for Classical Novae establishes that they are explosive events caused by the ignition of the thermonuclear runaway (TNR) on the surface of a white dwarf that is accreting material, under degenerate conditions, from a low main sequence companion (e.g. Gallagher and Starrfield, 1978). Most novae are semi-detached binary star systems where a late-type main sequence star, which has filled its Roche-lobe, transfers mass through the inner L1 Lagrangian point, to the white dwarf companion. When the gas falls onto the compact object, because of its angular momentum with respect to the accreting star, it will not fall directly onto the white dwarf but will start orbiting around it. Gas particles, having different orbits will collide with each other and, shortly after their bulk motion will be circularized through friction and viscosity processes, the gas will eventually form an accretion disk before falling onto the compact object. In passing we note that this process can be partially or totally inhibited by the presence of strong magnetic fields (Wickramasinghe et al, 2014). If the mass accretion rate onto the white dwarf is sufficiently low the accreted gas becomes degenerate, and both pressure and temperature in the accreted envelope will dramatic increase. Finally, TNR will ignite at the base of the accreted envelope leading to a nova eruption. The explosion is not destructive for the white dwarf, therefore nova explosions are “recurrent” and the period of time between two explosions can be as short as a few months (Kato et al, 2014) and as long as years. The length of this time scale marks the difference from the so called “Recurrent Novae”, (RNe) i.e., novae for which at least two outbursts have been recorded (typically RNe show more explosions over the lifetime of an astronomer) and Classical Novae (CNe) characterized by much longer intervals of time between two explosions.
In a very simplified scheme a white dwarf composed of either carbon-oxygen (CO) or oxygen-neon-magnesium (ONeMg) accretes hydrogen rich material from a companion star at a rate of and as the matter piles up onto its surface, it becomes dense and hot. It is heated at its bottom mainly by gravitational compression. When the pressure and the temperature at the bottom of the accreted layer reaches the critical values of
| (1) |
of – dyne cm-2 (Fujimoto, 1982; Truran and Livio, 1986) and T K, the nuclear reactions ignite. In fact theoretical calculation for realistic nova outbursts show that also depends on other quantities such as and (Kato et al, 2014). These reactions produce short-lived (about 100s) radioactive nuclei that can be transported by convection in the outer envelope. This is efficiently heated up, leading to higher temperatures, which in turn causes more nuclear burning. The temperature eventually rises and causes the softening of the degeneracy of the layers above the nuclear burning and a TNR flash occurs then expelling the ejecta. At the critical pressure, it corresponds a critical ignition mass, which is a function of the radius of WD and its mass:
| (2) |
Therefore, for a given , the recurrence time:
| (3) |
is proportional to .
From the radius of the WD expressed as a function of its mass (Eggleton, 1983):
| (4) |
we derive that the more massive WDs, e.g., , are characterized by recurrence time shorter by a factor 282 with respect to light WDs with masses of . This first order computation is in good agreement with the recurrence times scale obtained by several authors (Truran and Livio, 1986; Politano et al, 1990; Ritter et al, 1991), see also Table 1, for which .
| Mass WD | Interval |
|---|---|
| years | |
| 0.60 | 12.9 |
| 0.70 | 7.3 |
| 0.80 | 4.2 |
| 0.90 | 2.4 |
| 1.00 | 1.2 |
| 1.10 | 0.64 |
| 1.20 | 0.28 |
| 1.30 | 0.09 |
| 1.35 | 0.04 |
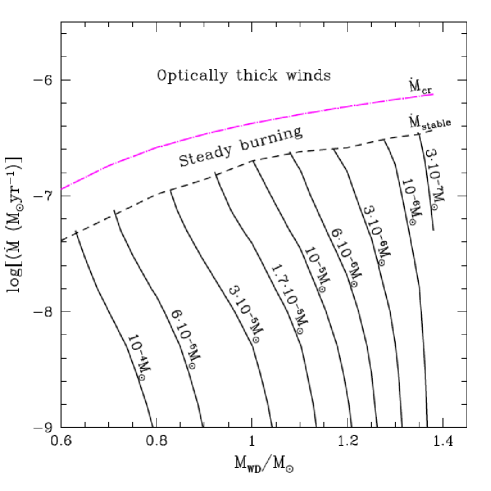
Yaron et al (2005) have computed an extended grid of multi-cycle nova evolution models and obtained recurrence times at varying the mass of and temperature of the WD and . For a typical value of we consistently derive a ratio of 390. Accurate grids provided by Kato et al (2014) computed for a range give consistent results within a factor about two for , see Fig. 2. Now we can estimate on the basis of simple arguments the duration of the nova duty cycle. A system formed by a low main sequence companion of 0.5 can experience about 0.5 outbursts. The parameter is a coefficient that accounts for the efficiency of the accretion through the inner Lagrangian point, , which is estimated to be of the order of 20% (see Sect. 12). For and for fast and slow novae (see Sect. 10) we derive about outbursts during a nova cycle, consistently with the “classical” estimates (Bath and Shaviv, 1978).
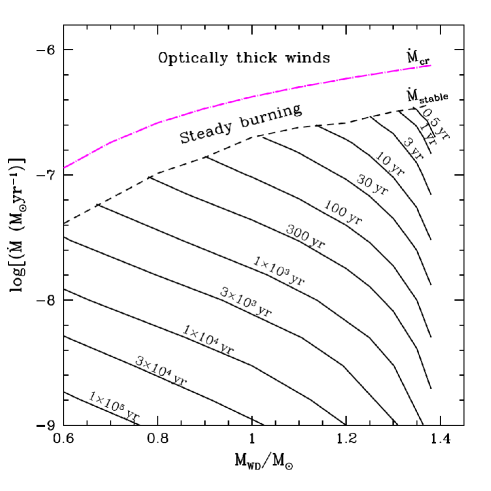

Thus, the mean lifetime for nova systems turns out to be , therefore years and years for massive and light nova progenitors, respectively. The connection among , , and Menv was explained by several authors e.g. Nomoto (1982a) (Fig. 3) and revised in recent years by Kato et al (2014) (Fig. 4). The more massive WDs expel the lightest envelopes with the highest ejection velocities, up to 4000–5000 km/s in the most extreme cases. In many post-novae a “quiet” H-burning continues in a kind of steady state then originating the so called SuperSoft X-ray phase (Oegelman et al, 1984; Orio et al, 2001; Henze et al, 2010), see also Sect. 12.2.
The physical processes regulating the ejection of the gas are still matter of debate. The entire evolution of a nova outburst can be explained in terms of a continuum radiation wind (Kato and Hachisu, 1994) or through an homologous ballistic ejection of a discrete shell (Shore et al, 1996). More recently, the detection of high-energy radiation from novae combined with radio and optical high-resolution observations led to the proposal of a “multi-phase” ejection mechanisms for novae. The current evidence is consistent with an early time ballistic ejection, with a toroidal geometry distribution and a late time bi-polar faster wind (Mukai and Sokoloski, 2019). Their interaction would give rise to shocks and then to the observed high-energy radiation (Metzger et al, 2015).
1.3 Classical novae as cataclysmic variables
Classical Novae fall in the faint tail of stellar explosions that occur in galaxies. With an emitted radiant and kinetic energies of about erg (Gallagher and Starrfield, 1978). They are many orders of magnitude less energetic than gamma-ray bursts (Amati, 2006), Kilonovae (Abbott et al, 2017) and Supernovae (Gal-Yam, 2012). In terms of magnitude at maximum these eruptions can reach an absolute magnitude as bright as nova LMC 1991, -10 mag (Della Valle, 1991; Schwarz et al, 2001), approximately one order of magnitude less luminous than Luminous Red Novae (Pastorello et al, 2019).
Novae belong to the very heterogeneous family of semi-detached binaries and different phenomena are observed according to the nature of the receiving star. If it is a main sequence (MS) star, we have an Algol-type eclipse system characterized by periods of hours/days. If it is a collapsed object, as a white dwarf (WD), we enter in the heterogeneous realm of Cataclysmic Variables (CVs), normally characterized by periods of few hours (but see GK Per, Bianchini et al 1981). With the limits, that are inevitable when we proceed to a schematization, we can broadly divide the CVs family in different sub-classes according to masses of the companion stars and the amount of mass transfer rates. Decades of studies on CV properties effectively summarized by Warner (2003) converge toward the following “outline”:
-
•
if the donor star is a low mass MS star and the receiving star is a WD and , the binary system is labeled as Dwarf Nova (DN);
-
•
if the donor star is a low mass MS star and the receiving star is a high mass WD and –, the binary system is a Classical Nova (CN);
-
•
if the donor star is a MS star (or a giant) and the receiving star is a high mass WD ( ) and – the system is a Recurrent Nova (RN);
-
•
if the donor star is a low mass MS star and the receiving star is a NS/BH, then, the system is a Low Mass X-ray Binary (LMXB);
-
•
if the donor star is a high mass MS (e.g., blue giant) star and the receiving star is a NS/BH, the system is a High Mass X-ray Binary (HMXB);
- •
-
•
if the donor star is another WD, the coalescence can bring the binary system across the Chandrasekhar limit and the double degenerate (DD) system will explode as SN Ia (Iben and Tutukov, 1984, 1985). As an alternative the coalescence of two WDs may not result in a SN-Ia explosion, but eventually producing an “accretion-induced-collapse” to a neutron star (Nomoto and Kondo, 1991).
-
•
if the donor star transfer Helium onto the WD it can explode as SN Ia by igniting off-center at sub-Chandrasekhar masses (Yungelson and Livio, 1998), or feeding the WD in a Helium-rich supersoft X-ray system (Kato and Hachisu 1989, Hachisu et al 1999) and typified by the Recurrent Nova U Sco, in which the WD grows in mass to the Chandrasekhar limit and may explode as SN Ia (Kato and Hachisu, 2012).
In the 1980s, it was proposed (Shara et al, 1986) an unified scenario in which Classical Novae and Dwarf Novae were the same systems observed at different evolutionary stages (see Sect. 3.3).
With “nova-like” we label all poorly studied cataclysmic variable stars which resemble novae due to their photometric behaviour at maximum or minimum or due to their spectral development. It is not infrequent that as soon as more observations are collected it is possible to reclassify some “nova-like” objects as belonging to one of the above reported classes.
2 Introduction
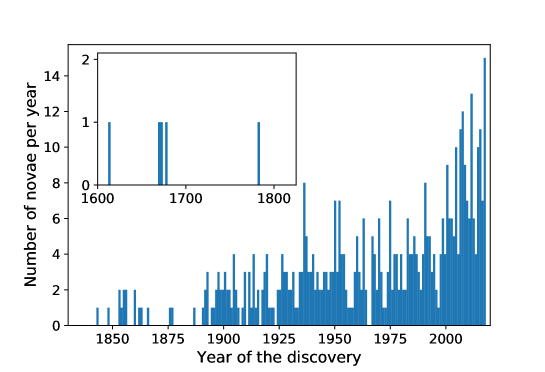
About 400 novae have been observed in the Milky Way since CK Vul 1670 and WY Sge 1783, but only a fraction of them has been observed into some details sufficient to carry out interesting analysis (Fig. 5).
Collections of nova data are periodically updated, reviewed and enriched, see for example Cecchini and Gratton (1942); Duerbeck (1981, 1987); Özdönmez et al (2018); Hachisu and Kato (2018); Schaefer (2018) – S18 hereafter – and Selvelli and Gilmozzi (2019) – SG19 hereafter – and some data from these papers have been used in this work. Reviews on novae have not been very popular since the exhaustive paper by Gallagher and Starrfield (1978). However, we notice there has been an increased interest in this field: the books “Cataclysmic Variable Stars” by Warner (2003) and “Classical Novae” by Bode and Evans (2008), and the more recent reviews by Woodward and Starrfield (2011), Poggiani (2018), Darnley et al (2019) and Shafter (2019).
Spectroscopic and photometric data for historical novae have been extracted from the classical books “The Galactic Novae” by Payne-Gaposchkin (1957) and “Classical Novae” by Bode and Evans (2008), while more recent data have been directly derived from literature (e.g., Ribeiro et al 2013b; Munari et al 2017). However, both historical and new records have been revised according to the Tololo Nova Classification in the spectroscopic “types” Fe II and He/N Novae (Williams et al, 1991; Williams, 1992, 1994; Williams et al, 1994). The modern spectroscopic classification, usually based on low-intermediate resolution, was subsequently integrated by high resolution observations (R 50,000) carried out at ESO-La Silla at the end of 1990s for Milky Way and Magellanic Clouds Novae (Della Valle et al, 2002; Mason et al, 2005). These high resolution data set have provided the observational basis for the detections in the nova ejecta of the so called Transient Heavy Element Absorptions (THEAs, Williams et al 2008) and 7Li/7Be (Izzo et al, 2015; Tajitsu et al, 2015; Molaro et al, 2016; Izzo et al, 2018; Molaro et al, 2020). Lithium and Berillium were ones of the most important and puzzling missing pieces of chemical evolution of the Milky Way (Romano and Matteucci, 2003) and their detection have significantly contributed to assess the role of novae in the Galactic Nucleosynthesis.
Systematic surveys to search for novae in external galaxies have a long historical record. Pioneer surveys on photographic plates were mostly devoted to study the nova population in M31 (Hubble, 1929; Arp, 1956; Rosino, 1956, 1964, 1973; Rosino et al, 1989), M33 (Rosino and Bianchini, 1973), and in the LMC (Graham, 1979). We note that the former surveys were often supplemented by more fragmentary observations (Sharov, 1979) or by “new concept” surveys, as the one carried out on the M31 bulge in H narrow band filter with one-meter class telescopes equipped with CCD detectors (Ciardullo et al, 1987). Photographic data obtained in the 1950s Palomar campaign for the discovery of classical novae in M81 and in the early 1970s at Asiago Observatory for studying novae in M33, were published only in the 1990s (Shara et al, 1999; Della Valle et al, 1994). The modern search for novae in extra-galactic systems has received a significant boost of interest after the seminal paper by Pritchet and van den Bergh (1987) dedicated to study novae in the Virgo Cluster. The paper was a “classical” search for novae in B filter, carried out with a four-meter class telescope (the Canada-France-Hawaii Telescope, CFHT) equipped with CCDs. A work that, despite of only 9 novae discovered in 15 half-nights run, has considerably influenced the subsequent studies in the extragalactic nova topics including the distance scale debate (Jacoby et al, 1992; van den Bergh, 1996). In the following years surveys for nova searches in extragalactic systems (corroborated by some spectroscopy) have been carried out in M31 (Tomaney and Shafter, 1992; Darnley et al, 2004, 2006; Shafter and Irby, 2001; Shafter et al, 2011; Kasliwal et al, 2011; Cao et al, 2012), M51 and M101 (Shafter et al, 2000), in NGC 1316 (Della Valle and Gilmozzi, 2002), M49 (Ferrarese et al, 2003; Curtin et al, 2015), M33 (Shafter et al, 2012), M87 (Shafter et al, 2000; Madrid et al, 2007; Curtin et al, 2015; Shara et al, 2016), M84 (Curtin et al, 2015), NGC 2403 (Franck et al, 2012). Finally, we point out the first homogeneous survey on novae in the Magellanic Clouds (Mróz et al, 2016) since Graham (1979). Sporadic observations carried out on M32 and NGC 205 (Neill and Shara, 2005) have discovered one or possibly two nova outbursts.
The structure of this review is as follows: Sect. 3, 4 and 5 discuss the properties of the Galactic nova populations, their photometric and spectroscopic behaviours, their locations inside the Milky Way, their rate of occurrence and the Maximum Magnitude vs. Rate of decline Relationship (MMRD). Sect. 6 makes a summary of the main nova surveys in the Local Group galaxies and beyond, up to Virgo and Fornax clusters and discusses their frequency of occurrence. Sect. 7 is dedicated to estimate the nova rate in the Globular Cluster systems. Sect. 8 compares the MMRDs in different Hubble type galaxies and discusses the outliers of the MMRD. In Sect. 9 we calibrate the LMC, M31 and Virgo MMRD relations with GAIA Data Release 2 (DR2 – Brown et al 2018) data to determine the distances toward the respective hosts. Sect. 10 dwells on the contribute of novae to the chemical evolution of the host galaxy. Sect. 11 discusses the role of CNe as possible progenitors of SNe-Ia. In Sect. 12 we briefly report on the observations of novae at different wavelengths (radio, X- and -rays) and, finally, in Sect. 13 we give our conclusions.
3 Nova populations in the Milky Way
Baade (1944, 1957) introduced the concept into astronomy that different kinds of stellar populations have different spatial distribution within the galaxies, therefore the starting point to search for a link between speed classes and properties of the nova progenitors is to establish the spatial distribution of novae inside the respective parent galaxies. Due to their intrinsic luminosity, novae can be easily identified in the Milky Way and in external galaxies, thus novae are ideal tracers of their parent stellar population. However, in spite of these favorable conditions, the nova parent population is still an open question. Historical data on galactic novae (Hubble, 1929; McLaughlin, 1942, 1945, 1946; Payne-Gaposchkin, 1957) have received discrepant interpretations. According to Hubble:
“In general, the distribution of novae follows the distribution of luminosity in the nebula. The concentration in the nuclear region is conspicuous.”
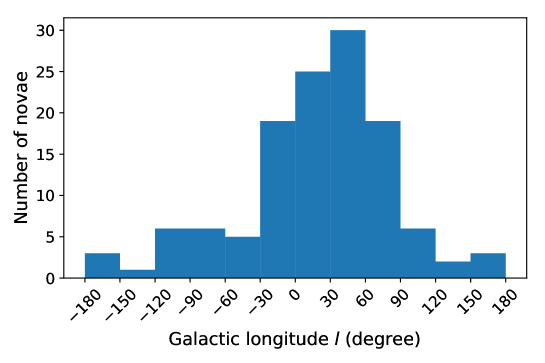
Modern data confirm the strong concentration of novae in the direction of the galactic bulge (Fig. 6). Kukarkin (1949); Kopylov (1955) and Plaut (1965) pointed out the existence of a thickening of novae towards the galactic plane and the galactic center, and the latter author classified novae as belonging to the ‘disk population’. Minkowski (1948) and Payne-Gaposchkin (1957) showed that the galactic longitudes of novae and planetary nebulae (PNe) have similar distributions and therefore novae, like PNe, should belong to Pop II stellar population. Baade (1958) assigned novae to Pop II stellar population because of the occurrence of a few ones, like T Sco 1860, in very old stellar population systems of the Globular Clusters M80. Iwanowska and Burnicki (1962) suggested that novae are a mixture of Pop I and Pop II objects. Patterson (1984) pointed out that novae belong to an ’old disk’ population. Observations of novae in extra-galactic systems have helped to clarify the picture: Della Valle and Duerbeck (1993) compared the cumulative distributions of the rates of decline for M31, LMC and Milky Way nova populations and found that galactic and M31 distributions are indistinguishable, whereas M31 and LMC distributions do not come from the same population at significance level, see Fig. 7.
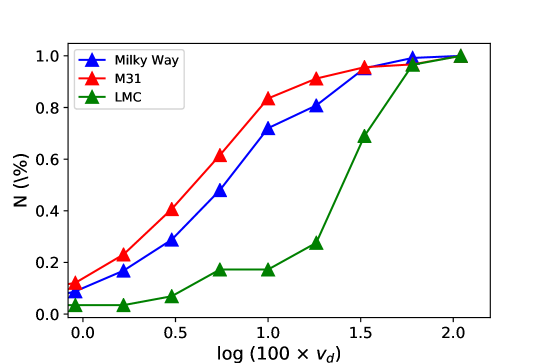
Since the speed class of a nova is related to some of the most important properties characterizing a nova system, like the mass of the WD and the amount of the ejected matter (see Sect. 3.2), the lack of systematic differences in the distributions of the rates of decline between Milky Way and M31 novae would suggest that they come from similar parent stellar populations, which are different from the one in which LMC novae are produced. On the other hand LMC is a bulge-less galaxy and, therefore, novae in the LMC originate from disk population by definition. Therefore, it seems logical to mainly associate novae in M31 and in the Milky Way to a bulge stellar populations. This conclusions is strengthen by spectroscopic observations of “disk” novae in the M33 and LMC (Shafter et al, 2012; Shafter, 2013), which show remarkable differences compared with “bulge” M31 novae (Shafter et al, 2011) (see also Sect. 6).
3.1 Nova lightcurves: the speed classes
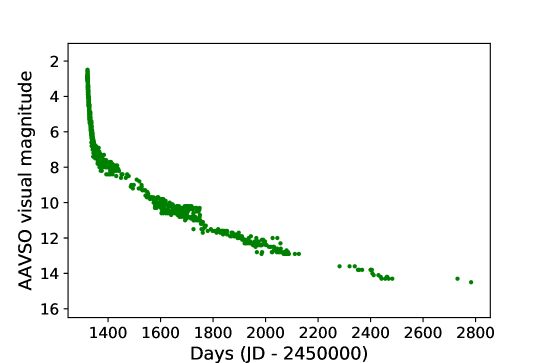
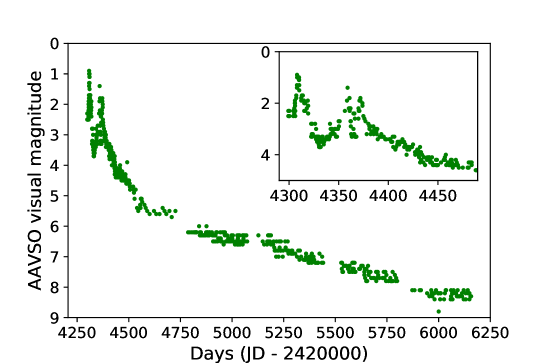
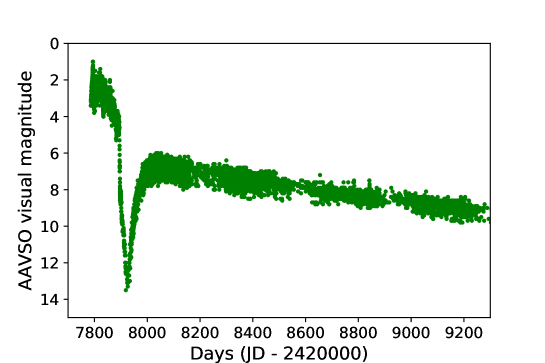
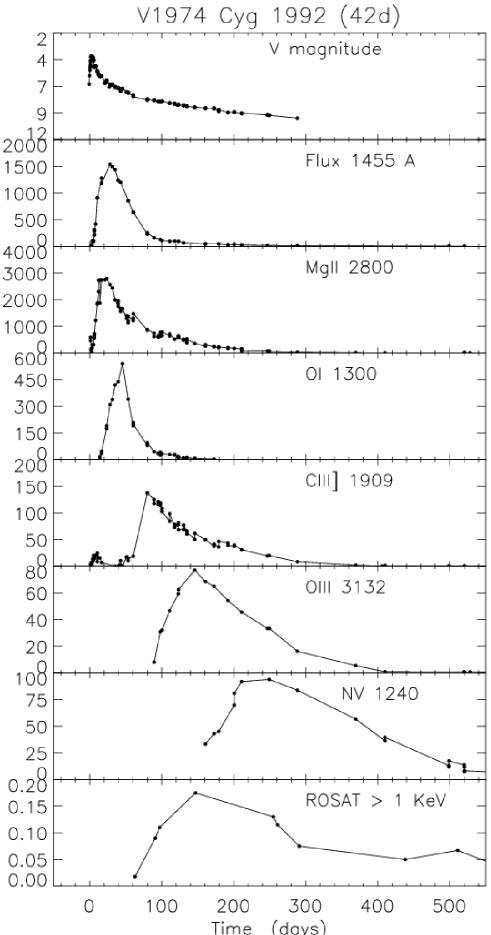
The systematic studies of novae aimed at measuring their distances and luminosity at maximum, date back to the 1920s. Lundmark (1922) derived an average absolute magnitude at maximum of mag, but characterized by a broad dispersion, typified by the cases of Nova Lac 1910 and T Sco 1860, with mag and mag, respectively. In a following paper, Lundmark (1923) revised the previous value by averaging the distances obtained for about two dozen of novae with four different methods and he obtained mag, not far from mag found in modern studies (SG19). Novae normally show a fast rise to maximum light of the order of few hours, but in some case may last up to several days (e.g., RR Pictoris). The timescale and the morphology of lightcurves during the decline exhibit a very high degree of individuality (see Figs. 8, 9 and 10). In recent years, the possibility of using multi-wavelength observations led to important developments in understanding the evolution of nova outbursts. Novae lightcurves observed at different wavelengths (optical, UV and X-ray) exhibit different phenomenology. The ionisation of the ejecta generally increases with time and the peak of the emission shifts from optical to UV and finally to X-rays. A clear example is V1974 Cyg in Fig. 11, which reports the evolution of the emission as observed in different wavelengths (Cassatella et al, 2004).
In the attempt to understand the link between timescale and morphology, several authors have tried to classify the nova light curve on the basis of either the rates of decline, expressed in magnitude per day (McLaughlin, 1939, 1942; Payne-Gaposchkin, 1957) or by grouping novae in several families (Duerbeck, 1981) according to common behaviors exhibited by lightcurves after maximum light. For example, class A of Duerbeck (1981) was defined as “smooth fast decline”, class C was defined as “extended maximum, deep minimum” and class E, defined as “extremely slow nova with irregular lightcurve”. The classification in speed class, reported here (see Table 2) is the one adopted by Payne-Gaposchkin (1957).
| speed class | mag/day | |
|---|---|---|
| very fast | ||
| fast | 0.18 -0.08 | |
| moderately fast | 0.07-0.025 | |
| Slow | 0.024-0.013 | |
| very slow | 0.013 - 0.008 |
The rate of decline are expressed in terms of mag/day or and , i.e., the times that a nova takes to decay by 2 or 3 magnitudes from maximum light. Multiple-peaks are often observed in slow novae, thus, this ambiguity might hamper the correct use of the MMRD for this nova subclass. This situation is well represented by the light curves of many galactic novae (Duerbeck, 1981) such as NQ Vul 1976 or RR Pictoris 1925, for example. If we compute the rate of decline after the first maximum we would obtain of a few days rather than 65 and 130 days as actually measured after averaging and smoothing the secondary maxima.
This classification is very popular and still adopted (see, e.g., Warner 2003) and it is certainly useful for quickly providing the observers with some important pieces of information necessary to trigger and plan the photometric and spectroscopic follow-up of an outbursting nova. However, in the last years it emerged the need to move from a simple grouping of novae, according to their speedy class or morphology of the lightcurves, toward a physical classification of nova outbursts. The idea that we develop in this paper is to relate the morphological classification of Payne-Gaposchkin with: i) the “disk” and “bulge” Galaxy environments by measuring the galactic latitude and longitude of nova systems and their height above the galactic plane (Della Valle et al, 1992; Della Valle and Livio, 1998); ii) the spectral classification of novae in Fe II and He/N classes (Williams et al, 1991; Williams, 1992). Recently, Darnley et al (2012) have proposed a CN classification in three classes, based on the evolutionary stage of the respective secondary stars: main sequence nova, sub-giant nova, and red-giant nova.
3.2 Disk and bulge novae
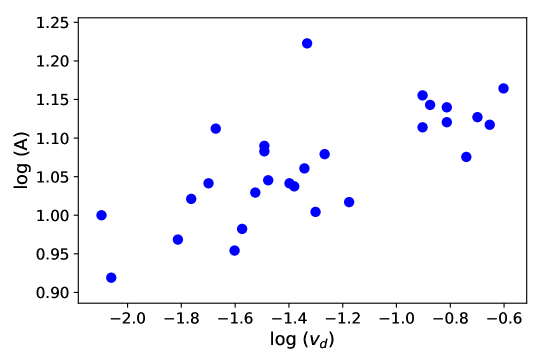
The quantitative characterization of the concept of nova populations into two classes of objects, i.e., fast and bright ‘disk novae’ and slow and faint ‘bulge novae’, has been independently elaborated by Duerbeck (1990), and by Della Valle et al (1992), Della Valle and Livio (1994), Della Valle and Livio (1998). The former demonstrated that nova counts in the Milky Way do not follow a unique distribution (see Fig. 12), the latter authors showed that the rates of decline, which traces at first order some of the parameters driving the strength of the outburst, correlates with both the spatial distributions of novae inside the Milky Way and their spectroscopic types. Theoretical calculations suggest that the strength of a nova outburst is a strong function of the mass of the underlying WD (Shara, 1981; Livio, 1992): the brighter is the nova at maximum, the larger is the amplitude of the outburst (see Fig. 13) the more massive is the underlying WD.

Since the luminosity at maximum of a nova correlates with the rate of decline, the distribution of the rates of decline traces the distribution of the masses of the WDs in nova systems. On the other hand, there exists a strong relation between the final mass of the WD and the initial mass of the progenitor star on the main sequence (MS): the higher the initial mass, the higher will be the mass of the WD. For example, Cummings et al (2018) found – admittedly with some degree of uncertainty – that a star of produces a WD of , while stars of initial mass produces a WD of . Galactic novae then should be characterised by different scale heights above the galactic plane according to the initial mass of the progenitor star. Novae originating from the more massive WDs should be located in the thin disk of the Galaxy, while novae from less massive WDs should occur in the thick disk, in the bulge or in the Galactic halo. Therefore, we should observe a trend between the rates of decline and the their heights above the galactic plane. To test this hypothesis we use the GAIA DR2 distances reported in the golden sample of S18 and SG19, to derive the height above the galactic plane:
| (5) |
where is the galactic latitude of each nova. The S18 and SG19 samples include 15 novae that are in common to both samples. To test our prediction we have merged the two data sets into a “bona fide” sample (Table 9) complemented by the recent GAIA DR2 measurement of the distance to V1500 Cyg (Nova Cyg 1975)222We derived the GAIA DR2 distance of V1500 Cyg using the parallax provided in the GAIA DR2 database and using the formula given in Bailer-Jones et al (2018), see also Muraveva et al (2018). The GAIA DR2 archive is available at \urlhttps://gea.esac.esa.int/archive/. Figure 14 shows strong evidence for the existence of a trend between the rate of decline and the height above the galactic plane. The correlation
| (6) |
is characterized by a confidence level of , according to the Student’s t-distribution.
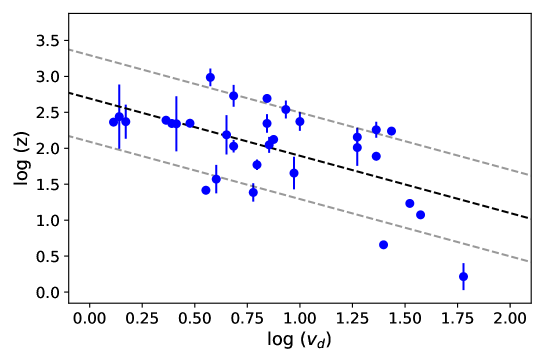
The trend illustrated in Fig. 14 indicates that the fastest nova systems, which contain the most massive WDs, are concentrated close to the galactic plane. It is difficult to understand how such a distribution could be due to selection effects, since there is no obvious mechanism to prevent the discovery of fast and bright novae at high . Obviously, we cannot exclude that some heavily absorbed slow and faint nova at small can have been overlooked.
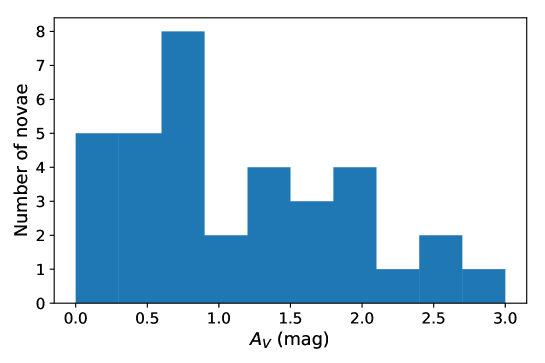
However, we note that the observed distribution (Fig. 15) of nova absorptions as estimated by different authors peaks at AV mag and extends up to mag. Therefore, the faint tail of the luminosity function of novae at maximum light, characterized by an absolute magnitude at maximum of mag, is bright enough to be detected, with modern surveys, at several kpc distance toward the galactic center even under more severe absorption constraints.
We note that the attached error bars to each data point, due to the exquisite accuracy of the GAIA DR2 distances, are very small. However, the scatter of the relation is intrinsically large. This fact implies that other parameters in addition to , such as the (Prialnik et al, 1982; Townsley and Bildsten, 2004; Kato et al, 2014), the envelope mass at ignition (Hachisu and Kato, 2010), the temperature of the WD (Prialnik and Kovetz, 1995; Yaron et al, 2005) or the chemical composition of the accreted matter (Kovetz and Prialnik, 1985; Starrfield, 1999) affect the luminosity at maximum, the rate of decline, the ejection velocity and the mass of the expelled layers.
In the following, we label ‘disk’ novae the objects characterized by pc. They are mostly ‘fast’ declining objects characterised by a bright peak at maximum mag, and and mainly belongs to the He/N class. Slow novae occur at higher z, up to kpc, and are characterized by mag at maximum and and and , respectively. Hereafter, we label these high slow declining objects ‘bulge’ novae (Della Valle and Livio, 1998).
3.3 Post-novae
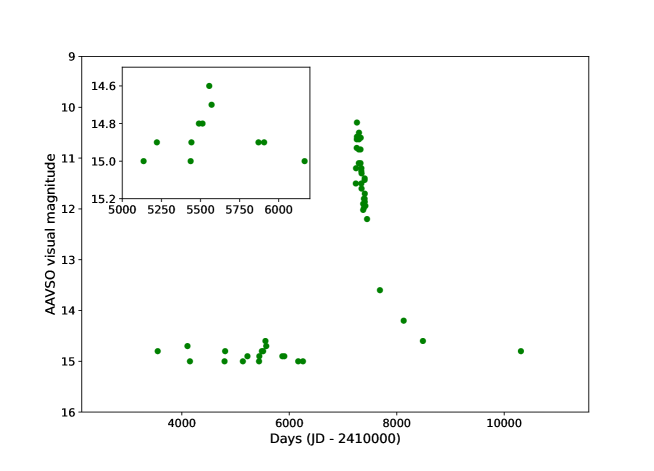
We can estimate as erg the binding energy of a WD. On the other hand, the energy budget associated with a nova outburst is erg. This simple orders of magnitude comparison provides a clear indication that the nova outburst is not a catastrophic event for the WD, unlike from SN-Ia explosions. As a consequence, some decades after the outbursts the systems go back to quiescence and the post-nova magnitudes become very similar to those observed during the pre-nova stage (Robinson, 1975). The return to the minimum light is not as quick as the luminosity increasing to maximum. This fact can be quantified by studying the lightcurves of the oldest galactic novae for which a significant record of observations since the maximum epoch do exist: Nova Oph 1848 (v841 Oph), Nova Cyg 1872 (Q Cyg) and Nova Cir 1906 (AR Cir). The light curves reported in Figs. 16, 17, 18 have been obtained from the Steavenson’s observations published between 1920 and 1950. An inspection of the data shows that v841 Oph and Q Cyg have returned to the quiescence state, at V 12.5 mag and V 15 mag in about 80 and 50 years, respectively.
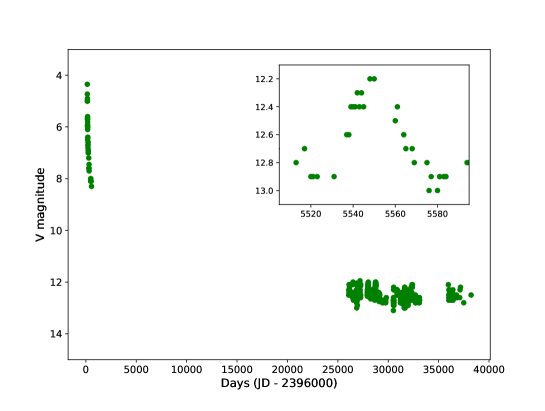

Post-nova stages observations are not very frequent. When they are available, they are characterized by variation of the magnitude at minimum as large as 1–2 mag. These brightness variation are due to multiple factors such as: brightness modulations possibly related to orbital period (Woudt et al, 2004), solar-type cycles activity of the secondary (Bianchini, 1987; Warner, 2003) on time scale of the orders of months/years (see inset in Fig. 17) but also to dwarf nova activity on time scales of 50–270 days (Della Valle and Rosino, 1987; Della Valle and Calvani, 1990).
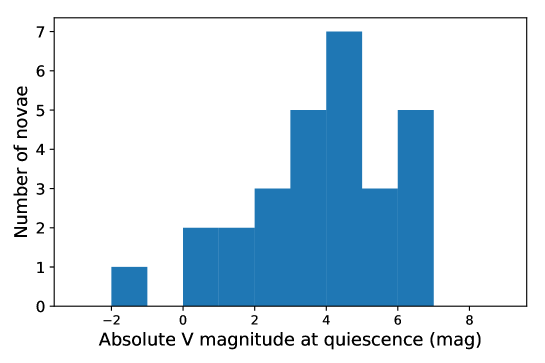
The distribution of the absolute magnitude at minimum, see Fig. 19, is a distribution characterised by a mean brightness of M0.24 mag. Such distribution of luminosities requires a mass transfer rate between and (see Fig. 5 in SG19). The brightness at minimum of the fastest declining novae implies mass transfer rates that are a full order of magnitude below the average value for most novae, close to the DNe values (Vogt, 1990).
The link between DNe and CNe has been hypothesized long ago in the framework of the so called “Hibernation” scenario (Shara et al, 1986) (see also Hillman et al 2020) which was originally elaborated to explain an apparent two orders of magnitude discrepancy between the density of classical novae inferred in the solar neighborhoods and the density deduced from nova surveys in M31, nova theory and U, B photometric surveys. Intrinsically low CN space density would imply very short recurrence times between the outbursts, which in turn would imply high values of the , which are not observed. According to these authors the space density of CNe is much higher but novae would spend most time between two consecutive outbursts in a “hibernation” state. This stage would be characterised by low or very low mass transfer rates (–) as result of the increasing separation between the companion stars after each outburst, as consequence of the conservation of the angular momentum of the binary system. The canonical mass transfer rate of – would be recovered as soon as the magnetic braking and/or gravitational radiation emission decrease the separation between the companion stars. During this intermediate stage in which increases from hibernation to the canonical nova values, the system would exhibit DN activity. This scenario has received in the years some observational support.
First of all, the dwarf nova activity was detected not only after the nova outbursts, but it was also observed decades before the outbursts in V446 Her or IV Cep (Della Valle and Calvani, 1990) and AR Cir (see inset in Fig. 18). Duerbeck (1992) could measure an average decline of 10 3 millimag per year in the post outbursts decline of nine old novae, admittedly with large individual scatter. However, these data allowed Duerbeck to conclude that the observed trend was “compatible with the prediction of the hibernation hypothesis”. Finally in more recent years, Shara et al (2007, 2012) discovered nova shells around two dwarf novae: Z Cam and AT Cnc.
On the other hand the “Hibernation” scenario was introduced on the basis of a supposed existence of a two orders of magnitude discrepancy between the density of CVs occurring close to the Sun and the rate of CVs that was believed to be as high as (Shara et al, 1990). This density value of CVs has been the subject of many revisions in the last two decades that we have summarized in Table 3.
| Density (pc-3) | Authors |
|---|---|
| Patterson (1998) | |
| Warner (2001) | |
| Schwope et al (2002) | |
| Cieslinski et al (2003) | |
| Pretorius and Knigge (2007) | |
| Hernandez et al (2018) | |
| Schwope (2018) |
These values are 1–3 orders of magnitude smaller than the , which originated the quest for the existence of a hibernation stage for CVs. Della Valle and Duerbeck (1993) found a density of nova outbursts in the galactic disk of:
| (7) |
consistent with previous estimates of (Duerbeck, 1984; Patterson, 1984), – (Naylor et al, 1992) once we have removed from their original values the contribute of bulge novae. The next step is to derive the density of CNe from the density of nova outbursts by multiplying the observed density of nova outbursts for the recurrence time between the outbursts. Disk novae that are mostly fast and bright originate from massive WDs, say –. According to Sect. 1.2, these novae have recurrence times of the order of years, which gives a density of Classical Nova progenitors of:
| (8) |
This result is consistent with the lower density values reported in Table 3, which were derived with a broad variety of approaches including OGLE survey (Cieslinski et al, 2003), ROSAT observations (Schwope et al, 2002; Pretorius and Knigge, 2007; Schwope, 2018) and SDSS survey (Hernandez et al, 2018). The still large range of uncertainties in the knowledge of the CV density does not exclude that there is some room for the existence of a “hibernation” stage in a “mild” version, i.e., it should be active over a shorter interval of time than originally hypothesized.
3.4 The interaction of nova with the interstellar medium
The interaction of the expanding shells with the interstellar medium was discussed by Oort (1926) and Ambartsumian (1952). These models were developed on simple assumptions: the conservation of energy, average expansion velocities of the nova shell and ejecta masses of . After assuming a range of interstellar densities, Oort could estimate: i) the “half-lifetimes” that is the time after which the expansion velocities of the ejecta have decreased to 50% of its initial value, to be 50–100 years and ii) 10,000 years the time needed to velocities of nova ejecta to become indistinguishable from the chaotic motions of the circum-burst interstellar medium. Attempts to measure the deceleration of the nova ejecta (Duerbeck, 1987) were hampered by the the inhomogeneities affecting the comparison between images of post-nova nebulae obtained decades apart. Also one should considers the possibility that the circumburst medium could have been swept away by previous outburst episodes. Downes and Duerbeck (2000) in their survey on nova shells, which included also the Slavin et al (1995) data, decided to derive the distances via nebular parallaxes toward each nova by assuming no deceleration for the ejecta. The correctness of this assumption has been recently verified by Santamaría et al (2020). These authors compared new narrow-band images of nebulae around old novae: FH Ser, V533 Her, DQ Her, V476 Cyg, T Aur (aged 50 to 130 years) with images from archives and found no evidence for deceleration. They thus concluded that nova shells can continue to expand for several hundred years without undergoing a significant deceleration.
3.5 The galactic nova rate
The knowledge of the galactic nova rate is important for at least two reasons: i) some nova-like systems are believed to be progenitors of SNe-Ia (see sect. 11) therefore the correct measurement of the nova rate is an essential ingredient to be compared with the relatively well known SN-Ia rate in the Milky Way (Cappellaro et al, 1999, 2015); ii) the role of novae as contributors to the Galactic nucleosynthesis has been well established on theoretical grounds (D’Antona and Matteucci, 1991; Romano et al, 2001; Travaglio et al, 2001; Romano and Matteucci, 2003; Prantzos, 2012). Recently observations of 7Be (Tajitsu et al, 2015) and 7Li (Izzo et al, 2015) have provided significant empirical support to these theoretical predictions. However, despite of the importance of these issues the correct value of the galactic nova rate is still poorly known (see Table 4). Just to give an idea here below we report a short summary of the estimates available in literature. Lundmark (1935) derived novae/yr. Allen (1954) inferred from his paper on the whole-sky statistics of celestial object about novae/yr, which is similar to the estimate obtained later on by Sharov (1972) of novae/yr and at variance with novae/yr estimated by Kopylov (1955). In more recent epochs Liller and Mayer (1987) have corrected the “observed” rate of 3.7 novae/yr for incompleteness and selection effects and they derived 74 novae/yr . Hatano et al (1997) have revised Liller and Mayer (1987) and assumed that most novae are produced in the disk and found . van den Bergh (1991) derived about novae/yr by scaling the nova rate of M31 to the GCs population ratio Galaxy/M31=0.56. Ciardullo et al (1990); Della Valle and Livio (1994); Darnley et al (2006) found novae/yr and and respectively after scaling the nova rates measured in extragalactic systems to the luminosity of the Milky Way. Shafter (1997) found by studying the distribution of novae inside the Milky Way and applying a number of correction factors for incompleteness and observational bias. More recently, the same author (Shafter, 2017) has increased his previous estimate to by revising the correction factors to the galactic nova counts and by assuming uniform properties between bulge and disk novae.
| Nova/yr | author |
|---|---|
| 50 | Lundmark (1935) |
| 100–200 | Allen (1954) |
| 50 | Kopylov (1955) |
| 260 | Sharov (1972) |
| 74 | Liller and Mayer (1987) |
| 11–46 | Ciardullo et al (1990) |
| 16 | van den Bergh (1991) |
| Della Valle and Livio (1994) | |
| Hatano et al (1997) | |
| Shafter (1997) | |
| Darnley et al (2006) | |
| Shafter (2017) |
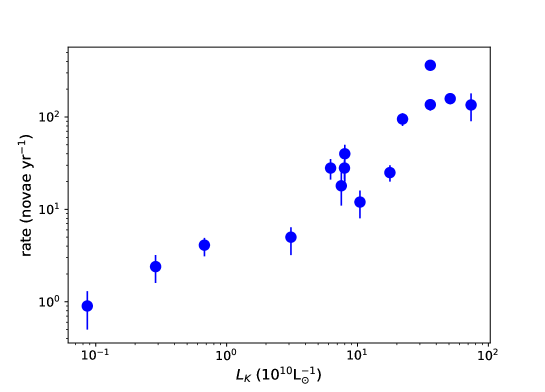
Figure 20 shows the relationship between the nova rate and the luminosity of the parent galaxy. A least squares fit to the data points gives:
| (9) |
After assuming for the Milky Way (van den Bergh, 1988), and , corresponding to Sb Hubble type, we find novae/yr, admittedly with a large attached error. However, this result is consistent with the recent “direct” measurement of Mróz et al (2015). These authors have measured the bulge nova rate of the Milky Way with the data of the OGLE survey. They find a rate for the Galactic bulge of novae/yr that according to these authors: “…is much more accurate than any previous measurement of this kind, thanks to many years monitoring of the bulge by OGLE survey”. A “rounded” rate of about novae per year in a galaxy like the Milky Way, where the nova production is bulge dominated, implies a global rate that hardly can exceed 30 novae/yr in good agreement with the frequencies found in the 1990s (Ciardullo et al, 1990; Della Valle and Livio, 1994; Shafter, 1997). Only if incompleteness affects dramatically the galactic nova counts in the disk we can relax the assumption that novae in the Milky Way are mainly produced in the bulge and therefore values of the galactic nova rate as large as novae/yr are still possible (Shafter, 2017). Presently the existence of this bias is not supported by the observations.
4 The spectral evolution of novae
Many contributions have been devoted to describe and to summarize the spectroscopic evolution of nova outbursts, mostly dedicated to identify the different nova stages, their absorption and emission lines and measuring the expansion velocities of the ejecta (Payne-Gaposchkin, 1957; McLaughlin, 1960). More recently, Shore (2012) has provided a general physical description of this sequence of stages that helped a lot to enlighten the physics underlying the spectroscopic evolution of novae. A similar description based on the color-color evolution of nova outbursts has been also provided by Hachisu and Kato (2014).
In the following, we have linked the “classical” photometric stages with the “old” and “new” spectroscopic descriptions of nova phases (see Fig. 21). The spectral evolution of novae is basically driven by two physical parameters: the mass density of the ejecta and their expansion velocities.In spite of the broad phenomenology observed in nova spectra six spectral stages have been defined and in the following we provide an essential description for each of them.
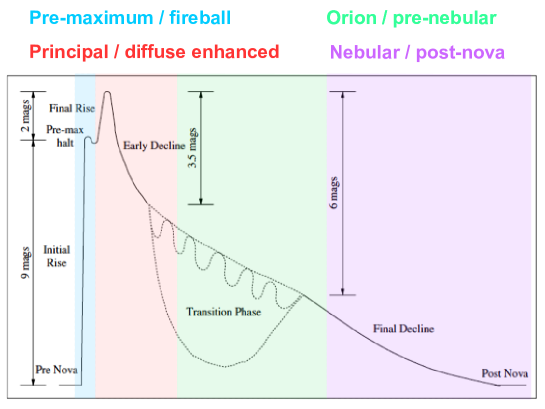
Initial rise – Pre-maximum spectrum: it corresponds to the adiabatic free expansion of the ejecta that is rapidly cooling since the expansion regime is much shorter than the characteristic cooling time of the ejecta. This phase is also referred as “hot fireball” spectrum and it is observed very seldom because it implies: i) the discovery of a nova during its rise at maximum, that normally lasts from a few hours to few days and ii) the immediate availability of telescope time, two conditions that normally do not occur frequently. Some novae show a pre-halt maximum (the so-called shoulder phase) in the light curve, which is characterized by bluer colours and that anticipates the final rise to the maximum brightness. This feature in the light-curve has been caught in very few novae, such as T Pyx (Shore et al, 2011) and V1974 Cyg (Shore et al, 1993). The spectra bear some similarity to F supergiants (Kodaira, 1970). Balmer and non-Balmer lines are characterized by high expansion velocities (2000–3000 km/s) as measured from the minimum of the respective P-Cygni profiles. These features are produced during the initial expansion of the optically thick envelope ejected by the nova. (see Fig. 22).
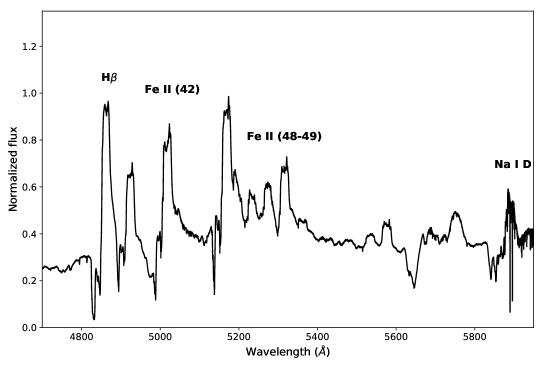
Maximum light – Principal spectrum: this stage corresponds to the rise to the maximum brightness in V and R magnitudes and a contemporaneous decrease in luminosity at blue and UV wavelengths. This is the time when the fireball reaches the critical cooling temperature, the pseudo-photosphere starts to recede and the spectrum is being dominated by the free-free emission from thinner plasma outside the photosphere (Hachisu and Kato, 2006). Consequently, the nova ejecta itself acts now as a passive media, by converting the UV flux into longer wavelengths emission and then showing low-ionization transitions in the spectra, such as the Fe II group species (hence the name “iron-curtain”), Na I D and Ca II. These lines are flanked by broad P-Cyg profiles with blue-shifted velocities generally lower than those observed during the fireball phase (see Fig. 23). At the same time, the optically-thick stage in UV bands leads also to the presence of “pumped” transitions, like the O I 8446 Å, whose upper level is over-populated by the H Ly- 1025.72 Å transition, which is almost coincident with the transition O I 1025.76 Å (Bowen, 1947; Williams, 2012). High-resolution spectroscopic observations have also revealed the presence of narrow and low-ionization heavy element absorptions (THEA - Williams et al (2008), see Sec. 4.2), which are detected during the brightest epochs of several nova outbursts with expanding velocities relatively low ( km/s or less).
During the principal phase, the so-called Diffuse Enhanced absorption systems appear during the very early decline. The only feature that differentiates the diffuse enhanced from the principal spectrum is the presence of multiple P-Cyg profiles (Fig. 23). All these absorption components show an apparent acceleration of the ejecta with time, as inferred from the P-Cygni absorptions. However, this acceleration is not real, it rather originates in the downturn density of the ejecta and the contemporaneous recession of the hot pseudo-photosphere. Indeed, a decreasing density implies a more optically thin ejecta, which implies a fragmentation of the broad P-Cygni absorption lines into several weaker structures. Very recently, it has been proposed that the appearance of new and faster absorption systems in the P-Cygni profiles of Balmer lines correlates with the presence of rebrightenings, or flares, in the light curves (Li et al, 2017; Aydi et al, 2019). These new systems would be the result of fast wind ejection from the underlying WD and their interaction with the pre-existing ejecta will lead to strong shocks, originating the high-energy emission observed in some novae (Metzger et al, 2015; Cheung et al, 2016; Mukai and Sokoloski, 2019; Aydi et al, 2020), see also Sect. 12. Another explanation for the presence of the rebrightenings is that nova ejecta is actually composed by strong density inhomogeneities created during the TNR (Williams, 2016).
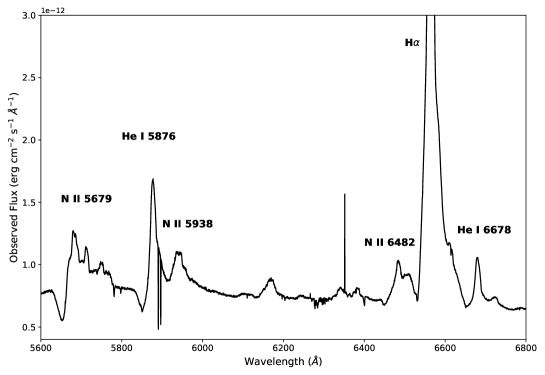
Toward the end of the early decline and at the beginning of the transition stage (that is the transition from optically thick to optically thin condition) another spectral system appears, the so called Orion spectrum. The optical spectra now show features due to high-ionization lines (He I, O II, N II), and the CIII/NIII lines Bowen blend (“4640 band”) see Fig. 24. Their appearance in the spectrum is due the low density of the ejecta combined with the intense UV flux. An important characteristics of this stage is that the expansion velocities measured from these transitions do not generally coincide with the ones inferred during the iron-curtain phase at optical wavelengths. As the density further decreases the spectrum develops nebular lines which increase their brightness with time (Osterbrock and Ferland, 2006). During this stage the absorption systems disappear.
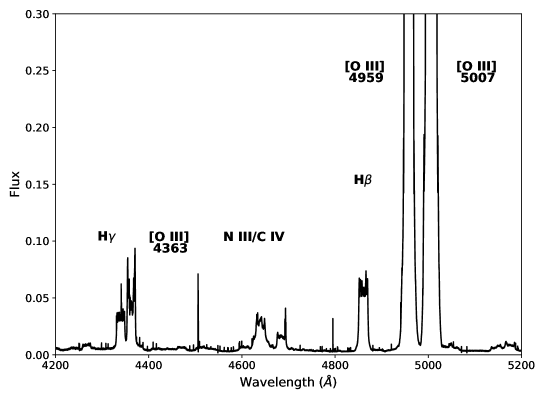
The enhancement in flux of the He II marks the end of the optically thick phase (e.g., Munari et al 2014) and the beginning of the Nebular phase followed by the increase in luminosity of forbidden transitions (Rafanelli and Rosino, 1978) of oxygen auroral and nebular [O III] 4363 and 4959, 5007, respectively and nitrogen [N II] 5755, 6548, 6584 at optical wavelengths, see Fig. 25. In the spectra of ONeMg novae we also observe bright [Ne III] 3869, 3968 and [Ne V] 3346, 3426. It is well known (McLaughlin, 1943; Vainu Bappu and Menzel, 1954; Payne-Gaposchkin, 1957) that spectroscopic observations obtained during the Nebular stage, when the ejecta are optically thin, are useful to study the geometrical and ionization structure of the ejecta (e.g., Shore et al 1996; Shore 2013; Vanlandingham et al 2001; Iijima 2012; De Gennaro Aquino et al 2014, 2015; Mason et al 2018). Nebular lines show flat-top or saddle shape or split profiles, often characterized by fine structures on their top, then suggesting both the presence of density variations in the ejecta and in the geometric distributions as polar caps or equatorial rings. During the nebular phase, the peak of the emission shifts to UV wavelengths, and finally to X-rays. The UV wavelength range was studied in very details thanks to the International Ultraviolet Explorer (IUE) satellite during the 1980s and the first half of the 1990s (e.g., SG19). In this phase emission lines of ionised helium and high ionisation of carbon, nitrogen, oxygen and neon freshly-produced elements are observed (e.g., Cassatella et al, 1979; Stickland et al, 1981; Shore et al, 1996; Cassatella et al, 2002, 2004, and references therein). Optical observations combined with UV spectra obtained at these epochs, allowed the determination of the ejecta abundances (Vanlandingham et al, 1996, 1997; Schwarz, 2002; Shore et al, 2003; Schwarz et al, 2007). These results have definitely proven that element abundances in novae are generally super-solar, up to 1–2 orders of magnitude (Livio and Truran 1994; Gehrz et al 1998, 2008, see also José, Shore and Gehrz in Bode and Evans 2008). During the nebular stage, novae can also achieve their highest degree of excitation, when the ejecta are completely optically thin and the underlying hot WD surface is revealed as a bright source in soft X-rays (Oegelman et al, 1993) due to the burning of residual hydrogen-rich material near its surface (see also Sect. 12). In these conditions soft X-rays and the strong UV photon flux are capable to photo-ionize heavy elements, but the low density of the nova environment at these epochs will avoid their complete recombination, resulting in the presence of highly-excited coronal lines in the spectra such as [Ni viii] 4446, 4493; [Ni ix] 4332, 4404; [Fe vii] 6086; [Fe x] 6376; [Fe xiv] 5303; and [Ar x] 5535 (Rosino et al, 1989).
Finally, few years after the outburst the object develops the Post-nova spectrum that is characterized by the gradual disappearance of coronal and then forbidden lines, due to the decrease of the ionization level (see Tappert et al 2014 and references therein). Residual emission lines remain strong or at least still detectable, e.g., H+[N II], NIII 4640 and He II 4686 emission line originating from the accretion disc around the WD. The latter two lines, for example, were still visible in the spectra of FH Ser 10 years after the outburst (Rosino et al, 1986).
4.1 The Tololo spectroscopic taxonomy
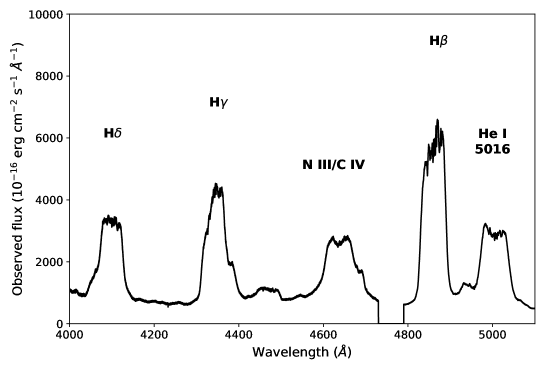
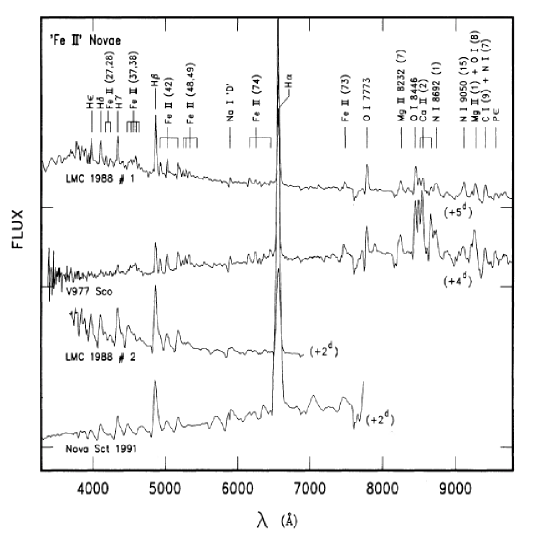
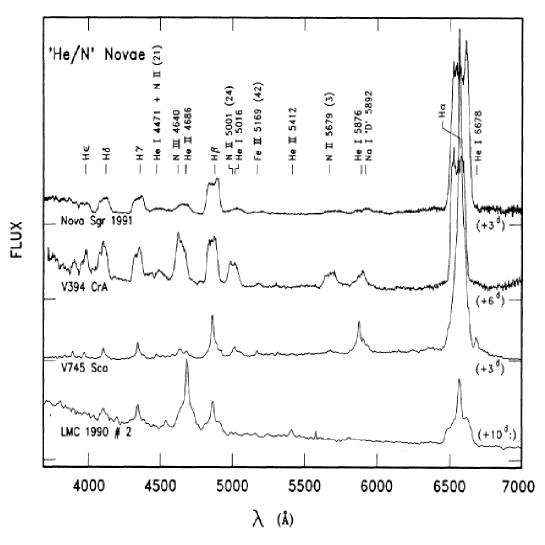
Williams (1992, 1994); Williams et al (1994) after studying two dozen of galactic and Magellanic novae concluded that novae can be broadly divided into two spectroscopic classes: the Fe II and He/N novae. The former are characterized by slow spectroscopic evolution with expansion velocities km/s (FWZI) and the presence of Fe II lines in the early emission spectrum as the strongest non-Balmer lines. The latter are fast spectroscopically evolving novae, characterized by high expansion velocities ejecta km/s (FWZI) with He and N lines being the strongest non Balmer lines in the emission spectrum near maximum. Hybrid objects (e.g., V1500 Cyg), which evolve from Fe II to He/N, are classified as Fe II-b (b=broad) and are physically related to the He/N rather than to Fe II class (see Fig. 26).
.
.
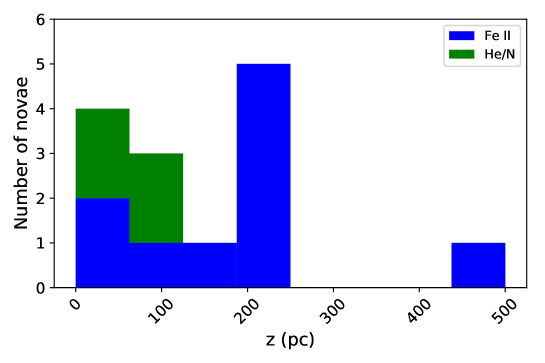
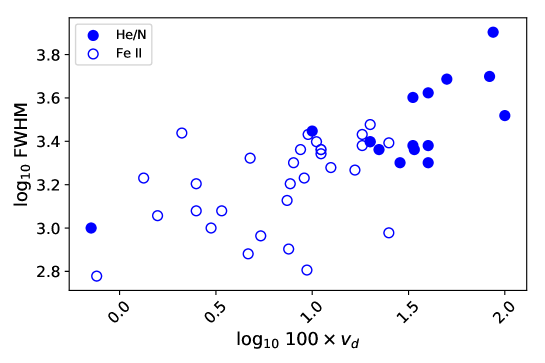
In Fig. 27 we report the heights above the galactic plane of the novae of our bona fide sample (S18 + SG19) after being classified according the Williams’ criteria. The plot shows that novae belonging to the He/N and Fe II-b classes tend to concentrate close to the Galactic plane with a typical scale height pc, whereas Fe II novae are distributed more homogeneously up to pc and possibly beyond (Della Valle and Livio, 1998). Figure 28 shows an upgraded version of the relationship between the rate of decline and the average expansion velocity of the nova ejecta measured at early stages, first observed by McLaughlin (1940). Filled dots refer to the He/N novae and they are characterized by the largest expansion velocities. On the basis of these plots we can infer that objects previously classified as ‘disk’ and ‘bulge/thick-disk’ novae tend to correspond to the He/N (+ Fe II-b) and Fe II spectroscopic classes. To explain this behavior one should consider the following argument: the more massive the WD (for a given and TWD) the smaller is the mass of the accreted envelope (in view of ) the more violent is the outburst and the larger the fraction where is the shell mass ejected at the maximum and is the fraction of the shell mass ejected in the subsequent continuous optically-thick wind phase. Since He/N spectra are formed in the shell ejected at maximum light it is very likely that He/N novae are generally associated with massive WDs, which eject the less massive envelopes (see Sect. 1.2). In the framework of this interpretation the distributions reported in Fig. 27 and Fig. 28 are simple consequences of the trend exhibited by the rate of decline vs. height above the galactic plane (see Fig. 14 ).
4.2 The THEAs: Transient Heavy Elements Absorptions
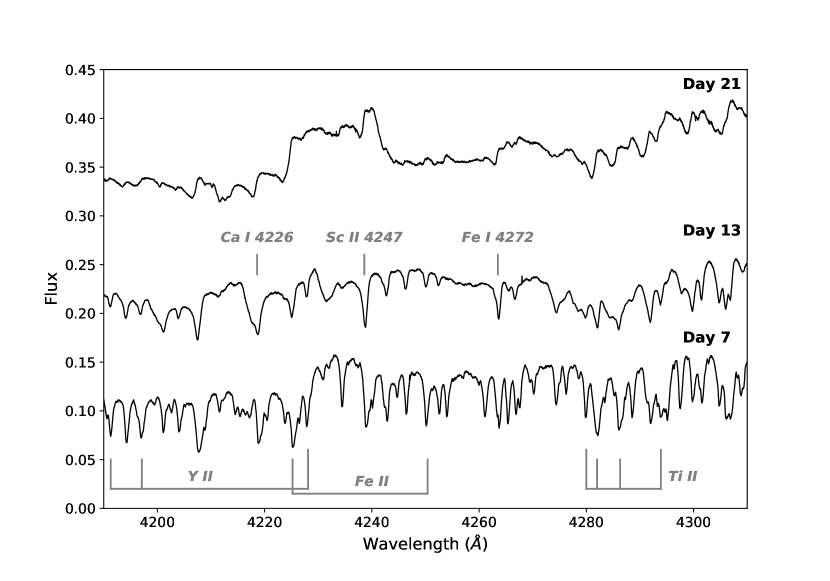
The previous spectroscopic classifications were significantly enriched by high resolution observations of novae (R ) carried out at ESO La Silla Observatory at the end of 1990s (Della Valle et al, 2002; Mason et al, 2005; Ederoclite et al, 2006) and at other facilities (Sadakane et al, 2010). These observations have revealed (Williams et al, 2008) the presence around maximum light of a new spectroscopic system formed by transient heavy element absorptions (THEAs). These authors were able to identify more than 300 absorption lines of single ionized elements with eV belonging to the iron group, such as: Sc, Ti, V, Cr, Fe, Sr, Y, Zr. The FWHMs of THEAs show a broad range of velocities between 30–300 km/s. They all progressively weaken and disappear over timescales of days or weeks.
The observations show that THEAs are superimposed on the principal absorption systems of novae and this implies that THEA systems originate outside the expanding photosphere, so they are not a direct product of the nova outburst. After days or weeks when the nova ejecta reach the THEAs, the transient systems are not observed any longer. Another property of THEA lines is that the time at which these lines are not observed depends on the rate of decline of novae. The three fastest novae in the sample of Williams et al (2008) do not show THEA, indeed, while the slowest objects can exhibit THEAs up to 1–2 months past maximum. The excellent temporal coverage suggests as most plausible explanation that the faster ejecta, which are associated with the fastest declining novae, have reached the THEA absorptions very few days past maximum, before our observations could started. As an alternative one should figure out a mechanism for which the THEA are not developed around fast declining novae. The origin of this material can be ascribed to activity of the companion star. The chemical species observed in THEA systems and the contemporaneous lack of H would seem to exclude that the observed material is a residual of previous outbursts. In the paper by Williams et al (2008), it was proposed that they originate from a continuous mass ejection from the secondary star and some empirical estimates suggest that the involved amount of gas is located at 10–100 AU from the binary system.
5 The maximum magnitude vs. rate of decline relationship in the Milky Way (MMRD)
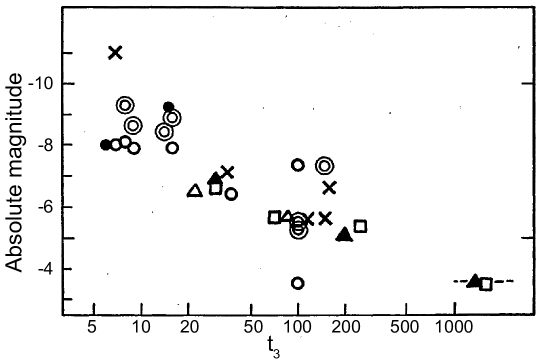
The existence for this relation was first suggested by Zwicky (1936), who named it as “life-luminosity” relation. It was expressed as: + const, where is the time necessary to decrease magnitudes from maximum. Unfortunately he calibrated the relation by using two galactic novae, Nova Per 1901 and Nova Aql 1918, and three Supernovae, SN 1936A in NGC 4273, SN 1926A in NGC 4303 and SN 1885A in M31, so the results were misleading. The first calibration of the MMRD relation entirely based on nova events was carried out by Mclaughlin (1945). He used: i) 13 Galactic Novae whose distances were determined with the nebular parallaxes, the intensities of interstellar absorption lines or the residual velocities from interstellar lines interpreted as due to galactic rotation, ii) novae coming from the Hubble survey in M31 and iii) three novae from LMC (Fig. 30).
In the following decades a number of relations based on different nova samples, calibrators and assumptions on the galactic absorption in the interval 0.8 mag/kpc (McLaughlin, 1945) up to 3.5 mag/kpc (Kopylov, 1952) have been provided by many authors:
In the 1980s, the calibration of the MMRD relation received its first breakthrough. Cohen and Rosenthal (1983) and Cohen (1985) were able to measure the size of 19 shells around post-novae. These observations, together with the i) expansion velocities measured from the spectra, ii) the assumption of spherical symmetry in the expansion of the ejecta and iii) individual estimates of the galactic absorption toward each nova, provided for the first time a set of nova distances, which were homogeneously measured, and a new calibration of the MMRD relationship. The result, reported in Fig. 31, yielded:
| (10) |
Downes and Duerbeck (2000) have increased this sample to 30 objects and improved the quality of “old” measurements of nova shells surrounding nine post-novae with ground-based and Hubble Space Telescope (HST) data. Their linear fits gives:
| (11) |
| (12) |
The GAIA DR2 distances (Brown et al, 2018) give the opportunity to check the reliability of nova distances measure via nebular parallaxes. Fig. 32 shows that nebular parallaxes are certainly consistent with GAIA DR2 measurements below 1.5 kpc. The scattered points at distances larger than 1.5 kpc is likely due to failures on the assumptions of the nebular parallaxes methodology (e.g., spherical symmetry expansion) and in particular to the poor quality of the AV estimates.
The existence of the MMRD can be broadly outlined from simple physical arguments (Bath and Shaviv, 1978; Kantharia, 2017) or theoretically modelled (Hachisu and Kato, 2015). At first order one can estimate the luminosity at maximum of a nova as: , where with being the average expansion velocity of the ejecta and the time from the outburst. This simplified approach shows in very intuitive way why novae characterized by the largest expansion velocities can achieved the highest luminosity at maximum light. For this reason their envelopes become optically thin very soon and their decline in luminosity proceed faster than in intrinsically fainter (and slowly expanding) novae. The tacit assumption in this argument is that the masses of the ejecta have roughly the same mass for all CNe: and this is true within a factor about ten, between and . For example, some RNe or ultra-fast novae (Yaron et al, 2005; Shara et al, 2017a) that expel envelopes, about 100–1000 times lighter than observed in CNe, achieve the transparency condition () in the ejecta very soon, therefore, their maxima are fainter and also they decay much more quickly than CNe. The MMRD relation was analytically derived by Shara (1981) and more recently computed from the theoretical modeling of different lightcurves calculated for a large variety of white dwarf chemical composition and masses (Hachisu and Kato, 2006, 2007, 2009, 2019; Hachisu et al, 2008; Kato et al, 2009). After normalizing the lightcurves for an appropriate time scale factor, the latter authors derive a “universal” behavior that can be described as : , which fit the GAIA data within a sufficient degree of approximation (see Fig. 33).
However, even after the papers by Cohen (1985) and Downes and Duerbeck (2000) the large scatter exhibited by the MMRD, about 3 magnitudes (see Fig. 31) has hampered the use of novae as effective distance indicators. This scatter is essentially produced by three factors. The first one is connected to the nebular parallax methodology that assumes symmetric expansion for the nova ejecta. By neglecting the role of opening angles and inclination of the ejecta it can bring into the distance measurements significant errors (Ford and Ciardullo, 1988; Shore, 2012; Wade et al, 2000) at least for more distant and old novae. The second element is the lack of a method to measure with the necessary accuracy the visual extinction toward the nova. We observe novae from inside our Galaxy and the estimates of the reddening toward each nova are very crude (see Sect. 5.2). They are based on empirical relations based on the intensity of interstellar lines (Munari and Zwitter, 1997) and from the comparison of predicted and observed emission lines ratios (Robbins, 1968a, b). For example, unblended H and He recombination lines can be used for this goal if they are optically thin and not affected by collisions (Della Valle et al, 2002). Yet the attached errors are large and the final estimate of absorptions very uncertain. Finally on the top of this we should add the intrinsic scatter of the MMRD relationship.
5.1 The shape of the MMRD relationship
Local effects as the reddening toward each nova and the difficulty of determining distances accurately suggest to look at other galaxies to calibrate and to determine the “true” shape of the MMRD relationship. These drawbacks are well detectable by comparing Fig. 31 with Fig. 34.
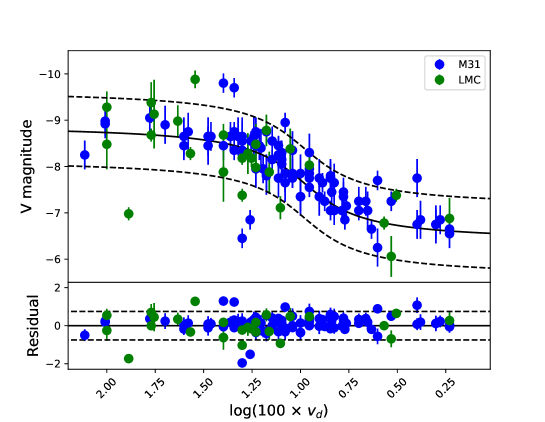
The former plot is the MMRD derived through nebular parallaxes by Cohen (1985). Here the uncertainties on the distances and absorptions, increase the intrinsic scatter of the MMRD, which can well fitted by a linear regression. Fig. 34 represents the MMRD derived by studying the nova population in M31 and LMC (data from Della Valle and Livio 1995; Shafter 2013, all data have been collected in Table 13 and Table 14). This plot shows a linear trend only between ( days). For the entire range of ) the analytic representation is a reverse S-shaped function (Capaccioli et al, 1989; Della Valle and Livio, 1995). A test indicates that M31 and LMC nova data are better fitted by a S-shape function (see Eq. 15 in Sect. 5.2) than a simple linear fit: while for the linear model . The linear fits performed on novae in the Milky Way are essentially due to scanty statistics combined with the large uncertainties associated to the measurements of the interstellar absorption along the line of sight to each single nova.
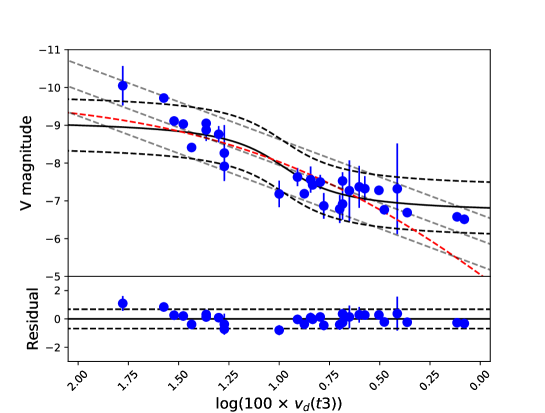
Theoretical attempts to explain the MMRD relation also provide evidence that a linear fit to the nova data only provides a rough first order approximation. Hartwick and Hutchings (1978); Shara (1981); Livio (1992) were able to derive simple relationships between the absolute magnitude at maximum and the mass of the underlying WD. For example, Livio (1992) derives:
| (13) |
and in turn a theoretical MMRD relation of the form:
| (14) |
that is expressed in days. The red dashed line in Fig. 35 shows the theoretical relation, superimposed on the GAIA MW data, which is expressed in absolute magnitudes. The flattening of the observed distribution at high luminosities is real and can be interpreted as a physical threshold due to the fact that the WDs in nova systems which result in super-Eddington novae are approaching the Chandrasekhar limit. The flattening at faint level of luminosity, characterized by mpg 19 mag, is relatively near to the photographic detection limit of the M31 surveys by Rosino, and may well represent the bright wing of Eddington novae which are populating the bottom of the MMRD relation. Therefore, we cannot exclude that the faint flattening might be the result of an observational bias. However, we note that the nature of the outburst for very low mass WD has not been fully explored and, therefore, it is still possible that the observed flattening is a consequence of the physics of the outburst.
5.2 How good is the MMRD?
Recently, by taking advantage from nova distances determined by GAIA DR2, the MMRD has been tested by S18 and SG19 and they have achieved very different conclusions. The former author concluded that “…the MMRD should no longer be used” whereas the latter authors reached opposite conclusions. These conflicting results are even more puzzling after considering that the two samples share 15 novae and the parameters used to compute the MMRD are very similar. Then we have formed a “bona fide” sample of 29 objects to test the MMRD relation. This sample includes the “golden sample” of S18, the SG19 novae and V1500 Cyg, whose parallax measured by GAIA DR2 is mas (see Table 9). Two novae have been removed from S18 “golden sample” sample: BT Mon and V1330 Cyg, whose magnitudes at maximum and rates of decline reported by the author are incorrect. The maximum light of BT Mon was certainly much brighter than the value of mag reported by S18. This conclusion can be reached after noting that spectroscopic observations of BT Mon (McLaughlin, 1941) revealed that this nova was in the so called “Orion” phase when it was observed at mag. Since Orion phase is subsequent to the principle and diffuse enhanced spectra (see Sect. 4), this magnitude value cannot correspond to the magnitude at maximum of the nova. On the basis of these arguments, Smith et al (1998) suggested that the maximum of nova BT Mon could be as bright as m (see SG19 for a deep discussion of the BT Mon case). Also the estimate of the magnitude at maximum of V1330 Cyg, mag, reported by S18 appears incorrect. According to Ciatti and Rosino (1974):
“the maximum was lost. At the time of the discovery the nova was just at the end of the early decline, in the transition phase, showing the typical fluctuations of a moderately fast nova…. Since in general the transition takes place when the nova has fallen about 3.5 mag below maximum …it is likely that the maximum was attained near May 15 with 7.5.”
The same authors estimate , which is much shorter than reported by S18. In view of these uncertainties we have exclude from our “bona fide” sample both BT Mon and V1330 Cyg.
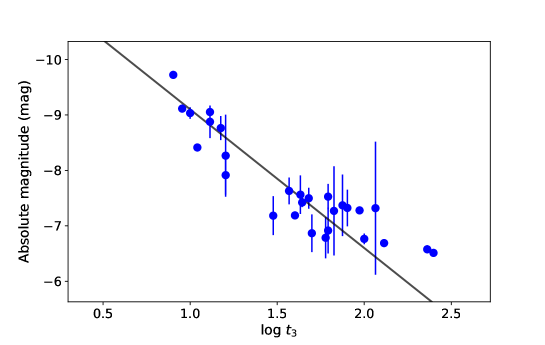
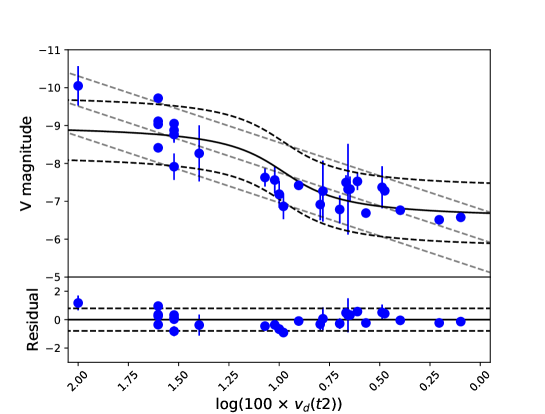
After applying the reverse S-shape function, derived from M31 and LMC novae, to our “bona fide” sample, we get the following absolute calibration for the MMRD of the MW:
| (15) |
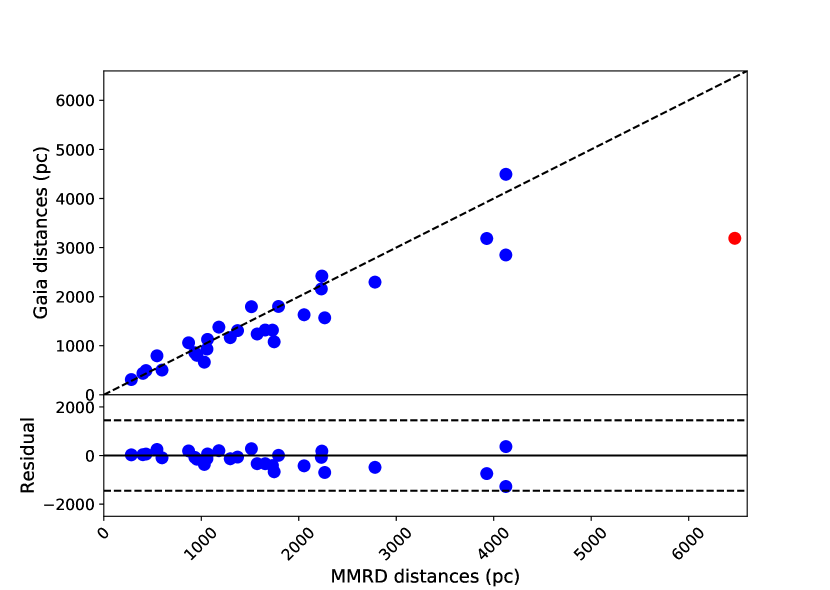
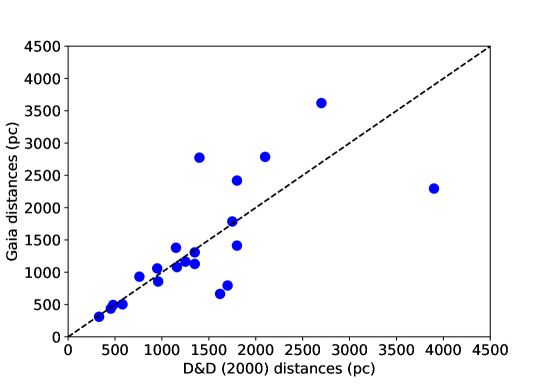
In Fig. 36 we compare the distances obtained via GAIA DR2 with the distances obtained via MMRD. The plot shows a good agreement between GAIA DR2 and MMRD distances. Basically, the most deviating object is the Recurrent Nova CI Aql, which is characterized by one of the highest correction for absorption ( mag). The inspection of the residuals indicates that above kpc the MMRD tends to overestimate the distances up to . Unless to figure out some bizarre mechanism for which the MMRD relation is followed only by novae nearby the Sun, the most simple explanation of this behavior is not a failure of the MMRD but a generalized underestimation of the measure of toward the more distant novae. Our analysis support the SG19 results, contrary to S18 conclusions.
6 Nova populations in external galaxies
The use of galactic data to study the properties of the Milky Way nova populations has been often questioned because of the observational bias due to both interstellar absorption in the galactic disk and our position within the Galaxy. These effects can be largely minimized by studying the spatial distribution of nova populations in external galaxies where novae are all at essentially the same distance.
6.1 Novae in M31
Due to its closeness and the relatively high frequency of nova events, the M31 nova population has been the only one extensively studied. However, a simple skimming through past literature reveals the existence of different ideas on the nova population assignment: intermediate populations (Arp, 1956; Rosino, 1964), halo population (Wenzel and Meinunger, 1978), mainly bulge population (Ciardullo et al, 1987; Capaccioli et al, 1989; Shafter and Irby, 2001), mostly disk population (Hatano et al, 1997). Although it is possible that a fraction of M31 novae assigned to the bulge by Ciardullo et al (1987) and Capaccioli et al (1989) are in fact physically related to the disk and their allotment to the bulge was a simple consequence of neglecting the geometrical projection effects (Hatano et al, 1997), there are two arguments that strongly suggest that most novae in M31 mainly belong to the bulge. First of all, Capaccioli et al (1989) show a close similarity between the projected density distribution of the nova system with the decomposed light profile of M31 into the two main components: bulge and disk (see Fig. 37). In this plot, novae follow the solid line, i.e., the model for the bulge along the major axis resulting from the decomposition in bulge/disk components of the B band luminosity profile (Walterbos, 1986), while the dotted line is the exponential model of the major axis B light profile of the disk from the same author. It is apparent that the nova surface density follows the light profile of the bulge and unless severe selection effects, due to dust for example prevent the discovery of disk novae in M31, one can conclude that novae ignore the trend of the light of the disk. We note that Kaur (2016) results on M31 seem to exclude that dust can induce such a selection effect.
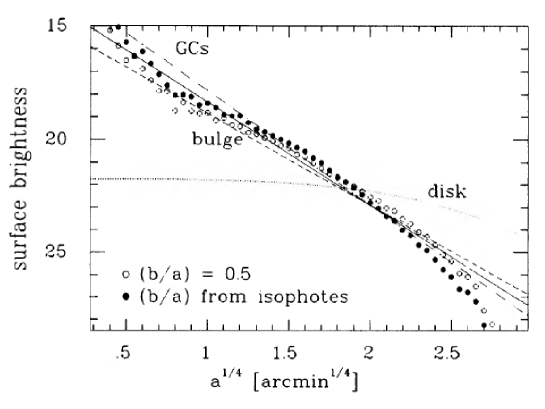
Shafter and Irby (2001) have reappraised the Hatano et al.’s conclusions, after comparing the spatial distribution of novae with the background light of M31. They indeed confirm that most novae in M31 originate in the bulge: likely about 70% and not less than 50%. Some interesting hints come also from spectroscopic observations (Shafter et al, 2012). These authors find that about 80% of M31 novae belong to the Fe II spectral class. In view of what we discussed in Sect. 4.1, we can conclude that most novae in M31 are “bulge” novae.
The first estimate of nova rate in M31 dates back to Hubble (1929) who derived from a sample of about eighty novae an observed rate of 21.5/yr. After applying a number of correction factors he concluded: “that thirty per year is a reasonable estimate of the frequency of novae in M31”. Not far from this result appears the estimate by Arp (1956). He obtained from an almost continuous 1.5 year survey carried out with the 60-inch telescope at Mount Wilson an observed rate of 19.85 per year, which he corrected to a “real” frequency of novae per year to account for systematic bias. By taking advantage of two nova surveys carried out at Asiago Observatory with the 1.22-m (Rosino, 1964, 1973) and 1.82-m (Rosino et al, 1989) telescopes, Capaccioli et al (1989) derived from a global sample of 142 novae, an observed rate of novae per year. Later analysis of Shafter and Irby (2001) based on 53 new discovered novae found a rate slightly larger than previous estimates: novae per year, and about 70% of them produced in the bulge. Darnley et al (2006) reported in the framework of POINT-AGAPE microlensing survey a nova rate in M31 of novae/yr from an “observed” sample of 20. This is a full factor two larger than previously estimated. All nova rate data are summarized in Table 5.

.
| Novae | rate | author | method |
|---|---|---|---|
| 85 | 30 | Hubble (1929) | observations |
| 30 | 264 | Arp (1956) | observations |
| 142 | 29 4 | Capaccioli et al (1989) | observations |
| 72 | 37+12 -8 | Shafter and Irby (2001) | observations |
| 22 | 65 +16-15 | Darnley et al (2006) | observations |
| - | 97 | Chen et al (2016) | Theory |
| - | 106 | Soraisam (2016) | Theory+ analysis of the bias |
A technical analysis of the completeness factors and criteria adopted by Darnley et al (2006) to derive the latter result is outside the scope of this review. Nevertheless, we point out the following: according to Shafter and Irby (2001) the nova rate in M31 can be as high as novae/yr “if the luminosity-specific disk and bulge nova rates are comparable”. On the other hand, Darnley et al (2006) concluded that “M31 bulge CN eruption rate per unit flux is more than five times greater than that of the disc.”. It looks like that the two conclusions are inconsistent with each other. A possible way out is that the nova rate in M31 is significantly higher than reported above. For example, Chen et al (2016) by using different star formation histories such as a starburst case for early type galaxies, a constant star formation rate case for spiral galaxies and a composite case for “early” spirals such as M31, estimated a new rate of 97 novae per year for Andromeda galaxy. These authors also found other interesting results. The nova rate at 10 Gyr in an elliptical galaxy is up to 20 times smaller than a spiral galaxy with the same mass. Therefore the specific nova rate per unit of luminosity (or mass) in the “Ellipticals” peaks around 1 Gyr and declines by 2 orders of magnitude at 10 Gyr. In “Spirals” the specific nova rate peaks around 2 Gyr and declines by a factor of 4 after 10 Gyr. The specific nova rate for elliptical galaxies at 10 Gyr is per , which is consistent with previous predictions (Matteucci et al, 2003) and observations (see Fig. 42). The normalized nova rate for Spiral at 10 Gyr is 20–40 per , significantly higher than measured in early type galaxies. This result is qualitatively in agreement with observations (Della Valle and Livio, 1994; Della Valle et al, 2002; Alis and Saygac, 2014) although the ratio is much larger than observed. According to Chen et al (2016) this mismatch may be due to either the incompleteness of past surveys or incorrect assumptions on the SF history in their models. By applying the normalized nova rates in spirals derived by Chen et al (2016), to the LMC, one should observe between 6 and 12 novae/yr, which are unrealistic values for the nova rate in our satellite galaxy (see Sec. 6.3). Therefore we tend to downsize the case for incompleteness and to agree with the authors that the mismatch is possibly due to some incorrect assumptions on the SF history, although the trend of the normalized nova rates exhibited by early-type to late-type hosts is qualitatively consistent with observations.
Similar high frequency have been obtained by Soraisam (2016) after assuming that specific nova rates in the bulge and disc are the same and by correcting the Arp’s and Darnley et al.’s rate for an hypothetical bias against the discovery of fast novae due to the poor observing cadence of these surveys. These authors estimated 106 novae yr-1. We note that Arp survey consisted of about 1000 plates taken on 290 nights distributed over 18 months, June 1953–Jan 1955. These data imply about one observing night every due days and about three plates per night. With such a “dense” sampling it is rather difficult to think that Arp might have missed a significant number of “fast” and “bright” novae. Arp indeed concluded: “Consequently of the 30 novae discovered, for only 5 were the maxima missed by more than a day”. Therefore the paucity of detection of fast and bright novae in M31 does not seem the result of an observational bias rather being due to the poor efficiency of old stellar populations to produce fast novae, which originate by massive WDs. These novae are characterized by lifetimes of the order of a few years (see Sect. 1.2) and therefore we do not expect that they are predominant in years old bulge stellar population. In the following, we adopt novae/yr as an “educated guess” for the frequency of occurrence of novae in M31.
6.2 Novae in M33
Until the 1990s the nova rate in M33 was based on the Hubble and Sandage (1953), Arp (1956) and Sharov (1993) estimates, ranging between 1 and 0.5 novae/yr. However, in the 1960s a nova survey on M33 started at Asiago Observatory, although sparser than the M31 survey carried out in the same years. Those observations allowed to discover 5 novae and to conclude that the nova rate in M33 was not “so low as previously assumed” (Rosino and Bianchini, 1973). A new surveys was started a few years later at the 1.82-m telescope and five more novae were discovered (Della Valle, 1988). Altogether these observations have provided the database to measure a rate of novae/yr (Della Valle et al, 1994). A few years later Williams and Shafter (2004) started an Hα survey which led to the discovery of four novae brighter than mag, and to derive a nova rate of novae/yr. In Table 6, we summarize the results reported by these three independent surveys. A grand total of 14 novae have been discovered during a total control-time of 5.5 yr. After extrapolating the observed number of novae to the whole M33 field, according to the correction factors provided by the different authors we find: ( poissonian error).
| Nova Survey | C-Time | Novae | Corr. | Novae |
|---|---|---|---|---|
| Telescope | yr | obs | field | |
| 1.22m | 0.85 | 5 | 1 | 5 |
| 1.82m | 1.9 | 5 | 1.4 | 7 |
| 1.00m | 2.75 | 4 | 1.75 | 7 |
| 5.5 | 14 | 19 |
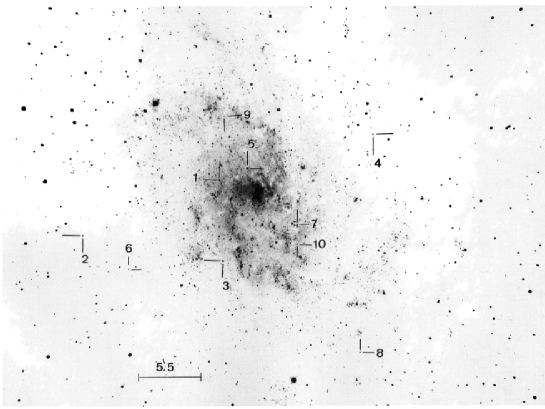
We note that to compute the control time of their survey Williams and Shafter (2004) assumed a set of template lightcurves based on the peak mag and rate of decline derived for M31 novae. The authors are well aware of the possible drawbacks of their approach and indeed they warn the readers:
“in our analysis is the assumption that the lightcurve properties of novae in M31 which were used in the Monte Carlo and mean H lifetime nova rate calculations are representative of novae in M33. If M33 contains a higher percentage of “fast” novae compared with M31, then we may be overestimating the mean nova lifetime in M33 and thus underestimating the true nova rate.”
Their assumption is fully justified if one compares nova populations having similar properties (e.g., novae of the bulge of M31 with novae in an elliptical galaxy in Virgo), but it is not applicable here because M33 is an almost bulgeless galaxy (Bothun, 1992) and therefore its nova production necessarily originates in the disk, in particular, Fig. 39 shows that novae appear superimposed on the arms of the parent galaxy. Shafter et al (2012) were able to carry out a spectroscopic survey on novae in M33, a notable piece of work given the small number of novae that can be discovered during a campaign. They found that only 2 out of 8 discovered objects were members of the Fe II Williams’ spectroscopic class. This result is different (at a confidence level of ) from what expected on the basis of Milky Way (Della Valle and Livio, 1998) and M31 (Shafter et al, 2011) results, where most nova populations () are Fe II objects. Therefore the assumption that the properties of novae in M33 were similar to those of novae in M31 is not anymore justified and the rate of 2.5 novae/yr should be regarded as a robust lower limit for the nova rate in M33. Fast Novae close to maximum light evolve more quickly than slow novae also if observed in light, although at slower rate than exhibited in light, possibly a factor rather than . As a consequence the control time of Williams and Shafter (2004) is likely to be overestimated by and the nova rate in M33 underestimated by an equal amount. Therefore the nova rate in M33 is larger than previously estimated, we assume hereinafter: .
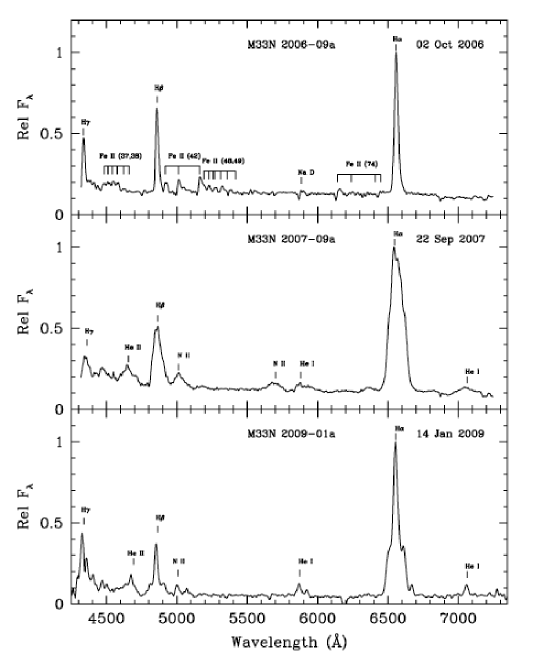
6.3 Novae in the Magellanic Clouds
The properties of the outbursts of LMC novae and their frequency of occurrence have been well established only recently. Until the 1990s only 20 objects – the first one observed in 1926 (Buscombe and de Vaucouleurs, 1955) – were available and a reliable estimate of the nova rate was jeopardized by the fragmentary nature of observations, in some cases even one discovery every ten years. A first summary of the available data until Nova LMC 1988 has been provided by Capaccioli et al (1990). In spite of the paucity of the data these authors could compile the MMRD relation that showed a remarkable percentage excess of fast novae compared to M31.
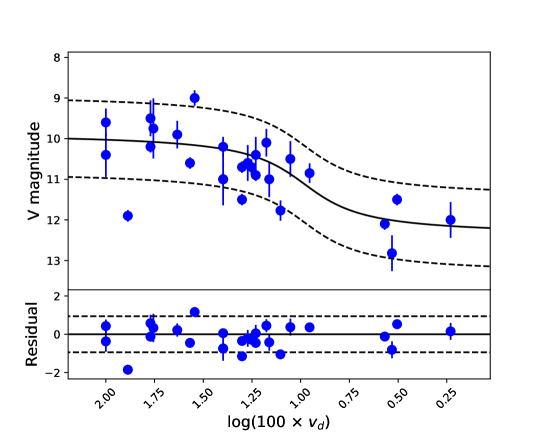
.
The data could be fitted with the same MMRD derived from M31 novae, obviously after applying a different zero point. In other words the MMRD relation seems universal in terms of relation between peak magnitude and rate of decline but not as it concerns the relative percentage of the bright and fast novae with respect to faint and slow. This piece of observation has an important consequence. We have previously commented about the rates of decline from maximum light as a tracer for differences in the parameters of nova outbursts (Sect. 3.2), particularly for the mass of the underlying WD. Most novae in the LMC are bright and fast declining then suggesting a membership to disk nova population which originates from more massive WDs. However, other parameters are at play. For example Starrfield et al (2000) explain this behavior on the basis of the metallicity of the accreted material. Kato et al (2013) after studying the effects of low Z on the properties of nova outbursts achieved similar conclusions. These authors concluded that LMC novae should be brighter and eject more material than Galactic novae of the same type since the LMC metallicity is about one-third that of the Galaxy. The age of the parent stellar populations of fast and slow novae were also studied in details by Subramaniam and Anupama (2002) on a sample of 15 LMC novae. They were able to prove an upper and lower limits, for the age of parent stellar population of fast and moderately fast novae of 3.2 and 1 Gyr, unlike the stellar regions around slow novae mostly in the range 4–10 Gyrs.
More recently Shafter (2013) revised and collected data for 43 novae and through a detailed analysis of 29 lightcurves and 18 spectra, was able to confirm that LMC novae: i) have faster rates of decline than novae in the Milky Way and in M31; ii) show a high percentage of He/N and Fe IIb novae compared with M31. Therefore bright He/N disk-novae dominate the LMC nova production unlike M31 where faint Fe II bulge novae are predominating.
The measurement of the nova rate in the LMC is a recent story. The first estimate was provided by Graham (1979) at the end of a years survey which allowed to discovery 10 novae. He suggested a rate between 2 and 3 novae/yr, and today we can say that he was right. Capaccioli et al (1990) found novae/yr, Della Valle et al (2002) found novae/yr and recently Mróz et al (2016) from the OGLE survey derived novae/yr.
The estimate of the rate in the SMC is a more critical issue because a continuous monitoring of this galaxy for nova searches has never been carried out if not very recently thanks to the OGLE surveys (Mróz et al, 2016). Here below, we describe four different approaches:
i) we can derive a first order estimate after assuming that the nova rate scales as the K-band luminosity of the host. After assuming and , we derive a nova rate of novae/yr.
ii) A second measurement derives from the discovery of 4 novae in the SMC during 1999 (Welch and MACHO Collaboration, 1999a; Glicenstein, 1999b, a; Welch and MACHO Collaboration, 1999b). Although none of the objects has been spectroscopically confirmed, their lightcurves show sudden changes of the brigtness by more than mag on time scales of days/weeks. This behaviour is typical for novae, although dwarf-nova bursts originated by the rare sub-class of WZ Sge (Ortolani et al, 1980) show a similar photometric behaviour. However, their intrinsic luminosity excludes this possibility. After assuming that these 4 events are novae, a simple application of poissonian statistic (Gehrels, 1986) implies that the nova rate in the SMC has to be larger than 0.7 novae/yr (Della Valle et al, 2002) at confidence level.
iii) A third approach is based on the intensive monitoring of the SMC operated in the early 2000s, for example by Bill Liller, which led to the discovery of 6 novae. We derive an “observed” rate of novae yr-1 which should be regarded as a robust lower limit.
iv) Finally, Mróz et al (2016) further extended the SMC nova database and derive a rate of novae yr-1 fully consistent with the rates derived above. This is the rate that will be adopted hereinafter.
6.4 Novae in M81
The analysis of 79 plates obtained in the 1950–55 Palomar campaign for the discovery of Cepheids and novae in M81 has been published many years later by Shara et al (1999). These authors concluded that the spatial distribution of 23 discovered novae is consistent with the two populations divisions as argued previously. Particularly, they estimate that the fraction of novae belonging to the bulge is not larger than . From the data reported in the paper it has been possible to derive the control time of the survey and a rate of novae/yr in agreement within the errors with the rate estimated by Neill and Shara (2004) of novae per year. The average value that we adopt hereinafter is: novae per year.
6.5 Novae in Virgo and Fornax ellipticals
First observations of novae in Virgo galaxies were reported by Hubble (Bowen, 1954) but only after Pritchet and van den Bergh (1987) the study of novae outside the Local Group of galaxies changed from sporadic interest into a mature field of research. These authors estimated on the basis of 9 detections in the B band a rate of novae/yr, which almost corresponds to the rate in M49 because 8 out of the 9 novae were discovered in this galaxy. Shafter et al (2000) used the Kitt Peak 4-m telescope to monitor M87 in Hα filter and they discovered 9 novae from which a rate of novae/yr was estimated. Ferrarese et al (2003) reported after a 55 days campaign carried out with HST/WFPC2 in V and I colors the discovery of 9 novae in M49, from which they derived a rate of novae/yr. Curtin et al (2015) have monitored in Hα M87, M49, and M84 with the Canada-France-Hawaii 3.6-m telescope over about one year of control time and they estimated , and , respectively. By averaging these measurements, we find and for M87. These rates are consistent with the frequency of occurrence of 90–180 novae/yr estimated by Della Valle and Gilmozzi (2002) for the giant elliptical NGC 1316 in Fornax cluster. Recently, Shara et al (2016) have derived from a new survey on novae in M87 a higher rate of (see next paragraph).
6.6 Nova rates as function of the Hubble type of the hosts
Several authors (Della Valle and Livio, 1994; Shafter et al, 2000) have studied the trend of the nova rates as a function of the total and normalized luminosity of the parent galaxy. They suggested, though with different views that there may exist a systematic difference in the nova rate per unit of luminosity in galaxies of different colors (Hubble types) and/or classes of luminosity (see their Fig. 3 and 4). One result on which both teams seem to converge is that “blue” galaxies of the sample, characterized by low luminosity classes are more prolific nova producers than early-type spirals and ellipticals by a factor . The current available data are summarized in Table 7 with obvious meaning of the acronyms.
| Galaxy | B | Agal | Aint | (B-K) | () | Rate | Ref. | ||
|---|---|---|---|---|---|---|---|---|---|
| (mag) | (mag) | (mag) | (mag) | (mag) | (/yr) | (*) | |||
| M31 | 4.360.02 | 0.46 | 0.2 | 3.85 | 24.38 | 40 | 8.0 | 5.0 | 1,3,10,16 |
| N5128 | 7.840.06 | 0.50 | 0.0 | 3.38 | 28.12 | 28 | 6.2 | 4.5 | 4 |
| M33 | 6.270.03 | 0.18 | 0.40 | 2.87 | 24.64 | 4.1 | 0.7 | 6.1 | 6,14 |
| LMC | 0.910.05 | 0.26 | 0.13 | 2.74 | 18.50 | 2.4 | 0.3 | 8.4 | 5,20 |
| SMC | 2.700.10 | 0.20 | 0.41 | 2.71 | 18.99 | 0.9 | 0.1 | 10.4 | 11,20 |
| M49 | 9.370.06 | 0.10 | 0.00 | 4.30 | 31.06 | 158 | 51.1 | 3.1 | 2,13,19 |
| M100 | 10.050.08 | 0.11 | 0.06 | 3.84 | 31.04 | 25 | 17.7 | 1.4 | 7 |
| M87 | 9.590.04 | 0.10 | 0.00 | 4.17 | 31.03 | 136 | 36.0 | 3.8 | 9,19 |
| 363 | 10.1 | 21 | |||||||
| M51 | 8.960.06 | 0.15 | 0.12 | 3.43 | 29.42 | 18 | 7.5 | 2.4 | 9 |
| M101 | 8.310.09 | 0.04 | 0.03 | 3.24 | 29.34 | 12 | 10.4 | 1.1 | 9,17 |
| M81 | 7.890.03 | 0.35 | 0.37 | 3.99 | 27.80 | 28 | 7.9 | 3.5 | 8,15 |
| N1316 | 9.420.08 | 0.09 | 0.00 | 4.15 | 31.66 | 135 | 73.8 | 1.8 | 12 |
| M84 | 10.010.12 | 0.18 | 0.00 | 3.76 | 31.32 | 95 | 22.1 | 4.3 | 19 |
| M94 | 8.990.05 | 0.08 | 0.09 | 3.72 | 28.21 | 5 | 3.1 | 1.6 | 18 |
Analysis of the data reported in Fig. 42 confirms that “red” galaxies, say, redder than (B–K) 3.2 show a constant trend of the normalized nova rate, close to while blue systems, belonging to low luminosity class galaxies, exhibit a normalized luminosity a factor at least times larger.
The existence of an overproduction of nova outbursts in the LMC and SMC and to a smaller extent in M33 might be a consequence of the so called ‘selection effects’ on the nova frequency, investigated by Truran and Livio (1986) and Ritter et al (1991). It is due to the different recurrence times and number of nova progenitors per unit of luminosity in the respective hosts. The argument is the following: from Della Valle and Livio (1998) we derive an average magnitude at maximum for a typical nova originating in an old stellar population (“bulge nova”) of M mag. The same authors derive M mag for the average nova produced in a star forming stellar population (“disk nova”). After using the relation obtained by Livio (1992) between the magnitude at maximum and the mass of the underlying white dwarf, we obtain: and – respectively (see also SG19). We know that nova systems in disk dominated galaxies result in more frequent nova events due to the shorter nova recurrence time associated with massive WDs. For example, from Yaron et al (2005) we obtain for novae characterized by the above reported masses, recurrence times of years (by interpolating data of their Table 3 for and , and K) and yr for a , and K. On the other hand, according to Cummings et al (2018) and assuming a Salpeter IMF the number of nova progenitors characterized by white dwarf is about 5 times larger than the number of novae with white dwarf. Therefore the observable outburst ratio between disk and bulge novae becomes:
| (16) |
in good agreement with observations.
Recently, Shara et al (2016) derived from 41 novae discovered in a HST survey on M87 a global rate of novae/yr. If confirmed this high rate implies a specific (normalized) nova rate of about which is comparable to those exhibited by Magellanic Clouds (see Fig. 42). Therefore the density of nova outbursts in giant elliptical would be similar to that observed in dwarf irregular star forming galaxies. In turn this implies that the recurrence times of novae harbored in binary systems including light WDs – the only ones active in the old stellar populations of ellipticals – should be considerably shorter than estimated by several authors (Yaron et al, 2005; Starrfield et al, 2019), or that the number of potential progenitors of CNe vastly exceed the value expected from stellar evolution arguments.
One possible explanation suggested by Shara et al (2016) is that all previous ground-based surveys for novae in external galaxies have missed most novae, especially the ones belonging to the hypothetical class of “fast” and “faint”. There are two arguments against this hypothesis: i) Pritchet and van den Bergh (1987) survey on Virgo ellipticals was densely sampled with 11 observing runs distributed on 15 nights. None faint and fast novae were discovered but seven faint and slow declining objects. This behavior is reminiscent of the Arp’s result described in Sect. 6.1 and it is suggestive that old bulge stellar population are inefficient producers of bright and fast novae due to the lack of active nova systems containing massive WDs; ii) Ferrarese et al (2003) survey was carried out with HST as well, so it is difficult to call for a massive observational bias affecting this survey. Recently, Shafter (2017) through an independent analysis of the HST data resize the result of Shara et al (2016) and concluded that nova rates as low as 200 per year remain plausible.
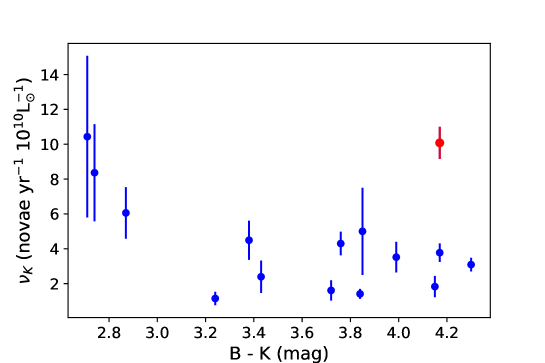
A speculative possibility is represented by a further develop of an interesting result obtained by Livio et al (2002). After the serendipitous discovery of a SN Ia near the jet of the active galaxy 3C 78, these authors have examined the issue of whether jets can enhance accretion onto white dwarfs via Bondi accretion process. They also present evidence for observations of 11 novae in close proximity to the jet. From a simple application of the Bondi (1952) formula for accretion on a star, we derive that this process is efficient only for very low stellar velocities (a few km/s). If we assume typical star velocities of the order of 10–100 km s-1 as measured by Williams et al (1994) for nova systems in the Milky Way and the jet has a width of about 0.1 kpc, the transit time is less than 100 Myr during which the accreted mass onto massive WDs would be only - similar to the mass of nova accreted envelopes. This makes the accretion process from the ISM likely inefficient to trigger SN Ia explosions while it may play an important role to trigger nova explosions. If true, this result may account for the high frequency of nova events observed near the nucleus/jet of M87 (Madrid et al, 2007) that might be considerably higher than observed in the rest of the galaxy.
6.7 Nova outbursts as a function of the metallicity content and class of luminosity of the hosts
The observed trend of the normalized nova rate might be also interpreted in terms of differences in the metallicity of the parent stellar population. For example Starrfield et al (1998) have discovered, on theoretical grounds, that novae originating in low metallicity stellar environments are more brighter at maximum light, than novae originating in populations characterized by solar metallicity and this fact is observed in the LMC, which is characterized by a metallicity that is about 1/3 of that of the Milky Way. The presence of a nova overproduction in blue galaxies with respect to red galaxies may also hint for the existence of a link between star formation and the frequency of occurrence of nova outbursts. For example, Yungelson et al (1997) have suggested that in irregular and late dwarf spiral galaxies the nova rates is mainly determined by the current star formation rate in the disk, while the nova rate in elliptical galaxies mainly depends on the mass of the galaxy. Since the star formation rate in giant spirals was, several Gyr ago, much higher than the present one (Gavazzi and Scodeggio, 1996) it turns out that most stars in the disk of giant spirals are old and their nova population characterized by a frequency of occurrence of nova systems not too different from that occurs in their bulges. In addition since the present SFR decreases moving from late to early spirals, it is not unexpected to find that the integrated colors of giant spirals should be redder than the integrated colors of dwarf spirals where the SFR is still active. This scenario provides a simple explanation of the fact that giant late spirals, as M51 and M101 have redder colors than dwarf galaxies of comparable Hubble type and a nova frequency of occurrence similar to that of the bulges.
7 Novae in globular clusters
The researches for novae in globular clusters (GCs) have always given a very limited number of detections. Two novae have been so far discovered in Milky Way GCs: M80 and M14. The former, T Sco 1860, occurred in M80 (Sawyer, 1938) and it was a moderately fast nova with a t3 of about three weeks. The latter was a nova discovered by Sawyer Hogg and Wehlau (1964) on photographic plates taken with the 72 inches telescope at the Dominion Observatory in 1938. M14 has been imaged on 124 nights from 1932 to 1963 and the nova was detected during its final decline in all eight plates obtained in 1938. The post-nova candidate was possibly identified by Shara et al (1986). The whole collection was formed by 2500 plates that have imaged 50 GCs. In a zero order approximation we can set a lower limit for the rate of novae in Milky Way GCs, after considering an effective survey time of about 30 years on 50 GCs and a single detection. By combining these data the rate of novae should be larger than novae . In modern times nova outbursts have been unsuccessfully searched by Ciardullo et al (1990) in 54 globular clusters of M31 on a mean effective survey time of about 2 years. Similar results were obtained by Tomaney and Shafter (1992) that carried out a survey on 200 M31 GCs over 1 year of effective surveillance time. The null result for both surveys can provide some constraints on the nova rate in GCs. In particular, from simple Poisson statistics we find that the probability of obtaining a null result are 95% and 5% when the expected values are 0.05 and 3.0, respectively. Therefore one should expect that the nova rate in GCs may be larger than the 95% probability value, i.e., novae and hardly higher than the 5% probability value, i.e., novae . The lower limit is consistent with the result of Shara et al (2004), who estimated a rate for the M87 of novae GC. The results based on X-ray surveys on M31 GCs (Henze et al, 2013) of: matches the upper limit on the GCs nova rates obtained via optical surveys. Finally, Curtin et al (2015) and Doyle et al (2019) find a GC nova rate of: and novae , respectively.
The scanty statistics results in a global rate affected by almost two orders magnitude uncertainty: between a few and novae GC.
During their nova survey on M49, M87 and M84, Curtin et al (2015) found that two out of 84 novae were discovered in the GC systems of these galaxies. The GC systems correspond to 2.4 of detected novae, while the mass of GCs comprise only the 0.23 of the combined mass of the galaxies. Thus, these authors speculate that the nova rate in GCs might be enhanced by a factor 10 relatively to the nova rates measured in the host galaxies. Such a high nova rate in GCs might receive some support by the study of (Kato et al, 2013) who found on theoretical grounds that the nova population in GCs should be mainly formed by fast novae. These novae are easily missed during low-cadence surveys that characterized the search for CNe in such stellar systems. On the other hand, Cao et al (2012) by studying the M31 globular clusters system concluded that the M31 GC specific nova rate is not significantly higher than the Andromeda specific nova rate. We should take both conclusions with some degree of caution because they are still dominated by small number statistics.
8 The MMRD relationship in galaxies of different Hubble types
Figure 43 shows the maximum magnitude vs. rate of decline relationship for LMC, M31 and Virgo novae. This plot indicates that the nova production in the LMC is clearly biased towards fast and bright novae, whereas the M31 nova population exhibits a prominent ‘slow’ component. By the same token the trend exhibited by novae discovered in Virgo. These trends are confirmed by a Kolmogorov–Smirnov test carried out on the rates of decline distributions of the respective nova populations. We find that the lightcurves of M31 novae mimic well the trend exhibited by the Virgo nova population (KS Probability = 0.7), but deviate strongly from the behaviour of the LMC novae (KS Probability = 0.005) which are on average faster. It is not obvious to explain this behavior in terms of an observational bias: indeed the brightest novae are detected in the nearest galaxy (LMC) and they would be missed in the more distant ones (Virgo), while faint novae would be detected in 15–20 Mpc away systems and missed in nearby galaxies, such as the MCs. The apparent magnitudes at maximum of novae belonging to the faint tail of the LMC, reach V=12-13 mag which are well within the capability of surveys currently in progress (Mróz et al, 2016), therefore faint and slow novae in MCs are intrinsically rare objects. Obviously it is possible that some fast nova is missed in poor sampled surveys (Rosino et al, 1989) but this doesn’t seem the case for the Arp (1956), Pritchet and van den Bergh (1987) and Ferrarese et al (2003) surveys which observations were carried out – on average – every other night.
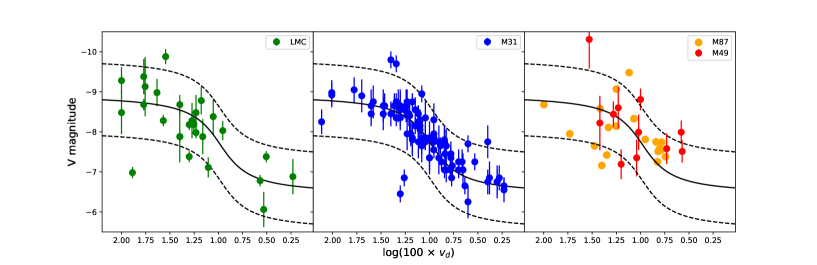
Since the luminosity at maximum and the speed class of a nova depends on the physical parameters that determines the strength of the outburst (Yaron et al, 2005) the rate of decline should be regarded as a valuable tracer of intrinsic differences in the nova populations. The differences in the MMRDs find a simple explanation in the framework of the two nova populations scenario: nova systems in disk dominated galaxies are associated with more massive WDs then resulting in faster, intrinsically brighter and more frequent nova events (see Sect. 6.6). Given the relatively short lifetime of the nova phase for these systems (see Sect. 1.2) they can be detected in galaxies where the star formation is still active, while the nova population in old stellar systems is mainly formed by “old” nova systems that contain light WDs and are characterized by nova lifetime of the order of years. Therefore the lack of fast and bright novae in old stellar systems as elliptical galaxies appears to be real.
8.1 Outliers of the MMRD
The existence of outliers of the MMRD was first reported by Arp (1956), see his Fig. 32. Arp himself suggested that nova number 4 was a heavy absorbed object, “obscured” by 2.2 mag. Rosino (1973) found two more deviating objects Nova 48 and Nova 66 which were found to be spatially coincident with nova 79 and nova 81, therefore he classified them as RNe. Both novae have fallen below the MMRD, then providing the first suggestion that some RN might be outlier of the MMRD. Della Valle (1991) found another faint outlier of the LMC MMRD: Nova LMC 1951 which was about two magnitudes dimmed than expected from the measured rate of decline. He also found evidence for the existence of a family of superbright novae (see for example Fig. 44) brighter than expected up to mag above the strip of the MMRD: Nova LMC 1990-1 (Schwarz et al, 2001), Rosino’s novae in M31, nr. 28, 57, 53, 36, 85 and one object in Virgo. In the following we have assumed as outliers the points that fall outside the strip. Faint and fast novae are rare objects, so they may well be patchy absorbed objects or intrinsically faint novae (such as RNe, for example) which eject very light envelopes. More difficult is to explain the existence of “super-bright” novae, because it would imply the existence of an extra-energy source other than nuclear burning. The spectroscopic and photometric evolution of nova LMC 1991 excludes its membership to the class of “red luminous novae” (Rich et al, 1989; Mould et al, 1990; Martini et al, 1999). According to Iben and Livio (1993) one possible explanation is the dissipation of the orbital energy motion of the secondary engulfed in the expanding nova ejecta during the nova common envelope phase. An alternative may be the relatively rare super-bright nova explosions which occur in CV-like systems formed by a cold low-mass degenerate dwarf accreting matter from a close low-mass companion (Iben and Tutukov, 1992).

More recently a paper by Kasliwal et al (2011) claim on the basis of 20 novae discovered in M31 (10), M81 (6), M82 (3) and NGC 2403 (1) that this sample is inconsistent with the canonical MMRD. A close inspection of their Fig. 11, reveals that only 2 objects out of 17 (for which was possible to determine the MMRD parameters) match the MMRD. Other 4 objects are borderline and consistent with the relation within the errors. In other words between 65% and 90% of novae in Kasliwal et al (2011) sample appear to be outliers of the relation. This is a surprising result if compared with the percentage of outliers discussed above. Taking these figures at their face values the MMRD should be a very poor relation, but this seems out of question after the recent GAIA DR2 results (see SG19 and fig. 36 in this paper). The robustness of the relation is confirmed by the fact that the “canonical” MMRD is based on 119 M31 and LMC nova lightcurves, see Fig. 34, and only of them are outliers. The M31 data come from three different surveys obtained with three different telescopes (60-inch, mount Wilson and 1.22 and 1.82 cm at Asiago Observatory) from two experienced observers as Arp (1956) and Rosino (1964, 1973); Rosino et al (1989). LMC data are a collection of relatively sparse observations, but in spite of this, the MMRD relation for the LMC, see Fig. 41, shows only two (7%) obvious outliers. Therefore it is difficult to understand where the Kasliwal et al (2011) high percentage of outliers is produced. The daily cadence of the Kasliwal et al.’s survey – which is not very different from the Arp one – does not seem at the origin of this high percentage of outliers. Kasliwal et al (2011) finds values not unusual for nova systems and much longer than the of a few hours hypothesized for the ultra-fast nova population. In the attempt to clarify this point, in Fig. 45 we have added to the Arp and Rosino novae the eight M31 Kasliwal et al.’s objects for which the authors reported the magnitude at maximum and the rate of decline (see their Table 5). The use of apparent magnitudes rather than absolute magnitudes has the advantage to minimize the corrections to the original observations by avoiding the magnitude revision for background and foregrounds absorptions and removing the systematics due to the adoption of the distances toward each galaxy. The mag have been transformed to through derived from the photometric corrections reported in Capaccioli et al (1989) and Jordi et al (2006).
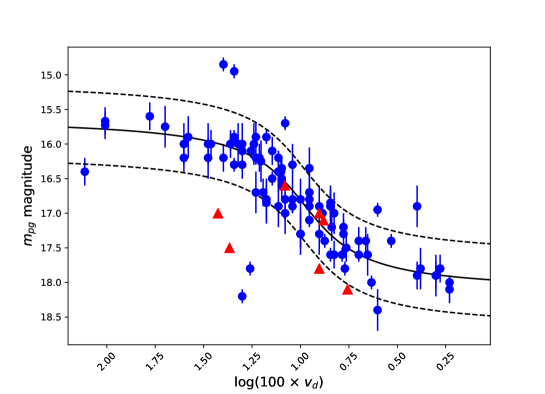
The lack of errorbars do not allow to be more quantitative but we think that five objects match the relation and another one might be consistent within the uncertainties with it. The two faintest novae might well be patchy absorbed novae and/or RNe caught in outburst. Admittedly on scanty statistics the fraction of outliers objects in M31 (2 out of eight) turns out to be consistent with previous findings.
Finally we note the following: the discovery of a new photometric sub-class of “faint” and “fast” classical novae by Kasliwal et al (2011) was essentially based on their Fig. 11, where it appears that most of newly discovered novae fall into the faint and moderately fast region of the MMRD after revision of their apparent magnitudes for internal and foreground absorptions toward each galaxy and by assuming the corresponding distance moduli. Systematic behaviours exhibited by data can hide pitfalls and other explanations. For example a similar systematic behaviour, even if observed in a different region of the MMRD plane, is exhibited by Hubble (1929) novae. In Fig. 46 we have added the Hubble data to Arp and Rosino novae (Hubble data from Table VI of Capaccioli et al 1989).
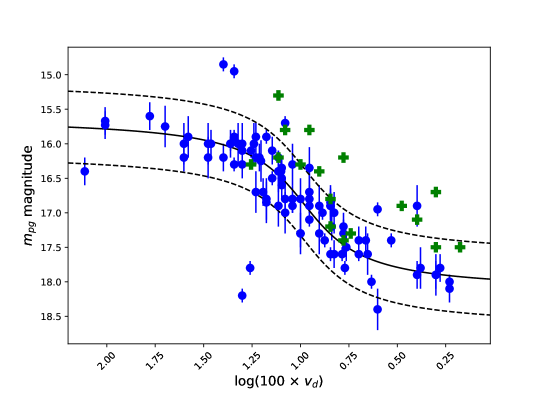
Most Hubble novae are systematically above the strip of the MMRD. They seem to identify a sub-class of “bright” and “slow” CNe. In fact these data points simply suffer of a mag offset in the zero point of the photometric calibration.
However, the observational evidence for the existence of a new photometric sub-class of “faint” and “fast” classical novae has vanished after Cao et al (2012) have published the data of their new survey on M31 novae. Fig. 47 has been obtained, by adding the Cao et al (2012) dataset to the Arp and Rosino data, by using the photometric correction term . We confirm all parameters reported by Cao et al (2012) with one exception: the value for nova 2010-06b. The first maximum of this “slow nova” is followed by a sharp and fast decline after which we can observe secondary maxima followed by strong fluctuations in brightness and finally a more gentle decline. To compute the correct rate of decline we have applied the smoothing procedure described in Sect. 3.1. We wish to point out that this “procedure” is standard (i.e., not “ad hoc”) for measuring or in nova lightcurves. This is the case for nova 2010-06b (that shows some resemblance to the nova n. 36 of Rosino) for which a is a more realistic choice. The MMRD parameters for the fair quality data of the Cao’s sample for which only lower limits to the were provided by the authors, have been directly derived from the published lightcurves (see Table 8 in Cao et al 2012) and our results are fully consistent with the original estimates of Cao et al (2012). All these data points match satisfactorily the MMRD relation and there are only two obvious outliers. The very bright nova 2009-10b, which achieved a magnitude at maximum of mag (almost mag in terms of absolute magnitude at maximum). Such bright novae are unusual in M31 but not unique events. Nova 2009-10b is a “twin” of novae nr. 28 (Rosino, 1964) and 57 (Rosino, 1973) indeed. The other one is nova 2010-06b that falls in the region of patchy absorbed CNe or RNe.
| Nova | Vmax | ||
|---|---|---|---|
| 2009-08b | 45 | 17.76 | |
| 2009-11b | 90 | 18.25 | |
| 2009-11d | 25 | 17.72 | |
| 2010-06a | 40 | 16.88 | |
| 2010-10a | 15 | 17.03 | |
| 2010-10b | 60 | 17.44 | |
| 2010-12b | 17 | 15.56 |
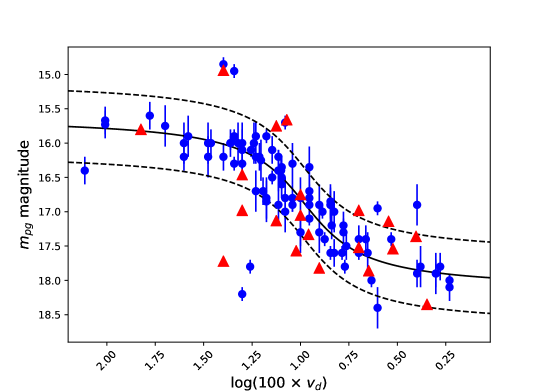
The third paper claiming the existence of a significant fraction of outliers in the MMRD relation is by Shara et al (2017a). These authors based their claim on the Kasliwal et al (2011) results and on their own survey on M87 novae (Shara et al, 2016). They discovered 41 novae and determine the MMRD parameters for 21 lightcurves. A quantitative inspection of each lightcurve confirms the parameters derived by Shara et al (2016) with the exception of nova 8 for which we find rather than 3.7 and novae 18 and 22 for which is impossible to derive the respective due to the incompleteness of the lightcurves.
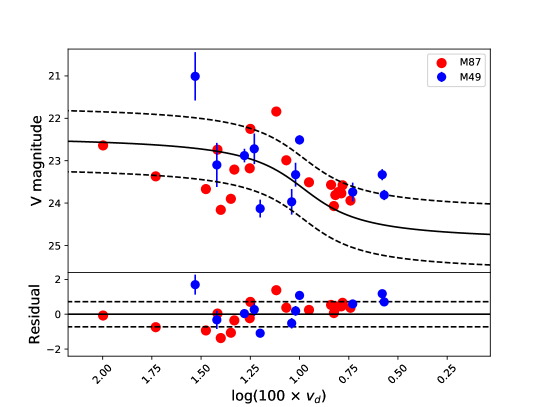
Figure 48 shows the positions of novae discovered in Virgo ellipticals (Pritchet and van den Bergh, 1987; Ferrarese et al, 2003; Shara et al, 2016) into the MMRD plane after assuming that M49 and M87 are basically at the same distance: mag and 31.12 mag, respectively.333\urlhttp://leda.univ-lyon1.fr/ Virgo novae are still consistent with the MMRD, but their distribution is characterized by a larger dispersion than it is observed in M31 and LMC. Indeed out of 30 objects (see Table 17) about 20% are outliers at level of . The larger dispersion is likely due to the presence of systematics related to photometric measurements at very faint luminosity levels in three different galaxies carried out by three different teams (Pritchet and van den Bergh, 1987; Ferrarese et al, 2003; Shara et al, 2016).
The distribution of the data points is consistent with the MMRD relation, particularly the HST data do not show the existence of any faint and fast subclass of CNe, but possibly the existence of a superbright outlier similar to nova 2 in NGC 4472 discovered by Pritchet and van den Bergh (1987). Obviously, due to the time sampling of the lightcurves we cannot exclude that these surveys have missed the ultra-fast novae with as short as a few hours (Yaron et al, 2005; Shara et al, 2017a). However, due to the tiny masses of the accreted envelopes, (Shara et al, 2017a) their peak magnitudes should be considerably dim with respect to CNe and so they are rather hard to discover in such distant galaxies.
An important result obtained by Shara et al (2016) is the discovery of a conspicuous faint and slow nova population, which is typical of an old parent stellar populations. From their published lightcurves we can infer that novae from n. 25 through n. 41 peak between mag and mag and are characterized by values that unfortunately can be only roughly estimated, but they very likely range in the interval –. These 17 data points would consistently populate the faint and slow region of the M87 MMRD in the range of rates of decline corresponds to 0.7–0.01, in terms of units.
9 Novae as distance indicators
There are several reasons for which novae were believed to be good distance indicators. They can be summarized as follows:
i) Novae are bright, they can reach M mag, about 3 magnitudes more luminous than Cepheids of longer periods.
ii) Unlike Cepheids that can be detected only in spirals, novae can be “easily” recognized also in ellipticals.
iii) Intrinsic differences in the outburst properties, existing between novae associated with the bulge or spiral arms stellar populations do not affect the zero point of the MMRD relationship, but only change the relative percentage of fast and bright novae. Particularly, we note that the luminous plateau of the MMRD relationship, characterized by an absolute magnitude of M mag (calibrated with GAIA DR2 nova distances), seems to be a “standard candle”, because it is constant along the different Hubble types of the host galaxies.
iv) There exists a good theoretical understanding of the MMRD, i.e., of the tool that it is used.
On the other hand, there are also some drawbacks for using novae as distance indicators:
i) The cosmic scatter of the MMRD relationship is relatively small, = 0.25 mag, which brings about 12% uncertainty in the distance. However, it is not so small as it would be required in the 1–2% cosmology accuracy era (Riess et al, 2019).
ii) Novae are transient objects so the time of their occurrence in the sky is unpredictable and therefore their observations are not easy to be scheduled. This aspect is not considered with favor by the various Time Allocation Committees.
9.1 The distance to M31, LMC and Virgo
To test the reliability of novae as distance indicators we measure the distances to M31, LMC and Virgo ellipticals by comparing the respective MMRD relations with the Galactic MMRD (Eq. 15 and Fig. 35) obtained using GAIA DR2 distance measurements, i.e., the “bona fide” sample described in Sect. 5.2 with the additional case of V1500 Cyg.444The GAIA DR2 distance of V1500 Cyg used in this paper, , can be derived using the parallex measurement as provided in the GAIA DR2 data archive: \urlhttps://gea.esac.esa.int/archive/ Particularly, we compare the absolute magnitude of the high luminosity plateau of the Galactic MMRD: (see Fig. 35) with the apparent magnitudes of the high luminosity plateau of M31, LMC and Virgo MMRDs, which are mag, mag and mag, respectively. The distance modulus for M31 can be derived by combining the new data with Eq. (4) from Capaccioli et al (1989):
| (17) |
which is in excellent agreement with the Cepheids measurement of mag obtained by Riess et al (2012). Obviously, novae due to the dispersion of the MMRD relation, provide the distance to M31 with an accuracy that is three times less than that provided by Riess et al (2012).
The comparison between Galactic and LMC MMRD relations finds a distance modulus:
| (18) |
The color excess mag has been derived from 6 novae reported by Shafter (2013) and it implies mag. Despite of scanty statistic this value is in good agreement with mag derived by Capaccioli et al (1990) from observations of reddened LMC Cepheids. The distance modulus of mag is in excellent agreement with the eclipsing binary distance of (statistical) (systematic) mag, obtained by Pietrzyński et al (2019) by studying 20 eclipsing binaries in the LMC. Novae exhibit an uncertainty on the distance to the LMC of which is much larger than the one derived by Pietrzyński et al (2019). Finally the comparison between the Galactic and Virgo MMRDs finds, after assuming mag:
| (19) |
in agreement within with recent measurements of Virgo cluster ellipticals of mag, and mag.555see Hyperleda archive: \urlhttp://leda.univ-lyon1.fr.
9.2 Novae as standard candles
The concepts of “distance indicators” and “standard candles” are often interchangeably used. In fact, they are different. The observation of a SN-Ia (standard candle) allows, at least in principle, to immediately compare the apparent and absolute magnitudes, and then to compute the distance to the host galaxy by observing a single object. On the other hand if we observe a single Cepheid (distance indicator) this is not enough to make a direct distance measurement of the distance to the host galaxy. We need first to observe a number of Cepheids with different periods in such a way to determine the “P-L” or the “P-L-C” relations, and then we use these relations to determine the distance. In this respect when we use the MMRD relation, novae behave as distance indicators.
The most popular method for using novae as “standard candles” is the so called Buscombe and de Vaucouleurs (1955) law. They first pointed out that all novae, irrespective of their rates of decline, have about the same absolute magnitude 15 days past maximum. This is a simple consequence of the MMRD relationship for which the most luminous novae decline faster and viceversa. As a consequence there is an epoch in which the lightcurves of fast and intrinsically bright novae cross the lightcurves of intrinsically faint and slowly declining objects. There are several calibration of the magnitude: = mag (van den Bergh and Younger, 1987), = mag (Cohen, 1985) = mag (Capaccioli et al, 1989). Downes and Duerbeck (2000) measured the distances of a dozen of galactic novae via nebular parallaxes and obtained = mag. Darnley et al (2006) found mag. We know that a nova at maximum light has a color index of mag (van den Bergh and Younger, 1987) that corresponds to a spectral type between A7 and F0, which in turn it is characterized by (Allen, 1973). This color index implies mag, after correcting for mag derived from mag (Burstein and Heiles, 1984). SG19 from a sample of 17 galactic novae have recalibrated the with GAIA DR2 distances and used a homogeneous treatment of the reddening correction (Selvelli and Gilmozzi, 2013). They find a weighted mean of mag.
From the Arp’s high quality sample of 23 M31 novae we compute mag. The distance modulus can be obtained by the usual formula (see above) and mag (Burstein and Heiles, 1984):
| (20) |
which agrees with the MMRD distance within a few hundredths of magnitude, admittedly with a lower accuracy. For the LMC we assume mag (Capaccioli et al, 1990) and mag (see above) and we find:
| (21) |
in agreement within about a tenth of magnitude with the MMRD distance.
Ferrarese et al (2003) by using 5 novae discovered in M49 find a mag, which would implies mag, which is about brighter than the SG19 calibration. This result is borderline but it is not totally off the wall after considering the small number (five) of objects in the Ferrarese et al.’s sample.
10 The role of novae in the Galactic Nucleosynthesis
Novae may significantly contribute to the galactic nucleosynthesis (Gehrz et al, 1998) because they produce considerable concentrations of isotopes such as (Sparks et al, 1978; Peimbert and Sarmiento, 1984; Williams, 1985) 22N, 26Al (Hillebrandt and Thielemann, 1982; Kolb and Politano, 1997), 22Ne (Livio and Truran, 1994), 7Li (Arnould and Norgaard, 1975; Starrfield et al, 1978; D’Antona and Matteucci, 1991; Izzo et al, 2015) and 7Be (Tajitsu et al, 2015; Molaro et al, 2016). The abundances of these elements in nova ejecta are significantly enhanced with respect to solar concentrations. The quantitative assessment of the contribution of novae to the chemical evolution of the Milky Way needs three quantities: i) the galactic nova rate; ii) the mass of the ejected envelopes; iii) the abundances of heavy elements in the nova ejecta. The Galactic nova rate has been extensively discussed in Sect. 3.5 and in the following we adopt a frequency of occurrence for novae in the Milky Way of about 25 novae/yr.
10.1 The mass of the ejecta
We present in Fig. 49 the estimates of the mass distribution of the ejecta collected from literature. The data distribution peak at . Fig. 50 shows that the ejected mass marginally correlates (95% c.l.) with the class of speed of the nova, according to:
| (22) |
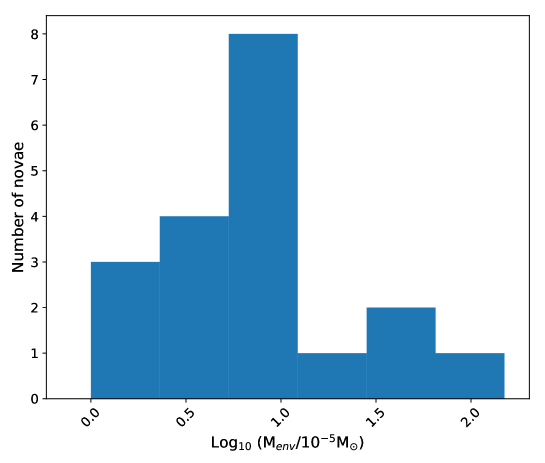
This result is not unexpected. Since the more massive white dwarfs need, on average, to accrete less material to achieve the conditions to trigger the outburst, they should eject less massive envelopes. Now we are in the position to assess – at least as order of magnitude – the contribute of a nova system to the chemical enrichment of the host galaxy. We derive that about are processed through the nova ejecta over 100 years which is the characteristic time scale for Supernova explosions in the Milky Way. This figure has to be compared with ejected by a typical core-collapse SN. It follows that only nuclei enriched, in the nova ejecta, by a factor can contribute significantly to the galactic nucleosynthesis. In old and passive stellar systems like the elliptical galaxies where the formation of new stars has ceased long ago and therefore the rate of core-collapse is practically zero, the contribute of novae may be more significant. In this systems only SNe-Ia occur and these SN explosions are the result of the disruption of a CO WDs that release about into the interstellar gas of the parent galaxy every 100 years or so.
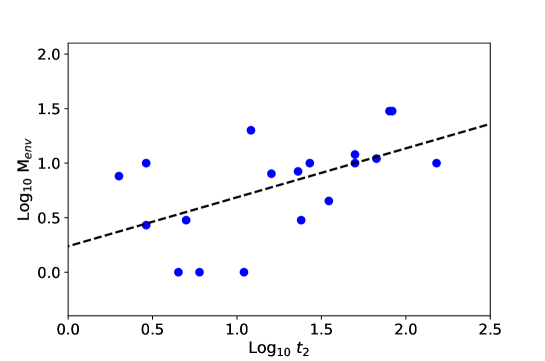
10.2 The abundances in the nova ejecta
Recognition of unusual chemical abundances in the nova ejecta dates back many years (Payne-Gaposchkin, 1957; Williams, 1977; Gallagher and Starrfield, 1978). This topic has been reviewed several times (Livio and Truran, 1994; Gehrz et al, 1998; José and Hernanz, 1998) and more recently by José (2012) and (Hernanz, 2015). One point stands clearly: all novae, for which reasonable data are available (even admittedly characterized by large uncertainties), appear to be enriched in either He or/and heavy elements. This result is not unexpected because TNR proceed in the accreted H-rich envelope by means of the CNO burning chain. Fig. 51 illustrates the average trend of the heavy elements abundance in the nova ejecta as a function of the rate of decline. Two facts emerges: 1) the available data suggest that the enrichment into the nova envelopes is normally below the time threshold 2) the heavy elements abundance in the ejecta do not seem to correlate with the speed class of the novae.
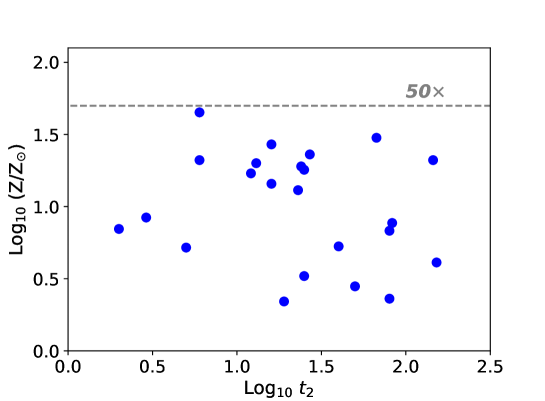
10.3 Novae as lithium factories
During the TNR phase preceding the nova outburst, the synthesis of light chemical elements, and some of their isotopes, takes place. As soon as the the matter piles up onto the WD and the degeneracy pressure is reached at the bottom of the accreted layer the thermonuclear reactions (TNRs) start. The first reaction to be ignited is the proton-proton chain. As the temperature increases, convective motions bring unburned elements from the interior of the WD into the burning region, allowing the ignition of the CNO cycle. This nuclear reaction increases the production of -unstable isotopes like 13N, 15O and 18F, that will finally lead to the outburst and matter ejection (Sparks et al, 1977; Starrfield et al, 2009). During these processes, helium can also produce 7Be, via the 3He – 4He reaction channel, an isotope which decays into the stable 7Li after a half-life time decay of 53 days (Cameron and Fowler, 1971).
Abundance studies of some of the best observed novae led to the evidence that CNO elements are very abundant in nova ejecta (Gehrz et al, 1998), in particular of the order of ten times the Solar value for the nitrogen, oxygen, neon and magnesium (Vanlandingham et al, 1996; Schwarz, 2002). On the other hand, we had little information about the lithium production. In classical novae, convective motions can transport a large quantity of freshly-produced 7Be in its most external regions. In these external layers, lithium can survive and then ejected once the nova outburst is triggered by the TNR. An immediate consequence is that CNe may represent one of the most efficient astrophysical sources of lithium (Starrfield et al, 1978). However, long-term spectroscopic observations of CNe in outburst have never revealed the presence of Li in the nova ejecta (Friedjung, 1979).
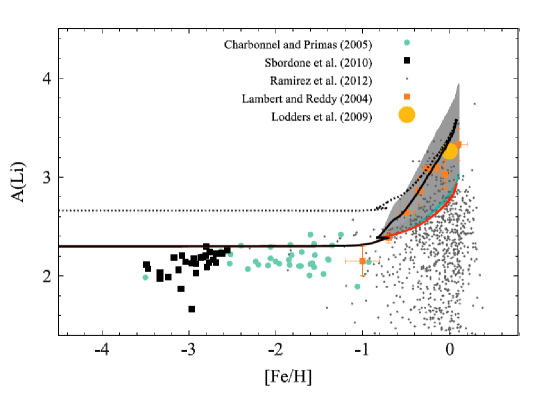
Lithium is one of the most fragile element in the Universe, given its low binding energy per nucleon (Conti, 1968). Consequently, lithium is easily destroyed in many astrophysical environments, mainly via proton collision, at a temperature of K. Lithium is also the only stable “metal” formed during the Big Bang Nucleosynthesis, given the absence of a stable element with atomic number (the only possible one, 8Be, has a very short life, s). Within the standard BBN theory, it is possible to predict the primordial lithium abundance from the estimate of the baryon-to-photon ratio parameter (Dunkley et al, 2009; Fields, 2011; Coc et al, 2013), which shows a discrepancy with the lithium abundance inferred from old stars observed in the Galactic halo, the so-called “cosmological lithium problem” (Spite and Spite, 1982; Sbordone et al, 2010). Similarly, the lithium abundance inferred from younger Galactic stellar populations is much higher than the abundance estimated from the BBN (Spite and Spite, 1982; Spite, 1990), then suggesting the presence of unknown lithium factories in the Galaxy, this is the so-called: “Galactic Lithium problem” (D’Antona and Matteucci, 1991; Matteucci et al, 1995). In recent years, different astrophysical sources have been proposed for the lithium nucleosynthesis such as: the cosmic-ray spallation (Reeves et al, 1990), the hot bottom burning in low-mass red giant branch (RGB) stars (Sackmann and Boothroyd, 1999), intermediate asymptotic giant branch (AGB) stars (Sackmann and Boothroyd, 1992; Travaglio et al, 2001), carbon stars (Abia et al, 2001) but it turned out that they were unable to produce the full amount of lithium observed in the Milky MilKy (Romano et al, 2001).
10.4 “The Hunt for Red Lithium”
The idea that novae could be efficient lithium producers has been predicted long ago (Arnould and Norgaard, 1975; Starrfield et al, 1978) but it has never been confirmed (e.g., Friedjung 1979; Della Valle et al 2002). The typical signature of lithium in the spectra of CNe is the resonance transition of its neutral state, which is a very tight absorption doublet centered at 7Li I 6707.8 Å. Although Friedjung (1979) did not detect any absorption line corresponding to 7Li I, he was able to put upper limits on the lithium abundance in nova ejecta. Lithium was extensively and unsuccessfully searched in the following years. A possible evidence for the presence of a transient 7Li emission line was made for the case of Nova Vel 1999 (Della Valle et al, 2002), but further analysis using UV spectral data from Hubble Space Telescope showed its origin as due to neutral nitrogen (Shore et al, 2003).
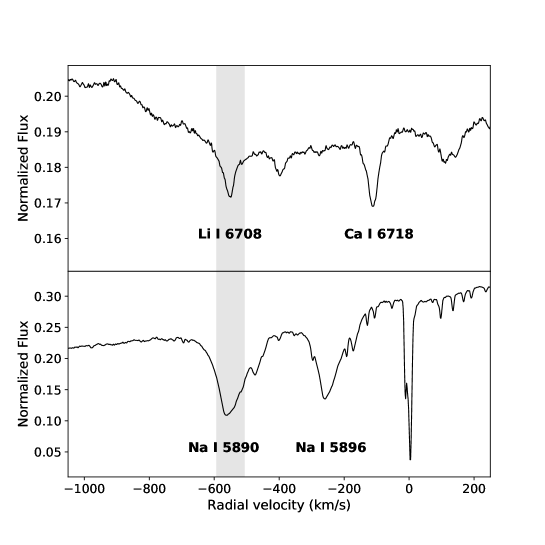
The presence of Lithium in CNe remained a mistery until 2013. Two very bright novae were discovered and then observed with high-resolution spectrographs by two distinct groups: V339 Del and V1369 Cen. The presence of blue-shifted absorption lines due to 7Be II was reported in the late (more than 50 days from the outburst) spectra of V339 Del (Tajitsu et al, 2015), while early spectra of V1369 Cen revealed the presence of an absorption feature that was confirmed to be due to the resonance transition of neutral Lithium at the expanding velocity of km/s (Izzo et al, 2015). For this latter case, by using an approach similar to the one used by Friedjung (1979), the total mass of lithium ejected was computed to be . After assuming this amount of lithium as ejected by all slow novae in the Galaxy, and using accurate numerical codes developed to compute the chemical evolution of the Galaxy (Romano et al, 2001), it was proved that novae can explain the observed over-abundance of lithium observed in young stellar populations (Spite and Spite, 1982; Fields et al, 2014; Izzo et al, 2015). The detection of Li I in the early spectra of V1369 Cen does not represent the unique case so far. In 2015 an other bright slow nova was discovered in the direction of the Sagittarius constellation, V5668 Sgr and similarly to V1369 Cen, early spectra showed the presence of a faint absorption line that corresponds to the Li I 6708 transition blue-shifted at a velocity of km/s (Wagner et al, 2018). The same velocity is displayed by other typical transition observed in novae spectra as Na I D2 5890 and Fe II 5169. This nova also showed the presence of blue-shifted absorptions related to the resonance doublet of 7Be II 3130/31 (Molaro et al, 2016). By following a similar approach Molaro et al (2016) have estimated the ejected mass of 7Be to be . In passing, we note that Prantzos (2012) in a detailed review on possible lithium factories in the Galaxy, explicitly mentioned that:
“if novae provide 50–65% of solar lithium, they ought to have a Li yield of .”
A prediction in excellent agreement with the result derived from observations. After assuming a typical nova life-time of 1010 yrs, Molaro et al (2016) suggest that a dozen of novae/yr like V5668 Sgr can produce the total amount of 7Li observed in the Galaxy.
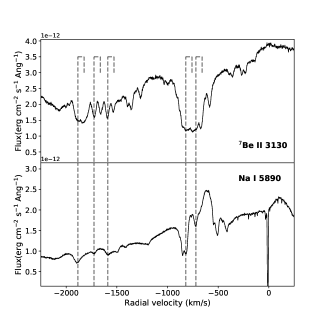
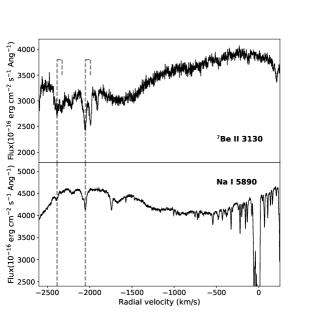
11 Novae as Supernova-Ia progenitors
SNe-Ia are commonly referred as standard candles even if it would be more appropriate to describe these objects as “standardizable” candles because their high luminosity at maximum correlates with their rate of decline. Differently from CNe the intrinsically brighter SNe-Ia are characterized by the slowest rates of decline (Phillips, 1993). The process of standardization works well on empirical basis (Perlmutter et al, 1998; Riess et al, 1998; Schmidt et al, 1998) but still it is far from being completely understood (Mazzali et al, 2001; Wygoda et al, 2019) and the uncertain nature of the binary systems does not help to clarify this issue. SNe-Ia basics that can be directly derived from observations can be summarized as the following:
-
•
SNe-Ia occur in early and late Hubble types;
-
•
Occurrence in early type galaxies with SFR less or much less than a few implies that SNe-Ia are not caused by the collapse of the core of stars with ;
-
•
The lack of H and He in the ejecta points in the direction of highly evolved progenitors;
-
•
The energy for unit of mass, i.e., is similar to the one obtained from the conversion of C (7.7 Mev b.e. per nucleon) into Fe (8.8 Mev b.e. per nucleon).
On the basis of these arguments, the common wisdom strongly suggest that SNe-Ia are the thermonuclear disruption of mass-accreting WDs in binary systems. Historically two scenarios are commonly accepted for producing SNe-Ia: the so called double degenerate (Webbink, 1984; Iben and Tutukov, 1984; Tornambe and Matteucci, 1986) where two CO WDs in a binary systems make coalescence as result of the lost of orbital energy for GWs and the single degenerate (Whelan and Iben, 1973; Nomoto, 1982a) in which a WD accretes material from a MS star (see Maoz et al 2014; Livio and Mazzali 2018 for an update review on this topic). In the latter framework a SN-Ia can be produced by the explosions of WDs in recurrent- or symbiotic- nova systems, when the respective WDs approach the Chandrasekhar limit after having accreted material from the companion stars. Because these Cataclysmic Systems typically contain massive WDs characterized by a high accretion rates, they are regarded as possible SN-Ia progenitors. Recently Starrfield et al (2019) have found on the basis of 1-D hydrodinamical simulations that all C-O WDs in the range of masses –, which accrete material from companions within a narrow interval of /yr would grow in mass up to 80% of the accreted mass after each nova cycle. These authors conclude that novae can be an important channel for type Ia progenitors. These results are still preliminary and they should be taken with some degree of caution. We note for example that even if WDs are growing in mass because the ejected/accreted mass is smaller than 1, the Chandra mass might not be reached. This possibility depends among other things on the mass of the secondary and on the efficiency of the accretion onto the WD that is often defined as . Kato and Hachisu (1989) computed for different sizes of the Roche lobes and they never found, even under the most favorable conditions (high value of ), a value larger than 0.3–0.4. For example a WD which accretes material at yr-1 and it is characterized by requires a secondary star with a mass much larger than that of the primary, to reach the Chandrasekhar limit of the order of . The CV configuration where is might be not characterized by stable mass transfer (Warner, 2003).
Symbiotics as progenitors of SNe-Ia had some popularity in the 1990s thanks to (Munari and Renzini, 1992), which showed that the density of progenitors of Symbiotic novae was vastly consistent with the rate of SN-Ia explosions. A few years later this scenario was questioned by radio observations of SN 1986G in Centaurus A (Boffi and Branch, 1995) that failed to reveal the radio synchrotron emission (Chevalier, 1988) that should have been produced during the interaction between the SN blast wave and the circumburst material. The impact of this negative result was partially soften by the fact that SN 1986G was somehow peculiar object and therefore it was not representative of the main bulk of SNe-Ia. The result from radio observations of 27 SNe-Ia obtained with the Very Large Array two decades later by Panagia et al (2006) was much more sharp. There was not a single positive detection and the lack of radio signal implied the existence of a very low circumburst density. Thus Panagia et al (2006) were able to to set an upper limit of on the mass loss rate of the secondary star, which is 1–2 orders of magnitudes smaller than the expected from red giant donor. This upper limit was further constraint up to by Chomiuk et al (2016).
The most direct pieces of observation, to date, which might rule out Symbiotics to form the main bulk of SN-Ia progenitors are the deep pre-explosion images, obtained with HST, of the site of the “standard” SN-Ia 2011fe. Li et al (2011) did not find a suitable candidate progenitor at the SN location and by taking advantage of the proximity of the M101 host galaxy, they could set a firm upper limit on the magnitude of the progenitor system. They could conclude that the progenitor was: “ times fainter than previous limits on other SN-Ia progenitors. This directly rules out luminous red giants and the vast majority of helium stars as the mass donating companion. These observations favour a scenario where the exploding WD of SN 2011fe accretes matter either from another WD, or by Roche-lobe overflow from a subgiant or main-sequence companion star”.
Finally, we point out the vain search for a surviving companion in the SN-Ia remnant SNR 0509-67.5 by Pagnotta et al (2014). These authors could concluded that: “This lack of any ex-companion star to deep limits ( mag) rules out all published single-degenerate models for this supernova. The only remaining possibility is that the progenitor of this particular type Ia supernova was a double-degenerate system.”
Then the question becomes whether or not some room is left for the existence of the single degenerate scenario or is it completely ruled out?
Probably the most convincing piece of evidence that a single degenerate system can explode as SN-Ia is given by the detection of circumburst material around SN-Ia 2006X (Patat et al, 2007b). The analysis of the evolution in the spectroscopic features of NaI-D doublet induced by the change of the ionization conditions of the SN radiation field have proven that this material was located at distances from the SN of about cm and it was expelled by the Supernova progenitor about 50 yr before the explosion. The existence and the fast spectroscopic evolution of this circumburst material is reminiscent of the THEA absorptions observed by Williams et al (2008), around novae shortly after the maximum light. According to Patat et al (2007b) these erratic or recurrent in time emission episodes rule out a double degenerate scenario progenitor for SN 2006X. In passing we also note that a similar study carried out by (almost) the same team (Patat et al, 2007a) on SN-Ia 2000cx was not able to detect a behavior similar to that exhibited by SN 2006X. Taking at their face values these results may suggest that both scenarios are at play. If this fact is true a second question arises: what is the nature of the single degenerate systems? According to general believe some of these systems might be Recurrent Novae (e.g. Kato and Hachisu 2012), such as for example T Pyx (Godon et al, 2014), but see also Selvelli et al (2008) for a different view. Out of about 400 nova outbursts in the Galaxy, Fig. 5, only ten of them has been identified as RNe. The rigorous correction of these numbers for incompleteness is very questionable procedure because many assumptions are involved. However, we can apply at first order approximation the following argument. From Sect. 3.5 we assume a galactic nova rate of 25 novae/yr, therefore in the last 156 years (from U Sco in 1863) in the Galaxy have occurred about 4000 nova explosions. It means that, on average, the probability to detect in this period of time a nova outburst was about 10%. Since to identify a Recurrent Nova we need to observe at least two outbursts from the same system, the probability to have observed a RN is at first order only . Since we have observed in the MW about a dozen of RNe, their actual number has to be 10 times as larger. This simple order of magnitude calculation would indicate a “true” ratio RNe/CNe of for our Galaxy cf. (Pagnotta et al, 2014). We note that Della Valle and Livio (1996) have estimated for M31 and LMC a fraction RNe/CNe of 10% and 30% respectively and they concluded that “RN-type systems can account for at most a few percent of the SN-Ia rate”. Shafter et al (2015) consistently estimated that “ as many as one in three nova eruptions observed in M31 arise from progenitor systems having recurrence times …” and they concluded that it is very unlikely that RNe could play a major role as SNe-Ia progenitors in a galaxy like M31.
These last results about the contribute of RNe to the SNe-Ia rates seem to relegate the SD to a completely secondary role with respect to double degenerate. However, this story does not seem to be over yet. Della Valle and Livio (1994) and Mannucci et al (2005) have found that the SNe-Ia rates, per unit of luminosity of the respective host galaxies, are a full order of magnitude higher in late type/blue galaxies than observed in E-S0/red galaxies. This result can be explained by assuming that a significant fraction of Ia events in late spirals/irregulars originates in a relatively young stellar component characterized by evolutionary times shorter than Myr (Mannucci et al, 2006), while the SNe-Ia in passive elliptical galaxies have a time evolution which is described by a much wider distribution, well characterized by an exponential function with a decay time of about 3 Gyr. Recently (Iłkiewicz et al, 2019) have studied a subset of Symbiotic binaries, which contain a Mira donor that is characterized by orbital periods of dozens of years. Obviously these symbiotic stars are not normally considered suitable SN-Ia progenitors because of their large separation (however see Hachisu et al 1999 for a discussion of the symbiotic scenario). This team has analysed the evolution of V407 Cyg and they find that there is 90% probability that this system can explode as SN-Ia and this probability increases to 97% for WD with , which incidentally coincides with the value of the mass suggested by Hachisu and Kato (2012). Iłkiewicz et al (2019) predict that the white dwarf in V407 Cyg will reach the Chandrasekhar limit in 40–200 Myr and eventually will explode as SN-Ia. This evolutionary time is consistent with the “prompt” SN-Ia population identified by Mannucci et al (2006) (see also Greggio 2010). Very recently Darnley et al (2006, 2019) have provided convincing evidence that the progenitor of the yearly erupting RN M31N 2008-12a is a single degenerate system with a red giant donor (see also Williams 2016). Kato et al (2015) have determined that the central WD is of CO type and that its mass is . Moreover, the WD is quickly growing in mass, by ejecting only 40% of the matter accreted during each nova outburst cycle (which corresponds to ). Therefore, it should pass the Chandrasekhar limit in about 100,000 years and it might terminate its life with a SN-Ia eruption.
12 Multi-wavelength novae
The possibility to investigate nova outbursts in other frequencies than the optical and near-infrared electromagnetic range has become a standard procedure in the last decade, thanks to a new-generation of instruments and detectors operating at radio, infrared (IR) and high-energies as X- and -rays. These observations have revealed that novae undergo a complex evolution characterized by several emission phases and a non-spherical geometry for the nova ejecta. In the following we briefly review some of the most interesting results obtained in recent years.
12.1 Novae in the infrared
Abundances from novae can also be inferred from IR observations, in particular for Ne, Mg and Al (Gehrz et al, 2008, 2015). IR observations have also demonstrated that CNe, particularly of the CO class, are dust grain factories (Geisel et al, 1970; Hyland and Neugebauer, 1970; Clayton, 1979; Gehrz et al, 1980a, b; Gehrz, 1990; Gehrz et al, 1995a; Mason et al, 1996, 1998; Woodward and Starrfield, 2011; Chesneau et al, 2012). In these objects the free-free emission that dominates the optical peak is often followed by a dust-dominated phase, while in ONe novae an Orion phase immediately follows the Principal stage (Gehrz et al, 1995b; Woodward et al, 1995, 1997). NIR observations of novae have also provided convincing evidence for bi-polar ejection of nova shells (Chesneau et al, 2007, 2011, 2012). For example NIR-interferometric observations of V339 Del (Schaefer et al, 2014) obtained during the earliest phases have detected from the second day an aspherical distribution of the light that can be explained by assuming prolate or bipolar expanding structures. We address the reader to the papers by Chesneau and Banerjee (2012) and by Gehrz et al (2008) for a deep insight into IR emission from novae.
12.2 X-ray novae
Classical Novae have been detected in X-rays since the first observations by the ROSAT satellite in the 1980s (Krautter et al, 1996; Orio et al, 2001). During the bright outburst phases, X-ray radiation is emitted as a consequence of three physical processe: 1) a thermal emission from the underlying WD, which has been observed in several novae (Krautter et al, 1996; Mukai and Ishida, 2001; Balman and Krautter, 2001; Schwarz et al, 2011; Page et al, 2015; Osborne, 2015) when the nova ejecta starts to become optically thin, what is called also as supersoft X-ray source phase (SSSs); 2) a hard X-ray component, originated in the shocks between the ejecta with material surrounding the WD progenitor, such as previously ejected shells or a dense interstellar medium (Mukai and Ishida, 2001; Metzger et al, 2015) 3) emission from the re-established accretion during the quiescent phase (Takei et al, 2011). ROSAT observed the supersoft emission in a few objects, among them V1974 Cyg one of the most extensively studied Galactic novae by ROSAT (Balman et al, 1998). The breakthrough in this field occurred with the commissioning of the Neil Gehrels Swift satellite (Gehrels et al, 2004). Thanks to its capability to re-point a target within minutes/hours, this satellite is particularly suitable for observations of targets of opportunity such as nova stars. For example, one of the most consistently investigated cases was the 2006 outburst of the recurrent nova RS Oph (Osborne et al, 2011). Today we have observed X-rays emission from the very earliest phases through the whole visibility stage for about half of the 80 novae observed in X-rays (Ness et al, 2007; Osborne, 2015), including some objects that have occurred in M31 and M33 and MCs (Aydi et al, 2018).
The results of a systematic survey on novae in the Milky Way and M31 with Swift has provided a number of important results: i) there exists an early phase characterised by hard X-ray emission due to the presence of shocks within the different components of nova ejecta (Chomiuk et al, 2014b) and with pre-existent circum-burst medium; ii) the onset of the supersoft phase begins soon in novae characterised by small values, which are suggestive of low mass ejecta (Henze et al, 2014); iii) the duration of the supersoft phase is an indicator of the WD mass: the higher is the mass the shorter is the supersoft phase (Hachisu and Kato, 2006, 2010); iv) the temperature of the thermal component observed during the supersoft phase, modeled with a simple blackbody function, is directly related to the mass of the underlying WD; v) X-ray photons rising from the supersoft phase can destroy the dust produced at later phases (Gehrz et al, 2018), but see also Shore et al (2018); vi) some novae show a modulation in X-rays, whose characteristic period varies from few dozens of seconds like RS Oph, KT Eri and V5668 Sgr (Osborne et al, 2011; Ness et al, 2015) up to few days like Nova LMC 2009A. We address the reader to the paper on Swift nova observations by Osborne (2015).
In the last years, 13 novae belonging to the Milky Way (Orio et al, 2005; Mukai et al, 2008), M31 (Orio, 2006; Orio et al, 2010; Henze et al, 2010, 2011, 2012, 2014) and SMC (Orio et al, 2018) have been monitored with XMM-Newton and Chandra. The main goal was the study of supersoft X-ray sources at high-resolution, aimed at both determining the duration of their SSS phase and the physical parameters of the observed atmosphere, including abundance studies (Ness et al, 2009; Pinto et al, 2012). Some theoretical implications have been discussed by Hernanz and Sala (2010). During these surveys was possible to discover several RNe (Henze et al, 2018) and remarkably enough some very rare events such as a nova in outburst in a globular cluster of M31 (Henze et al, 2013).
12.3 Gamma-ray novae
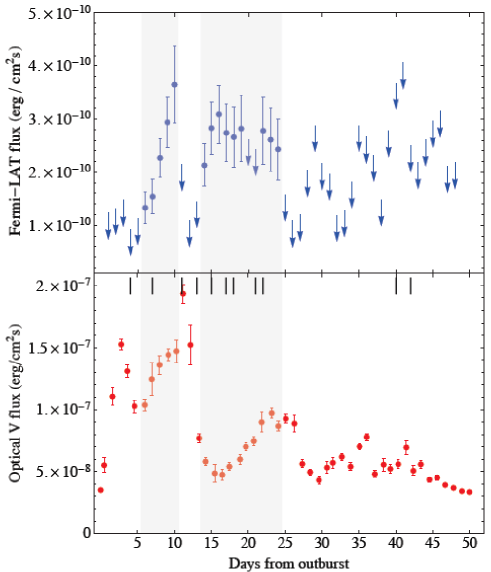
In 2014, Classical Novae, were definitely revealed as a new class of gamma-ray sources (Ackermann et al, 2014), although the first nova-like observed in gamma-rays was the symbiotic nova V407 Cyg (Abdo et al, 2010). To date about a dozen of novae and symbiotic systems have been detected in gamma-rays at energy larger than 100 MeV, but below few GeV. The physical origin of this emission is not yet clear, but it is likely related to strong shocks driven by both the dense nova ejecta when colliding with the tenuous interstellar medium or the wind from the secondary (Martin and Dubus, 2013). As an alternative the internal shocks are produced by the interaction of a fast wind radiatively driven by the nuclear burnings on the white dwarf (Martin et al, 2018) with inhomogeneities formed into the expanding shells of the nova ejecta (see the case of V1369 Cen Mason et al 2018). However, we cannot exclude that a combination of these two mechanisms is at play. Although these inhomogeneities are often observed as knots in some historical novae, such as T Pyx (Shara et al, 2015), only of the objects optically discovered show gamma emission. This rises the question whether or not gamma-ray novae are intrinsically rare among galactic novae or this small percentage results from a distance bias (Morris et al, 2017; Franckowiak et al, 2018), which prevents the discovery of high energy emission in most CNe because of their distances.
The high-energy radiation observed in novae does not generally show a direct link with the optical emission (Franckowiak et al, 2018) with the exception of bright LAT novae such as: ASAS-SN 16ma (Li et al, 2017), TCP J1734475-240942 (Munari et al, 2017), V906 Car (Aydi et al, 2020) and V1369 Cen (see Fig. 55) where a correlation between the observed optical light curve and the -ray flux was observed, then implying that a considerable fraction of the optical radiation comes from the re-processing of the gamma-ray radiation at longer wavelengths. This evidence also suggests that the optical radiation observed in the nova phenomenon is not only originating from the thermal energy released in the TNR (Metzger et al, 2015), but it is partly due to the re-processing of high-energy radiation coming from acceleration of particles likely originating by magnetic field amplification in the shocks (Li et al, 2017) or radiation processes in leptonic and/or hadronic scenarios (Vurm and Metzger, 2018).
After connecting the nova high-energy radiation with the multiple absorption of the principal spectra (see Sect. 4), the modelling of nearby nova remnants (Slavin et al, 1995; Bode, 2002; Moraes and Diaz, 2009; Ribeiro et al, 2009, 2013b, 2013a), IR interferometry (Chesneau and Banerjee, 2012; Schaefer et al, 2014), and the delayed emission from radio observations (see next subsection) a more clear scenario of nova phenomenon emerges. In this framework immediately after the ignition of the TNR, a first component with an oblated/prolate matter geometry distribution expands with velocities of few hundreds of km/s. At later times, a faster (1000–5000 km/s) wind, is emitted from the poles of the central WD, with relatively high opening angles, and then it catches up with the dense earlier component. The interaction between these two ejecta can lead to particle acceleration that give origin to the observed gamma-ray radiation. The structure of the remnant will show years after the outburst the consequences of this interaction. For example, it was observed in FH Ser 1970 an ellipsoid structure characterized by denser ring-like component along the minor axis (Della Valle et al, 1997; Gill and O’Brien, 2000).
Novae are also factories of isotopes, like 7Be and 22Na, which decay via electron capture or through the -process emitting very high-energy photons at specific energies (see Hernanz 2012 for a review). For example, 7Be decays into 7Li emitting a photon with an energy of 478 keV. The recent discovery of a consistent amount of beryllium produced in novae implies that we should be able to detect this line with space-based detectors like INTEGRAL. However, a detection of this emission line is still missing, likely due to the large distance of the novae for which beryllium and/or lithium have been observed (see, e.g., Siegert et al, 2018). The detection of this 478 keV line would represent the conclusive confirmation that novae are one of the main factories of lithium in the Milky Way.
12.4 Novae at radio frequencies
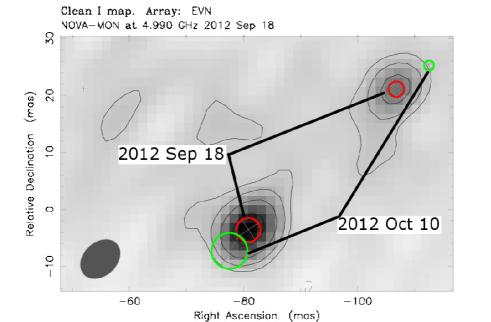
One of the most efficient methods to measure the mass ejected in novae consists in the analysis of radio emission emitted by the thermal bremsstrahlung free-free emission, in particular for the case of an impulsive ballistic shell ejection (see, e.g., Seaquist and Palimaka, 1977, and Seaquist & Bode in Bode and Evans 2008). Novae have been observed in radio since the 1970s, with FH Ser being one of the first studied case (Hjellming and Wade, 1970; Wade and Hjellming, 1971), where Hjellming et al (1979) succeeded in reproducing the phenomenology observed in radio with a spherical shell linear gradient model characterised by only three variable parameters. Other novae, like HR Del and V1500 Cyg can be very well explained by this ionized shell model (Ennis et al, 1977). Spatially-resolved radio observations have also allowed to resolve the ejecta which are characterised by a non-spherical emission and in several cases by a bi-polar geometry and lobes (Taylor et al, 1988; Hjellming, 1995). The first nova that was resolved in radio was V1974 Cyg (Eyres et al, 1996), which showed the presence of an evolving remnant only 80 days after the outburst. At these epochs, radio images already showed deviation from spherical symmetry. These observations have contributed to improve the theoretical models that were used to reproduce the observed shape of the nova remnants (Lloyd et al, 1996).
Recent observations show a more complex structure. While a non-spherical geometry characterized by bi-polar ejecta, is observed in almost all cases (Rupen et al 2008; Sokoloski et al 2008; Chomiuk et al 2014a, see also Fig. 56) with some exceptions like v351 Pup (Wendeln et al, 2017), additional pieces of this jigsaw have been discovered. First, the presence of a non-thermal emission in few novae like RS Oph (Rupen et al, 2008) V1723 Aql (Weston et al, 2016b) and v5589 Sgr (Weston et al, 2016a) and in the gamma-ray nova V1324 Sco (Finzell et al, 2018). These observations were explained as synchrotron radiation rising from shocks originating in the interaction between a faster wind with a oblated/toroidal slower components (Vlasov et al 2016). Another interesting result consists in the presence of a delayed (with respect to the initial optical outburst) event of mass ejection observed in the recurrent nova T Pyx (Chomiuk et al, 2014b), characterised by an amount of mass larger than expected from recurrent novae (Nelson et al, 2014). This result may suggest that the impulsive ejection model of novae needs some adjustments. On the other side it confirms that radio observations are more efficient in measuring the masses of the nova ejecta than optical observations (e.g., the case of v458 Vul, Roy et al 2012b). We address the reader to Roy et al (2012a) for a paper which summarize the radio studies on novae. The future for radio studies on nova stars is very promising in view of the new facilities that will be come operational in the next decades such as: SKA (O’Brien et al, 2015) or the next generation Very LArge Array (ngVLA Linford et al, 2018).
13 Conclusions
The new distances to galactic novae provided by GAIA DR2 have allowed us to re-analyze the numerous collections of data for novae in our Galaxy and in external systems. From our analysis the following results emerge:
1) The analysis of the nova counts, their heights above the galactic plane and rates of decline of novae inside the Milky Way has allowed to derive, on more robust empirical basis, the notion of disk and bulge nova populations. Fig. 14 shows strong evidence () for the existence of a correlation between the rate of decline and the height above the galactic plane. This trend indicates that the fastest nova systems, which contain the most massive WDs, are concentrated close to the galactic plane. We then derive that the typical disk nova is a fast evolving object whose lightcurve exhibits a bright peak at maximum M ( or ) a smooth early decline and preferentially belongs to the He/N (or Fe II broad) spectroscopic class. The progenitor is preferentially located at small heights above the galactic plane (pc) and the associated WD is rather massive, . The typical bulge nova is a slow evolving object whose lightcurve exhibits a fainter peak at maximum, M mag ( or ), often multiple maxima, dust formation, maximum standstill and belongs to the Fe II spectroscopic class. The progenitors extend up to 500 pc and beyond from the galactic plane and are likely related to a Pop II stellar population of the galactic thick-disk/bulge. Therefore they are associated (on average) with less massive WDs, . The characteristic recurrence times between outbursts for nova systems formed by massive WDs are years and their duty cycle lasts a few years. For nova systems formed by light WDs years and their lifetime activity lasts years.
2) Analysis of the MMRD relationship for LMC, M31 and Virgo novae confirm the existence of systematic differences in the distributions of the rates of decline of the respective nova populations. At least 70% of novae in the LMC are bright and fast and therefore associated with massive WDs while fast novae in M31 are %. The two distributions are significantly different (K-S gives 99%). The analysis of the spatial distributions suggests that nova populations in M31 and M81 are a mixture of disk and bulge novae, 30%–70% and 40%–60% respectively. Novae in the LMC and M33 originate from disk population whereas novae in M87 and NGC 1316 are obviously related to an old stellar population.
3) Analysis of the distributions of the rates of decline as a function of the absolute magnitude at maximum of LMC, M31 and Virgo, reveals the existence of a scant group of deviating objects. This sub-sample includes super-bright novae which extra energy input might be due to dissipation of orbital energy motion of the secondary engulfed in the nova ejecta during the nova common envelope stage. Also there are objects which fall below the strip. They can well be RNe that eject very light envelopes (–), hundreds or thousands times lighter than envelopes associated with CNe or patchy absorbed novae. Outliers of the M31 MMRD found by Kasliwal et al (2011) might well be classified into the previous classes of deviating objects without calling for the existence of a sub-class of faint and fast CNe that at the moment appear only predicted. Cao et al (2012) observations of novae in M31 are fully consistent with the MMRD relation. If we consider novae observed in the nearest galaxies, such as M31 and LMC, we have a total number of 144 data points (see Tables 13, 14, 15, 16), 12 of which (8%) are obvious outliers of the MMRD at level (see Fig. 45 and Fig 47). Finally we note that some outliers could be due to the observations of intracluster or intragalaxies novae. Recently Darnley et al (2020) have convincingly demonstrated the existence of two novae belonging to the Andromeda giant stellar flow. These novae certainly belong to the M31 “ environment ” but they could possibly be located at slightly different distance from that which characterizes the main bulk of the M31 novae.
4) Comparison between the distances obtained for galactic novae with the MMRD relation and GAIA DR2 agree to better (or much better) than 30% then confirming that the MMRD relation can be used to estimate the distance to novae in the Milky Way with an interesting accuracy, contrary to recent claims. Most of the error (still) associated to distance measurements obtained via MMRD comes from the uncertainty in estimating: i) the absorption AV toward each nova; ii) the correct computation of the MMRD parameters, such as the observed magnitude at maximum and the rate of decline; iii) misuse of the MMRD to intrinsically faint objects such as RNe.
5) GAIA DR2 distances have allowed a new absolute calibration of the MMRD relation. The comparison between the absolute and observed MMRD relations of M31, LMC and Virgo finds: mag, mag, and mag, which are in excellent agreement with the current distance measurements for Local Group and Virgo galaxies, respectively. Obviously, given the intrinsic dispersion of the MMRD it appears hard to measure the distances to extragalactic systems to better than 10% which make novae not longer competitive distance indicators in the era of “1-2% high precision” cosmology (Pietrzyński et al, 2019; Riess et al, 2019). This situation could improve in the next years if both the sample of “calibrators” (that is the number of novae inside the Milky Way with GAIA DR2 distance and characterized by good measurement of AV) and the samples of novae discovered in external galaxies with reliable measurements of the MMRD parameters, will significantly increase.
6) The nova rate in the Milky Way is currently known within a factor of two: 20–40 novae/yr. Recent new measurements ranging between a bulge rate of novae/yr (Mróz et al, 2015) and a global rate 50 novae/yr (Shafter, 2017) do not help to clarify this discrepancy. On the other hand we have shown that novae in the Milky Way and M31 exhibit similar properties such as the distributions of the rates of decline and the spectroscopic classification (most MW and M31 novae belong to Fe II type). Therefore if most Galactic novae are produced in the bulge, it is unlikely that the global nova rate of the Milky Way might be significantly larger than it was measured by Mróz et al (2016). So, a rate of /yr seems an appropriate educated guess.
7) A few sporadic observations have allowed to provide an estimate of the nova rate in Globular Clusters systems. An analysis of the present data finds a rate ranging between: a few and novae .
8) While there is a substantial agreement on LMC, SMC and M33 rates, we find a factor two discrepancy for M31, – and a full factor three uncertainty for the giant elliptical galaxies in Virgo cluster /yr. A simple explanation is that old nova survey suffer of severe incompleteness. For example the rather sparse surveys carried out by Rosino in the 1970s on M31 might suffer of such observational bias. Despite the control time has been duly estimated and the correction for field incompleteness have been taken into account, a factor 2 may be still hidden in fragmented and not homogeneous material collected over 25 years. Much more difficult is to explain a factor two incompleteness in the Arp (1956) data. From his paper we can read some impressive numbers
“Nearly 1000 plates were taken on 290 nights between June 1953 and January 1955. Observations were as continuous as possible…. Consequently of 30 novae discovered for only 5 were the maxima missed by more than one day.”
This summary does not leave too much room for having missing one nova out of two, unless 50% of novae in M31 are completely extinguished by absorption. We have adopted a rate of novae/yr.
As far as concern nova observations in Virgo ellipticals the most straight explanation is that nova surveys from ground based telescopes suffer of severe incompleteness. However, this hypothesis seems not supported by Ferrarese et al (2003) survey on M49 which was carried out with HST. They found a rate of novae/yr. Another possibility discussed in this paper is that the nova rate of M87 might be enhanced by the jet. The rate of this galaxy remains uncertain, in the range 100–300 novae/yr.
The mismatch among the nova rates represents a good rationale for undertaking new dedicated surveys on novae in Local Group galaxies and beyond. Particularly, new surveys in MCs, M33 and M31 characterized by a cadence of few hours (rather than a few days) would be capable to discover the possible sub-class of ultra-fast novae predicted on theoretical grounds (e.g., Yaron et al 2005). There is no reason to look for these intrinsically faint transients in distant galaxies. The use of telescopes characterized by large fields of view will help to minimize the number of correction factors that are normally applied to the observed rates.
9) Whether or not the nova rate depends on the Hubble type of parent galaxy is a point not yet fully clarified. One result about which all authors seem to converge is that the specific nova rate (i.e., the normalized nova rate per unit of luminosity of the host) exhibited by blue low luminosity class galaxies, such as M33, LMC and SMC, is higher by a factor about 3 than observed in giant Spirals and Ellipticals. This result can be explained in terms of “selection effect” due to the different recurrence times of the nova outbursts combined with the different density of nova progenitors belonging to parent stellar populations of different ages.
10) High resolution spectroscopic observations of galactic and MCs novae have produced two interesting results. i) In 2008, Williams and collaborators have discovered the so called THEAs (Transient Heavy Element Absorptions), which are signatures of a toroidal component of material surrounding the primary WD that is observed at low velocities during the nova outburst. ii) Izzo et al (2015) have observed for the first time 7Li in the ejecta of V1369 Cen and in the same years, Tajitsu et al (2015, 2016), Molaro et al (2016) and Izzo et al (2018) have identified also the presence of 7Be, which decays in 7Li with an half-life time decay of 53 days, finally confirming 1970s predictions that novae were Lithium factories.
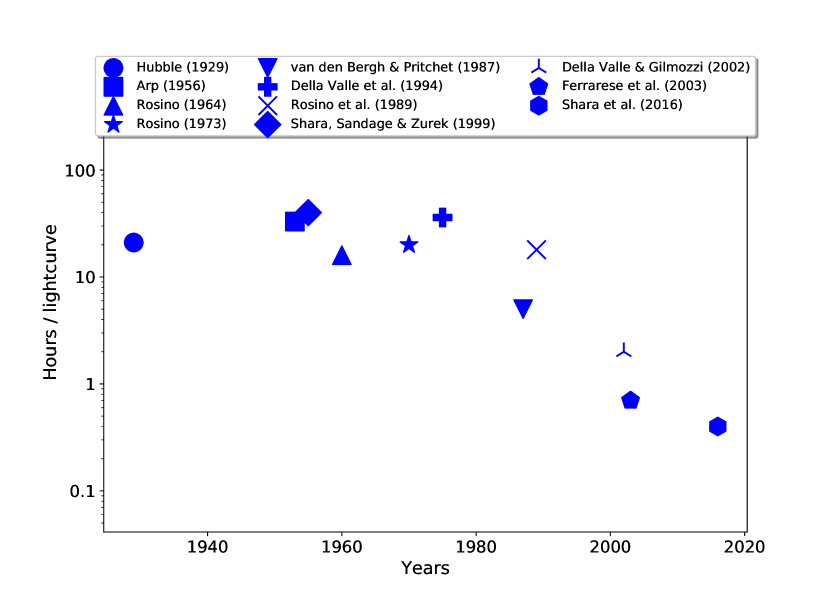
11) Novae and SNe-Ia connection. Several pieces of evidence point out that RNe and symbiotic stars should not be the major class of progenitors of Type Ia supernovae. Particularly, the radio observations of two dozen SNe-Ia with no positive detections and pre-explosion images of the SN-Ia 2011fe seem to exclude that stellar systems containing red giant donors are the main channel for SN-Ia production. Nevertheless the SD does not appear completely ruled out. Particularly, objects such as V407 Cyg and M31N 2008-12a that contain red giant donors seem to be promising candidates to explode as SNe-Ia. We tentatively conclude that the both channels are open, although DD seems to be able to provide the main contribution.
12) Nova survey in extragalactic systems, despite their scientific interest, have not been so popular among astronomers and even less among the various time allocation committees spread over the world (although some remarkable exceptions do exist). The main reason for this is the unpredictable nature of nova events, which made nova observations considerably time consuming and difficult to schedule. However, two important facts may help to boost the interest for nova studies: i) the observing time requests at 2–4-m class telescopes have decreased in the last 20 years by about a factor 5 (survey on ESO telescopes, Patat et al (2019) but see also Patat and Hussain 2013). Telescope of these sizes are suitable to study the nova properties in Local Group galaxies and therefore the general decrease for their quest can play in favor of proposal dedicated to novae; ii) large field of view telescopes, such as LSST that will be come operational in the next few years, have the potential to change dramatically the future of nova studies. Figure 57 shows the trend of the “time consuming” index, that we have computed in terms of hours at the telescope needed to make the “average” nova lightcurve in extragalactic systems vs. the respective observing epochs. Obviously, this parameter depends on many factors (e.g., distance to the galaxy, size and field of view of the telescope, seeing, photographic plates or CCDs, ground-based vs. space instrumentation, intrinsic rate of events…), however we can recognize a general trend. From the 20–40 hours typical of the surveys carried out during the photographic era on nearby galaxies, we drop to 8 hours per lightcurve with 4-meter class telescope + CCD for galaxies in Virgo cluster and to 1.5h/lightcurve with 8-meter telescope + CCDs for a survey in giant ellipticals. This index has further decreased with the use of HST to less than 1h per lightcurve. In principle the study of extragalactic novae with future large size and large fields telescope such as LSST will dramatically decrease this “index” to a few minutes/lightcurve. It will be essentially limited by overheads (e.g., slewing telescope to target, CCD readout…) and the intrinsic frequency of nova outbursts of the observed galaxies.
Acknowledgements.
The authors thank the referees for their constructive criticisms that have significantly improved the presentation and discussion of the data. We are also very grateful to Bob Williams for giving us valuable comments on the manuscript and to Roberto Gilmozzi and Tatiana Muraveva for helpful discussions about nova parallaxes. We also thank Martín Guerrero, Patrick Schmeer and Ken Croswell for further insights. MDV is deeply grateful to Prof. Leonida Rosino for having introduced him to the realm of nova physics and to Hilmar Duerbeck for the many nights shared at the La Silla telescopes. MDV thanks ESO-Garching, where this manuscript was drafted for the creative and friendly atmosphere. LI was supported by grants from VILLUM FONDEN (project number 16599 and 25501). LI also acknowledges support from funding associated with Juan de la Cierva Incorporacion fellowship IJCI-2016-30940.Appendix A Tables
| Nova | Distance | ||||||
| (kpc) | (mag) | (mag) | (days) | (days) | (deg) | (deg) | |
| V1494 Aql | 1.2390.422 | 4.1 | 17.1 | 8 | 16 | 40.97 | -4.742 |
| V705 Cas | 2.1570.799 | 5.7 | 16.4 | 33 | 67 | 113.7 | -4.096 |
| V842 Cen | 1.3790.12 | 4.9 | 15.8 | 43 | 48 | 316.6 | 2.452 |
| V476 Cyg | 0.6650.107 | 1.9 | 16.2 | 6 | 16 | 87.37 | 12.42 |
| V1974 Cyg | 1.6310.261 | 4.3 | 21.0 | 19 | 43 | 89.13 | 7.819 |
| T Pyx | 3.1850.607 | 6.4 | 18.5 | 32 | 62 | 257.2 | 9.707 |
| V732 Sgr | 1.7950.458 | 6.4 | 16.0 | 65 | 75 | 2.53 | -1.188 |
| FH Ser | 1.060.112 | 4.5 | 16.8 | 49 | 62 | 32.91 | 5.786 |
| V382 Vel | 1.80.243 | 2.8 | 16.6 | 6 | 13 | 284.2 | 5.771 |
| NQ Vul | 1.080.169 | 6.2 | 17.2 | 21 | 50 | 55.36 | 1.29 |
| PW Vul | 2.421.337 | 6.4 | 16.9 | 44 | 116 | 61.1 | 5.197 |
| V603 Aql | 0.3110.007 | -1.4 | 11.7 | 5 | 9 | 33.16 | 0.829 |
| T Aur | 0.8570.038 | 4.2 | 15.2 | 80 | 100 | 177.14 | -1.7 |
| Q Cyg | 1.320.043 | 3.0 | 14.9 | 5 | 11 | 89.93 | -7.552 |
| HR Del | 0.9320.031 | 3.8 | 12.1 | 160 | 230 | 63.43 | -13.97 |
| DN Gem | 1.3180.146 | 3.5 | 15.5 | 17 | 37 | 184.02 | 14.71 |
| DQ Her | 0.4940.006 | 1.35 | 14.3 | 67 | 94 | 73.15 | 26.44 |
| V446 Her | 1.3080.13 | 3.0 | 16.9 | 6 | 15 | 45.409 | 4.708 |
| V533 Her | 1.1650.044 | 3.0 | 14.5 | 25 | 44 | 69.19 | 24.273 |
| CP Lac | 1.1290.054 | 2.1 | 15.5 | 5 | 10 | 102.14 | -0.837 |
| DI Lac | 1.5690.051 | 4.6 | 14.7 | 20 | 40 | 103.107 | -4.855 |
| DK Lac | 2.2960.391 | 5.7 | 16.8 | 40 | 60 | 105.237 | -5.352 |
| HR Lyr | 4.4930.684 | 6.5 | 15.5 | 45 | 80 | 59.584 | 12.47 |
| GI Mon | 2.8490.46 | 5.4 | 15.8 | 20 | 30 | 222.93 | 4.749 |
| V841 Oph | 0.8050.018 | 4.2 | 13.5 | 54 | 130 | 7.621 | 17.779 |
| GK Per | 0.4370.008 | 0.2 | 13.4 | 6 | 13 | 150.956 | -10.104 |
| RR Pic | 0.5040.008 | 2.0 | 12.0 | 125 | 250 | 272.355 | -25.672 |
| CP Pup | 0.7950.013 | 0.4 | 15.0 | 5 | 8 | 252.926 | -0.835 |
| V1500 Cyg | 1.2870.309 | 1.9 | 20.5 | 2 | 5 | 89.823 | -0.073 |
| Nova | ∗ | |
|---|---|---|
| (mag) | (mag) | |
| CI Aql | 2.6 | 1.0 |
| V1494 Aql | 1.9 | - |
| V705 Cas | 1.3 | 0.45 |
| V1330 Cyg | 2.1 | - |
| DN Gem | 0.5 | - |
| V446 Her | 1.1 | 0.40 |
| T Pyx | 0.8 | - |
| V732 Sgr | 2.5 | - |
| V382 Vel | 0.4 | 0.25 |
| Q Cyg | 0.81 | - |
| DI Lac | 0.81 | - |
| HR Lyr | 0.56 | - |
| GI Mon | 0.31 | - |
| V841 Oph | 1.36 | - |
| CP Pup | 0.79 | - |
| CT Ser | 0.02 | - |
| HR Del | 0.47 | - |
| NQ Vul | 2.1 | - |
| PW Vul | 1.73 | 0.57 |
| QU Vul | 1.89 | 0.55 |
| V842 Cen | 1.73 | - |
| QV Vul | 1.26 | - |
| V1974 Cyg | 1.12 | 0.30 |
| T Aur | 0.64 | - |
| GK Per | 0.95 | - |
| V603 Aql | 0.22 | - |
| V476 Cyg | 0.82 | - |
| RR Pic | 0.16 | - |
| DQ Her | 0.32 | - |
| CP Lac | 0.64 | - |
| DK Lac | 1.4 | - |
| V446 Her | 1.12 | 0.40 |
| V533 Her | 0.0 | 0.038 |
| V1229 Aql | 1.58 | - |
| FH Ser | 2.02 | - |
| Nova | FWHM | Type | Nova | FWHM | Type | ||
|---|---|---|---|---|---|---|---|
| (days) | (km/s) | (days) | (km/s) | ||||
| V356 Aql | 127 | 1140 | Fe II | V533 Her | 26 | 1600 | Fe II |
| V500 Aql | 20 | 2800 | He/N | V838 Her | 2 | 3300 | He/N |
| V603 Aql | 4 | 4000 | He/N | CP Lac | 5 | 4200 | He/N |
| V1229 Aql | 18 | 2200 | Fe II | DK Lac | 19 | 2500 | Fe II |
| V1425 Aql | 27 | 1340 | Fe II | V382 Nor | 12 | 1850 | Fe II |
| V1494 Aql | 8 | 2470 | Fe II | V2264 Oph | 18 | 2300 | Fe II |
| V1663 Aql | 16 | 1900 | Fe II | V2615 Oph | 26.5 | 800 | Fe II |
| V1974 Cyg | 23 | 2300 | Fe II | V2672 Oph | 2.3 | 8000 | He/N |
| T Aur | 80 | 1200 | Fe II | GK Per | 6 | 4000 | He/N |
| V723 Cas | 263 | 600 | Fe II | RR Pic | 80 | 1600 | Fe II |
| V842 Cen | 43 | 760 | Fe II | CP Pup | 5 | 2000 | He/N |
| V868 Cen | 18 | 2300 | Fe II | V351 Pup | 10 | 2500 | Fe II |
| V1065 Cen | 11 | 2700 | Fe II | V745 Sco | 7 | 2000 | He/N |
| V407 Cyg | 5.9 | 2300 | He/N | V1187 Sco | 10 | 3000 | Fe II |
| V476 Cyg | 7 | 2500.0 | Fe II | V1280 Sco | 21.3 | 640 | Fe II |
| V1500 Cyg | 2.4 | 5000 | He/N | V1324 Sco | 25 | 2000 | Fe II |
| V1668 Cyg | 11 | 2400 | Fe II | V496 Sct | 59 | 1200 | Fe II |
| V1819 Cyg | 95 | 2742 | Fe II | FH Ser | 42 | 2100 | Fe II |
| V2467 Cyg | 8 | 950 | Fe II | V3890 Sgr | 10 | 2500 | He/N |
| V2468 Cyg | 9 | 2300 | Fe II-b | V5558 Sgr | 281 | 1000 | Fe II-b |
| V2491 Cyg | 4 | 4860 | He/N | V382 Vel | 6 | 2400 | He/N |
| HR Del | 150 | 1700 | Fe II | LV Vul | 21 | 2700 | Fe II |
| DQ Her | 67 | 1000 | Fe II | QU Vul | 22 | 1700 | Fe II |
| V446 Her | 5 | 2400 | He/N | QV Vul | 37 | 920 | Fe II |
| Nova | Nebular distance | GAIA DR2 distance |
|---|---|---|
| CP Pup | 1.70 | 0.81 |
| CT Ser | 1.40 | 2.77 |
| HR Del | 0.76 | 0.96 |
| NQ Vul | 1.16 | 1.08 |
| PW Vul | 1.80 | 2.42 |
| QU Vul | 1.75 | 1.79 |
| V842 Cen | 1.15 | 1.38 |
| QV Vul | 2.70 | 3.62 |
| V1974 Cyg | 2.00 | 1.63 |
| T Aur | 0.96 | 0.88 |
| GK Per | 0.45 | 0.44 |
| V603 Aql | 0.33 | 0.31 |
| V476 Cyg | 1.62 | 0.66 |
| RR Pic | 0.58 | 0.51 |
| DQ Her | 0.48 | 0.50 |
| CP Lac | 1.35 | 1.17 |
| DK Lac | 3.90 | 2.52 |
| V446 Her | 1.35 | 1.36 |
| V533 Her | 1.25 | 1.20 |
| V1229 Aql | 2.10 | 2.78 |
| FH Ser | 0.95 | 1.06 |
| Nova | Nova | ||||||
|---|---|---|---|---|---|---|---|
| (days) | (mag) | (mag) | (days) | (mag) | (mag) | ||
| A01 | 2.0 | 15.73 | 0.2 | R24 | 10.0 | 16.1 | 0.3 |
| A02 | 2.0 | 15.67 | 0.2 | R27 | 28.6 | 16.9 | 0.3 |
| A03 | 5.3 | 15.9 | 0.3 | R28 | 8.0 | 14.85 | 0.1 |
| A04 | 10.0 | 18.2 | 0.1 | R29 | 6.7 | 16.0 | 0.3 |
| A05 | 11.8 | 15.9 | 0.2 | R30 | 11.8 | 16.2 | 0.1 |
| A06 | 8.7 | 16.0 | 0.1 | R32 | 4.0 | 15.75 | 0.3 |
| A07 | 13.3 | 15.9 | 0.1 | R33 | 8.0 | 16.2 | 0.2 |
| A08 | 8.7 | 16.0 | 0.2 | R34 | 16.7 | 17.0 | 0.3 |
| A09 | 11.5 | 16.0 | 0.3 | R36 | 80.0 | 16.9 | 0.3 |
| A10 | 6.9 | 16.0 | 0.2 | R37 | 18.2 | 16.8 | 0.2 |
| A12 | 11.1 | 16.1 | 0.1 | R38 | 18.2 | 16.9 | 0.1 |
| A13 | 26.0 | 17.0 | 0.1 | R41 | 100.0 | 17.9 | 0.2 |
| A14 | 12.3 | 16.2 | 0.2 | R42 | 28.6 | 16.85 | 0.2 |
| A15 | 15.9 | 16.4 | 0.2 | R43 | 9.1 | 16.3 | 0.1 |
| A16 | 12.8 | 16.7 | 0.2 | R46 | 16.0 | 16.6 | 0.2 |
| A17 | 29.0 | 17.2 | 0.2 | R48 | 11.0 | 17.8 | 0.1 |
| A18 | 34.5 | 17.5 | 0.2 | R49 | 22.2 | 16.35 | 0.3 |
| A19 | 28.6 | 17.6 | 0.1 | R52 | 16.0 | 16.35 | 0.1 |
| A20 | 33.3 | 17.2 | 0.1 | R53 | 50.0 | 16.95 | 0.1 |
| A21 | 26.7 | 17.4 | 0.1 | R55 | 29.9 | 17.0 | 0.3 |
| A22 | 29.9 | 17.6 | 0.2 | R57 | 9.1 | 14.95 | 0.1 |
| A23 | 43.5 | 17.4 | 0.2 | R58 | 16.0 | 16.5 | 0.3 |
| A24 | 33.9 | 17.8 | 0.1 | R59 | 20.0 | 17.3 | 0.3 |
| A25 | 32.8 | 17.6 | 0.1 | R60 | 15.4 | 16.4 | 0.3 |
| A26 | 46.5 | 18.0 | 0.1 | R66 | 1.5 | 16.4 | 0.2 |
| A27 | 83.3 | 17.8 | 0.3 | R67 | 15.4 | 16.2 | 0.1 |
| A28 | 105.3 | 17.8 | 0.2 | R76 | 14.3 | 16.1 | 0.2 |
| A29 | 117.6 | 18.0 | 0.1 | R77 | 9.1 | 15.9 | 0.1 |
| A30 | 117.6 | 18.1 | 0.2 | R78 | 25.0 | 16.9 | 0.3 |
| R04 | 15.4 | 16.4 | 0.2 | R80 | 58.8 | 17.4 | 0.1 |
| R05 | 3.3 | 15.6 | 0.2 | R85 | 16.7 | 15.7 | 0.1 |
| R06 | 14.3 | 16.5 | 0.1 | R86 | 33.3 | 17.3 | 0.3 |
| R07 | 5.0 | 16.2 | 0.2 | R89 | 20.0 | 16.8 | 0.3 |
| R09 | 13.3 | 16.8 | 0.3 | R95 | 6.7 | 16.2 | 0.3 |
| R12 | 40.0 | 17.6 | 0.1 | R98 | 9.5 | 16.0 | 0.3 |
| R13 | 16.7 | 16.8 | 0.3 | R100 | 10.0 | 16.0 | 0.3 |
| R14 | 25.0 | 17.3 | 0.3 | E104 | 50.0 | 18.4 | 0.3 |
| R15 | 18.2 | 16.3 | 0.3 | E105 | 15.4 | 16.9 | 0.3 |
| R16 | 12.5 | 16.25 | 0.3 | E106 | 44.4 | 17.6 | 0.3 |
| R17 | 11.8 | 16.7 | 0.3 | E109 | 10.0 | 16.3 | 0.2 |
| R18 | 22.2 | 17.1 | 0.1 | E112 | 20.0 | 17.3 | 0.2 |
| R19 | 80.0 | 17.9 | 0.2 | E113 | 5.0 | 16.0 | 0.3 |
| R20 | 22.2 | 16.9 | 0.1 | E117 | 100.0 | 17.9 | 0.3 |
| R21 | 22.2 | 16.7 | 0.3 | E118 | 28.6 | 16.9 | 0.2 |
| R23 | 13.3 | 16.85 | 0.3 | E120 | 40.0 | 17.4 | 0.2 |
| - | - | - | - | E129 | 22.2 | 16.8 | 0.2 |
| Nova | |||
|---|---|---|---|
| (days) | (mag) | (mag) | |
| LMC1926 | 117.6 | 12.0 | 0.3 |
| LMC1935 | 13.8 | 11.0 | 0.3 |
| LMC1936 | 17.7 | 10.5 | 0.3 |
| LMC1937 | 10.7 | 10.6 | 0.3 |
| LMC1948 | 58.8 | 12.82 | 0.3 |
| LMC1951 | 2.6 | 11.9 | 0.0 |
| LMC1968 | 2.0 | 10.4 | 0.4 |
| LMC1970B | 8.0 | 11.0 | 0.5 |
| LMC1971A | 15.7 | 11.77 | 0.1 |
| LMC1977B | 11.2 | 10.7 | 0.1 |
| LMC1978A | 3.5 | 9.75 | 0.6 |
| LMC1987 | 2.0 | 9.6 | 0.2 |
| LMC1988A | 22.2 | 10.85 | 0.1 |
| LMC1988B | 4.7 | 9.9 | 0.2 |
| LMC1990A | 3.4 | 9.5 | 0.3 |
| LMC1990B | 3.4 | 10.2 | 0.1 |
| LMC1991 | 5.7 | 9.0 | 0.1 |
| LMC1992 | 8.0 | 10.2 | 0.1 |
| LMC1995 | 11.8 | 10.4 | 0.3 |
| LMC2000 | 10.0 | 10.7 | 0.1 |
| LMC2002 | 13.3 | 10.1 | 0.2 |
| LMC2003 | 8.0 | 11.0 | 0.1 |
| LMC2004 | 11.8 | 10.9 | 0.1 |
| LMC2005 | 62.5 | 11.5 | 0.1 |
| LMC2009a | 5.4 | 10.6 | 0.1 |
| LMC2009b | 54.1 | 12.1 | 0.1 |
| LMC2012b | 10.0 | 11.5 | 0.1 |
| Nova | ||
|---|---|---|
| (days) | (mag) | |
| M31-2007-10a | 8.6 | 17.5 |
| M31-2008-07b | 17.0 | 19.0 |
| M31-2008-8c | 26.3 | 17.1 |
| M31-2008-09a | 25.0 | 17.8 |
| M31-2008-09c | 16.6 | 16.6 |
| M31-2008-10b | 35.0 | 18.1 |
| M31-2008-11a | 7.5 | 17.0 |
| M31-2008-12b | 25.0 | 17.0 |
| M31-2009-08b | 45.0 | 17.86 |
| M31-2009-09a | 79.0 | 17.36 |
| M31-2009-10a | 20.0 | 17.05 |
| M31-2009-10b | 8.0 | 14.94 |
| M31-2009-11a | 22.0 | 17.33 |
| M31-2009-11b | 90.0 | 18.35 |
| M31-2009-11d | 25.0 | 17.82 |
| M31-2009-12a | 10.0 | 16.98 |
| M31-2010-06a | 40.0 | 16.98 |
| M31-2010-06b | 8.0 | 17.72 |
| M31-2010-06c | 19.0 | 17.57 |
| M31-2010-07a | 15.0 | 15.75 |
| M31-2010-09a | 40.0 | 17.52 |
| M31-2010-09b | 10.0 | 16.46 |
| M31-2010-10b | 57.0 | 17.14 |
| M31-2010-10a | 15.0 | 17.13 |
| M31-2010-10c | 60.0 | 17.54 |
| Nova | ||
|---|---|---|
| (days) | (mag) | |
| M31-Hubble-nova-1 | 100.0 | 16.7 |
| M31-Hubble-nova-2 | 22.2 | 15.8 |
| M31-Hubble-nova-3 | 16.7 | 15.8 |
| M31-Hubble-nova-4 | 80.0 | 17.1 |
| M31-Hubble-nova-5 | 33.3 | 16.2 |
| M31-Hubble-nova-6 | 66.7 | 16.9 |
| M31-Hubble-nova-7 | 15.4 | 16.2 |
| M31-Hubble-nova-8 | 100.0 | 17.5 |
| M31-Hubble-nova-9 | 28.6 | 16.8 |
| M31-Hubble-nova-10 | 20.0 | 16.3 |
| M31-Hubble-nova-11 | 25.0 | 16.4 |
| M31-Hubble-nova-12 | 11.1 | 16.3 |
| M31-Hubble-nova-13 | 36.4 | 17.3 |
| M31-Hubble-nova-14 | 28.6 | 17.2 |
| M31-Hubble-nova-15 | 15.4 | 15.3 |
| M31-Hubble-nova-16 | 33.3 | 17.4 |
| M31-Hubble-nova-17 | 133.3 | 17.5 |
| Nova | |||
|---|---|---|---|
| (days) | (mag) | (mag) | |
| NGC4365 | 18.2 | 23.97 | 0.30 |
| M49-1W | 20.0 | 22.51 | 0.11 |
| M49-2W | 12.6 | 21.01 | 0.57 |
| M49-3W | 54.0 | 24.13 | 0.21 |
| M49-5W | 10.5 | 23.81 | 0.12 |
| M49-2E | 33.2 | 23.11 | 0.10 |
| M49-4 | 52.0 | 23.33 | 0.13 |
| M49-5 | 7.5 | 23.10 | 0.52 |
| M49-6 | 19.3 | 23.33 | 0.28 |
| M49-7 | 11.7 | 22.72 | 0.36 |
| M49-9 | 37.2 | 23.74 | 0.22 |
| M87-1 | 15.2 | 21.84 | - |
| M87-2 | 11.2 | 22.25 | - |
| M87-3 | 2.0 | 22.64 | - |
| M87-4 | 7.7 | 22.74 | - |
| M87-5 | 17.1 | 22.99 | - |
| M87-6 | 11.2 | 23.18 | - |
| M87-7 | 9.3 | 23.21 | - |
| M87-8 | 3.7 | 23.37 | - |
| M87-10 | 22.3 | 23.51 | - |
| M87-11 | 28.9 | 23.57 | - |
| M87-12 | 33.1 | 23.58 | - |
| M87-13 | 6.7 | 23.67 | - |
| M87-14 | 31.5 | 23.74 | - |
| M87-16 | 32.6 | 23.77 | - |
| M87-17 | 30.4 | 23.81 | - |
| M87-19 | 9.0 | 23.90 | - |
| M87-20 | 36.3 | 23.94 | - |
| M87-21 | 29.9 | 24.07 | - |
| M87-23 | 8.0 | 24.16 | - |
References
- Abbott et al (2017) Abbott BP, Abbott R, Abbott TDea (2017) Multi-messenger Observations of a Binary Neutron Star Merger. ApJ848(2):L12, DOI 10.3847/2041-8213/aa91c9, \url1710.05833
- Abdo et al (2010) Abdo AA, others, Fermi LAT Collaboration (2010) Gamma-Ray Emission Concurrent with the Nova in the Symbiotic Binary V407 Cygni. Science 329(5993):817–821, DOI 10.1126/science.1192537, \url1008.3912
- Abia et al (2001) Abia C, Domínguez I, Straniero O, Limongi M, Chieffi A, Isern J (2001) The Implications of the New Z=0 Stellar Models and Yields on the Early Metal Pollution of the Intergalactic Medium. ApJ557(1):126–136, DOI 10.1086/321660, \urlastro-ph/0104276
- Ackermann et al (2014) Ackermann M, others, Fermi-LAT Collaboration (2014) Fermi establishes classical novae as a distinct class of gamma-ray sources. Science 345(6196):554–558, DOI 10.1126/science.1253947, \url1408.0735
- Alis and Saygac (2014) Alis S, Saygac AT (2014) Investigating the Nova Rate Connection to Galaxy Type using Archival Hubble Space Telescope Images. In: Woudt PA, Ribeiro VARM (eds) Stella Novae: Past and Future Decades, Astronomical Society of the Pacific, ASP Conference Series, vol 490, p 95
- Allen (1954) Allen CW (1954) Whole-sky statistics of celestial objects. MNRAS114:387, DOI 10.1093/mnras/114.4.387
- Allen (1973) Allen CW (1973) Astrophysical quantities. Athlone Press, London
- Amati (2006) Amati L (2006) The – correlation in gamma-ray bursts: updated observational status, re-analysis and main implications. MNRAS372(1):233–245, DOI 10.1111/j.1365-2966.2006.10840.x, \urlastro-ph/0601553
- Ambartsumian (1952) Ambartsumian VA (1952) Teoreticheskaia astrofizika
- Arnould and Norgaard (1975) Arnould M, Norgaard H (1975) The Explosive Thermonuclear Formation of 7Li and 11B. A&A42:55
- Arp (1956) Arp HC (1956) Novae in the Andromeda nebula. AJ61:15–34, DOI 10.1086/107284
- Aydi et al (2018) Aydi E, Page KL, Kuin NPM, Darnley MJ, Walter FM, Mróz P, Buckley DAH, Mohamed S, Whitelock P, Woudt P, Williams SC, Orio M, Williams RE, Beardmore AP, Osborne JP, Kniazev A, Ribeiro VARM, Udalski A, Strader J, Chomiuk L (2018) Multiwavelength observations of nova SMCN 2016-10a – one of the brightest novae ever observed. MNRAS474(2):2679–2705, DOI 10.1093/mnras/stx2678, \url1710.03716
- Aydi et al (2019) Aydi E, Chomiuk L, Strader J, Swihart SJ, Bahramian A, Harvey EJ, Britt CT, Buckley DAH, Chen P, Dage K, Darnley MJ, Dong S, Hambsch FJ, Holoien TWS, Jha SW, Kochanek CS, Kuin NPM, Li KL, Monard LAG, Mukai K, Page KL, Prieto JL, Richardson ND, Shappee BJ, Shishkovsky L, Sokolovsky KV, Stanek KZ, Thompson T (2019) Flaring, Dust Formation, And Shocks In The Very Slow Nova ASASSN-17pf (LMCN 2017-11a). arXiv e-prints arXiv:1903.09232, \url1903.09232
- Aydi et al (2020) Aydi E, Sokolovsky KV, Chomiuk L, Steinberg E, Li KL, Vurm I, Metzger BD, Strader J, Mukai K, Pejcha O, Shen KJ, Wade GA, Kuschnig R, Moffat AFJ, Pablo H, Pigulski A, Popowicz A, Weiss W, Zwintz K, Izzo L, Pollard KR, Handler G, Ryder SD, Filipović MD, Alsaberi RZE, Manojlović P, De Oliveira R, Walter FM, Vallely PJ, Buckley DAH, Brown MJI, Harvey EJ, Kawash A, Kniazev A, Kochanek CS, Linford J, Mikolajewska J, Molaro P, Orio M, Page KL, Sokoloski JL (2020) Direct evidence for shock-powered optical emission in a nova. Nat Astron DOI 10.1038/s41550-020-1070-y
- Baade (1944) Baade W (1944) The Resolution of Messier 32, NGC 205, and the Central Region of the Andromeda Nebula. ApJ100:137, DOI 10.1086/144650
- Baade (1957) Baade W (1957) Galaxies and their stellar population. The Observatory 77:165–171
- Baade (1958) Baade W (1958) The Population of the Galactic Nucleus and the Evidence for the Presence of an Old Population Pervading the Whole Disk of our Galaxy. Ricerche Astronomiche 5:303
- Baade and Zwicky (1934) Baade W, Zwicky F (1934) On Super-novae. Proceedings of the National Academy of Science 20(5):254–259, DOI 10.1073/pnas.20.5.254
- Bailer-Jones et al (2018) Bailer-Jones CAL, Rybizki J, Fouesneau M, Mantelet G, Andrae R (2018) Estimating Distance from Parallaxes. IV. Distances to 1.33 Billion Stars in Gaia Data Release 2. AJ156(2):58, DOI 10.3847/1538-3881/aacb21, \url1804.10121
- Balman and Krautter (2001) Balman Ş, Krautter J (2001) The re-analysis of the ROSAT data of Nova Mus 1983 using white dwarf atmosphere emission models. MNRAS326(4):1441–1447, DOI 10.1111/j.1365-2966.2001.04716.x, \urlastro-ph/0106216
- Balman et al (1998) Balman Ş, Krautter J, Ögelman H (1998) The X-Ray Spectral Evolution of Classical Nova V1974 Cygni 1992: A Reanalysis of the ROSAT Data. ApJ499(1):395–406, DOI 10.1086/305600
- Bath and Shaviv (1978) Bath GT, Shaviv G (1978) The space density, recurrence rate and classification of novae. MNRAS183:515–522, DOI 10.1093/mnras/183.3.515
- Bianchini (1987) Bianchini A (1987) Detection of solar-type cycles in cataclysmic variables. Mem. Soc. Astr. It.58:245–251
- Bianchini et al (1981) Bianchini A, Hamzaoglu E, Sabbadin F (1981) The old-nova GK Per (1901). I. Determination of the orbital period. A&A99:392–393
- Bode (2002) Bode MF (2002) The Evolution of Nova Remnants. In: Hernanz M, José J (eds) Classical Nova Explosions, American Institute of Physics Conference Series, AIP Conference Series, vol 637, pp 497–508, DOI 10.1063/1.1518252, \urlastro-ph/0211437
- Bode and Evans (2008) Bode MF, Evans A (2008) Classical Novae, Cambridge Astrophysics Series, vol 43, 2nd edn. Cambridge University Press, Cambridge
- Boffi and Branch (1995) Boffi FR, Branch D (1995) Radio Emission from Type IA Supernovae as a Test of Symbiotic Star Progenitor Systems. PASP107:347, DOI 10.1086/133558
- Bondi (1952) Bondi H (1952) On spherically symmetrical accretion. MNRAS112:195, DOI 10.1093/mnras/112.2.195
- Bothun (1992) Bothun GD (1992) The Bulge/Halo Luminosity of M33 and its Globular Cluster Population. AJ103:104, DOI 10.1086/116044
- Bowen (1947) Bowen IS (1947) Excitation by Line Coincidence. PASP59(349):196–198, DOI 10.1086/125951
- Bowen (1954) Bowen IS (1954) Edwin P. Hubble: 1889-1953. Science 119(3085):204, DOI 10.1126/science.119.3085.204
- Brown et al (2018) Brown AGA, others, Gaia Collaboration (2018) Gaia Data Release 2. Summary of the contents and survey properties. A&A616:A1, DOI 10.1051/0004-6361/201833051, \url1804.09365
- Burstein and Heiles (1984) Burstein D, Heiles C (1984) Reddening estimates for galaxies in the second reference catalog and the Uppsala General Catalog. ApJS54:33–79, DOI 10.1086/190918
- Buscombe and de Vaucouleurs (1955) Buscombe W, de Vaucouleurs G (1955) Novae in the Magellanic Clouds and in the Galaxy. The Observatory 75:170–175
- Cameron and Fowler (1971) Cameron AGW, Fowler WA (1971) Lithium and the s-PROCESS in Red-Giant Stars. ApJ164:111, DOI 10.1086/150821
- Cao et al (2012) Cao Y, Kasliwal MM, Neill JD, Kulkarni SR, Lou YQ, Ben-Ami S, Bloom JS, Cenko SB, Law NM, Nugent PE, Ofek EO, Poznanski D, Quimby RM (2012) Classical Novae in Andromeda: Light Curves from the Palomar Transient Factory and GALEX. ApJ752(2):133, DOI 10.1088/0004-637X/752/2/133, \url1201.2393
- Capaccioli et al (1989) Capaccioli M, Della Valle M, D’Onofrio M, Rosino L (1989) Properties of the Nova Population of M31. AJ97:1622, DOI 10.1086/115104
- Capaccioli et al (1990) Capaccioli M, Della Valle M, D’Onofrio M, Rosino L (1990) Distance of the Large Magellanic Cloud through the Maximum Magnitude versus Rate of Decline Relation for Novae. ApJ360:63, DOI 10.1086/169096
- Cappellaro et al (1999) Cappellaro E, Evans R, Turatto M (1999) A new determination of supernova rates and a comparison with indicators for galactic star formation. A&A351:459–466, \urlastro-ph/9904225
- Cappellaro et al (2015) Cappellaro E, Botticella MT, Pignata G, Grado A, Greggio L, Limatola L, Vaccari M, Baruffolo A, Benetti S, Bufano F, Capaccioli M, Cascone E, Covone G, De Cicco D, Falocco S, Della Valle M, Jarvis M, Marchetti L, Napolitano NR, Paolillo M, Pastorello A, Radovich M, Schipani P, Spiro S, Tomasella L, Turatto M (2015) Supernova rates from the SUDARE VST-OmegaCAM search. I. Rates per unit volume. A&A584:A62, DOI 10.1051/0004-6361/201526712, \url1509.04496
- Cassatella et al (1979) Cassatella A, Benvenuti P, Clavel J, Heck A, Penston M, Selvelli PL, Macchetto F (1979) On the ultraviolet spectrum of Nova Cygni 1978. A&A74:L18–L19
- Cassatella et al (2002) Cassatella A, Altamore A, González-Riestra R (2002) Classical novae in outburst: The early evolution of the ultraviolet continuum. A&A384:1023–1029, DOI 10.1051/0004-6361:20020107
- Cassatella et al (2004) Cassatella A, Lamers HJGLM, Rossi C, Altamore A, González-Riestra R (2004) A study of the expanding envelope of Nova V1974 Cyg 1992 based on IUE high resolution spectroscopy. A&A420:571–588, DOI 10.1051/0004-6361:20034102, \urlastro-ph/0403288
- Cecchini and Gratton (1942) Cecchini G, Gratton L (1942) Le stelle nuove. U. Hoepli, Milano
- Charbonnel and Primas (2005) Charbonnel C, Primas F (2005) The lithium content of the Galactic Halo stars. A&A442(3):961–992, DOI 10.1051/0004-6361:20042491, \urlastro-ph/0505247
- Chen et al (2016) Chen HL, Woods TE, Yungelson LR, Gilfanov M, Han Z (2016) Modelling nova populations in galaxies. MNRAS458(3):2916–2927, DOI 10.1093/mnras/stw458, \url1602.07849
- Chesneau and Banerjee (2012) Chesneau O, Banerjee DPK (2012) Interferometric studies of novae in the infrared. Bull Astron Soc India 40:267, \url1210.2507
- Chesneau et al (2007) Chesneau O, Nardetto N, Millour F, Hummel C, Domiciano de Souza A, Bonneau D, Vannier M, Rantakyrö F, Spang A, Malbet F, Mourard D, Bode MF, O’Brien TJ, Skinner G, Petrov RG, Stee P, Tatulli E, Vakili F (2007) AMBER/VLTI interferometric observations of the recurrent Nova RS Ophiuchii 5.5 days after outburst. A&A464(1):119–126, DOI 10.1051/0004-6361:20066609, \urlastro-ph/0611602
- Chesneau et al (2011) Chesneau O, Meilland A, Banerjee DPK, Le Bouquin JB, McAlister H, Millour F, Ridgway ST, Spang A, ten Brummelaar T, Wittkowski M, Ashok NM, Benisty M, Berger JP, Boyajian T, Farrington C, Goldfinger PJ, Merand A, Nardetto N, Petrov R, Rivinius T, Schaefer G, Touhami Y, Zins G (2011) The 2011 outburst of the recurrent nova ¡ASTROBJ¿T Pyxidis¡/ASTROBJ¿. Evidence for a face-on bipolar ejection. A&A534:L11, DOI 10.1051/0004-6361/201117792, \url1109.4534
- Chesneau et al (2012) Chesneau O, Lagadec E, Otulakowska-Hypka M, Banerjee DPK, Woodward CE, Harvey E, Spang A, Kervella P, Millour F, Nardetto N, Ashok NM, Barlow MJ, Bode M, Evans A, Lynch DK, O’Brien TJ, Rudy RJ, Russell RW (2012) The expanding dusty bipolar nebula around the nova V1280 Scorpi. A&A545:A63, DOI 10.1051/0004-6361/201219825, \url1207.5301
- Cheung et al (2016) Cheung CC, Jean P, Shore SN, Stawarz Ł, Corbet RHD, Knödlseder J, Starrfield S, Wood DL, Desiante R, Longo F, Pivato G, Wood KS (2016) Fermi-LAT Gamma-Ray Detections of Classical Novae V1369 Centauri 2013 and V5668 Sagittarii 2015. ApJ826(2):142, DOI 10.3847/0004-637X/826/2/142, \url1605.04216
- Chevalier (1988) Chevalier RA (1988) The interaction of supernova 1987A with dense circumstellar gas. Nature332(6164):514–516, DOI 10.1038/332514a0
- Chomiuk et al (2014a) Chomiuk L, Linford JD, Yang J, O’Brien TJ, Paragi Z, Mioduszewski AJ, Beswick RJ, Cheung CC, Mukai K, Nelson T, Ribeiro VARM, Rupen MP, Sokoloski JL, Weston J, Zheng Y, Bode MF, Eyres S, Roy N, Taylor GB (2014a) Binary orbits as the driver of -ray emission and mass ejection in classical novae. Nature514(7522):339–342, DOI 10.1038/nature13773, \url1410.3473
- Chomiuk et al (2014b) Chomiuk L, Nelson T, Mukai K, Sokoloski JL, Rupen MP, Page KL, Osborne JP, Kuulkers E, Mioduszewski AJ, Roy N, Weston J, Krauss MI (2014b) The 2011 Outburst of Recurrent Nova T Pyx: X-ray Observations Expose the White Dwarf Mass and Ejection Dynamics. ApJ788(2):130, DOI 10.1088/0004-637X/788/2/130, \url1404.3210
- Chomiuk et al (2016) Chomiuk L, Soderberg AM, Chevalier RA, Bruzewski S, Foley RJ, Parrent J, Strader J, Badenes C, Fransson C, Kamble A, Margutti R, Rupen MP, Simon JD (2016) A Deep Search for Prompt Radio Emission from Thermonuclear Supernovae with the Very Large Array. ApJ821(2):119, DOI 10.3847/0004-637X/821/2/119, \url1510.07662
- Ciardullo et al (1987) Ciardullo R, Ford HC, Neill JD, Jacoby GH, Shafter AW (1987) The Spatial Distribution and Population of Novae in M31. ApJ318:520, DOI 10.1086/165388
- Ciardullo et al (1990) Ciardullo R, Ford HC, Williams RE, Tamblyn P, Jacoby GH (1990) The Nova Rate in the Elliptical Component of NGC 5128. AJ99:1079, DOI 10.1086/115397
- Ciatti and Rosino (1974) Ciatti F, Rosino L (1974) Photographic and spectroscopic observations of N Aql 1970, N Cyg 1970, and N Sct 1970. A&AS16:305–322
- Cieslinski et al (2003) Cieslinski D, Diaz MP, Mennickent RE, Pietrzyński G (2003) Identification of New Eruptive Cataclysmic Variables toward the Galactic Bulge and Magellanic Clouds Using the OGLE-II Database. PASP115(804):193–211, DOI 10.1086/367673
- Clayton (1979) Clayton DD (1979) Sudden Grain Nucleation and Growth in Supernova and Nova Ejecta. Ap&SS65(1):179–189, DOI 10.1007/BF00643499
- Coc et al (2013) Coc A, Uzan JP, Vangioni E (2013) Standard Big-Bang Nucleosynthesis after Planck. arXiv e-prints arXiv:1307.6955, \url1307.6955
- Coc et al (2014) Coc A, Uzan JP, Vangioni E (2014) Standard big bang nucleosynthesis and primordial CNO abundances after Planck. JCAP10:050, DOI 10.1088/1475-7516/2014/10/050, \url1403.6694
- Coelho et al (2008) Coelho EA, Shafter AW, Misselt KA (2008) The Rate and Spatial Distribution of Novae in M101 (NGC 5457). ApJ686(2):1261–1268, DOI 10.1086/591517, \url0807.0210
- Cohen (1985) Cohen JG (1985) Nova shells. II. Calibration of the distance scale using novae. ApJ292:90–103, DOI 10.1086/163135
- Cohen and Rosenthal (1983) Cohen JG, Rosenthal AJ (1983) Nova shells. ApJ268:689–697, DOI 10.1086/160990
- Conti (1968) Conti PS (1968) Lithium Destruction and Rotational Braking. ApJ152:657, DOI 10.1086/149581
- Cummings et al (2018) Cummings JD, Kalirai JS, Tremblay PE, Ramirez-Ruiz E, Choi J (2018) The White Dwarf Initial-Final Mass Relation for Progenitor Stars from 0.85 to 7.5 . ApJ866(1):21, DOI 10.3847/1538-4357/aadfd6, \url1809.01673
- Curtin et al (2015) Curtin C, Shafter AW, Pritchet CJ, Neill JD, Kundu A, Maccarone TJ (2015) Exploring the Role of Globular Cluster Specific Frequency on the Nova Rates in Three Virgo Elliptical Galaxies. ApJ811(1):34, DOI 10.1088/0004-637X/811/1/34, \url1508.03319
- Curtis (1917a) Curtis HD (1917a) Finding List for General Catalog Numbers. PASP29(170):180–180, DOI 10.1086/122678
- Curtis (1917b) Curtis HD (1917b) Novae in the Spiral Nebulae and the Island Universe Theory. PASP29(171):206–207, DOI 10.1086/122632
- Curtis (1917c) Curtis HD (1917c) Two Novae in N.G.C. 4321. Harvard College Obs Bull 642:1–1
- D’Antona and Matteucci (1991) D’Antona F, Matteucci F (1991) Galactic evolution of lithium. A&A248:62
- Darnley et al (2004) Darnley MJ, Bode MF, Kerins E, Newsam AM, An J, Baillon P, Novati SC, Carr BJ, Crézé M, Evans NW, Giraud-Héraud Y, Gould A, Hewett P, Jetzer P, Kaplan J, Paulin-Henriksson S, Smartt SJ, Stalin CS, Tsapras Y (2004) Classical novae from the POINT-AGAPE microlensing survey of M31 - I. The nova catalogue. MNRAS353(2):571–588, DOI 10.1111/j.1365-2966.2004.08087.x, \urlastro-ph/0403447
- Darnley et al (2006) Darnley MJ, Bode MF, Kerins E, Newsam AM, An J, Baillon P, Belokurov V, Calchi Novati S, Carr BJ, Crézé M, Evans NW, Giraud-Héraud Y, Gould A, Hewett P, Jetzer P, Kaplan J, Paulin-Henriksson S, Smartt SJ, Tsapras Y, Weston M (2006) Classical novae from the POINT-AGAPE microlensing survey of M31 - II. Rate and statistical characteristics of the nova population. MNRAS369(1):257–271, DOI 10.1111/j.1365-2966.2006.10297.x, \urlastro-ph/0509493
- Darnley et al (2012) Darnley MJ, Ribeiro VARM, Bode MF, Hounsell RA, Williams RP (2012) On the Progenitors of Galactic Novae. ApJ746(1):61, DOI 10.1088/0004-637X/746/1/61, \url1112.2589
- Darnley et al (2019) Darnley MJ, Hounsell R, O’Brien TJ, Henze M, Rodríguez-Gil P, Shafter AW, Shara MM, Vaytet NMH, Bode MF, Ciardullo R, Davis BD, Galera-Rosillo R, Harman DJ, Harvey EJ, Healy MW, Ness JU, Ribeiro VARM, Williams SC (2019) A recurrent nova super-remnant in the Andromeda galaxy. Nature565(7740):460–463, DOI 10.1038/s41586-018-0825-4, \url1712.04872
- Darnley et al (2020) Darnley MJ, Newsam AM, Chinetti K, Hawkins IDW, Jannetta AL, Kasliwal MM, McGarry JC, Shara MM, Sitaram M, Williams SC (2020) AT 2016dah and AT 2017fyp: the first classical novae discovered within a tidal stream. arXiv e-prints arXiv:2004.09431, \url2004.09431
- De Gennaro Aquino et al (2014) De Gennaro Aquino I, Shore SN, Schwarz GJ, Mason E, Starrfield S, Sion EM (2014) The spectroscopic evolution of the recurrent nova T Pyxidis during its 2011 outburst. III. The ultraviolet development from iron curtain through the post-X-ray turnoff. A&A562:A28, DOI 10.1051/0004-6361/201322545
- De Gennaro Aquino et al (2015) De Gennaro Aquino I, Schröder KP, Mittag M, Wolter U, Jack D, Eenens P, González-Pérez JN, Hempelmann A, Schmitt JHMM, Hauschildt PH, Rauw G (2015) High spectral resolution monitoring of Nova V339 Delphini with TIGRE. A&A581:A134, DOI 10.1051/0004-6361/201525810
- de Maupertuis (1732) de Maupertuis PLM (1732) Discours sur les differentes figures des astres
- de Vaucouleurs (1958) de Vaucouleurs G (1958) Photoelectric photometry of the Andromeda Nebula in the UBV system. ApJ128:465, DOI 10.1086/146564
- de Vaucouleurs (1978) de Vaucouleurs G (1978) The extragalactic distance scale. II. Distances of the nearest galaxies from primary indicators. ApJ223:730–739, DOI 10.1086/156306
- Della Valle (1988) Della Valle M (1988) Distance modulus and rate of novae in M33. In: van den Bergh S, Pritchet CJ (eds) The extragalactic distance scale, Astronomical Society of the Pacific, ASP Conference Series, vol 4, p 73
- Della Valle (1991) Della Valle M (1991) Nova LMC 1991: evidence for a super-bright nova population. A&A252:L9
- Della Valle and Calvani (1990) Della Valle M, Calvani M (1990) Quasi-Periodic Outburst Activity of Novae at Minimum. In: Cassatella A, Viotti R (eds) Physics of Classical Novae, Springer, Berlin, vol 369, p 48, DOI 10.1007/3-540-53500-4_93
- Della Valle and Duerbeck (1993) Della Valle M, Duerbeck HW (1993) The space density of classical novae in the galactic disk. A&A271:175–179
- Della Valle and Gilmozzi (2002) Della Valle M, Gilmozzi R (2002) Rebirth of Novae as Distance Indicators due to Efficient Large Telescopes. Science 296:1275, DOI 10.1126/science.1070939, \urlastro-ph/0206067
- Della Valle and Livio (1994) Della Valle M, Livio M (1994) On the Progenitors of Type IA Supernovae in Early-Type and Late-Type Galaxies. ApJ423:L31, DOI 10.1086/187228
- Della Valle and Livio (1995) Della Valle M, Livio M (1995) The Calibration of Novae as Distance Indicators. ApJ452:704, DOI 10.1086/176342
- Della Valle and Livio (1996) Della Valle M, Livio M (1996) On the Frequency of Occurrence of Recurrent Novae and Their Role as Type IA Supernova Progenitors. ApJ473:240, DOI 10.1086/178139
- Della Valle and Livio (1998) Della Valle M, Livio M (1998) The Spectroscopic Differences between Disk and Thick-Disk/Bulge Novae. ApJ506(2):818–823, DOI 10.1086/306275
- Della Valle and Rosino (1987) Della Valle M, Rosino L (1987) Semiregular Variations of Nova V841 Oph (1848) at Minimum. Information Bulletin on Variable Stars 2995:1
- Della Valle et al (1992) Della Valle M, Bianchini A, Livio M, Orio M (1992) On the possible existence of two classes of progenitors for classical novae. A&A266:232–236
- Della Valle et al (1994) Della Valle M, Rosino L, Bianchini A, Livio M (1994) The nova rate in galaxies of different Hubble types. A&A287:403–409
- Della Valle et al (1997) Della Valle M, Gilmozzi R, Bianchini A, Esenoglu H (1997) Study of nova shells. II. FH Serentis 1970 and QU Vulpeculae 1984, nebular expansion, parallax and luminosity. A&A325:1151–1156
- Della Valle et al (2002) Della Valle M, Pasquini L, Daou D, Williams RE (2002) The evolution of Nova V382 Velorum 1999. A&A390:155–166, DOI 10.1051/0004-6361:20020611, \urlastro-ph/0205135
- Downes and Duerbeck (2000) Downes RA, Duerbeck HW (2000) Optical Imaging of Nova Shells and the Maximum Magnitude-Rate of Decline Relationship. AJ120(4):2007–2037, DOI 10.1086/301551, \urlastro-ph/0006458
- Doyle et al (2019) Doyle TF, Shara MM, Lessing AM, Zurek D (2019) A Hubble Space Telescope Survey for Novae in the Globular Clusters of M87. ApJ874(1):65, DOI 10.3847/1538-4357/ab0490, \url1810.12471
- Duerbeck (1981) Duerbeck HW (1981) Light curve types, absolute magnitudes, and physical properties of galactic novae. PASP93:165–175, DOI 10.1086/130799
- Duerbeck (1984) Duerbeck HW (1984) Constraints for Cataclysmic Binary Evolution as Derived from Space Distributions. Ap&SS99(80):363, DOI 10.1007/BF00650260
- Duerbeck (1987) Duerbeck HW (1987) A Reference Catalogue and Atlas of Galactic Novae. Sp. Sci. Rev.45(1-2):1–14, DOI 10.1007/BF00187826
- Duerbeck (1990) Duerbeck HW (1990) Galactic Distribution and Outburst Frequency of Classical Novae. In: Cassatella A, Viotti R (eds) Physics of Classical Novae, Springer, Berlin, vol 369, p 34, DOI 10.1007/3-540-53500-4_90
- Duerbeck (1992) Duerbeck HW (1992) The final decline of novae and the hibernation hypothesis. MNRAS258:629–638, DOI 10.1093/mnras/258.3.629
- Duncan (1918) Duncan JC (1918) A Ninth Nova in the Andromeda Nebula. PASP30(176):255, DOI 10.1086/122743
- Dunkley et al (2009) Dunkley J, Komatsu E, Nolta MR, Spergel DN, Larson D, Hinshaw G, Page L, Bennett CL, Gold B, Jarosik N, Weiland JL, Halpern M, Hill RS, Kogut A, Limon M, Meyer SS, Tucker GS, Wollack E, Wright EL (2009) Five-Year Wilkinson Microwave Anisotropy Probe Observations: Likelihoods and Parameters from the WMAP Data. ApJS180(2):306–329, DOI 10.1088/0067-0049/180/2/306, \url0803.0586
- Ederoclite et al (2006) Ederoclite A, Mason E, Della Valle M, Gilmozzi R, Williams RE, Germany L, Saviane I, Matteucci F, Schaefer BE, Walter F, Rudy RJ, Lynch D, Mazuk S, Venturini CC, Puetter RC, Perry RB, Liller W, Rotter A (2006) Early spectral evolution of Nova Sagittarii 2004 (V5114 Sagittarii). A&A459(3):875–883, DOI 10.1051/0004-6361:20065741, \urlastro-ph/0608598
- Eggleton (1983) Eggleton PP (1983) Aproximations to the radii of Roche lobes. ApJ268:368–369, DOI 10.1086/160960
- Ennis et al (1977) Ennis D, Becklin EE, Beckwith S, Elias J, Gatley I, Matthews K, Neugebauer G, Willner SP (1977) Infrared observations of Nova Cygni 1975. ApJ214:478–487, DOI 10.1086/155273
- Eyres et al (1996) Eyres SPS, Davis RJ, Kenny HT, Bode MF, Dougherty SM, Llyod HM (1996) MERLIN Observations of Symbiotic Novae. In: Taylor AR, Paredes JM (eds) Radio emission from the stars and the sun, Astronomical Society of the Pacific, ASP Conference Series, vol 93, p 194
- Ferrarese et al (1996) Ferrarese L, Livio M, Freedman W, Saha A, Stetson PB, Ford HC, Hill RJ, Madore BF (1996) Discovery of a Nova in the Virgo Galaxy M100. ApJ468:L95, DOI 10.1086/310246
- Ferrarese et al (2003) Ferrarese L, Côté P, Jordán A (2003) Hubble Space Telescope Observations of Novae in M49. ApJ599(2):1302–1319, DOI 10.1086/379349, \urlastro-ph/0310006
- Fields (2011) Fields BD (2011) The Primordial Lithium Problem. Annual Review of Nuclear and Particle Science 61:47–68, DOI 10.1146/annurev-nucl-102010-130445, \url1203.3551
- Fields et al (2014) Fields BD, Molaro P, Sarkar S (2014) Big-Bang Nucleosynthesis. arXiv e-prints \url1412.1408
- Finzell et al (2018) Finzell T, Chomiuk L, Metzger BD, Walter FM, Linford JD, Mukai K, Nelson T, Weston JHS, Zheng Y, Sokoloski JL, Mioduszewski A, Rupen MP, Dong S, Starrfield S, Cheung CC, Woodward CE, Taylor GB, Bohlsen T, Buil C, Prieto J, Wagner RM, Bensby T, Bond IA, Sumi T, Bennett DP, Abe F, Koshimoto N, Suzuki D, Tristram PJ, Christie GW, Natusch T, McCormick J, Yee J, Gould A (2018) A Detailed Observational Analysis of V1324 Sco, the Most Gamma-Ray-luminous Classical Nova to Date. ApJ852(2):108, DOI 10.3847/1538-4357/aaa12a, \url1701.03094
- Ford and Ciardullo (1988) Ford HC, Ciardullo R (1988) Hubble’s Novae as Distance Indicators. In: van den Bergh S, Pritchet CJ (eds) The Extragalactic Distance Scale, Astronomical Society of the Pacific, ASP Conference Series, vol 4, p 128
- Franck et al (2012) Franck JR, Shafter AW, Hornoch K, Misselt KA (2012) The Nova Rate in NGC 2403. ApJ760(1):13, DOI 10.1088/0004-637X/760/1/13, \url1210.0604
- Franckowiak et al (2018) Franckowiak A, Jean P, Wood M, Cheung CC, Buson S (2018) Search for gamma-ray emission from Galactic novae with the Fermi -LAT. A&A609:A120, DOI 10.1051/0004-6361/201731516, \url1710.04736
- Friedjung (1979) Friedjung M (1979) Upper limit of the Li/Na ratio in novae. A&A77:357–358
- Fujimoto (1982) Fujimoto MY (1982) A Theory of Hydrogen Shell Flashes on Accreting White Dwarfs - Part Two - the Stable Shell Burning and the Recurrence Period of Shell Flashes. ApJ257:767, DOI 10.1086/160030
- Gal-Yam (2012) Gal-Yam A (2012) Luminous Supernovae. Science 337(6097):927, DOI 10.1126/science.1203601, \url1208.3217
- Gallagher and Starrfield (1978) Gallagher JS, Starrfield S (1978) Theory and observations of classical novae. ARA&A16:171–214, DOI 10.1146/annurev.aa.16.090178.001131
- Gavazzi and Scodeggio (1996) Gavazzi G, Scodeggio M (1996) The mass dependence of the star formation history of disk galaxies. A&A312:L29–L32
- Gehrels (1986) Gehrels N (1986) Confidence Limits for Small Numbers of Events in Astrophysical Data. ApJ303:336, DOI 10.1086/164079
- Gehrels et al (2004) Gehrels N, Chincarini G, Giommi P, Mason KO, Nousek JA, Wells AA, White NE, Barthelmy SD, Burrows DN, Cominsky LR, Hurley KC, Marshall FE, Mészáros P, Roming PWA, Angelini L, Barbier LM, Belloni T, Campana S, Caraveo PA, Chester MM, Citterio O, Cline TL, Cropper MS, Cummings JR, Dean AJ, Feigelson ED, Fenimore EE, Frail DA, Fruchter AS, Garmire GP, Gendreau K, Ghisellini G, Greiner J, Hill JE, Hunsberger SD, Krimm HA, Kulkarni SR, Kumar P, Lebrun F, Lloyd-Ronning NM, Markwardt CB, Mattson BJ, Mushotzky RF, Norris JP, Osborne J, Paczynski B, Palmer DM, Park HS, Parsons AM, Paul J, Rees MJ, Reynolds CS, Rhoads JE, Sasseen TP, Schaefer BE, Short AT, Smale AP, Smith IA, Stella L, Tagliaferri G, Takahashi T, Tashiro M, Townsley LK, Tueller J, Turner MJL, Vietri M, Voges W, Ward MJ, Willingale R, Zerbi FM, Zhang WW (2004) The Swift Gamma-Ray Burst Mission. ApJ611(2):1005–1020, DOI 10.1086/422091, \urlastro-ph/0405233
- Gehrz (1990) Gehrz RD (1990) New Infrared Results for Classical Novae. In: Cassatella A, Viotti R (eds) Physics of Classical Novae, Springer, Berlin, vol 369, p 138, DOI 10.1007/3-540-53500-4_109
- Gehrz et al (1980a) Gehrz RD, Grasdalen GL, Hackwell JA, Ney EP (1980a) The evolution of the dust shell of nova SER 1978. ApJ237:855–865, DOI 10.1086/157934
- Gehrz et al (1980b) Gehrz RD, Hackwell JA, Grasdalen GI, Ney EP, Neugebauer G, Sellgren K (1980b) The optically thin dust shell of nova CYG 1978. ApJ239:570–580, DOI 10.1086/158143
- Gehrz et al (1995a) Gehrz RD, Greenhouse MA, Hayward TL, Houck JR, Mason CG, Woodward CE (1995a) The Infrared Spectrum of the Optically Thin Dust Shell of V705 Cassiopeiae (Nova Cassiopeiae 1993). ApJ448:L119, DOI 10.1086/309607
- Gehrz et al (1995b) Gehrz RD, Jones TJ, Matthews K, Neugebauer G, Woodward CE, Hayward TL, Greenhouse MA (1995b) The Neon Nova. III. The Infrared Light Curves of Nova QU Vulpeculae (Nova VUL 1984#2). AJ110:325, DOI 10.1086/117523
- Gehrz et al (1998) Gehrz RD, Truran JW, Williams RE, Starrfield S (1998) Nucleosynthesis in Classical Novae and Its Contribution to the Interstellar Medium. PASP110(743):3–26, DOI 10.1086/316107
- Gehrz et al (2008) Gehrz RD, Woodward CE, Helton LA, Polomski EF, Hayward TL, Houck JR, Evans A, Krautter J, Shore SN, Starrfield S, Truran J, Schwarz GJ, Wagner RM (2008) The Neon Abundance in the Ejecta of QU Vulpeculae from Late-Epoch Infrared Spectra. ApJ672(2):1167–1173, DOI 10.1086/523660, \url0709.2693
- Gehrz et al (2015) Gehrz RD, Evans A, Helton LA, Woodward CE (2015) Infrared Observations of Novae in the SOFIA Era. In: Lagadec E, Millour F, Lanz T (eds) The Physics of Evolved Stars: A Conference Dedicated to the Memory of Olivier Chesneau, EDP Sciences, EAS Publications Series, vol 71-72, pp 143–146, DOI 10.1051/eas/1571030, \url1509.00066
- Gehrz et al (2018) Gehrz RD, Evans A, Woodward CE, Helton LA, Banerjee DPK, Srivastava MK, Ashok NM, Joshi V, Eyres SPS, Krautter J, Kuin NPM, Page KL, Osborne JP, Schwarz GJ, Shenoy DP, Shore SN, Starrfield SG, Wagner RM (2018) The Temporal Development of Dust Formation and Destruction in Nova Sagittarii 2015#2 (V5668 SGR): A Panchromatic Study. ApJ858(2):78, DOI 10.3847/1538-4357/aaba81, \url1804.00575
- Geisel et al (1970) Geisel SL, Kleinmann DE, Low FJ (1970) Infrared Emission of Novae. ApJ161:L101, DOI 10.1086/180579
- Gill and O’Brien (2000) Gill CD, O’Brien TJ (2000) Hubble Space Telescope imaging and ground-based spectroscopy of old nova shells - I. FH Ser, V533 Her, BT Mon, DK Lac and V476 Cyg. MNRAS314(1):175–182, DOI 10.1046/j.1365-8711.2000.03342.x, \urlastro-ph/0001092
- Glicenstein (1999a) Glicenstein JF (1999a) Nova in Small Magellanic Cloud 1999 No. 3. IAU Circ.7286
- Glicenstein (1999b) Glicenstein JF (1999b) Nova in the Small Magellanic Cloud. IAU Circ.7239
- Godon et al (2014) Godon P, Sion EM, Starrfield S, Livio M, Williams RE, Woodward CE, Kuin P, Page KL (2014) Hubble Space Telescope Far Ultraviolet Spectroscopy of the Recurrent Nova T Pyxidis. ApJ784(2):L33, DOI 10.1088/2041-8205/784/2/L33, \url1402.0128
- Graham (1979) Graham JA (1979) The premaximum spectrum of a Magellanic Cloud nova. PASP91:79–82, DOI 10.1086/130445
- Greggio (2010) Greggio L (2010) The rates of SNIa: a theoretical viewpoint. In: Progenitors and Environments of Stellar Explosions, p 65
- Güth et al (2010) Güth T, Shafter AW, Misselt KA (2010) The Nova Rate in M94 (NGC 4736). ApJ720(2):1155–1160, DOI 10.1088/0004-637X/720/2/1155, \url1007.2154
- Hachisu and Kato (2006) Hachisu I, Kato M (2006) A Universal Decline Law of Classical Novae. ApJS167(1):59–80, DOI 10.1086/508063, \urlastro-ph/0607609
- Hachisu and Kato (2007) Hachisu I, Kato M (2007) A Universal Decline Law of Classical Novae. II. GK Persei 1901 and Novae in 2005. ApJ662(1):552–563, DOI 10.1086/517600, \urlastro-ph/0702563
- Hachisu and Kato (2009) Hachisu I, Kato M (2009) Optical and Supersoft X-Ray Light-Curve Models of Classical Nova V2491 Cygni: A New Clue to the Secondary Maximum. ApJ694(2):L103–L106, DOI 10.1088/0004-637X/694/2/L103, \url0902.2424
- Hachisu and Kato (2010) Hachisu I, Kato M (2010) A Prediction Formula of Supersoft X-ray Phase of Classical Novae. ApJ709(2):680–714, DOI 10.1088/0004-637X/709/2/680, \url0912.1136
- Hachisu and Kato (2012) Hachisu I, Kato M (2012) A Extremely Massive White Dwarf of the Symbiotic Classical Nova V407 Cyg as Suggested by the RS Oph and U Sco Models. Baltic Astronomy 21:68–75, DOI 10.1515/astro-2017-0360
- Hachisu and Kato (2014) Hachisu I, Kato M (2014) The UBV Color Evolution of Classical Novae. I. Nova-giant Sequence in the Color-Color Diagram. ApJ785(2):97, DOI 10.1088/0004-637X/785/2/97, \url1401.7113
- Hachisu and Kato (2015) Hachisu I, Kato M (2015) A Light Curve Analysis of Classical Novae: Free-free Emission versus Photospheric Emission. ApJ798(2):76, DOI 10.1088/0004-637X/798/2/76, \url1410.7888
- Hachisu and Kato (2018) Hachisu I, Kato M (2018) A Light Curve Analysis of Recurrent and Very Fast Novae in Our Galaxy, Magellanic Clouds, and M31. ApJS237(1):4, DOI 10.3847/1538-4365/aac833, \url1805.09932
- Hachisu and Kato (2019) Hachisu I, Kato M (2019) A Light-curve Analysis of 32 Recent Galactic Novae: Distances and White Dwarf Masses. ApJS242(2):18, DOI 10.3847/1538-4365/ab1b43, \url1905.10655
- Hachisu et al (1999) Hachisu I, Kato M, Nomoto K (1999) A Wide Symbiotic Channel to Type IA Supernovae. ApJ522(1):487–503, DOI 10.1086/307608, \urlastro-ph/9902304
- Hachisu et al (2008) Hachisu I, Kato M, Cassatella A (2008) A Universal Decline Law of Classical Novae. III. GQ Muscae 1983. ApJ687(2):1236–1252, DOI 10.1086/591415, \url0806.4253
- Hartwick and Hutchings (1978) Hartwick FDA, Hutchings JB (1978) Classical novae: a time-dependent optically thick wind model for the postmaximum phase. ApJ226:203–209, DOI 10.1086/156599
- Hatano et al (1997) Hatano K, Branch D, Fisher A, Starrfield S (1997) On the spatial distribution and occurrence rate of Galactic classical novae. MNRAS290(1):113–118, DOI 10.1093/mnras/290.1.113
- Henze et al (2010) Henze M, Pietsch W, Haberl F, Hernanz M, Sala G, Della Valle M, Hatzidimitriou D, Rau A, Hartmann DH, Greiner J, Burwitz V, Fliri J (2010) X-ray monitoring of classical novae in the central region of M 31. I. June 2006-March 2007. A&A523:A89, DOI 10.1051/0004-6361/201014710, \url1009.1644
- Henze et al (2011) Henze M, Pietsch W, Haberl F, Hernanz M, Sala G, Hatzidimitriou D, Della Valle M, Rau A, Hartmann DH, Burwitz V (2011) X-ray monitoring of classical novae in the central region of M 31. II. Autumn and winter 2007/2008 and 2008/2009. A&A533:A52, DOI 10.1051/0004-6361/201015887, \url1010.1461
- Henze et al (2012) Henze M, Pietsch W, Haberl F, Hernanz M, Sala G, Della Valle M, Stiele H (2012) M31N 2008-05d: a M 31 disk nova with a dipping supersoft X-ray light curve. A&A544:A44, DOI 10.1051/0004-6361/201219488, \url1207.2339
- Henze et al (2013) Henze M, Pietsch W, Haberl F, Della Valle M, Riffeser A, Sala G, Hatzidimitriou D, Hofmann F, Hartmann DH, Koppenhoefer J, Seitz S, Williams GG, Hornoch K, Itagaki K, Kabashima F, Nishiyama K, Xing G, Lee CH, Magnier E, Chambers K (2013) Supersoft X-rays reveal a classical nova in the M 31 globular cluster Bol 126. A&A549:A120, DOI 10.1051/0004-6361/201220196, \url1211.4736
- Henze et al (2014) Henze M, Pietsch W, Haberl F, Della Valle M, Sala G, Hatzidimitriou D, Hofmann F, Hernanz M, Hartmann DH, Greiner J (2014) X-ray monitoring of classical novae in the central region of M 31 III. Autumn and winter 2009/10, 2010/11, and 2011/12. A&A563:A2, DOI 10.1051/0004-6361/201322426, \url1312.1241
- Henze et al (2018) Henze M, Darnley MJ, Williams SC, Kato M, Hachisu I, Anupama GC, Arai A, Boyd D, Burke D, Ciardullo R, Chinetti K, Cook LM, Cook MJ, Erdman P, Gao X, Harris B, Hartmann DH, Hornoch K, Horst JC, Hounsell R, Husar D, Itagaki K, Kabashima F, Kafka S, Kaur A, Kiyota S, Kojiguchi N, Kučáková H, Kuramoto K, Maehara H, Mantero A, Masci FJ, Matsumoto K, Naito H, Ness JU, Nishiyama K, Oksanen A, Osborne JP, Page KL, Paunzen E, Pavana M, Pickard R, Prieto-Arranz J, Rodríguez-Gil P, Sala G, Sano Y, Shafter AW, Sugiura Y, Tan H, Tordai T, Vraštil J, Wagner RM, Watanabe F, Williams BF, Bode MF, Bruno A, Buchheim B, Crawford T, Goff B, Hernanz M, Igarashi AS, José J, Motta M, O’Brien TJ, Oswalt T, Poyner G, Ribeiro VARM, Sabo R, Shara MM, Shears J, Starkey D, Starrfield S, Woodward CE (2018) Breaking the Habit: The Peculiar 2016 Eruption of the Unique Recurrent Nova M31N 2008-12a. ApJ857(1):68, DOI 10.3847/1538-4357/aab6a6, \url1803.00181
- Hernandez et al (2018) Hernandez S, Larsen S, Trager S, Kaper L, Groot P (2018) Metallicities of young massive clusters in NGC 5236 (M83). MNRAS473(1):826–837, DOI 10.1093/mnras/stx2397, \url1709.04466
- Hernanz (2012) Hernanz M (2012) Novae in -rays. Bull Astron Soc India 40:377, \url1301.1660
- Hernanz (2015) Hernanz M (2015) Astrophysics: A lithium-rich stellar explosion. Nature518(7539):307–308, DOI 10.1038/518307a
- Hernanz and Sala (2010) Hernanz M, Sala G (2010) X-ray observations of classical novae: Theoretical implications. Astron Nachr 331(2):169, DOI 10.1002/asna.200911320, \url0910.4607
- Hillebrandt and Thielemann (1982) Hillebrandt W, Thielemann FK (1982) Nucleosynthesis in novae - A source of Ne-E and Al-26. ApJ255:617–623, DOI 10.1086/159864
- Hillman et al (2020) Hillman Y, Shara MM, Prialnik D, Kovetz A (2020) A unified theory of cataclysmic variable evolution from feedback-dominated numerical simulations. Nat Astron DOI 10.1038/s41550-020-1062-y
- Hjellming (1995) Hjellming RM (1995) Radio Images and Light Curves for Nova V1974 Cyg 1992. In: Bianchini A, Della Valle M, Orio M (eds) Cataclysmic Variables, Kluwer Academic, Dordrecht, Astrophysics and Space Science Library, vol 205, p 139, DOI 10.1007/978-94-011-0335-0_29
- Hjellming and Wade (1970) Hjellming RM, Wade CM (1970) Radio Novae. ApJ162:L1, DOI 10.1086/180610
- Hjellming et al (1979) Hjellming RM, Wade CM, Vandenberg NR, Newell RT (1979) Radio emission from nova shells. AJ84:1619–1631, DOI 10.1086/112585
- Hubble and Sandage (1953) Hubble E, Sandage A (1953) The Brightest Variable Stars in Extragalactic Nebulae. I. M31 and M33. ApJ118:353, DOI 10.1086/145764
- Hubble (1929) Hubble EP (1929) A spiral nebula as a stellar system, Messier 31. ApJ69:103–158, DOI 10.1086/143167
- Hyland and Neugebauer (1970) Hyland AR, Neugebauer G (1970) Infrared Observations of Nova Serpentis 1970. ApJ160:L177, DOI 10.1086/180554
- Iben and Tutukov (1984) Iben J I, Tutukov AV (1984) Supernovae of type I as end products of the evolution of binaries with components of moderate initial mass. ApJS54:335–372, DOI 10.1086/190932
- Iben and Tutukov (1985) Iben J I, Tutukov AV (1985) On the evolution of close binaries with components of initial mass between 3 M and 12 M. ApJS58:661–710, DOI 10.1086/191054
- Iben and Livio (1993) Iben J Icko, Livio M (1993) Common Envelopes in Binary Star Evolution. PASP105:1373, DOI 10.1086/133321
- Iben and Tutukov (1992) Iben J Icko, Tutukov AV (1992) Rare Thermonuclear Explosions in Short-Period Cataclysmic Variables, with Possible Application to the Nova-like Red Variable in the Galaxy M31. ApJ389:369, DOI 10.1086/171211
- Iijima (2012) Iijima T (2012) Spectroscopic observations of the recurrent nova CI Aquilae during the 2000 outburst. A&A544:A26, DOI 10.1051/0004-6361/201117945
- Iłkiewicz et al (2019) Iłkiewicz K, Mikołajewska J, Belczyński K, Wiktorowicz G, Karczmarek P (2019) Wind Roche lobe overflow as a way to make Type Ia supernovae from the widest symbiotic systems. MNRAS485(4):5468–5473, DOI 10.1093/mnras/stz760, \url1812.02602
- Iwanowska and Burnicki (1962) Iwanowska W, Burnicki A (1962) The population assignment of novae. Bull Acad Polon Sci 10:537
- Izzo et al (2012) Izzo L, Ederoclite A, Della Valle M, Mason E, Williams RE, Altamore T, Cassatella A, Gilmozzi R, Patat F, Schmidtobreick L, Selvelli P, Tappert C, Thater S, Covone G, Dall’Ora M, Paolillo M (2012) Optical and near infrared multi-site follow up of the recurrent nova T Pyx. Mem. Soc. Astr. It.83:830
- Izzo et al (2015) Izzo L, Della Valle M, Mason E, Matteucci F, Romano D, Pasquini L, Vanzi L, Jordan A, Fernand ez JM, Bluhm P, Brahm R, Espinoza N, Williams R (2015) Early Optical Spectra of Nova V1369 Cen Show the Presence of Lithium. ApJ808(1):L14, DOI 10.1088/2041-8205/808/1/L14, \url1506.08048
- Izzo et al (2018) Izzo L, Molaro P, Bonifacio P, Della Valle M, Cano Z, de Ugarte Postigo A, Prieto JL, Thöne C, Vanzi L, Zapata A, Fernandez D (2018) Beryllium detection in the very fast nova ASASSN-16kt (V407 Lupi). MNRAS478(2):1601–1610, DOI 10.1093/mnras/sty435, \url1802.05896
- Jacoby et al (1992) Jacoby GH, Branch D, Ciardullo R, Davies RL, Harris WE, Pierce MJ, Pritchet CJ, Tonry JL, Welch DL (1992) A Critical Review of Selected Techniques for Measuring Extragalactic Distances. PASP104:599, DOI 10.1086/133035
- Jordi et al (2006) Jordi K, Grebel EK, Ammon K (2006) Empirical color transformations between SDSS photometry and other photometric systems. A&A460(1):339–347, DOI 10.1051/0004-6361:20066082, \urlastro-ph/0609121
- José (2012) José J (2012) Classical nova explosions – hydrodynamics and nucleosynthesis. Bull Astron Soc India 40:443
- José and Hernanz (1998) José J, Hernanz M (1998) Nucleosynthesis in Classical Novae: CO versus ONe White Dwarfs. ApJ494(2):680–690, DOI 10.1086/305244, \urlastro-ph/9709153
- Kantharia (2017) Kantharia NG (2017) Novae: I. The maximum magnitude relation with decline time (MMRD) and distance. arXiv e-prints arXiv:1703.04087, \url1703.04087
- Kasliwal et al (2011) Kasliwal MM, Cenko SB, Kulkarni SR, Ofek EO, Quimby R, Rau A (2011) Discovery of a New Photometric Sub-class of Faint and Fast Classical Novae. ApJ735(2):94, DOI 10.1088/0004-637X/735/2/94, \url1003.1720
- Kato and Hachisu (1989) Kato M, Hachisu I (1989) Mass Loss during Nova Outbursts on Various White Dwarf Masses. ApJ346:424, DOI 10.1086/168022
- Kato and Hachisu (1994) Kato M, Hachisu I (1994) Optically Thick Winds in Nova Outbursts. ApJ437:802, DOI 10.1086/175041
- Kato and Hachisu (2012) Kato M, Hachisu I (2012) Recurrent novae as progenitors of Type Ia supernovae. Bull Astron Soc India 40:393, \url1212.2295
- Kato et al (2009) Kato M, Hachisu I, Cassatella A (2009) A Universal Decline Law of Classical Novae. IV. V838 Her (1991): A Very Massive White Dwarf. ApJ704(2):1676–1688, DOI 10.1088/0004-637X/704/2/1676, \url0909.1506
- Kato et al (2013) Kato M, Hachisu I, Henze M (2013) Novae in Globular Clusters. ApJ779(1):19, DOI 10.1088/0004-637X/779/1/19, \url1310.6579
- Kato et al (2014) Kato M, Saio H, Hachisu I, Nomoto K (2014) Shortest Recurrence Periods of Novae. ApJ793(2):136, DOI 10.1088/0004-637X/793/2/136, \url1404.0582
- Kato et al (2015) Kato M, Saio H, Hachisu I (2015) Multi-wavelength Light Curve Model of the One-year Recurrence Period Nova M31N 2008-12A. ApJ808(1):52, DOI 10.1088/0004-637X/808/1/52, \url1506.05364
- Kaur (2016) Kaur A (2016) The puzzling bulge to disk nova ratio in the Andromeda galaxy (M31). PhD thesis, Clemson University
- Kodaira (1970) Kodaira K (1970) Energy Distribution around the Light Maximum of Nova Serpentis 1970. PASJ22:447
- Kolb and Politano (1997) Kolb U, Politano M (1997) The contribution of O-Ne-Mg novae to the 26Al production in the Galaxy. A&A319:909–922
- Kopylov (1952) Kopylov IM (1952) Comm Crimean Ap Obs 9:116
- Kopylov (1955) Kopylov IM (1955) Izv Krymskoi Astrofiz Obs 13:23
- Kovetz and Prialnik (1985) Kovetz A, Prialnik D (1985) CNO abundances resulting from diffusion in accreting nova progenitors. ApJ291:812–821, DOI 10.1086/163117
- Kraft (1964) Kraft RP (1964) Binary Stars among Cataclysmic Variables. III. Ten Old Novae. ApJ139:457, DOI 10.1086/147776
- Kraft (1965) Kraft RP (1965) Binary Stars among Cataclysmic Variables. VII. on the Kinematics and Space Distribution of W Ursae Majoris and U Geminorum-Type Stars. ApJ142:1588, DOI 10.1086/148438
- Krautter et al (1996) Krautter J, Oegelman H, Starrfield S, Wichmann R, Pfeffermann E (1996) ROSAT X-Ray Observations of Nova V1974 Cygni: The Rise and Fall of the Brightest Supersoft X-Ray Source. ApJ456:788, DOI 10.1086/176697
- Kukarkin (1949) Kukarkin BV (1949) The study of the structure and evolution of stellar systems. Moscow
- Lambert and Reddy (2004) Lambert DL, Reddy BE (2004) Lithium abundances of the local thin disc stars. MNRAS349(2):757–767, DOI 10.1111/j.1365-2966.2004.07557.x, \urlastro-ph/0401259
- Li et al (2017) Li KL, Metzger BD, Chomiuk L, Vurm I, Strader J, Finzell T, Beloborodov AM, Nelson T, Shappee BJ, Kochanek CS, Prieto JL, Kafka S, Holoien TWS, Thompson TA, Luckas PJ, Itoh H (2017) A nova outburst powered by shocks. Nature Astronomy 1:697–702, DOI 10.1038/s41550-017-0222-1, \url1709.00763
- Li et al (2011) Li W, Bloom JS, Podsiadlowski P, Miller AA, Cenko SB, Jha SW, Sullivan M, Howell DA, Nugent PE, Butler NR, Ofek EO, Kasliwal MM, Richards JW, Stockton A, Shih HY, Bildsten L, Shara MM, Bibby J, Filippenko AV, Ganeshalingam M, Silverman JM, Kulkarni SR, Law NM, Poznanski D, Quimby RM, McCully C, Patel B, Maguire K, Shen KJ (2011) Exclusion of a luminous red giant as a companion star to the progenitor of supernova SN 2011fe. Nature480(7377):348–350, DOI 10.1038/nature10646, \url1109.1593
- Liller and Mayer (1987) Liller W, Mayer B (1987) The rate of nova production in the galaxy. PASP99:606–609, DOI 10.1086/132021
- Linford et al (2018) Linford JD, Chomiuk L, Rupen MP (2018) ngVLA Studies of Classical Novae. In: Murphy E (ed) Science with a Next Generation Very Large Array, Astronomical Society of the Pacific, ASP Conference Series, vol 517, p 271
- Livio (1992) Livio M (1992) Classical Novae and the Extragalactic Distance Scale. ApJ393:516, DOI 10.1086/171524
- Livio and Mazzali (2018) Livio M, Mazzali P (2018) On the progenitors of Type Ia supernovae. Phys. Rept.736:1–23, DOI 10.1016/j.physrep.2018.02.002, \url1802.03125
- Livio and Truran (1994) Livio M, Truran JW (1994) On the Interpretation and Implications of Nova Abundances: an Abundance of Riches or an Overabundance of Enrichments. ApJ425:797, DOI 10.1086/174024
- Livio et al (2002) Livio M, Riess A, Sparks W (2002) Will Jets Identify the Progenitors of Type Ia Supernovae? ApJ571(2):L99–L102, DOI 10.1086/341413, \urlastro-ph/0204454
- Lloyd et al (1996) Lloyd HM, O’Brien TJ, Bode MF (1996) Models for the Radio Emission from Classical Novae. In: Taylor AR, Paredes JM (eds) Radio emission from the stars and the sun, Astronomical Society of the Pacific, ASP Conference Series, vol 93, p 200
- Lodders et al (2009) Lodders K, Palme H, Gail HP (2009) Abundances of the Elements in the Solar System. Landolt Börnstein DOI 10.1007/978-3-540-88055-4_34, \url0901.1149
- Lundmark (1922) Lundmark K (1922) The Absolute Magnitudes of Novæ. PASP34(200):207, DOI 10.1086/123201
- Lundmark (1923) Lundmark K (1923) Some Facts and Suggestions Concerning Novæ. PASP35(204):95, DOI 10.1086/123277
- Lundmark (1927) Lundmark K (1927) Studies of Anagalactic Nebulae - First Paper. Nova Acta Regiae Soc Sci Upsaliensis Ser V pp 1–127
- Lundmark (1935) Lundmark K (1935) On the novae and their classification among the variable stars. Meddelanden fran Lunds Astronomiska Observatorium Serie II 74:1–20
- Madrid et al (2007) Madrid JP, Sparks WB, Ferguson HC, Livio M, Macchetto D (2007) Discovery of 13 Nova Candidates in M87. ApJ654(1):L41–L44, DOI 10.1086/510904, \urlastro-ph/0611825
- Mannucci et al (2005) Mannucci F, Della Valle M, Panagia N, Cappellaro E, Cresci G, Maiolino R, Petrosian A, Turatto M (2005) The supernova rate per unit mass. A&A433(3):807–814, DOI 10.1051/0004-6361:20041411, \urlastro-ph/0411450
- Mannucci et al (2006) Mannucci F, Della Valle M, Panagia N (2006) Two populations of progenitors for Type Ia supernovae? MNRAS370(2):773–783, DOI 10.1111/j.1365-2966.2006.10501.x, \urlastro-ph/0510315
- Maoz et al (2014) Maoz D, Mannucci F, Nelemans G (2014) Observational Clues to the Progenitors of Type Ia Supernovae. ARA&A52:107–170, DOI 10.1146/annurev-astro-082812-141031, \url1312.0628
- Martin and Dubus (2013) Martin P, Dubus G (2013) Particle acceleration and non-thermal emission during the V407 Cygni nova outburst. A&A551:A37, DOI 10.1051/0004-6361/201220289, \url1209.0625
- Martin et al (2018) Martin P, Dubus G, Jean P, Tatischeff V, Dosne C (2018) Gamma-ray emission from internal shocks in novae. A&A612:A38, DOI 10.1051/0004-6361/201731692, \url1710.05515
- Martini et al (1999) Martini P, Wagner RM, Tomaney A, Rich RM, Della Valle M, Hauschildt PH (1999) Nova Sagittarii 1994 1 (V4332 Sagittarii): The Discovery and Evolution of an Unusual Luminous Red Variable Star. AJ118(2):1034–1042, DOI 10.1086/300951, \urlastro-ph/9905016
- Mason et al (1996) Mason CG, Gehrz RD, Woodward CE, Smilowitz JB, Greenhouse MA, Hayward TL, Houck JR (1996) Infrared Observations of Dust Formation and Coronal Emission in Nova Aquilae 1995. ApJ470:577, DOI 10.1086/177889
- Mason et al (1998) Mason CG, Gehrz RD, Woodward CE, Smilowitz JB, Hayward TL, Houck JR (1998) The Infrared Development of V705 Cassiopeiae. ApJ494(2):783–791, DOI 10.1086/305220
- Mason et al (2005) Mason E, Della Valle M, Gilmozzi R, Lo Curto G, Williams RE (2005) Early decline spectra of nova SMC 2001 and nova LMC 2002. A&A435(3):1031–1042, DOI 10.1051/0004-6361:20041351, \urlastro-ph/0504153
- Mason et al (2018) Mason E, Shore SN, De Gennaro Aquino I, Izzo L, Page K, Schwarz GJ (2018) V1369 Cen High-resolution Panchromatic Late Nebular Spectra in the Context of a Unified Picture for Nova Ejecta. ApJ853(1):27, DOI 10.3847/1538-4357/aaa247, \url1807.07178
- Matteucci et al (1995) Matteucci F, D’Antona F, Timmes FX (1995) News (s) on the Galactic evolution of lithium. A&A303:460
- Matteucci et al (2003) Matteucci F, Renda A, Pipino A, Della Valle M (2003) Modelling the nova rate in galaxies. A&A405:23–30, DOI 10.1051/0004-6361:20030520, \urlastro-ph/0304123
- Mazzali et al (2001) Mazzali PA, Nomoto K, Cappellaro E, Nakamura T, Umeda H, Iwamoto K (2001) Can Differences in the Nickel Abundance in Chandrasekhar-Mass Models Explain the Relation between the Brightness and Decline Rate of Normal Type Ia Supernovae? ApJ547(2):988–994, DOI 10.1086/318428, \urlastro-ph/0009490
- McLaughlin (1939) McLaughlin DB (1939) The forms of light curves of novae. In: Sixtieth Meeting, Ann Arbor, Michigan, 1938, American Astronomical Society, Publications of the AAS, vol 9, p 157
- McLaughlin (1940) McLaughlin DB (1940) The Relation Between Absorption Velocity and Rate of Decline for Galactic Novae. ApJ91:369, DOI 10.1086/144179
- McLaughlin (1941) McLaughlin DB (1941) The Distances and Luminosities of Three Novae. ApJ93:417, DOI 10.1086/144281
- McLaughlin (1942) McLaughlin DB (1942) The Luminosities of Novae. Popular Astronomy 50:233
- McLaughlin (1943) McLaughlin DB (1943) On the spectra of novae. Publications of Michigan Observatory 8(12):149–194
- McLaughlin (1945) McLaughlin DB (1945) A note on the absorption of light in the galaxy. AJ51:97, DOI 10.1086/105832
- Mclaughlin (1945) Mclaughlin DB (1945) The Relation between Light-Curves and Luminosities of Novae. PASP57(335):69, DOI 10.1086/125689
- McLaughlin (1946) McLaughlin DB (1946) The classification of nova spectra. AJ52:46, DOI 10.1086/105904
- McLaughlin (1960) McLaughlin DB (1960) The Spectra of Novae. In: Greenstein JL (ed) Stellar atmospheres, University of Chicago Press, Chicago, p 585
- Metzger et al (2015) Metzger BD, Finzell T, Vurm I, Hascoët R, Beloborodov AM, Chomiuk L (2015) Gamma-ray novae as probes of relativistic particle acceleration at non-relativistic shocks. MNRAS450(3):2739–2748, DOI 10.1093/mnras/stv742, \url1501.05308
- Minkowski (1948) Minkowski R (1948) Novae and Planetary Nebulae. ApJ107:106, DOI 10.1086/144993
- Molaro et al (2016) Molaro P, Izzo L, Mason E, Bonifacio P, Della Valle M (2016) Highly enriched 7Be in the ejecta of Nova Sagittarii 2015 No. 2 (V5668 Sgr) and the Galactic 7Li origin. MNRAS463(1):L117–L121, DOI 10.1093/mnrasl/slw169, \url1609.07297
- Molaro et al (2020) Molaro P, Izzo L, Bonifacio P, Hernanz M, Selvelli P, della Valle M (2020) Search for 7Be in the outbursts of four recent novae. MNRAS492(4):4975–4985, DOI 10.1093/mnras/stz3587, \url1912.13281
- Monck (1885) Monck WHS (1885) New stars and shooting-stars. The Observatory 8:335–336
- Moraes and Diaz (2009) Moraes M, Diaz M (2009) HR Del Remnant Anatomy Using Two-Dimensional Spectral Data and Three-Dimensional Photoionization Shell Models. AJ138(6):1541–1556, DOI 10.1088/0004-6256/138/6/1541, \url0909.4689
- Morris et al (2017) Morris PJ, Cotter G, Brown AM, Chadwick PM (2017) Gamma-ray novae: rare or nearby? MNRAS465(1):1218–1226, DOI 10.1093/mnras/stw2776, \url1610.09941
- Mould et al (1990) Mould J, Cohen J, Graham JR, Hamilton D, Matthews K, Picard A, Reid N, Schmidt M, Soifer T, Wilson C, Rich RM, Gunn J (1990) A Nova-like Red Variable in M31. ApJ353:L35, DOI 10.1086/185702
- Mróz et al (2015) Mróz P, Udalski A, Poleski R, Soszyński I, Szymański MK, Pietrzyński G, Wyrzykowski Ł, Ulaczyk K, Kozłowski S, Pietrukowicz P, Skowron J (2015) OGLE Atlas of Classical Novae. I. Galactic Bulge Objects. ApJS219(2):26, DOI 10.1088/0067-0049/219/2/26, \url1504.08224
- Mróz et al (2016) Mróz P, Udalski A, Poleski R, Soszyński I, Szymański MK, Pietrzyński G, Wyrzykowski Ł, Ulaczyk K, Kozłowski S, Pietrukowicz P, Skowron J (2016) OGLE Atlas of Classical Novae. II. Magellanic Clouds. ApJS222(1):9, DOI 10.3847/0067-0049/222/1/9, \url1511.06355
- Mukai and Ishida (2001) Mukai K, Ishida M (2001) The Early X-Ray Emission from V382 Velorum (Nova Velorum 1999): An Internal Shock Model. ApJ551(2):1024–1030, DOI 10.1086/320220, \urlastro-ph/0101026
- Mukai and Sokoloski (2019) Mukai K, Sokoloski JL (2019) The new science of novae. Physics Today 72(11):38–44, DOI 10.1063/PT.3.4341
- Mukai et al (2008) Mukai K, Orio M, Della Valle M (2008) Novae as a Class of Transient X-Ray Sources. ApJ677(2):1248–1252, DOI 10.1086/529362
- Munari and Renzini (1992) Munari U, Renzini A (1992) Are Symbiotic Stars the Precursors of Type IA Supernovae? ApJ397:L87, DOI 10.1086/186551
- Munari and Zwitter (1997) Munari U, Zwitter T (1997) Equivalent width of Na I and K I lines and reddening. A&A318:269–274
- Munari et al (2014) Munari U, Mason E, Valisa P (2014) The narrow and moving HeII lines in nova KT Eridani. A&A564:A76, DOI 10.1051/0004-6361/201323180, \url1403.3284
- Munari et al (2017) Munari U, Hambsch FJ, Frigo A (2017) Photometric evolution of seven recent novae and the double-component characterizing the light curve of those emitting in gamma rays. MNRAS469(4):4341–4358, DOI 10.1093/mnras/stx1116, \url1703.09017
- Muraveva et al (2018) Muraveva T, Delgado HE, Clementini G, Sarro LM, Garofalo A (2018) RR Lyrae stars as standard candles in the Gaia Data Release 2 Era. MNRAS481(1):1195–1211, DOI 10.1093/mnras/sty2241, \url1805.08742
- Nariai et al (1980) Nariai K, Nomoto K, Sugimoto D (1980) Nova Explosion of Mass-Accreting White Dwarfs. PASJ32:473
- Naylor et al (1992) Naylor T, Charles PA, Mukai K, Evans A (1992) An observational case against nova hibernation. MNRAS258:449–456, DOI 10.1093/mnras/258.3.449
- Neill and Shara (2004) Neill JD, Shara MM (2004) The H Light Curves and Spatial Distribution of Novae in M81. AJ127(2):816–831, DOI 10.1086/381484, \urlastro-ph/0311327
- Neill and Shara (2005) Neill JD, Shara MM (2005) A Possible High Nova Rate for Two Local Group Dwarf Galaxies: M32 and NGC 205. AJ129(4):1873–1885, DOI 10.1086/428482, \urlastro-ph/0501030
- Nelson et al (2014) Nelson T, Chomiuk L, Roy N, Sokoloski JL, Mukai K, Krauss MI, Mioduszewski AJ, Rupen MP, Weston J (2014) The 2011 Outburst of Recurrent Nova T Pyx: Radio Observations Reveal the Ejecta Mass and Hint at Complex Mass Loss. ApJ785(1):78, DOI 10.1088/0004-637X/785/1/78, \url1211.3112
- Ness et al (2007) Ness JU, Schwarz GJ, Retter A, Starrfield S, Schmitt JHMM, Gehrels N, Burrows D, Osborne JP (2007) Swift X-Ray Observations of Classical Novae. ApJ663(1):505–515, DOI 10.1086/518084, \urlastro-ph/0703286
- Ness et al (2009) Ness JU, Drake JJ, Starrfield S, Bode MF, O’Brien TJ, Evans A, Eyres SPS, Helton LA, Osborne JP, Page KL, Schneider C, Woodward CE (2009) High-Resolution X-Ray Spectroscopy of the Evolving Shock in the 2006 Outburst of RS Ophiuchi. AJ137(2):3414–3436, DOI 10.1088/0004-6256/137/2/3414, \url0810.2023
- Ness et al (2015) Ness JU, Beardmore AP, Osborne JP, Kuulkers E, Henze M, Piro AL, Drake JJ, Dobrotka A, Schwarz G, Starrfield S, Kretschmar P, Hirsch M, Wilms J (2015) Short-period X-ray oscillations in super-soft novae and persistent super-soft sources. A&A578:A39, DOI 10.1051/0004-6361/201425178, \url1503.00186
- Newton (1729) Newton I (1729) The Mathematical Principles of Natural Philosophy
- Nomoto (1982a) Nomoto K (1982a) Accreting white dwarf models for type I supernovae. I - Presupernova evolution and triggering mechanisms. ApJ253:798–810, DOI 10.1086/159682
- Nomoto (1982b) Nomoto K (1982b) Accreting white dwarf models for type I supernovae. II. Off-center detonation supernovae. ApJ257:780–792, DOI 10.1086/160031
- Nomoto and Kondo (1991) Nomoto K, Kondo Y (1991) Conditions for Accretion-induced Collapse of White Dwarfs. ApJ367:L19, DOI 10.1086/185922
- O’Brien et al (2015) O’Brien T, Rupen M, Chomiuk L, Ribeiro V, Bode M, Sokoloski J, Woudt PA (2015) Thermal radio emission from novae & symbiotics with the Square Kilometre Array. In: Advancing Astrophysics with the Square Kilometre Array (AASKA14), p 62, \url1502.04927
- Oegelman et al (1984) Oegelman H, Beuermann K, Krautter J (1984) The detection of X-rays from nova MUSCAE 1983 with the EXOSAT satellite. ApJ287:L31–L34, DOI 10.1086/184391
- Oegelman et al (1993) Oegelman H, Orio M, Krautter J, Starrfield S (1993) Detection of supersoft X-ray emission from GQ Muscae nine years after a nova outburst. Nature361(6410):331–333, DOI 10.1038/361331a0
- Oort (1926) Oort JH (1926) Asymmetry in the distribution of stellar velocities. The Observatory 49:302–304
- Orio (2006) Orio M (2006) A Close Look at the Population of Supersoft and Quasi-soft X-Ray Sources Observed in M31 with XMM-Newton. ApJ643(2):844–862, DOI 10.1086/500099, \urlastro-ph/0512016
- Orio et al (2001) Orio M, Covington J, Ögelman H (2001) X-ray emission from classical and recurrent novae observed with ROSAT. A&A373:542–554, DOI 10.1051/0004-6361:20010537, \urlastro-ph/0104219
- Orio et al (2005) Orio M, Tepedelenlioglu E, Starrfield S, Woodward CE, Della Valle M (2005) Chandra Observations of the Recurrent Nova IM Normae. ApJ620(2):938–942, DOI 10.1086/427207, \urlastro-ph/0411162
- Orio et al (2010) Orio M, Nelson T, Bianchini A, Di Mille F, Harbeck D (2010) A Census of the Supersoft X-ray Sources in M31. ApJ717(2):739–765, DOI 10.1088/0004-637X/717/2/739
- Orio et al (2018) Orio M, Ness JU, Dobrotka A, Gatuzz E, Ospina N, Aydi E, Behar E, Buckley DAH, Ciroi S, Della Valle M, Hernanz M, Henze M, Osborne JP, Page KL, Rauch T, Sala G, Starrfield S, Williams RE, Woodward CE, Zemko P (2018) What We Learn from the X-Ray Grating Spectra of Nova SMC 2016. ApJ862(2):164, DOI 10.3847/1538-4357/aacf06, \url1806.08249
- Ortolani et al (1980) Ortolani S, Rafanelli P, Rosino L, Vittone A (1980) The recent outburst of the dwarf nova WZ Sge. A&A87:31–35
- Osborne (2015) Osborne JP (2015) Getting to know classical novae with Swift. J High Energy Astrophys 7:117–125, DOI 10.1016/j.jheap.2015.06.005, \url1507.02153
- Osborne et al (2011) Osborne JP, Page KL, Beardmore AP, Bode MF, Goad MR, O’Brien TJ, Starrfield S, Rauch T, Ness JU, Krautter J, Schwarz G, Burrows DN, Gehrels N, Drake JJ, Evans A, Eyres SPS (2011) The Supersoft X-ray Phase of Nova RS Ophiuchi 2006. ApJ727(2):124, DOI 10.1088/0004-637X/727/2/124, \url1011.5327
- Osterbrock and Ferland (2006) Osterbrock DE, Ferland GJ (2006) Astrophysics of gaseous nebulae and active galactic nuclei. University Science Books, Sausalito, CA
- Özdönmez et al (2018) Özdönmez A, Ege E, Güver T, Ak T (2018) A new catalogue of Galactic novae: investigation of the MMRD relation and spatial distribution. MNRAS476(3):4162–4186, DOI 10.1093/mnras/sty432, \url1802.05725
- Paczyński (1965) Paczyński B (1965) Cataclysmic Variables Among Binary Stars. II. Physical Parameters for Novae. Acta Astr.15:197
- Page et al (2015) Page KL, Osborne JP, Kuin NPM, Henze M, Walter FM, Beardmore AP, Bode MF, Darnley MJ, Delgado L, Drake JJ, Hernanz M, Mukai K, Nelson T, Ness JU, Schwarz GJ, Shore SN, Starrfield S, Woodward CE (2015) Swift detection of the super-swift switch-on of the super-soft phase in nova V745 Sco (2014). MNRAS454(3):3108–3120, DOI 10.1093/mnras/stv2144, \url1509.04004
- Pagnotta et al (2014) Pagnotta A, Walker ES, Schaefer BE (2014) The Diffuse Source at the Center of LMC SNR 0509-67.5 is a Background Galaxy at z = 0.031. ApJ788(2):173, DOI 10.1088/0004-637X/788/2/173, \url1405.0243
- Panagia et al (2006) Panagia N, Van Dyk SD, Weiler KW, Sramek RA, Stockdale CJ, Murata KP (2006) A Search for Radio Emission from Type Ia Supernovae. ApJ646(1):369–377, DOI 10.1086/504710, \urlastro-ph/0603808
- Pastorello et al (2019) Pastorello A, Mason E, Taubenberger S, Fraser M, Cortini G, Tomasella L, Botticella MT, Elias-Rosa N, Kotak R, Smartt SJ, Benetti S, Cappellaro E, Turatto M, Tartaglia L, Djorgovski SG, Drake AJ, Berton M, Briganti F, Brimacombe J, Bufano F, Cai YZ, Chen S, Christensen EJ, Ciabattari F, Congiu E, Dimai A, Inserra C, Kankare E, Magill L, Maguire K, Martinelli F, Morales-Garoffolo A, Ochner P, Pignata G, Reguitti A, Sollerman J, Spiro S, Terreran G, Wright DE (2019) Luminous red novae: Stellar mergers or giant eruptions? A&A630:A75, DOI 10.1051/0004-6361/201935999, \url1906.00812
- Patat and Hussain (2013) Patat F, Hussain GAJ (2013) Selecting and Scheduling Observing Programmes at ESO. In: Heck A (ed) Organizations, People and Strategies in Astronomy Vol. 2, vol 2, Venngeist, Duttlenheim, pp 231–256
- Patat et al (2007a) Patat F, Benetti S, Justham S, Mazzali PA, Pasquini L, Cappellaro E, Della Valle M, Podsiadlowski P, Turatto M, Gal-Yam A, Simon JD (2007a) Upper limit for circumstellar gas around the type Ia SN 2000cx. A&A474(3):931–936, DOI 10.1051/0004-6361:20078393, \url0708.3698
- Patat et al (2007b) Patat F, Chandra P, Chevalier R, Justham S, Podsiadlowski P, Wolf C, Gal-Yam A, Pasquini L, Crawford IA, Mazzali PA, Pauldrach AWA, Nomoto K, Benetti S, Cappellaro E, Elias-Rosa N, Hillebrandt W, Leonard DC, Pastorello A, Renzini A, Sabbadin F, Simon JD, Turatto M (2007b) Detection of Circumstellar Material in a Normal Type Ia Supernova. Science 317(5840):924, DOI 10.1126/science.1143005, \url0707.2793
- Patat et al (2019) Patat F, Kerzendorf W, Bordelon D, Van de Ven G, Pritchard T (2019) The Distributed Peer Review Experiment. The Messenger 177:3–13, DOI 10.18727/0722-6691/5147
- Patterson (1984) Patterson J (1984) The evolution of cataclysmic and low-mass X-ray binaries. ApJS54:443–493, DOI 10.1086/190940
- Patterson (1998) Patterson J (1998) Late Evolution of Cataclysmic Variables. PASP110(752):1132–1147, DOI 10.1086/316233
- Payne-Gaposchkin (1957) Payne-Gaposchkin C (1957) The galactic novae. Dover, New York
- Pease (1917) Pease FG (1917) A Suspected Nova in the Nebula N. G. C. 2841. PASP29(171):213, DOI 10.1086/122639
- Peimbert and Sarmiento (1984) Peimbert M, Sarmiento A (1984) Novae and galactic chemical evolution. Astronomy Express 1:97–103
- Perlmutter et al (1998) Perlmutter S, Aldering G, Della Valle M, Deustua S, Ellis RS, Fabbro S, Fruchter A, Goldhaber G, Groom DE, Hook IM, Kim AG, Kim MY, Knop RA, Lidman C, McMahon RG, Nugent P, Pain R, Panagia N, Pennypacker CR, Ruiz-Lapuente P, Schaefer B, Walton N (1998) Discovery of a supernova explosion at half the age of the Universe. Nature391(6662):51–54, DOI 10.1038/34124, \urlastro-ph/9712212
- Pfau (1976) Pfau W (1976) Recalibration of the absolute magnitudes of novae and application to nova Cygni 1975. A&A50:113–115
- Phillips (1993) Phillips MM (1993) The Absolute Magnitudes of Type IA Supernovae. ApJ413:L105, DOI 10.1086/186970
- Pietrzyński et al (2019) Pietrzyński G, Graczyk D, Gallenne A, Gieren W, Thompson IB, Pilecki B, Karczmarek P, Górski M, Suchomska K, Taormina M, Zgirski B, Wielgórski P, Kołaczkowski Z, Konorski P, Villanova S, Nardetto N, Kervella P, Bresolin F, Kudritzki RP, Storm J, Smolec R, Narloch W (2019) A distance to the Large Magellanic Cloud that is precise to one per cent. Nature567(7747):200–203, DOI 10.1038/s41586-019-0999-4, \url1903.08096
- Pinto et al (2012) Pinto C, Ness JU, Verbunt F, Kaastra JS, Costantini E, Detmers RG (2012) A phenomenological model for the X-ray spectrum of nova V2491 Cygni. A&A543:A134, DOI 10.1051/0004-6361/201117835, \url1206.2143
- Plaut (1965) Plaut L (1965) Distribution of Novae in the Galaxy. In: Blaauw A, Schmidt M (eds) Galactic structure, University of Chicago Press, Chicago, p 311
- Poggiani (2018) Poggiani R (2018) Galactic and Extragalactic Novae - A Review. In: Accretion Processes in Cosmic Sources – II, Sissa, PoS, vol 342, p 057, DOI 10.22323/1.342.0057
- Politano et al (1990) Politano M, Livio M, Truran JW, Webbink RF (1990) The Theoretical Frequency of Classical Nova Outbursts as a Function of White Dwarf Mass. In: Cassatella A, Viotti R (eds) Physics of Classical Novae, Springer, Berlin, vol 369, p 386, DOI 10.1007/3-540-53500-4_150
- Prantzos (2012) Prantzos N (2012) Production and evolution of Li, Be, and B isotopes in the Galaxy. A&A542:A67, DOI 10.1051/0004-6361/201219043, \url1203.5662
- Pretorius and Knigge (2007) Pretorius ML, Knigge C (2007) Discovery of a new cataclysmic variable through optical variability and X-ray emission. A&A461(3):1103–1106, DOI 10.1051/0004-6361:20066418, \urlastro-ph/0610527
- Prialnik and Kovetz (1995) Prialnik D, Kovetz A (1995) An Extended Grid of Multicycle Nova Evolution Models. ApJ445:789, DOI 10.1086/175741
- Prialnik et al (1978) Prialnik D, Shara MM, Shaviv G (1978) The evolution of a slow nova model with a Z = 0.03 envelope from pre-explosion to extinction. A&A62(3):339–348
- Prialnik et al (1982) Prialnik D, Livio M, Shaviv G, Kovetz A (1982) On the role of the accretion rate in nova outbursts. ApJ257:312–317, DOI 10.1086/159990
- Pritchet and van den Bergh (1987) Pritchet CJ, van den Bergh S (1987) Observations of Novae in the Virgo Cluster. ApJ318:507, DOI 10.1086/165387
- Rafanelli and Rosino (1978) Rafanelli P, Rosino L (1978) The spectral evolution of nova HR Del (1967) during its decline. A&AS31:337–352
- Ramírez et al (2012) Ramírez I, Fish JR, Lambert DL, Allende Prieto C (2012) Lithium Abundances in nearby FGK Dwarf and Subgiant Stars: Internal Destruction, Galactic Chemical Evolution, and Exoplanets. ApJ756(1):46, DOI 10.1088/0004-637X/756/1/46, \url1207.0499
- Reeves et al (1990) Reeves H, Richer J, Sato K, Terasawa N (1990) On the Origin of Lithium. ApJ355:18, DOI 10.1086/168736
- Ribeiro et al (2009) Ribeiro VARM, Bode MF, Darnley MJ, Harman DJ, Newsam AM, O’Brien TJ, Bohigas J, Echevarría JM, Bond HE, Chavushyan VH, Costero R, Coziol R, Evans A, Eyres SPS, León-Tavares J, Richer MG, Tovmassian G, Starrfield S, Zharikov SV (2009) The Expanding Nebular Remnant of the Recurrent Nova RS Ophiuchi (2006). II. Modeling of Combined Hubble Space Telescope Imaging and Ground-based Spectroscopy. ApJ703(2):1955–1963, DOI 10.1088/0004-637X/703/2/1955, \url0908.2704
- Ribeiro et al (2013a) Ribeiro VARM, Bode MF, Darnley MJ, Barnsley RM, Munari U, Harman DJ (2013a) Morpho-kinematical modelling of Nova Eridani 2009 (KT Eri). MNRAS433(3):1991–1996, DOI 10.1093/mnras/stt856, \url1305.3834
- Ribeiro et al (2013b) Ribeiro VARM, Munari U, Valisa P (2013b) Optical Morphology, Inclination, and Expansion Velocity of the Ejected Shell of Nova Monocerotis 2012. ApJ768(1):49, DOI 10.1088/0004-637X/768/1/49, \url1303.3715
- Rich et al (1989) Rich RM, Mould J, Picard A, Frogel JA, Davies R (1989) Luminous M Giants in the Bulge of M31. ApJ341:L51, DOI 10.1086/185455
- Riess et al (1998) Riess AG, Filippenko AV, Challis P, Clocchiatti A, Diercks A, Garnavich PM, Gilliland RL, Hogan CJ, Jha S, Kirshner RP, Leibundgut B, Phillips MM, Reiss D, Schmidt BP, Schommer RA, Smith RC, Spyromilio J, Stubbs C, Suntzeff NB, Tonry J (1998) Observational Evidence from Supernovae for an Accelerating Universe and a Cosmological Constant. AJ116(3):1009–1038, DOI 10.1086/300499, \urlastro-ph/9805201
- Riess et al (2012) Riess AG, Fliri J, Valls-Gabaud D (2012) Cepheid Period-Luminosity Relations in the Near-infrared and the Distance to M31 from the Hubble Space Telescope Wide Field Camera 3. ApJ745(2):156, DOI 10.1088/0004-637X/745/2/156, \url1110.3769
- Riess et al (2019) Riess AG, Casertano S, Yuan W, Macri LM, Scolnic D (2019) Large Magellanic Cloud Cepheid Standards Provide a 1% Foundation for the Determination of the Hubble Constant and Stronger Evidence for Physics beyond CDM. ApJ876(1):85, DOI 10.3847/1538-4357/ab1422, \url1903.07603
- Ritchey (1917a) Ritchey GW (1917a) Another Faint Nova in the Andromeda Nebula. PASP29(172):257, DOI 10.1086/122653
- Ritchey (1917b) Ritchey GW (1917b) Novae in Spiral Nebulae. PASP29(171):210, DOI 10.1086/122638
- Ritchey (1918) Ritchey GW (1918) Three Additional Novae in the Andromeda Nebula. PASP30(174):162, DOI 10.1086/122710
- Ritter et al (1991) Ritter H, Politano M, Livio M, Webbink RF (1991) The White Dwarf Mass Distribution in Classical Nova Systems. ApJ376:177, DOI 10.1086/170265
- Robbins (1968a) Robbins RR (1968a) The Helium Triplet Spectrum in Expanding Nebulae. I. The Capture-Cascade Intensities. ApJ151:497, DOI 10.1086/149452
- Robbins (1968b) Robbins RR (1968b) The Helium Triplet Spectrum in Expanding Nebulae, II. Self-Absorption. ApJ151:511, DOI 10.1086/149453
- Robinson (1975) Robinson EL (1975) Preeruption light curves of novae2. AJ80:515, DOI 10.1086/111774
- Romano and Matteucci (2003) Romano D, Matteucci F (2003) Nova nucleosynthesis and Galactic evolution of the CNO isotopes. MNRAS342(1):185–198, DOI 10.1046/j.1365-8711.2003.06526.x, \urlastro-ph/0302233
- Romano et al (2001) Romano D, Matteucci F, Ventura P, D’Antona F (2001) The stellar origin of 7Li. Do AGB stars contribute a substantial fraction of the local Galactic lithium abundance? A&A374:646–655, DOI 10.1051/0004-6361:20010751, \urlastro-ph/0105483
- Rosino (1956) Rosino L (1956) Nuove ricerche sulle stelle variabili della nebulosa di Orione. Mem. Soc. Astr. It.27:335
- Rosino (1964) Rosino L (1964) Novae in Messier 31 discovered and observed at Asiago from 1955 to 1963. Annales d’Astrophysique 27:498–505
- Rosino (1973) Rosino L (1973) Novae in M 31 discovered and observed at Asiago from 1963 to 1970. A&AS9:347
- Rosino and Bianchini (1973) Rosino L, Bianchini A (1973) Discovery of Five Novae in Messier 33 and a Supernova in a Field Galaxy. A&A22:461
- Rosino et al (1986) Rosino L, Ciatti F, Della Valle M (1986) Researches on novae and related objects. I. The spectral evolution of nova FH SER (1970). A&A158:34–44
- Rosino et al (1989) Rosino L, Capaccioli M, D’Onofrio M, Della Valle M (1989) Fifty-Two Novae in M31 Discovered and Observed at Asiago from 1971 to 1986. AJ97:83, DOI 10.1086/114959
- Roy et al (2012a) Roy N, Chomiuk L, Sokoloski JL, Weston J, Rupen MP, Johnson T, Krauss MI, Nelson T, Mukai K, Mioduszewski A, Bode MF, Eyres SPS, O’Brien TJ (2012a) Radio studies of novae: a current status report and highlights of new results. Bull Astron Soc India 40:293–310, \url1302.4455
- Roy et al (2012b) Roy N, Kantharia NG, Eyres SPS, Anupama GC, Bode MF, Prabhu TP, O’Brien TJ (2012b) An H I shell-like structure associated with nova V458 Vulpeculae? MNRAS427(1):L55–L59, DOI 10.1111/j.1745-3933.2012.01344.x, \url1209.2431
- Rupen et al (2008) Rupen MP, Mioduszewski AJ, Sokoloski JL (2008) An Expanding Shell and Synchrotron Jet in RS Ophiuchi. ApJ688(1):559–567, DOI 10.1086/525555, \url0711.1142
- Sackmann and Boothroyd (1992) Sackmann IJ, Boothroyd AI (1992) The Creation of Superrich Lithium Giants. ApJ392:L71, DOI 10.1086/186428
- Sackmann and Boothroyd (1999) Sackmann IJ, Boothroyd AI (1999) Creation of 7Li and Destruction of 3He, 9Be, 10B, and 11B in Low-Mass Red Giants, Due to Deep Circulation. ApJ510(1):217–231, DOI 10.1086/306545
- Sadakane et al (2010) Sadakane K, Tajitsu A, Mizoguchi S, Arai A, Naito H (2010) Discovery of Multiple High-Velocity Narrow Circumstellar NaI D Lines in Nova V1280 Sco. PASJ62:L5, DOI 10.1093/pasj/62.1.L5, \url0911.5229
- Sanford (1918) Sanford RF (1918) Two Novae in the Andromeda Nebula. PASP30(178):341, DOI 10.1086/122772
- Sanford (1919) Sanford RF (1919) Two New Novae in the Andromeda Nebula. PASP31(180):109, DOI 10.1086/122832
- Santamaría et al (2020) Santamaría E, Guerrero MA, Ramos-Larios G, Toalá JA, Sabin L, Rubio G, Quino-Mendoza JA (2020) Angular Expansion of Nova Shells. ApJ892(1):60, DOI 10.3847/1538-4357/ab76c5, \url2002.06749
- Sawyer (1938) Sawyer HB (1938) The Bright Nova of 1860 in the Globular Cluster Messier 80. and its Relation to Supernovae. J. Royal. Astr. Soc. Canada32:69
- Sawyer Hogg and Wehlau (1964) Sawyer Hogg H, Wehlau A (1964) Probable nova in the globular cluster M 14. AJ69:141
- Sbordone et al (2010) Sbordone L, Bonifacio P, Caffau E, Ludwig HG, Behara NT, González Hernández JI, Steffen M, Cayrel R, Freytag B, van’t Veer C, Molaro P, Plez B, Sivarani T, Spite M, Spite F, Beers TC, Christlieb N, François P, Hill V (2010) The metal-poor end of the Spite plateau. I. Stellar parameters, metallicities, and lithium abundances. A&A522:A26, DOI 10.1051/0004-6361/200913282, \url1003.4510
- Schaefer (2018) Schaefer BE (2018) The distances to Novae as seen by Gaia. MNRAS481(3):3033–3051, DOI 10.1093/mnras/sty2388, \url1809.00180
- Schaefer et al (2014) Schaefer GH, Brummelaar TT, Gies DR, Farrington CD, Kloppenborg B, Chesneau O, Monnier JD, Ridgway ST, Scott N, Tallon-Bosc I, McAlister HA, Boyajian T, Maestro V, Mourard D, Meilland A, Nardetto N, Stee P, Sturmann J, Vargas N, Baron F, Ireland M, Baines EK, Che X, Jones J, Richardson ND, Roettenbacher RM, Sturmann L, Turner NH, Tuthill P, van Belle G, von Braun K, Zavala RT, Banerjee DPK, Ashok NM, Joshi V, Becker J, Muirhead PS (2014) The expanding fireball of Nova Delphini 2013. Nature515(7526):234–236, DOI 10.1038/nature13834, \url1505.04852
- Schatzman (1951) Schatzman E (1951) Remarques sur le phénomène de Nova: IV. L’onde de détonation due à l’isotope 3He. Annales d’Astrophysique 14:294
- Schmidt et al (1998) Schmidt BP, Suntzeff NB, Phillips MM, Schommer RA, Clocchiatti A, Kirshner RP, Garnavich P, Challis P, Leibundgut B, Spyromilio J, Riess AG, Filippenko AV, Hamuy M, Smith RC, Hogan C, Stubbs C, Diercks A, Reiss D, Gilliland R, Tonry J, Maza J, Dressler A, Walsh J, Ciardullo R (1998) The High-Z Supernova Search: Measuring Cosmic Deceleration and Global Curvature of the Universe Using Type IA Supernovae. ApJ507(1):46–63, DOI 10.1086/306308, \urlastro-ph/9805200
- Schmidt (1957) Schmidt T (1957) Die Lichtkurven-Leuchtkraft-Beziehung Neuer Sterne. Mit 8 Textabbildungen. ZAP41:182
- Schwarz (2002) Schwarz GJ (2002) A New Abundance Analysis of the ONeMg Nova QU Vulpeculae. ApJ577(2):940–950, DOI 10.1086/342234
- Schwarz et al (2001) Schwarz GJ, Shore SN, Starrfield S, Hauschildt PH, Della Valle M, Baron E (2001) Multiwavelength analyses of the extraordinary nova LMC 1991∗. MNRAS320(1):103–123, DOI 10.1046/j.1365-8711.2001.03960.x
- Schwarz et al (2007) Schwarz GJ, Shore SN, Starrfield S, Vanlandingham KM (2007) Abundance Analysis of the Extremely Fast ONeMg Novae V838 Herculis and V4160 Sagittarii. ApJ657(1):453–464, DOI 10.1086/510661
- Schwarz et al (2011) Schwarz GJ, Ness JU, Osborne JP, Page KL, Evans PA, Beardmore AP, Walter FM, Helton LA, Woodward CE, Bode M, Starrfield S, Drake JJ (2011) Swift X-Ray Observations of Classical Novae. II. The Super Soft Source Sample. ApJS197(2):31, DOI 10.1088/0067-0049/197/2/31, \url1110.6224
- Schwope (2018) Schwope AD (2018) Exploring the space density of X-ray selected cataclysmic variables. A&A619:A62, DOI 10.1051/0004-6361/201833723, \url1808.08144
- Schwope et al (2002) Schwope AD, Brunner H, Buckley D, Greiner J, Heyden Kvd, Neizvestny S, Potter S, Schwarz R (2002) The census of cataclysmic variables in the ROSAT Bright Survey. A&A396:895–910, DOI 10.1051/0004-6361:20021386, \urlastro-ph/0210059
- Seaquist and Palimaka (1977) Seaquist ER, Palimaka J (1977) Thick inhomogeneous shell models for the radio emission from Nova Serpentis 1970. ApJ217:781–787, DOI 10.1086/155625
- Selvelli and Gilmozzi (2013) Selvelli P, Gilmozzi R (2013) An archive study of 18 old novae. I. The UV spectra. A&A560:A49, DOI 10.1051/0004-6361/201220627
- Selvelli and Gilmozzi (2019) Selvelli P, Gilmozzi R (2019) A UV and optical study of 18 old novae with Gaia DR2 distances: mass accretion rates, physical parameters, and MMRD. A&A622:A186, DOI 10.1051/0004-6361/201834238, \url1903.05868
- Selvelli et al (2008) Selvelli P, Cassatella A, Gilmozzi R, González-Riestra R (2008) The secrets of T Pyxidis. II. A recurrent nova that will not become a SN Ia. A&A492(3):787–803, DOI 10.1051/0004-6361:200810678, \url0904.1146
- Selvelli et al (2018) Selvelli P, Molaro P, Izzo L (2018) Absorption and emission features of 7Be II in the outburst spectra of V838 Her (Nova Her 1991). MNRAS481(2):2261–2272, DOI 10.1093/mnras/sty2310, \url1809.04180
- Shafter (1997) Shafter AW (1997) On the Nova Rate in the Galaxy. ApJ487(1):226–236, DOI 10.1086/304609
- Shafter (2013) Shafter AW (2013) Photometric and Spectroscopic Properties of Novae in the Large Magellanic Cloud. AJ145(5):117, DOI 10.1088/0004-6256/145/5/117, \url1302.6285
- Shafter (2017) Shafter AW (2017) The Galactic Nova Rate Revisited. ApJ834(2):196, DOI 10.3847/1538-4357/834/2/196, \url1606.02358
- Shafter (2019) Shafter AW (2019) Extragalactic Novae; A historical perspective. IOP Publishing, Bristol, DOI 10.1088/2514-3433/ab2c63
- Shafter and Irby (2001) Shafter AW, Irby BK (2001) On the Spatial Distribution, Stellar Population, and Rate of Novae in M31. ApJ563(2):749–767, DOI 10.1086/324044
- Shafter et al (2000) Shafter AW, Ciardullo R, Pritchet CJ (2000) Novae in External Galaxies: M51, M87, and M101. ApJ530(1):193–206, DOI 10.1086/308349
- Shafter et al (2011) Shafter AW, Darnley MJ, Hornoch K, Filippenko AV, Bode MF, Ciardullo R, Misselt KA, Hounsell RA, Chornock R, Matheson T (2011) A Spectroscopic and Photometric Survey of Novae in M31. ApJ734(1):12, DOI 10.1088/0004-637X/734/1/12, \url1104.0222
- Shafter et al (2012) Shafter AW, Darnley MJ, Bode MF, Ciardullo R (2012) On the Spectroscopic Classes of Novae in M33. ApJ752(2):156, DOI 10.1088/0004-637X/752/2/156, \url1204.4850
- Shafter et al (2015) Shafter AW, Henze M, Rector TA, Schweizer F, Hornoch K, Orio M, Pietsch W, Darnley MJ, Williams SC, Bode MF, Bryan J (2015) Recurrent Novae in M31. ApJS216(2):34, DOI 10.1088/0067-0049/216/2/34, \url1412.8510
- Shapley (1917) Shapley H (1917) A Faint Nova in the Nebula of Andromeda. PASP29(171):213–217, DOI 10.1086/122669
- Shara (1981) Shara MM (1981) A theoretical explanation of the absolute magnitude-decline time relationship for classical novae. ApJ243:926–934, DOI 10.1086/158657
- Shara et al (1986) Shara MM, Livio M, Moffat AFJ, Orio M (1986) Do Novae Hibernate during Most of the Millennia between Eruptions? Links between Dwarf and Classical Novae, and Implications for the Space Densities and Evolution of Cataclysmic Binaries. ApJ311:163, DOI 10.1086/164762
- Shara et al (1990) Shara MM, Moffat AFJ, Potter M (1990) Spectroscopic Authentication of Very Old Nova Candidates. AJ100:540, DOI 10.1086/115535
- Shara et al (1999) Shara MM, Sandage A, Zurek DR (1999) The Early Palomar Program (1950-1955) for the Discovery of Classical Novae in M81: Analysis of the Spatial Distribution, Magnitude Distribution, and Distance Suggestion. PASP111(765):1367–1381, DOI 10.1086/316449, \urlastro-ph/9907400
- Shara et al (2004) Shara MM, Zurek DR, Baltz EA, Lauer TR, Silk J (2004) An Erupting Classical Nova in a Globular Cluster of M87. ApJ605(2):L117–L120, DOI 10.1086/420882, \urlastro-ph/0401444
- Shara et al (2007) Shara MM, Martin CD, Seibert M, Rich RM, Salim S, Reitzel D, Schiminovich D, Deliyannis CP, Sarrazine AR, Kulkarni SR, Ofek EO, Brosch N, Lépine S, Zurek D, De Marco O, Jacoby G (2007) An ancient nova shell around the dwarf nova Z Camelopardalis. Nature446(7132):159–162, DOI 10.1038/nature05576
- Shara et al (2012) Shara MM, Mizusawa T, Wehinger P, Zurek D, Martin CD, Neill JD, Forster K, Seibert M (2012) AT Cnc: A Second Dwarf Nova with a Classical Nova Shell. ApJ758(2):121, DOI 10.1088/0004-637X/758/2/121, \url1208.1280
- Shara et al (2015) Shara MM, Zurek D, Schaefer BE, Bond HE, Godon P, Mac Low MM, Pagnotta A, Prialnik D, Sion EM, Toraskar J, Williams RE (2015) HST Images Flash Ionization of Old Ejecta by the 2011 Eruption of Recurrent Nova T Pyxidis. ApJ805(2):148, DOI 10.1088/0004-637X/805/2/148, \url1503.08840
- Shara et al (2016) Shara MM, Doyle TF, Lauer TR, Zurek D, Neill JD, Madrid JP, Mikołajewska J, Welch DL, Baltz EA (2016) A Hubble Space Telescope Survey for Novae in M87. I. Light and Color Curves, Spatial Distributions, and the Nova Rate. ApJS227(1):1, DOI 10.3847/0067-0049/227/1/1, \url1602.00758
- Shara et al (2017a) Shara MM, Doyle T, Lauer TR, Zurek D, Baltz EA, Kovetz A, Madrid JP, Mikołajewska J, Neill JD, Prialnik D, Welch DL, Yaron O (2017a) A Hubble Space Telescope Survey for Novae in M87. II. Snuffing out the Maximum Magnitude-Rate of Decline Relation for Novae as a Non-standard Candle, and a Prediction of the Existence of Ultrafast Novae. ApJ839(2):109, DOI 10.3847/1538-4357/aa65cd, \url1702.05788
- Shara et al (2017b) Shara MM, Iłkiewicz K, Mikołajewska J, Pagnotta A, Bode MF, Crause LA, Drozd K, Faherty J, Fuentes-Morales I, Grindlay JE (2017b) Proper-motion age dating of the progeny of Nova Scorpii AD 1437. Nature548(7669):558–560, DOI 10.1038/nature23644, \url1704.00086
- Shara et al (2018) Shara MM, Doyle TF, Pagnotta A, Garland JT, Lauer TR, Zurek D, Baltz EA, Goerl A, Kovetz A, Machac T, Madrid JP, Mikołajewska J, Neill JD, Prialnik D, Welch DL, Yaron O (2018) A Hubble Space Telescope survey for novae in M87 - III. Are novae good standard candles 15 d after maximum brightness? MNRAS474(2):1746–1751, DOI 10.1093/mnras/stx2873, \url1702.06988
- Sharov (1972) Sharov AS (1972) Estimate for the Frequency of Novae in the Andromeda Nebula and our Galaxy. Sov. Astr.16:41
- Sharov (1979) Sharov AS (1979) The maximum luminosity-rate of decline relation and the problem of distance determination of novae. Peremennye Zvezdy 21:141–147
- Sharov (1993) Sharov AS (1993) The rate of explosions of novae in galaxies of the Local Group. Astronomy Letters 19:147
- Shore (2012) Shore SN (2012) Spectroscopy of novae – a user’s manual. Bull Astron Soc India 40:185, \url1211.3176
- Shore (2013) Shore SN (2013) A unified model for the spectrophotometric development of classical and recurrent novae. The role of asphericity of the ejecta. A&A559:L7, DOI 10.1051/0004-6361/201322470, \url1309.7388
- Shore et al (1993) Shore SN, Sonneborn G, Starrfield S, Riestra-Gonzalez R, Ake TB (1993) The Early Ultraviolet Spectral Evolution of Nova Cygni 1992. AJ106:2408, DOI 10.1086/116812
- Shore et al (1996) Shore SN, Starrfield S, Sonneborn G (1996) The Ultraviolet and X-Ray View of the Demise of Nova V1974 Cygni. ApJ463:L21, DOI 10.1086/310045
- Shore et al (2003) Shore SN, Schwarz G, Bond HE, Downes RA, Starrfield S, Evans A, Gehrz RD, Hauschildt PH, Krautter J, Woodward CE (2003) The Early Ultraviolet Evolution of the ONeMg Nova V382 Velorum 1999. AJ125(3):1507–1518, DOI 10.1086/367803, \urlastro-ph/0301415
- Shore et al (2011) Shore SN, Augusteijn T, Ederoclite A, Uthas H (2011) The spectroscopic evolution of the recurrent nova T Pyxidis during its 2011 outburst. I. The optically thick phase and the origin of moving lines in novae. A&A533:L8, DOI 10.1051/0004-6361/201117721, \url1108.3505
- Shore et al (2018) Shore SN, Kuin NP, Mason E, De Gennaro Aquino I (2018) Spectroscopic diagnostics of dust formation and evolution in classical nova ejecta. A&A619:A104, DOI 10.1051/0004-6361/201833204, \url1807.07174
- Siegert et al (2018) Siegert T, Coc A, Delgado L, Diehl R, Greiner J, Hernanz M, Jean P, José J, Molaro P, Pleintinger MMM, Savchenko V, Starrfield S, Tatischeff V, Weinberger C (2018) Gamma-ray observations of Nova Sgr 2015 No. 2 with INTEGRAL. A&A615:A107, DOI 10.1051/0004-6361/201732514, \url1803.06888
- Slavin et al (1995) Slavin AJ, O’Brien TJ, Dunlop JS (1995) A deep optical imaging study of the nebular remnants of classical novae. MNRAS276(2):353–371, DOI 10.1093/mnras/276.2.353
- Smith et al (1998) Smith DA, Dhillon VS, Marsh TR (1998) The mass of the white dwarf in the old nova BT MON. MNRAS296(3):465–482, DOI 10.1046/j.1365-8711.1998.00743.x, \urlastro-ph/9709186
- Sokoloski et al (2008) Sokoloski JL, Rupen MP, Mioduszewski AJ (2008) Uncovering the Nature of Nova Jets: A Radio Image of Highly Collimated Outflows from RS Ophiuchi. ApJ685(2):L137, DOI 10.1086/592602
- Soraisam (2016) Soraisam MD (2016) Novae a theoretical and observational study. PhD thesis, Ludwig-Maximilians-Universitat Munchen
- Sparks (1969) Sparks WM (1969) Dynamical Models of Novae. ApJ156:569, DOI 10.1086/149990
- Sparks et al (1977) Sparks WM, Starrfield S, Truran JW (1977) A Review of the Thermonuclear Runaway Model of a Nova Outburst. In: Friedjung M (ed) Novae and Related Stars, D. Reidel, Dordrecht, Astrophysics and Space Science Library, vol 65, p 189, DOI 10.1007/978-94-010-1217-1_45
- Sparks et al (1978) Sparks WM, Starrfield S, Truran JW (1978) A hydrodynamic study of a slow nova outburst. ApJ220:1063–1075, DOI 10.1086/155992
- Spite (1990) Spite F (1990) Lithium in population II stars. Mem. Soc. Astr. It.61:663–675
- Spite and Spite (1982) Spite F, Spite M (1982) Abundance of lithium in unevolved halo stars and old disk stars - Interpretation and consequences. A&A115:357–366
- Starrfield (1999) Starrfield S (1999) Recent advances in studies of the nova outburst. Phys. Rept.311:371–381, DOI 10.1016/S0370-1573(98)00116-1
- Starrfield et al (1978) Starrfield S, Truran JW, Sparks WM, Arnould M (1978) On 7Li production in nova explosions. ApJ222:600–603, DOI 10.1086/156175
- Starrfield et al (1998) Starrfield S, Schwarz GJ, Truran JW, Sparks WM (1998) Hydrodynamic Studies of the Evolution of the Extraordinary Nova LMC 1991. In: American Astronomical Society Meeting Abstracts, vol 193, p 101.06
- Starrfield et al (2000) Starrfield S, Sparks WM, Truran JW, Wiescher MC (2000) The Effects of New Nuclear Reaction Rates and Opacities on Hydrodynamic Simulations of the Nova Outburst. ApJS127(2):485–495, DOI 10.1086/313336
- Starrfield et al (2009) Starrfield S, Iliadis C, Hix WR, Timmes FX, Sparks WM (2009) The Effects of the pep Nuclear Reaction and Other Improvements in the Nuclear Reaction Rate Library on Simulations of the Classical Nova Outburst. ApJ692(2):1532–1542, DOI 10.1088/0004-637X/692/2/1532, \url0811.0197
- Starrfield et al (2019) Starrfield S, Bose M, Iliadis C, Hix WR, Woodward CE, Wagner RM (2019) Carbon-Oxygen Classical Novae are Galactic 7Li Producers as well as Potential Supernova Ia Progenitors. arXiv e-prints arXiv:1910.00575, \url1910.00575
- Starrfield et al (1975) Starrfield SG, Sparks WM, Truran JW (1975) Accretion and the nova outburst. Memoires of the Societe Royale des Sciences de Liege 8:413–424
- Stickland et al (1981) Stickland DJ, Penn CJ, Seaton MJ, Snijders MAJ, Storey PJ (1981) Nova Cygni 1978 - I. The nebular phase. MNRAS197:107–138, DOI 10.1093/mnras/197.1.107
- Subramaniam and Anupama (2002) Subramaniam A, Anupama GC (2002) The local stellar population of nova regions in the Large Magellanic Cloud. A&A390:449–471, DOI 10.1051/0004-6361:20020742, \urlastro-ph/0203098
- Tajitsu et al (2015) Tajitsu A, Sadakane K, Naito H, Arai A, Aoki W (2015) Explosive lithium production in the classical nova V339 Del (Nova Delphini 2013). Nature518(7539):381–384, DOI 10.1038/nature14161, \url1502.05598
- Tajitsu et al (2016) Tajitsu A, Sadakane K, Naito H, Arai A, Kawakita H, Aoki W (2016) The 7Be II Resonance Lines in Two Classical Novae V5668 Sgr and V2944 Oph. ApJ818(2):191, DOI 10.3847/0004-637X/818/2/191, \url1601.05168
- Takei et al (2011) Takei D, Ness JU, Tsujimoto M, Kitamoto S, Drake JJ, Osborne JP, Takahashi H, Kinugasa K (2011) X-Ray Study of Rekindled Accretion in the Classical Nova V2491 Cygni. PASJ63:S729–S738, DOI 10.1093/pasj/63.sp3.S729, \url1102.2436
- Tappert et al (2014) Tappert C, Vogt N, Della Valle M, Schmidtobreick L, Ederoclite A (2014) Life after eruption - IV. Spectroscopy of 13 old novae. MNRAS442(1):565–576, DOI 10.1093/mnras/stu781, \url1405.3635
- Taylor et al (1988) Taylor AR, Hjellming RM, Seaquist ER, Gehrz RD (1988) Radio images of the expanding ejecta of nova QU Vulpeculae 1984. Nature335(6187):235–238, DOI 10.1038/335235a0
- Tomaney and Shafter (1992) Tomaney AB, Shafter AW (1992) The Spectroscopic and Photometric Evolution of Novae in the Bulge of M31. ApJS81:683, DOI 10.1086/191702
- Tornambe and Matteucci (1986) Tornambe A, Matteucci F (1986) Type I SNe from double degenerate CO dwarfs and their rate in the solar neighbourhood. MNRAS223:69–77, DOI 10.1093/mnras/223.1.69
- Townsley and Bildsten (2004) Townsley DM, Bildsten L (2004) Physical Interpretation of Dwarf Nova Primary Effective Temperatures. In: Tovmassian G, Sion E (eds) Compact Binaries in the Galaxy and Beyond, Rev. Mex. Astron. Astrofis. Conf. Ser., vol 20, pp 192–193
- Travaglio et al (2001) Travaglio C, Randich S, Galli D, Lattanzio J, Elliott LM, Forestini M, Ferrini F (2001) Galactic Chemical Evolution of Lithium: Interplay between Stellar Sources. ApJ559(2):909–924, DOI 10.1086/322415, \urlastro-ph/0105558
- Truran and Livio (1986) Truran JW, Livio M (1986) On the Frequency of Occurrence of Oxygen-Neon-Magnesium White Dwarfs in Classical Nova Systems. ApJ308:721, DOI 10.1086/164544
- Vainu Bappu and Menzel (1954) Vainu Bappu MK, Menzel DH (1954) Emission-Line Profiles from Expanding Envelopes. ApJ119:508, DOI 10.1086/145857
- van den Bergh (1988) van den Bergh S (1988) Novae, Supernovae, and the Island Universe Hypothesis. PASP100:8, DOI 10.1086/132129
- van den Bergh (1991) van den Bergh S (1991) The Stellar Populations of M31. PASP103:1053, DOI 10.1086/132925
- van den Bergh (1996) van den Bergh S (1996) The Extragalactic Distance Scale. PASP108:1091–1096, DOI 10.1086/133839, \urlastro-ph/9604070
- van den Bergh and Younger (1987) van den Bergh S, Younger PF (1987) UBV photometry of novae. A&AS70:125–140
- Vanlandingham et al (1996) Vanlandingham KM, Starrfield S, Wagner RM, Shore SN, Sonneborn G (1996) Optical and ultraviolet spectrophotometry of the ONeMg Nova V838 Herculis 1991. MNRAS282(2):563–579, DOI 10.1093/mnras/282.2.563
- Vanlandingham et al (1997) Vanlandingham KM, Starrfield S, Shore SN (1997) Elemental abundances for Nova V693 Coronae Austrinae 1981. MNRAS290(1):87–98, DOI 10.1093/mnras/290.1.87
- Vanlandingham et al (2001) Vanlandingham KM, Schwarz GJ, Shore SN, Starrfield S (2001) Nuclear Turnoff Times for ONEMG Novae Determined Using Ultraviolet Spectral Evolution. AJ121(2):1126–1135, DOI 10.1086/318778
- Vlasov et al (2016) Vlasov A, Vurm I, Metzger BD (2016) Shocks in nova outflows – II. Synchrotron radio emission. MNRAS463(1):394–412, DOI 10.1093/mnras/stw1949, \url1603.05194
- Vogt (1990) Vogt N (1990) Evidence for Hibernation from a Statistical Analysis of Nova Eruption Amplitudes. ApJ356:609, DOI 10.1086/168866
- Vorontsov-Velyaminov (1947) Vorontsov-Velyaminov B (1947) The blue-white sequence. The Observatory 67:224–226
- Vurm and Metzger (2018) Vurm I, Metzger BD (2018) High-energy Emission from Nonrelativistic Radiative Shocks: Application to Gamma-Ray Novae. ApJ852(1):62, DOI 10.3847/1538-4357/aa9c4a, \url1611.04532
- Wade and Hjellming (1971) Wade CM, Hjellming RM (1971) Further Radio Observations of Novae. ApJ163:L65, DOI 10.1086/180668
- Wade et al (2000) Wade RA, Harlow JJB, Ciardullo R (2000) Biases in Expansion Distances of Novae Arising from the Prolate Geometry of Nova Shells. PASP112(771):614–624, DOI 10.1086/316566, \urlastro-ph/0003296
- Wagner et al (2018) Wagner RM, Woodward CE, Starrfield S, Ilyin I, Strassmeier K (2018) High Resolution Optical Spectroscopy of the Classical Nova V5668 Sgr Showing the Presence of Lithium. In: American Astronomical Society Meeting Abstracts, vol 231, p 358.10
- Walker (1954) Walker MF (1954) Nova DQ Herculis (1934): an Eclipsing Binary with Very Short Period. PASP66(392):230, DOI 10.1086/126703
- Walterbos (1986) Walterbos RAM (1986) The Relation Between Dust and Gas in the Andromeda Galaxy. In: Bull. Am. Astr. Soc., vol 18, p 915
- Warner (2001) Warner B (2001) Cataclysmic Variables: A ’SWOT’ Analysis. In: Paczynski B, Chen WP, Lemme C (eds) Small Telescope Astronomy on Global Scales, Astronomical Society of the Pacific, ASP Conference Series, vol 246, p 159
- Warner (2003) Warner B (2003) Cataclysmic Variable Stars. Cambridge University Press, Cambridge, UK, DOI 10.1017/CBO9780511586491
- Webbink (1984) Webbink RF (1984) Double white dwarfs as progenitors of R Coronae Borealis stars and type I supernovae. ApJ277:355–360, DOI 10.1086/161701
- Welch and MACHO Collaboration (1999a) Welch DL, MACHO Collaboration (1999a) Nova in the Small Magellanic Cloud. IAU Circ.7121
- Welch and MACHO Collaboration (1999b) Welch DL, MACHO Collaboration (1999b) Nova in the Small Magellanic Cloud 1999 No. 4. IAU Circ.7308
- Wendeln et al (2017) Wendeln C, Chomiuk L, Finzell T, Linford JD, Strader J (2017) A Radio Emission Analysis of Classical Nova V351 Pup (1991). ApJ840(2):110, DOI 10.3847/1538-4357/aa6fab, \url1705.02926
- Wenzel and Meinunger (1978) Wenzel W, Meinunger I (1978) Note on the Population Type of Novae. Astron Nachr 299:239, DOI 10.1002/asna.19782990504
- Weston et al (2016a) Weston JHS, Sokoloski JL, Chomiuk L, Linford JD, Nelson T, Mukai K, Finzell T, Mioduszewski A, Rupen MP, Walter FM (2016a) Shock-powered radio emission from V5589 Sagittarii (Nova Sgr 2012 #1). MNRAS460(3):2687–2697, DOI 10.1093/mnras/stw1161, \url1510.06751
- Weston et al (2016b) Weston JHS, Sokoloski JL, Metzger BD, Zheng Y, Chomiuk L, Krauss MI, Linford JD, Nelson T, Mioduszewski AJ, Rupen MP, Finzell T, Mukai K (2016b) Non-thermal radio emission from colliding flows in classical nova V1723 Aql. MNRAS457(1):887–901, DOI 10.1093/mnras/stv3019, \url1505.05879
- Whelan and Iben (1973) Whelan J, Iben J Icko (1973) Binaries and Supernovae of Type I. ApJ186:1007–1014, DOI 10.1086/152565
- Wickramasinghe et al (2014) Wickramasinghe DT, Tout CA, Ferrario L (2014) The most magnetic stars. MNRAS437(1):675–681, DOI 10.1093/mnras/stt1910, \url1310.2696
- Williams (2012) Williams R (2012) Origin of the “He/N” and “Fe II” Spectral Classes of Novae. AJ144(4):98, DOI 10.1088/0004-6256/144/4/98, \url1208.0380
- Williams (2016) Williams R (2016) Transient classification and novae ejecta. J Phys: Conf Ser 728:042001, DOI 10.1088/1742-6596/728/4/042001
- Williams et al (2008) Williams R, Mason E, Della Valle M, Ederoclite A (2008) Transient Heavy Element Absorption Systems in Novae: Episodic Mass Ejection from the Secondary Star. ApJ685(1):451–462, DOI 10.1086/590056, \url0805.1372
- Williams (1977) Williams RE (1977) Element Abundance Analyses of Novae. In: Kippenhahn R, Rahe J, Strohmeier W (eds) IAU Colloq. 42: The Interaction of Variable Stars with their Environment, p 242
- Williams (1985) Williams RE (1985) CNO abundances in novae ejecta. In: ESO Workshop on Production and Distribution of C, N, O Elements, European Southern Observatory, Garching, ESO Conference and Workshop Proceedings, vol 21, pp 225–232
- Williams (1992) Williams RE (1992) The Formation of Novae Spectra. AJ104:725, DOI 10.1086/116268
- Williams (1994) Williams RE (1994) Extinction, Ejecta Masses, and Radial Velocities of Novae. ApJ426:279, DOI 10.1086/174062
- Williams et al (1991) Williams RE, Hamuy M, Phillips MM, Heathcote SR, Wells L, Navarrete M (1991) The Evolution and Classification of Postoutburst Novae Spectra. ApJ376:721, DOI 10.1086/170319
- Williams et al (1994) Williams RE, Phillips MM, Hamuy M (1994) The Tololo Nova Survey: Spectra of Recent Novae. ApJS90:297, DOI 10.1086/191864
- Williams and Shafter (2004) Williams SJ, Shafter AW (2004) On the Nova Rate in M33. ApJ612(2):867–876, DOI 10.1086/422833
- Woodward and Starrfield (2011) Woodward CE, Starrfield S (2011) Recent observational and theoretical studies of the classical nova outburst. Canadian Journal of Physics 89(4):333–343, DOI 10.1139/p11-010
- Woodward et al (1995) Woodward CE, Greenhouse MA, Gehrz RD, Pendleton YJ, Joyce RR, van Buren D, Fischer J, Jennerjohn NJ, Kaminski CD (1995) The Temporal Evolution of the 1–5 Micron Spectrum of V1974 Cygni (Nova Cygni 1992). ApJ438:921, DOI 10.1086/175134
- Woodward et al (1997) Woodward CE, Gehrz RD, Jones TJ, Lawrence GF, Skrutskie MF (1997) The Temporal Evolution of the Near-Infrared Light Curves of V1974 Cygni (Nova Cygni 1992). ApJ477(2):817–824, DOI 10.1086/303739
- Woudt et al (2004) Woudt PA, Warner B, Pretorius ML (2004) High-speed photometry of faint cataclysmic variables – IV. V356 Aql, Aqr1, FIRST J1023+0038, H 0242-2802, GI Mon, AO Oct, V972 Oph, SDSS 0155+00, SDSS 0233+00, SDSS 1240-01, SDSS 1556-00, SDSS 2050-05, FH Ser. MNRAS351(3):1015–1025, DOI 10.1111/j.1365-2966.2004.07843.x, \urlastro-ph/0403435
- Wygoda et al (2019) Wygoda N, Elbaz Y, Katz B (2019) Type Ia supernovae have two physical width-luminosity relations and they favour sub-Chandrasekhar and direct collision models – I. Bolometric. MNRAS484(3):3941–3950, DOI 10.1093/mnras/stz145, \url1711.00969
- Yaron et al (2005) Yaron O, Prialnik D, Shara MM, Kovetz A (2005) An Extended Grid of Nova Models. II. The Parameter Space of Nova Outbursts. ApJ623(1):398–410, DOI 10.1086/428435, \urlastro-ph/0503143
- Yungelson and Livio (1998) Yungelson L, Livio M (1998) Type IA Supernovae: an Examination of Potential Progenitors and the Redshift Distribution. ApJ497(1):168–177, DOI 10.1086/305455, \urlastro-ph/9711201
- Yungelson et al (1997) Yungelson L, Livio M, Tutukov A (1997) On The Rate of Novae in Galaxies of Different Types. ApJ481(1):127–131, DOI 10.1086/304020
- Zwicky (1936) Zwicky F (1936) Life-Luminosity Relation for Novae. PASP48(284):191, DOI 10.1086/124698