A search for new -ray blazars from infrared selected candidates
Abstract
We present a systematic study of gamma-ray blazar candidates based on a sample of 40 objects taken from the WIBR catalogue. By using a likelihood analysis, 26 of the 40 sources showed significant gamma-ray signatures . Using high-energy test statistics (TS) maps, we confirm 8 sources, which are completely new, and show another 15 promising -ray candidates. The results from this analysis show that a multi-frequency approach can help to improve the current description of the gamma-ray sky.
keywords:
Galaxies: active; gamma-rays: blazars.S. H. Negu, & S. B. Tessema, eds.
1 Introduction
Blazars are Active Galactic Nuclei (AGN) with relativistic jets pointed towards Earth (Urry et al., 1995). While blazars are rare extragalactic sources, they represent the largest fraction of gamma-ray sources (Abdo et al., 2010) and contribute to the extragalactic gamma-ray background (EGB) (Mukherjee et al., 1997; Abdo et al., 2010; Ajello et al., 2015). A complete description of the EGB is still an open issue in gamma-ray astronomy. Therefore, searching for new gamma-ray sources from low energy blazar candidates can improve the description of the gamma-ray sky (Arsioli et al., 2017).
2 Methods
The WIBR catalogue (D’Abrusco et al., 2014) contains 7855 sources. Many of them happen to be part of the 2WHSP catalogue (Chang et al., 2017) and 5BZcat (Massaro et al., 2015). We selected 40 sources from the WIBR catalogue which have no counterparts in the Fermi catalogue, therefore with focus on undetected gamma-ray sources.
-
(i)
The Spectral Energy Distributions (SEDs) were analysed using the ASDC SEDbuilder tool.
-
(ii)
The gamma-ray analysis was performed using Fermi science tools.
The significance () of the detections was determined using the Test Statistic (TS) parameter defined as:
(1) where is the null hypothesis, and is the likelihood value for a model with the additional candidate source at the same position (Mattox et al., 1996). The gamma-ray spectrum of the sources was assumed to be described by a power law model given by:
(2) where is pivot energy, is the prefactor (corresponding to the flux density in at and is the photon spectral index for a given energy range.
-
(iii)
TS maps were obtained by performing an unbinned likelihood analysis using Fermi science tools.
3 Results and discussion
3.1 Significant detections
In 3FGL and 4FGL catalogues, sources were detected at 4 significance (Acero et al., 2015; Abdollahi et al., 2020, respectively). However, in this analysis, sources with are considered to be –ray detections with low significance following the discussion from Arsioli et al. (2017, 2018). All cases with TS between 9 and 25 are considered to be a relevant excess signature, given that those cases actually have a multi-frequency counterpart (radio to X-rays) as expected from blazars.
Out of the 26 sources with a significant gamma-ray signature, 10 were detected with TS25 and 16 were detected with 9TS25. All these sources are entirely new detections out of previous Fermi catalogues.
3.2 New WIBR gamma-ray detections
Different TS maps were built with different photon energy cuts i.e., 950 MeV, 1 GeV, 2 GeV, 2.5 GeV, and 3 GeV. The TS maps were built taking into consideration the computational time and also to obtain the TS peak with the best resolution to better solve the gamma-ray signature as a point-like source. All these sources are at high Galactic latitudes (), avoiding the Galactic diffuse emission and also preventing spurious detections.
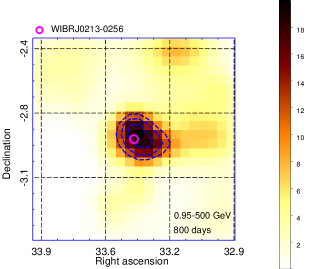
Out of the 26 new WIBR -ray detections, we built TS maps for 23 sources (both high and low significance detections). Three sources were not fully analysed due to very high photon counts that increased the computational heaviness. This is because those cases seemed more relevant at the lowest energy channel from Fermi-LAT () and building TS maps in this energy range becomes computationally far too heavy, especially if necessary to integrate over many years of observations. Out of the 23 TS maps built, 8 show a point-like source at the positions of the target sources and 15 sources could not be confirmed with high energy TS maps, but might be relevant at lower energies and therefore are flagged as promising -ray candidates. Figure 1 (left panel) shows a TS map of one of the new gamma-ray sources.
3.3 Promising gamma-ray candidates
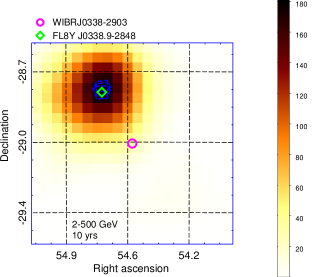
A total of 15 sources were found to be promising gamma-ray candidates. In some cases, the TS peak corresponded to closeby 4FGL sources or there was an FGL source within the region. In other cases, the signatures were identified as spurious. One of the promising gamma-ray candidates is shown in the right panel of Figure 1.
References
- Abdo et al. (2010) Abdo A. A., et al., 2010, ApJS, 188, 405
- Abdo et al. (2010) Abdo A. A., et al., 2010, ApJ, 720, 435
- Abdollahi et al. (2020) Abdollahi S., et al., 2020, ApJS, 247, 33
- Acero et al. (2015) Acero F., et al., 2015, ApJS, 218, 23
- Ajello et al. (2015) Ajello M., et al., 2015, ApJ, 800, 27
- Arsioli et al. (2017) Arsioli B. & Chang Y.-L., 2017, A&A, 598, 134
- Arsioli et al. (2018) Arsioli B. & Polenta G., 2018, A&A, 616, 20
- Chang et al. (2017) Chang Y.-L., Arsioli B., Giommi P. & Padovani P., 2017, A&A, 598, 17
- D’Abrusco et al. (2014) D’Abrusco R., et al., 2014, ApJS, 215, 14
- Massaro et al. (2015) Massaro E., et al., 2015, Ap&SS, 357, 75
- Mattox et al. (1996) Mattox J. R., et al., 1996, ApJ, 461, 396
- Mukherjee et al. (1997) Mukherjee R., et al., 1997, ApJ, 490, 116
- Urry et al. (1995) Urry C. M., & Padovani P., 1995, PASP, 107, 803