On the Incidence Rate of Blazhko Stars
Abstract
In a recent paper (Kovacs 2018) we examined the incidence rate of the modulated RR Lyrae stars by using the data from Campaigns 0104 of the Kepler K2 mission. We found an observed rate of %, implying near % underlying rate, after correcting for detection bias due to observational noise. In this work we extend the sample to Campaign 08 and check the reliability of our earlier estimate. We get the same high rate, stressing the importance of full time series modeling (including systematics) in searching for shallow signals in the presence of large amplitude variabilities.
1 Introduction
It is not easy to find an astrophysical phenomenon with as little clue to the physical nature of the cause of the phenomenon as the (quasi)periodic modulation of the light curves RR Lyrae stars (or, as commonly known, the Blazhko effect – Blažko 1907). Although several ideas have been suggested, none of them succeeded, likely because of the missing underlying physics in those ideas – see Kolláth in these proceedings and also earlier reviews of Kovacs (2016) and Smolec (2016). Under this circumstance, most of the works in this field focus on further analyses of observational data to spark some workable idea. In this purely experimental approach various studies aim for finding new frequency components, establishing relations among the observed parameters (e.g., Skarka et al. 2020) and derive accurate population parameters, such as incidence rates. In this work we follow the latter thread by extending our earlier work on the incidence rate of Blazhko stars (Kovacs 2018).
2 Method of Analysis
The hunt for transiting extrasolar planets has revolutionized the analysis of photometric time series. Considering the small signals to be searched for, filtering out systematic effects both from the ground- and space-based observations has become of vital importance. Many methods have been developed primarily for transiting planet search, e.g., TFA, SysRem, PDC, SFF, EVEREST, respectively, by Kovács et al. (2005), Tamuz et al. (2005), Stumpe et al. (2012), Vanderburg & Johnson (2014), Luger et al. (2018). However, only a few of these were extended to general variability search (Aigrain et al. 2016), primarily because of the difficulties encountered in separating the instrumental and environmental systematics from the underlying astrophysical signal. In particular, except for the very recent study by Plachy et al. (2019), all previous investigations on the Blazhko phenomenon have been carried out on datasets using Simple Aperture Photometry (SAP) for the space data (Benkő et al. 2014) and standard ensemble photometry for the ground-based data (e.g., analyses performed on the OGLE database – see Prudil & Skarka 2017).
The main reason why standard methods (e.g., SFF by Vanderburg & Johnson 2014) are not applicable to variable stars with dominating large amplitude variations is that these methods employ the “null-signal” assumption.111That is, there is no underlying variation, except for the brief moments of the transit events. Although inclusion of Gaussian process models has been proven to be a useful way of conserving stellar variability (Aigrain et al. 2016), here we resort to another approach, we have already employed in our pilot survey on Blazhko stars in fields C01-C04 of the K2 mission (Kovacs 2018).
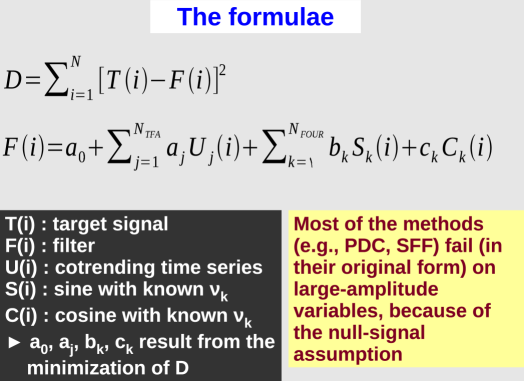
As briefly summarized in Fig. 1, the observed signal is represented by the sum of two distinct components: i) the large amplitude pulsation, modelled by the Fourier series and ii) systematics, estimated by the linear combination of the time series . This latter set may include other photometric time series from the same field (or, the combinations thereof – often referred to as cotrending vectors – e.g., Stumpe et al. 2012) and stellar image parameters (e.g., positions on the CCD chip). While using cotrending vectors enables us to grab the common features of the light variation (the very essence of systematics), the image parameters help to disentangle those variations in the stellar flux that have their origin in the peculiarities of the given stellar image (Bakos et al. 2010). For cotrending time series we select bright stars uniformly distributed throughout the field of the campaign under scrutiny. Whenever available, the cotrending set is extended by the pixel coordinates of the image center.
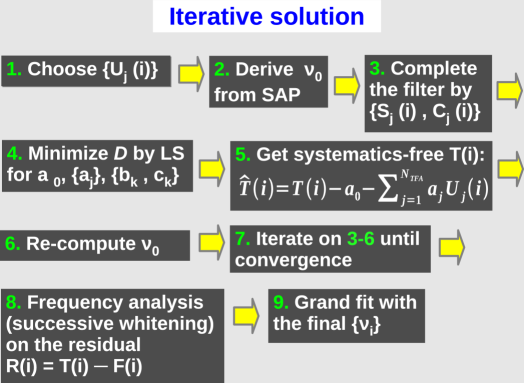
Because the pulsation frequency is known only approximately from the direct analysis of the SAP data, we need to perform an iterative search to make the frequency determination more accurate. This procedure serves to avoid artificial remnant power in the residuals, that could be incorrectly identified as a modulation component. The multistep procedure is depicted in Fig. 2. In the final grand fit (step 9) we also include the newly found small amplitude components to minimize the effect of incomplete signal modeling. The main interest of this paper is step 8, the search for additional frequency components, and, in particular, the search for those components that are close to the pulsation frequency (and its harmonics).
3 Results
By following the RR Lyrae list of Molnár et al. (2018), as in our former study, we gathered the publicly available items from the NASA Exoplanet Archive222https://exoplanetarchive.ipac.caltech.edu/). We relied mostly on the database stored in the ExoFOP section of the site by Petigura et al. (2015) (see also Aigrain et al. 2016). When the target was missing in the ExoFOP section, but it was available through the Kepler pipeline (Smith et al. 2012), we used this latter set. In both cases only the respective raw (i.e., SAP) fluxes were used with TFA for correcting systematics. As in our earlier work, the classification of the variables was based on the residual frequency spectra: a star was declared as a Blazhko variable, if there was one or more significant peaks in the residual spectrum near the fundamental frequency.
| Field | Ntot | NRRab | |||
|---|---|---|---|---|---|
| 01 | 14 | 14 | 9 | 5 | 0.64 |
| 02 | 57 | 57 | 52 | 5 | 0.91 |
| 03 | 62 | 62 | 59 | 3 | 0.95 |
| 04 | 56 | 33 | 30 | 3 | 0.91 |
| 05 | 57 | 57 | 52 | 5 | 0.91 |
| 06 | 142 | 107 | 99 | 8 | 0.93 |
| 07 | 353 | 235 | 184 | 51 | 0.78 |
| 08 | 47 | 46 | 44 | 2 | 0.96 |
| Sum: | 788 | 611 | 529 | 82 | 0.87 |
Notes: N Total number of RRab stars from the list of Molnár et al. (2018); N Actual number of RRab stars publicly available from the NASA Exoplanet Archive; Number of Blkazhko stars; Number of non-Blazhko stars (single period or other). Campaign is highlighted because of the low Blazhko rate – see text.
The campaign-by-campaign incidence rates are shown in Table 1. We missed certain targets from the list of Molnár et al. (2018), because they were not included in the publicly available databases. Nevertheless, this study is based on four times larger sample than our pilot survey (Kovacs 2018), yielding statistically more significant estimate of the high incidence rate of the Blazhko effect. The field of C07 has apparently a low rate, but this is likely due to the overabundance of faint, blended targets associated with the Sagittarius dwarf galaxy.
In a recent paper, Plachy et al. (2019) claim a more traditional observed rate of %, based on the analysis of the fields of C03C06. Although we did not make a star-by-star comparison between their and our results, the following examples are aimed for the illustration of the possible sources of the discrepancy.
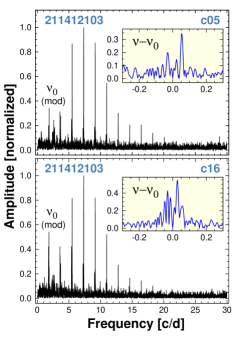
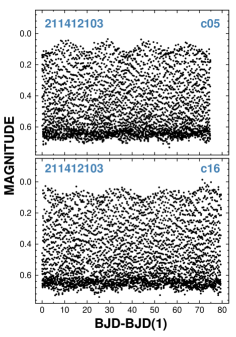
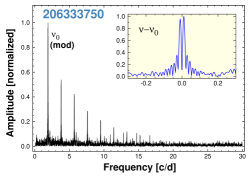
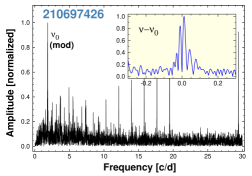
Figure 3 shows an example for a target of short modulation period, that was mis-classified likely because of the poor performance of the K2SC detrending algorithm in this particular case. Figure 4, on the other hand, shows the frequency spectra of two stars from their Fig. 12.333The 3rd star shown in their figure is not accessible from the public archives used in our work. We guess that in these cases K2SC might have overfitted the data and eliminated the small amplitude of the long period modulation. We also note that their classification (Plachy, private communication) have multiple components (including the less sensitive O-C analysis), that leads to the de-selection of many candidates that otherwise show signatures of modulation in the frequency spectra.
Acknowledgments
We would like to thank the organizers (and, in particular the Chair of the LOC, Karen Kinemuchi) for their effort in making this workshop scientifically fruitful and socially commemorable. This research has made use of the NASA Exoplanet Archive, which is operated by the California Institute of Technology, under contract with the National Aeronautics and Space Administration under the Exoplanet Exploration Program. Supports from the National Research, Development and Innovation Office (grants K 129249 and NN 129075) are acknowledged.
References
- Aigrain et al. (2016) Aigrain, S., Parviainen, H., & Pope, B. J. S. 2016, MNRAS, 459, 2408
- Bakos et al. (2010) Bakos, G. Á., Torres, G., Pál, A., et al. 2010, ApJ, 710, 1724
- Benkő et al. (2014) Benkő, J. M., Plachy, E., Szabó, R., et al. 2014, ApJS, 213, 31
- Blažko (1907) Blažko, S. 1907, Astronomische Nachrichten, 175, 325
- Kovács et al. (2005) Kovács, G., Bakos, G., & Noyes, R. W. 2005, MNRAS, 356, 557
- Kovacs (2016) Kovacs, G. 2016, Commmunications of the Konkoly Observatory Hungary, 105, 61
- Kovacs (2018) Kovacs, G. 2018, A&A, 614, L4
- Luger et al. (2018) Luger, R., Kruse, E., Foreman-Mackey, D., et al. 2018, AJ, 156, 99
- Molnár et al. (2018) Molnár, L., Plachy, E., Juhász, Á. L., et al. 2018, A&A, 620, A127
- Petigura et al. (2015) Petigura, E. A., Schlieder, J. E., Crossfield, I. J. M., et al. 2015, ApJ, 811, 102
- Plachy et al. (2019) Plachy, E., Molnár, L., Bódi, A., et al. 2019, ApJS, 244, 32
- Prudil & Skarka (2017) Prudil, Z., & Skarka, M. 2017, MNRAS, 466, 2602
- Skarka et al. (2020) Skarka, M., Prudil, Z., & Jurcsik, J. 2020, MNRAS, 494, 1237
- Smith et al. (2012) Smith, J. C., Stumpe, M. C., Van Cleve, J. E., et al. 2012, PASP, 124, 1000
- Smolec (2016) Smolec, R. 2016, 37th Meeting of the Polish Astronomical Society, 22
- Stumpe et al. (2012) Stumpe, M. C., Smith, J. C., Van Cleve, J. E., et al. 2012, PASP, 124, 985
- Tamuz et al. (2005) Tamuz, O., Mazeh, T., & Zucker, S. 2005, MNRAS, 356, 1466
- Vanderburg & Johnson (2014) Vanderburg, A., & Johnson, J. A. 2014, PASP, 126, 948