Relativistic X-ray jets from the black hole X-ray binary MAXI J1820070
Abstract
The black hole MAXI J1820070 was discovered during its 2018 outburst and was extensively monitored across the electromagnetic spectrum. Following the detection of relativistic radio jets, we obtained four Chandra X-ray observations taken between 2018 November and 2019 May, along with radio observations conducted with the VLA and MeerKAT arrays.
We report the discovery of X-ray sources associated with the radio jets moving at relativistic velocities with a possible deceleration at late times. The broadband spectra of the jets are consistent with synchrotron radiation from particles accelerated up to very high energies ( 10 TeV) by shocks produced by the jets interacting with the interstellar medium. The minimal internal energy estimated from the X-ray observations for the jets is erg, significantly larger than the energy calculated from the radio flare alone, suggesting most of the energy is possibly not radiated at small scales but released through late-time interactions.
1 Introduction
Jets and outflows are observed in a diverse range of accreting systems such as young stellar objects, Galactic X-ray binaries and active galactic nuclei (AGN). The formation of jets, their propagation and their association with accretion processes are still largely unclear. However, their feedback on their immediate environment is now starting to be quantified, as their interaction with the interstellar medium can be observed using high spatial resolution images of X-ray binaries (Corbel et al., 2002; Migliori et al., 2017). Large-scale Galactic jets with apparent superluminal motion were originally detected in GRS 1915+105 by Mirabel & Rodríguez (1994). Such jets originate in discrete ejecta launched during state transitions (Corbel et al., 2004; Fender et al., 2004). The associated radio emission is characteristic of evolving synchrotron blobs (van der Laan, 1966) whose fate was unclear until the detection of their reactivation at high energy when they interact with the interstellar medium, e.g. XTE J1550564 (Corbel et al., 2002; Tomsick et al., 2003; Kaaret et al., 2003; Migliori et al., 2017) and H1743322 (Corbel et al., 2005).
MAXI J1820070, first known as ASASSN18ey, is a black hole X-ray binary (Tucker et al., 2018; Torres et al., 2019) originally discovered in the optical band on 2018 March 6 by the All-Sky Automated Survey for Supernovae ASAS-SN (Shappee et al., 2014; Kochanek et al., 2017) and in X-rays on 2018 March 11 (Kawamuro et al., 2018; Denisenko, 2018) by the Monitor of All-sky X-ray Image MAXI on board the International Space Station (Matsuoka et al., 2009). Its distance is constrained to 2.96 0.33 kpc by radio parallax measurements (Atri et al., 2020). Its 2018 and 2019 outbursts were densely monitored in radio, revealing the ejection of long-lived discrete relativistic jets (Bright et al., 2020). The discovery of these jets in the radio wavelengths motivated the search for X-ray counterparts.
2 Observations
2.1 X-ray observations with Chandra
Following the detection of extended radio jets in MAXI J1820070, we triggered our Chandra program (PI: S. Corbel) to search for associated extended X-ray emission from the jets. The observations were performed with the Advanced CCD Imaging Spectrometer (ACIS, Townsley et al. (2000)) on 2018 November 13 (30 ks; ObsId 20207) and 2019 February 4 and 5 (2 20 ks; ObsId 20208 and 22080). In addition, we also used two complementary ACIS-S observations (PI: E. Gallo) scheduled during the outburst decay of MAXI J1820070 on 2019 May 24 (12 ks; ObsId 21203) and 2019 June 11 (65 ks; ObsId 21205). The remaining Chandra observations of the field did not reveal any X-ray sources besides MAXI J1820070 ; all observations are summarized in Table 1. All observations were performed in sub-array mode to minimize pile-up and we restricted the analysis to the S3 chip, which provides the best low-energy response.
The X-ray data analysis was performed using the Chandra Interactive Analysis of Observation (CIAO) software 4.11 (Fruscione et al., 2006), with the calibration files CALDB version 4.8.4.1. The chandra_repro script was run to reprocess the observations. The 2018 November observation was processed to remove the ACIS readout streak and the two observations taken in 2019 February were merged. Then, all observations were filtered to keep only the events in the energy range 0.3 – 8 keV. The fluximage script was used to create the X-ray images, keeping the bin size to 1 (1 pixel = 0.492″).
2.2 Radio observations with VLA and MeerKAT
MAXI J1820070 was also observed in the radio wavelengths (see Table 1). We use two observations performed with the Karl G. Jansky Very Large Array (VLA) (Perley et al., 2011). The observations were almost simultaneous with the first and second Chandra and MeerKAT observations, with an on-target duration of 30 minutes on 2018 November 9 and 38 minutes on 2019 February 2. The array was in D configuration (synthesized beam of 12″) during the November observation and in C configuration (synthesized beam of 3.5″) during the February observation. Both observations were carried out in the C band, which is centered at 6 GHz. The total VLA bandwidth is 4.096 GHz, divided into 32 spectral windows of 128 MHz, each divided again into 64 channels of 2 MHz.
MeerKAT (Jonas & MeerKAT Team, 2016; Camilo et al., 2018; Mauch et al., 2020) is an array made of 64 13.5m antennas located in Northern Cape, South Africa. Its spatial resolution is around 5″. Its bandwidth is divided into 4096 channels of 209 kHz, making a total bandwidth of 856 MHz centered at 1.284 GHz (L band). MAXI J1820070 was observed regularly during its outbursts as part of the ThunderKAT Large Survey Project (Fender et al., 2017), and we focus here on the observations taken on 2018 November 13 lasting 45 minutes and on 2019 February 1 lasting 15 minutes. Radio flux densities, , and radio spectral indices, , defined as , are reported in Table 2. See Bright et al. (2020) for details on the radio monitoring and results.
The Common Astronomy Software Applications package (CASA) version 5.1.1-5 was used for all the radio data reduction (McMullin et al., 2007). The data were calibrated using the flux calibrators 3C286 for the VLA and PKS B1934-638 for MeerKAT, and the phase calibrators J1824+1044 for the VLA and J1733-1304 for MeerKAT. Images were produced from calibrated data using the algorithm CLEAN (Högbom, 1974) within CASA. We chose cells of 1.5″ for MeerKAT images. The VLA data was divided into 2 sub-bands of 16 spectral windows each, the first sub-band centered on 5 GHz and the second on 7 GHz, approximately. The sub-bands were imaged separately to reduce artefacts, with cells of 2.5 and 1.6″ respectively in D configuration, and 0.7″ and 0.5″ in C configuration. A robust weighting (Briggs, 1995) of was used for all images.
3 Results
3.1 Source detection
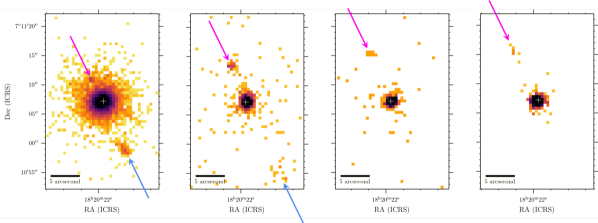
The CIAO tool wavdetect was used to identify the X-ray sources in the Chandra observations. In a 30″ radius around the position of MAXI J1820070, three aligned X-rays sources were detected in the 2018 November and 2019 February images. One of them was consistent with the location of MAXI J1820070 and the other two moved between November and February. In 2019 May and June, only two sources were detected, one of them consistent with the position of MAXI J1820070 and the other to the north with a larger displacement compared to the previous observations. The angle between the axis of the aligned sources and the north is .
The images obtained are displayed in Figure 1. The angular separations between the core source and the other detected sources are listed in Table 2. In the following, we refer to the moving sources as the north jet and the south jet, based on their location with respect to MAXI J1820070.
The source detection process was similar for all radio images. Due to the lower spatial resolution in the radio maps compared with Chandra, we used the Chandra locations to constrain the components of the radio maps. The imfit CASA task was used to perform 2D Gaussian fits. Point sources (2D Gaussians of the size of the beam) were first fitted on all the fixed core positions coming from the Chandra data. Then, the residual images were examined and point sources were fitted on the fixed Chandra jet positions. The radio fluxes obtained through these fits are presented in Table 2.
3.2 Spectral analysis
X-ray source and background spectra were extracted for the three detected objects using the specextract script. For all sources in all observations, except the north jet in November, a circular background was chosen from a source-free area of the chip.
As the profile of the north jet in the November observation (Figure 2) revealed an overlap with the wings of the central black hole, its background spectrum was extracted from a partial annulus around the black hole (inner radius of 3.2″ and outer radius of 5.2″, subtracting the elliptic region of the north jet). The X-ray spectral analysis was then performed using XSPEC (Arnaud, 1996) and Sherpa, the CIAO modeling and fitting application developed by the Chandra X-ray Center (Freeman et al., 2001).
The spectra extracted from the north and south jets were fitted with an absorbed power-law model with photon index (tbabs * powerlaw), using the abundances from Wilms et al. (2000). The hydrogen column density value of cm-2 was obtained by fitting the spectra of MAXI J1820070 in 2019 February using statistic cstat, as it did not suffer from the photon pile-up effect that is seen for bright sources. We afterwards froze the hydrogen column density to the best fit value.
The 0.3 – 8 keV unabsorbed flux and the photon index obtained are reported in Table 2.
| Chandra date | Frame time | MeerKAT date | VLA date | |||||||||
|---|---|---|---|---|---|---|---|---|---|---|---|---|
| Obs no. | Chandra ObsId | Subarray | ||||||||||
| (dd/mm/yy) | (s) | (dd/mm/yy) | (dd/mm/yy) | |||||||||
| 1 | 20207 |
|
1/4 | 0.8 |
|
|
||||||
| 2 | 20208 |
|
1/4 | 0.8 | 01/02/19 (MJD 58515.2) | 02/02/19 (MJD 58516.7) | ||||||
| 22080 |
|
1/4 | 0.8 | |||||||||
| 3 | 21203 |
|
1/8 | 0.7 | ||||||||
| 4 | 21204 |
|
1/8 | 0.6 | ||||||||
| 5 | 21205 |
|
1/8 | 0.6 |
| Separation | 0.3 – 8 keV flux | 1.3 GHz flux | 5 GHz flux | 7 GHz flux | ||||
|---|---|---|---|---|---|---|---|---|
| Observation | Source | |||||||
| (″) | ( erg cm-2 s-1) | (mJy) | (mJy) | (mJy) | ||||
| 1 | South jet | 8.81 0.06 | ||||||
| North jet | 4.27 0.04 | |||||||
| 2 | South jet | 12.82 0.22 | aaNo detection, upper limit. | aaNo detection, upper limit. | aaNo detection, upper limit. | |||
| North jet | 6.57 0.09 | |||||||
| 3 | North jet | 9.02 0.12 | bb fixed to 1.6 due to the low number of photons. | |||||
| 5 | North jet | 9.85 0.16 | bb fixed to 1.6 due to the low number of photons. |
Note. — Separation is the angular separation with the main source in arcseconds. The unabsorbed X-ray flux between 0.3 keV and 8 keV is in units of erg cm-2 s-1. is the radio spectral index. is the X-ray photon index.
3.3 Morphology
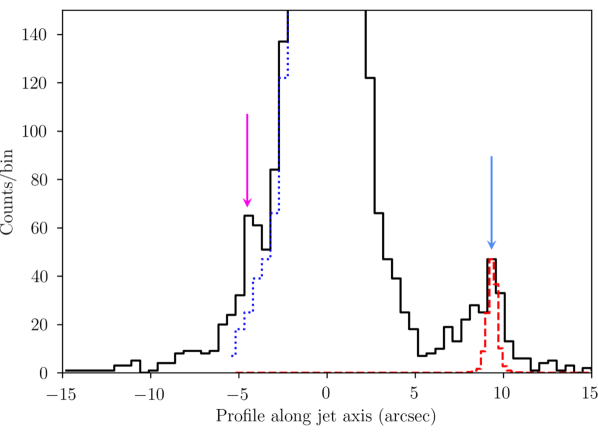
As the angular resolution of the X-ray images is higher than that of the radio images, we studied the morphology of the north and south jets using solely the Chandra data. We extracted from each Chandra image the profile along the axis formed by the jets and summed over 4" in width. We used the profile of MAXI J1820070 as an estimate of the point spread function (PSF) of the Chandra instrument for all observations except for 2018 November which suffered from strong pile-up. We thus used MARX version 5.4.0 (Davis et al., 2012) to simulate the Chandra PSF without pile-up for that specific observation. The PSF profile is then rescaled and plotted over the jets profile to estimate the jet extension.
As an example, the profile obtained from 2018 November, with the PSF overlaid on the south jet, is displayed in Figure 2 (top panel). A Kolmogorov-Smirnov (KS) test was performed comparing the jet profiles against the PSF profiles to determine whether the jets are resolved, the null hypothesis being that the two samples are drawn from the same distribution. The south jet in 2019 February is too faint with photons widely dispersed to make the test conclusive, though it appears resolved in the image. According to the results of the other KS tests, only the south jet in 2018 November has a significantly different distribution from the PSF, with a p-value of , which indicates that it is resolved at the 95% confidence level.
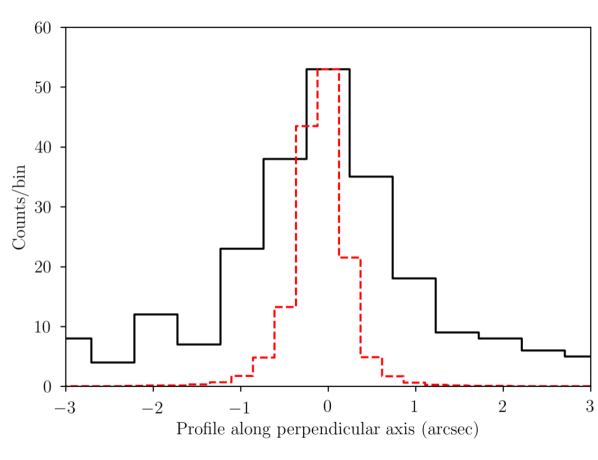
As the south jet is resolved along the axis of the jets in 2018 November, we also compute its profile perpendicularly to that axis (Figure 2 bottom panel). The KS test of the jet profile against the PSF profile along a perpendicular axis allows us to reject the null hypothesis that both samples come from the same distribution, with a p-value of at the 95% confidence level.
The south jet is thus resolved in the November Chandra observation, with a size of in length and perpendicularly to its axis (see section 4.2 for further discussion about the resolved jet). The error on these dimensions can be estimated as the bin width, i.e. . Due to the modeling of this jet as a truncated cone, these dimensions yield an opening angle of the jet of °.
4 Discussion
New Chandra observations of MAXI J1820070 conducted during the decays of its 2018 and 2019 outbursts led to the detection of two new and variable X-ray sources moving away from the central black hole. These sources are consistent with the positions of the radio jets that have been observed by Bright et al. (2020). In the Chandra observations in November, the south jet is resolved both parallel and perpendicular to the jet axis. It is likely we are witnessing the interaction of the jets of MAXI J1820070 with the interstellar medium (ISM), similar to that observed from XTE J1550564 (Corbel et al., 2002; Kaaret et al., 2003; Tomsick et al., 2003; Migliori et al., 2017) and H1743322 (Corbel et al., 2005).
4.1 Motion of the jets
The angular separations obtained from the Chandra images and presented in Table 2 imply that the two jets are moving. We study their apparent motions from the Chandra data and using the angular separations obtained in radio by Bright et al. (2020). Our data extend the time coverage with much later observations. For both jets, the angular separation versus time is plotted on Figure 3.
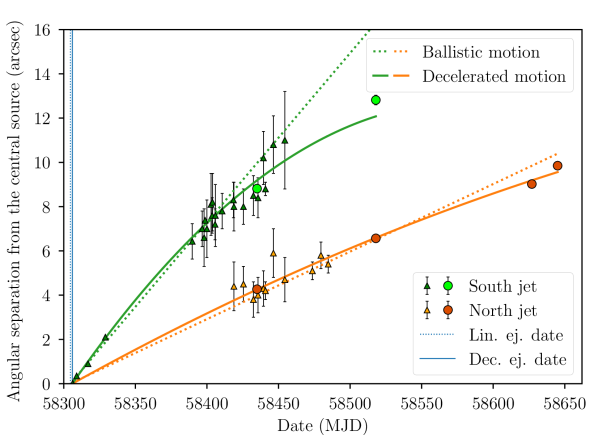
We model the motion of the jets as having either constant velocity () or constant deceleration ( with ). The first fit performed (dashed line in Figure 3) is a linear fit, assuming a common ejection date and a ballistic motion for both jets. The joint fits yields an ejection date of MJD . Furthermore, we fit the data with a constant deceleration model assuming also a common ejection date for both jets (but not necessarily the same as the launch date in the linear model), and the joint fits give MJD as ejection date in the decelerated model.
The ejection date obtained with the decelerated model is consistent with the one (MJD ) that Bright et al. (2020) measured without the Chandra data, and which occurred during the hard to soft state transition period according to Shidatsu et al. (2019). On the other hand, the ejection date obtained using the linear model appears one day too early according to the flare observed by Bright et al. (2019). This is due to the fact that the Chandra position of the jets at the late time disfavours the ballistic model and therefore strengthens the model with jets interacting with the ISM.
The proper motions obtained with the ballistic fit are mas d-1 and mas d-1. The constant deceleration hypothesis gives initial velocities of mas d-1 and mas d-1. The acceleration values are mas d-2 and mas d-2. Assuming a distance of 2.96 kpc (Atri et al., 2020), this corresponds to respective apparent initial velocities of 0.61 c and 1.59 c approximately. The superluminal apparent velocity of the south jet, which is much higher than the apparent velocity for the north jet, suggests that the south jet is the approaching component of the ejection while the north jet is the receding component. The approaching / receding nature of the jets and their velocities are in accordance with what Bright et al. (2020) find, considering we have additional data at a later time to perform the fits.
To assess the goodness of fit of the linear and decelerated models to the observed data, we compute the chi-square statistic for both joint fits. The reduced chi-square is for the linear model and for the decelerated model. Even though both values are quite high, which can be attributed to the relatively small error bars of the Chandra data points, the smaller value of suggests that the data is more in accordance with the constant deceleration hypothesis, following what was already hinted for the south jet. Moreover, the measure of a 14 mas angular separation between the two jets on MJD 58306.22 by Bright et al. (2020) implies an ejection date around MJD 58306.1, using the velocities obtained for both models. This is not compatible with the ejection date found for the ballistic motion, and strengthen the likeliness of a decelerated motion.
The addition of the Chandra observations thus advocates strongly for the fact that the jets are decelerated, which could not be deduced by Bright et al. (2020) from the radio data alone. This implies the jets are probably emitted at the same time and then gradually slowed down, possibly by an interaction with their environment.
The relatively high values could suggest that the deceleration is in fact not constant. Indeed, it has been suggested that X-ray binaries could be located in low-density bubbles (Heinz, 2002). In that case, the deceleration would be enhanced when the jets interact with the denser ISM at the edge of the bubble. For instance, Wang et al. (2003), Hao & Zhang (2009) and Steiner & McClintock (2012) found that the jets observed for XTE J1550564 could be decelerated by interaction with the surrounding ISM, which accelerates the jet particles (similar findings were also invoked in H1743322), possibly implying that a significant fraction of X-ray binaries could be surrounded by large-scale low-density cavities.
However, Bright et al. (2020) find that the decay rate of the radio emission coming from the jets is very slow, and attribute it to continuous on-going interaction with the ISM. This could advocate for a constant deceleration, especially as we have no data that could point towards a ballistic motion at the beginning of the propagation.
4.2 Energetics
Using the available observations (Chandra, VLA and MeerKAT), we are able to construct the broad-band spectra of the approaching and receding jets in 2018 November and of the receding jet in 2019 February. The three spectral energy distributions can be fitted with single power-laws with spectral indices of for the approaching jet in 2018 November, for the receding jet in 2018 November and for the receding jet in 2019 February. Figure 4 displays the spectral energy distribution (SED) for the approaching jet in 2018 November.
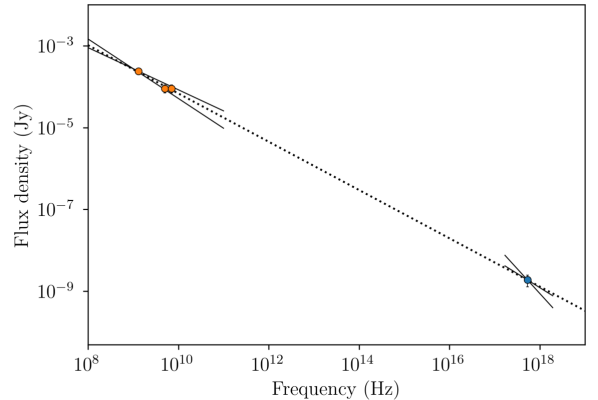
These spectral indices are consistent with what would be expected from optically thin synchrotron emission produced by shock-accelerated particles. Indeed, the apparent motion of the jets seems to favor a possible deceleration rather than a simple ballistic propagation. This could be due to the interaction of the jets with the ISM as observed previously in XTE J1550564 (Corbel et al., 2002; Migliori et al., 2017) and H1743322 (Corbel et al., 2005). This interaction would be responsible for the acceleration of the particles of the jets and thus for the observed broad-band synchrotron emission.
To estimate the internal energy of the jets, we use the measured size obtained for the south jet using the Chandra observation on 2018 November, see Figure 2. The jet is then modeled by a truncated cone whose apex is at the central source, of in height, in width and with an opening angle of 7.1°. Using 2.96 kpc as the distance to MAXI J1820070 (Atri et al., 2020), this corresponds to a volume of cm3, and a jet of AU by AU, which is in accordance with the estimation performed by Bright et al. (2020). Their estimate was obtained 40 days before by inferring it from radio flux comparisons, while we obtained directly a physical size using Chandra data.
Using the slope of the spectral energy distribution (Figure 4) of the approaching jet which gives , we estimate a total radiative luminosity of erg s-1 between 1.3 GHz and GHz. Under standard hypothesis of equipartition and assuming all the energy is stored in the electrons (no energy carried by the protons), we can estimate the minimum internal energy of the synchrotron-emitting plasma. Following Fender et al. (1999), we estimate the parameters of the synchrotron emission with the formulae in Longair (2011) (see section 16.5), using the opposite convention for the sign of . This yields a minimum internal energy of erg and an equipartition magnetic field of the order of G. This implies radiating electrons with Lorentz factor of , i.e. electrons accelerated up to energies > 10 TeV, and a cooling time scale of twenty-two years. This also leads to an estimate of electrons in the jets, and if there is one proton per electron, we deduce a mass of the plasma of g. The total energy in the electrons would thus be erg and the energy in the magnetic field erg (consistent with the estimates from Bright et al. 2020 using solely the radio observations). This strengthens their finding that the minimum internal energy of the jet is significantly ( times) larger that the energy inferred from the radio flare believed to be the origin of the ejecta (Bright et al., 2018). Unless a significant fraction of the energy is radiated in a different wavelength during the launch (e.g. in X-rays, Homan et al. (2020) report a small flare in the 7-12 keV band just before the radio flare), this suggests the majority of the energy of the jets is not radiated and is released once they interact with the surrounding medium. Furthermore, the above quantities are consistent with what was derived in XTE J1550564 (Tomsick et al., 2003) and H1743322 (Corbel et al., 2005), suggesting a common mechanism could be at play in the different sources displaying radio to X-ray jets.
References
- Arnaud (1996) Arnaud, K. A. 1996, in Astronomical Society of the Pacific Conference Series, Vol. 101, Astronomical Data Analysis Software and Systems V, ed. G. H. Jacoby & J. Barnes, 17
- Astropy Collaboration et al. (2013) Astropy Collaboration, Robitaille, T. P., Tollerud, E. J., et al. 2013, A&A, 558, A33, doi: 10.1051/0004-6361/201322068
- Atri et al. (2020) Atri, P., Miller-Jones, J. C. A., Bahramian, A., et al. 2020, MNRAS, 493, L81, doi: 10.1093/mnrasl/slaa010
- Briggs (1995) Briggs, D. S. 1995, in American Astronomical Society Meeting Abstracts, Vol. 187, 112.02
- Bright et al. (2018) Bright, J., Motta, S., Fender, R., Perrott, Y., & Titterington, D. 2018, The Astronomer’s Telegram, 11827, 1
- Bright et al. (2019) Bright, J., Motta, S., Williams, D., et al. 2019, The Astronomer’s Telegram, 13041, 1
- Bright et al. (2020) Bright, J. S., Fender, R. P., Motta, S. E., et al. 2020, Nature Astronomy, doi: 10.1038/s41550-020-1023-5
- Camilo et al. (2018) Camilo, F., Scholz, P., Serylak, M., et al. 2018, The Astrophysical Journal, 856, 180, doi: 10.3847/1538-4357/aab35a
- Corbel et al. (2004) Corbel, S., Fender, R. P., Tomsick, J. A., Tzioumis, A. K., & Tingay, S. 2004, The Astrophysical Journal, 617, 1272, doi: 10.1086/425650
- Corbel et al. (2002) Corbel, S., Fender, R. P., Tzioumis, A. K., et al. 2002, Science, 298, 196, doi: 10.1126/science.1075857
- Corbel et al. (2005) Corbel, S., Kaaret, P., Fender, R. P., et al. 2005, The Astrophysical Journal, 632, 504, doi: 10.1086/432499
- Davis et al. (2012) Davis, J. E., Bautz, M. W., Dewey, D., et al. 2012, in Society of Photo-Optical Instrumentation Engineers (SPIE) Conference Series, Vol. 8443, Proc. SPIE, 84431A, doi: 10.1117/12.926937
- Denisenko (2018) Denisenko, D. 2018, The Astronomer’s Telegram, 11400, 1
- Fender et al. (2017) Fender, R., Woudt, P. A., Armstrong, R., et al. 2017, arXiv e-prints, arXiv:1711.04132. https://arxiv.org/abs/1711.04132
- Fender et al. (2004) Fender, R. P., Belloni, T. M., & Gallo, E. 2004, Monthly Notices of the Royal Astronomical Society, 355, 1105, doi: 10.1111/j.1365-2966.2004.08384.x
- Fender et al. (1999) Fender, R. P., Garrington, S. T., McKay, D. J., et al. 1999, Monthly Notices of the Royal Astronomical Society, 304, 865, doi: 10.1046/j.1365-8711.1999.02364.x
- Freeman et al. (2001) Freeman, P., Doe, S., & Siemiginowska, A. 2001, in Society of Photo-Optical Instrumentation Engineers (SPIE) Conference Series, Vol. 4477, Proc. SPIE, ed. J.-L. Starck & F. D. Murtagh, 76–87, doi: 10.1117/12.447161
- Fruscione et al. (2006) Fruscione, A., McDowell, J. C., Allen, G. E., et al. 2006, in Society of Photo-Optical Instrumentation Engineers (SPIE) Conference Series, Vol. 6270, Society of Photo-Optical Instrumentation Engineers (SPIE) Conference Series, 62701V, doi: 10.1117/12.671760
- Hao & Zhang (2009) Hao, J. F., & Zhang, S. N. 2009, ApJ, 702, 1648, doi: 10.1088/0004-637X/702/2/1648
- Heinz (2002) Heinz, S. 2002, A&A, 388, L40, doi: 10.1051/0004-6361:20020402
- Högbom (1974) Högbom, J. A. 1974, Astronomy & Astrophysics Supplement, 15, 417
- Homan et al. (2020) Homan, J., Bright, J., Motta, S. E., et al. 2020, ApJ, 891, L29, doi: 10.3847/2041-8213/ab7932
- Jonas & MeerKAT Team (2016) Jonas, J., & MeerKAT Team. 2016, in Proceedings of MeerKAT Science: On the Pathway to the SKA. 25-27 May, 1
- Kaaret et al. (2003) Kaaret, P., Corbel, S., Tomsick, J. A., et al. 2003, ApJ, 582, 945, doi: 10.1086/344540
- Kawamuro et al. (2018) Kawamuro, T., Negoro, H., Yoneyama, T., et al. 2018, The Astronomer’s Telegram, 11399, 1
- Kochanek et al. (2017) Kochanek, C. S., Shappee, B. J., Stanek, K. Z., et al. 2017, PASP, 129, 104502, doi: 10.1088/1538-3873/aa80d9
- Longair (2011) Longair, M. S. 2011, High Energy Astrophysics, 3rd edn. (Cambridge University Press)
- Matsuoka et al. (2009) Matsuoka, M., Kawasaki, K., Ueno, S., et al. 2009, PASJ, 61, 999, doi: 10.1093/pasj/61.5.999
- Mauch et al. (2020) Mauch, T., Cotton, W. D., Condon, J. J., et al. 2020, ApJ, 888, 61, doi: 10.3847/1538-4357/ab5d2d
- McMullin et al. (2007) McMullin, J. P., Waters, B., Schiebel, D., Young, W., & Golap, K. 2007, in Astronomical Society of the Pacific Conference Series, Vol. 376, Astronomical Data Analysis Software and Systems XVI, ed. R. A. Shaw, F. Hill, & D. J. Bell, 127
- Migliori et al. (2017) Migliori, G., Corbel, S., Tomsick, J. A., et al. 2017, Monthly Notices of the Royal Astronomical Society, 472, 141, doi: 10.1093/mnras/stx1864
- Mirabel & Rodríguez (1994) Mirabel, I. F., & Rodríguez, L. F. 1994, Nature, 371, 46, doi: 10.1038/371046a0
- Perley et al. (2011) Perley, R. A., Chandler, C. J., Butler, B. J., & Wrobel, J. M. 2011, The Astrophysical Journal Letters, 739, L1, doi: 10.1088/2041-8205/739/1/L1
- Price-Whelan et al. (2018) Price-Whelan, A. M., Sipőcz, B. M., Günther, H. M., et al. 2018, AJ, 156, 123, doi: 10.3847/1538-3881/aabc4f
- Robitaille & Bressert (2012) Robitaille, T., & Bressert, E. 2012, APLpy: Astronomical Plotting Library in Python. http://ascl.net/1208.017
- Shappee et al. (2014) Shappee, B. J., Prieto, J. L., Grupe, D., et al. 2014, ApJ, 788, 48, doi: 10.1088/0004-637X/788/1/48
- Shidatsu et al. (2019) Shidatsu, M., Nakahira, S., Murata, K. L., et al. 2019, The Astrophysical Journal, 874, 183, doi: 10.3847/1538-4357/ab09ff
- Steiner & McClintock (2012) Steiner, J. F., & McClintock, J. E. 2012, ApJ, 745, 136, doi: 10.1088/0004-637X/745/2/136
- Tomsick et al. (2003) Tomsick, J. A., Corbel, S., Fender, R., et al. 2003, ApJ, 582, 933, doi: 10.1086/344703
- Torres et al. (2019) Torres, M. A. P., Casares, J., Jiménez-Ibarra, F., et al. 2019, ApJ, 882, L21, doi: 10.3847/2041-8213/ab39df
- Townsley et al. (2000) Townsley, L. K., Broos, P. S., Garmire, G. P., & Nousek, J. A. 2000, ApJ, 534, L139, doi: 10.1086/312672
- Tucker et al. (2018) Tucker, M. A., Shappee, B. J., Holoien, T. W. S., et al. 2018, The Astrophysical Journal, 867, L9, doi: 10.3847/2041-8213/aae88a
- van der Laan (1966) van der Laan, H. 1966, Nature, 211, 1131, doi: 10.1038/2111131a0
- Wang et al. (2003) Wang, X. Y., Dai, Z. G., & Lu, T. 2003, ApJ, 592, 347, doi: 10.1086/375638
- Wilms et al. (2000) Wilms, J., Allen, A., & McCray, R. 2000, The Astrophysical Journal, 542, 914, doi: 10.1086/317016