The detailed structure and the onset of galaxy formation in low-mass gaseous dark matter haloes
Abstract
We present a model for the formation of the first galaxies before and after the reionization of hydrogen in the early universe. In this model, galaxy formation can only take place in dark matter haloes whose mass exceeds a redshift-dependent critical value, which, before reionization, is equal (in the simplest case) to the mass at which atomic hydrogen cooling becomes effective and, after reionization, is equal to the mass above which gas cannot remain in hydrostatic equilibrium. We define the Halo Occupation Fraction (HOF) as the fraction of haloes that host a luminous galaxy as a function of halo mass. The HOF is established by the interplay between the evolution of the critical mass and the assembly history of haloes and depends on three factors: the minimum halo mass for galaxy formation before reionization, the redshift of reionization, and the intensity of the (evolving) external photoheating rate. Our fiducial model predicts a cutoff in the galaxy mass function at a present-day halo mass, ; 100% occupation at ; and a population of starless gaseous haloes of present-day mass in the range , in which the gas is in thermal equilibrium with the ultraviolet background radiation and in hydrostatic equilibrium in the gravitational potential of the halo. The transition between and reflects the stochastic nature of halo mass growth. We explore how these characteristic masses vary with model assumptions and parameter values. The results of our model are in excellent agreement with cosmological hydrodynamic simulations of galaxy formation.
keywords:
galaxies: formation – galaxies: dwarf – galaxies: star formation – (cosmology:) dark ages, reionization, first stars – (cosmology:) dark matter1 Introduction
The “-cold dark matter” (CDM) cosmological model makes specific and robust predictions for the growth, structure and abundance of dark matter haloes, the sites where galaxies form. These are: (i) dark matter haloes grow hierarchically: small haloes form first and larger haloes form subsequently by mergers of smaller haloes and accretion of smooth dark matter; (ii) the internal structure of dark matter haloes is self-similar over decades in mass (Navarro et al., 1996, 1997; Wang et al., 2019); (iii) the halo mass function rises steeply towards low masses (approximately as ; e.g., Press & Schechter, 1974; Bond et al., 1991; Jenkins et al., 2001, and references therein), implying that a large fraction of low-mass haloes must remain “dark” at redshift if CDM is to be reconciled with the relatively flat faint end of the observed galaxy stellar mass function (Klypin et al., 1999; Bullock et al., 2000; Benson et al., 2002b; Somerville, 2002).
In CDM a “cutoff” in the mass of dark matter haloes that can host galaxies is expected on general grounds. After the hydrogen emerging from the Big Bang recombines, it can, in principle, cool and condense into the small dark matter haloes present at that time but only in those whose potential well is deep enough to overcome the kinetic and thermal energy of the gas. Once the hydrogen is reionized at redshift, , the hydrogen-helium plasma is heated to , preventing it from accreting onto dark matter haloes of virial temperature, (Efstathiou, 1992; Babul & Rees, 1992; Quinn et al., 1996; Thoul & Weinberg, 1996; Barkana & Loeb, 1999), corresponding to a mass, 111We define virial quantities as those pertaining to the sphere within which the mean mass density equals 200 times the critical density of the universe and label them with the subscript 200.. Thus, we expect most haloes today of mass below a characteristic critical mass, , to remain dark. This conclusion agrees qualitatively with results from cosmological hydrodynamical simulations (Hoeft et al., 2006; Okamoto & Frenk, 2009; Benítez-Llambay et al., 2015; Sawala et al., 2016; Fitts et al., 2017), although the exact value of the critical halo mass and its dependence on modelling details, are uncertain. A quantity often discussed in this context is the “filtering mass” defined as the mass of those haloes that retain half of their baryons after cosmic reionization; it can be calculated using either linear theory or numerical simulations (e.g. Gnedin, 2000; Benson et al., 2002a; Okamoto et al., 2008; Hoeft et al., 2006). The exact connection of this quantity to galaxy formation is, however, unclear.
To illustrate these ideas, let us assume that prior to reionization galaxy formation can only take place in haloes in which atomic hydrogen can cool, that is haloes of virial temperature, . The corresponding critical mass is approximately,
| (1) |
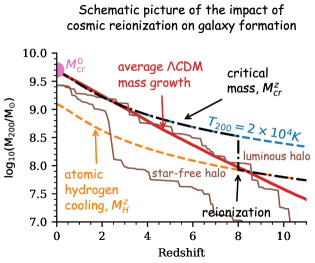
In Fig. 1 we follow the evolution of a halo of present-day mass, , which, for illustration purposes, we take to be the critical mass above which all dark matter haloes host a luminous galaxy at . The red solid line shows the average mass growth (inferred from the mean mass accretion history) of a halo of that mass in CDM. The halo mass required for galaxy formation to proceed is shown by the black dashed line. At this jumps from to . The blue dashed line in Fig. 1 shows the evolution of , assumed to be the mass of a halo of virial temperature .
All haloes of will host a luminous galaxy at . Some haloes of will be “dark” but others will also host a luminous galaxy, depending on their previous history. The thin brown lines in Fig. 1 illustrate two different mass accretions histories that lead to the same halo mass at , . One of them never crosses the critical mass required for gas to collapse, whereas the other, although below the critical mass at , exceeded before cosmic reionization. Of the two, only the later is expected to host a luminous galaxy today. This example illustrates the origin of the “stochastic” nature of galaxy formation in dark matter haloes of mass close to the critical value (e.g. Hoeft et al., 2006; Benítez-Llambay et al., 2015; Sawala et al., 2016; Fitts et al., 2017, and references therein).
The present-day value of the critical mass, , that separates haloes that were able to form a galaxy from those that were not is a direct probe of the epoch of reionization and constrains the two parameters, and . The redshift of reionization can be estimated by finding the time when the average mass of haloes of first exceeded (dashed orange line). The constraint on follows from the value of since,
| (2) |
In this paper we develop a theoretical framework to understand the onset of galaxy formation and the impact of cosmic reionization on galaxy formation and address the follow questions: Is there an actual minimum halo mass at below which galaxies cannot form? If so, how does this depend on the characteristic scales of cosmic reionization? Is the simple picture outlined above consistent with full hydrodynamical simulations of galaxy formation? Is our model quantitatively robust? How sensitive are the results to the underlying assumptions about galaxy formation?
In Section 2 we introduce our model to calculate how reionization affects galaxy formation in low-mass haloes. We describe the numerical method and our simulations in Section 3. We perform a comparison between our model and high-resolution cosmological hydrodynamics simulations in Section 4. We discuss our results in Section 5 and conclude in Section 6.
2 MODEL
We will discuss later the conditions required for gas to collapse in a halo and make a galaxy. Here, we introduce a model to investigate the effects of reionization and of the presence of an external ultraviolet background (UVB) on the structure of gaseous haloes. The model applies strictly to dark matter haloes whose gaseous component has not yet collapsed to form a galaxy by .
As discussed in the Introduction, cosmic reionization drastically reduces the gas content of dark matter haloes of virial temperature , or equivalently, mass, (equation 2). This is the mass scale below which the halo free-fall time, , becomes longer than the sound crossing time of the gas in the halo, 222The condition, , yields the well-known criterion for dark matter haloes to be affected by cosmic reionization, , where is the halo circular velocity and is the sound speed of the gas.. At these haloes have mass, , but at , the critical mass is . Any gas that settles in haloes of virial temperature is expected to be in thermal (rather than virial) equilibrium with the external ionizing radiation at a temperature .
The distribution of gas that collapses into these low-mass haloes after reionization can be fully determined assuming that: (i) the gas reaches hydrostatic equilibrium within the (spherically symmetric) dark matter halo, and (ii) the contribution of the gas to the gravitational potential is negligible everywhere (see e.g. Ikeuchi, 1986; Rees, 1986). Under these assumptions, the hydrostatic equilibrium equation for the gas reads:
| (3) |
where , , , , are dimensionless variables; for the virial temperature, , we adopt the definition , with , and being the mean molecular weight, the proton mass and the Boltzmann constant, respectively; is the halo circular velocity at . We have also made the assumption that the gas temperature is a function of density, .
2.1 Isothermal case
For the simplest case in which the temperature of the gas is independent of density, (i.e., for an isothermal gas), the solution of this equation yields:
| (4) |
where we assume that sufficiently far from the halo (), i.e., the outer pressure of the halo is equal to that of the intergalactic medium. The enclosed gas mass,
| (5) |
in which , must be calculated numerically.
For a dark matter halo described by a Navarro-Frenk-White (NFW) density profile (Navarro et al., 1996, 1997), the gas density profile is:
| (6) |
in which , is the concentration of the halo, and is the characteristic radius of the dark matter profile.
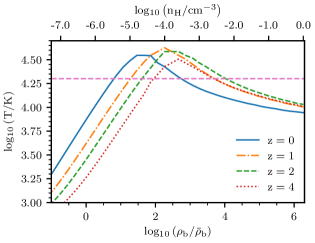
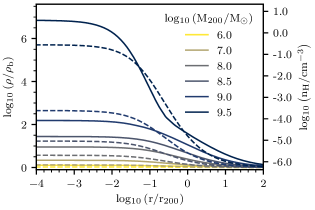
The dashed lines in Fig. 2 show the gas density profile (equation 6) for different halo masses, assuming a constant concentration, , independently on halo mass333Note that the concentration of low-mass CDM haloes is only weakly dependent on halo mass (see, e.g., Ludlow et al., 2014; Wang et al., 2019), so this is a sensible assumption for our purposes.. The slope of the gas density profile becomes increasingly shallow towards the centre, and converges to a well-defined value, , at . The finite maximum central gas density is a consequence of the cuspy nature of CDM haloes, which gives rise to a maximum central gravitational acceleration. In addition, the gas density profile settles at the mean density of the universe () further out, by construction.
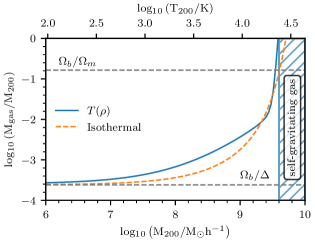
The total gas mass within the virial radius, as a function of halo mass (equation 5), is shown by the dashed orange line in Fig. 3. The gas mass grows exponentially with halo mass and asymptotically approaches the value for low-mass haloes, as expected444The enclosed gas mass within the virial radius must scale linearly with halo mass for a flat gas density profile.. For more massive haloes, the gas mass becomes a steep function of halo mass and the amount of gas needed to balance the gravitational acceleration of the halo eventually exceeds both, the baryon fraction of the universe (horizontal dashed line) and the dark matter content of the halo, after which equation (5) is no longer valid. Gaseous haloes more massive than will thus become self-gravitating and continue their gravitational collapse to form a central luminous galaxy555Note that this is particularly true for dark matter haloes with virial temperature , for which the cooling time is much shorter than the Hubble time, so that the gas in the halo is effectively at ..
Self-gravitating gaseous haloes develop inner densities that exceed times the mean baryon density of the universe at , or (see scale on the right in Fig. 2). This is encouraging, as this estimate is comparable to the minimum density above which gas is expected to become self-shielding, molecular, and self-gravitating, a regime in which our model is not designed to work (see, e.g., Sykes et al., 2019). This number also agrees well with the neutral hydrogen column density, , above which damped Ly (DLA) systems become rare (e.g. Schaye, 2001; Krumholz et al., 2009; Jorgenson et al., 2014). Indeed, for a halo of mass , assuming that all hydrogen inside the central core is neutral, we obtain a central HI column density .
2.2 Thermal equilibrium with the UVB
More generally, the interplay between gas cooling and photoheating from the external UVB links the gas temperature to its density (see e.g., Theuns et al., 1998; Barkana & Loeb, 1999) and so equation (3) must be solved taking this into account.
The processes that determine the density-temperature relation, , of gas in dark matter haloes of virial temperature, , depend on the density of the gas. For high-density gas, , the cooling and heating timescales are both shorter than the Hubble time and ) is determined by the balance between cooling and photoheating. For low-density gas, the cooling timescale is longer than the Hubble time and is determined exclusively by the photoheating timescale.
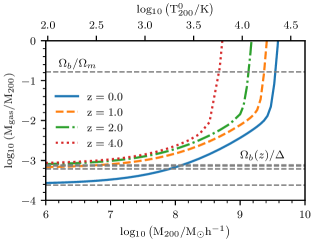
Fig. 4 shows calculated for gas of primordial composition, using the publicly available cooling tables compiled by Wiersma et al. (2009)666Available in http://www.strw.leidenuniv.nl/WSS08/, which assume an optically thin gas in ionization equilibrium illuminated by the Haardt & Madau (2001) UVB radiation field. (For completeness, we list the values of the relation in Table 1 in Appendix A). For comparison, the horizontal dashed line in the figure shows the value of previously assumed for the isothermal case. Although for gas above the mean cosmic density the temperature is not far from , there are clear differences.
The density-temperature relation results in the gas density profiles shown by the solid lines in Fig. 2, and in the present-day gas mass shown by the solid blue line in Fig. 3. The results of the simple isothermal case follow quite closely those of this model for which the temperature is not constant. Note, however, that the background temperature assumed for the isothermal case, , is a free parameter. Had we chosen a different value, the results would have been different. The relation in Fig. 4 removes any freedom in the modelling. We will focus on the results for this general case, in which , from now on.
Our model exhibits a number of interesting properties:
-
•
There is a wide range in halo mass at () for which gas neither leaves the halo completely nor collapses further. We previously identified these systems and named them REionization Limited HI Clouds (RELHICs) (Benítez-Llambay et al., 2017). Systems of this kind were first explored by Rees (1986) and Ikeuchi (1986) in the context of the “minihalo model of the Lyman- forest”.
-
•
Dark matter haloes less massive than at are expected to be devoid of gas; their potential wells are not deep enough to balance the pressure of the gas.
-
•
Gas in dark matter haloes more massive than at cannot provide enough pressure support to prevent further gravitational collapse; these haloes are expected to collapse, fragment, and form stars.
2.3 Redshift evolution
The redshift evolution of the model is determined by the time variation of the external pressure of the intergalactic medium, as the model assumes that the external pressure is equal to that of the mean intergalactic medium: . Thus, the external pressure for the gas in the halo must be calculated taking into account the redshift evolution of the Haardt & Madau (2001) photoheating rate (see Fig. 4) and the cosmic expansion.
As an example, Fig. 5 shows the gas mass (in units of the halo mass), as a function of halo mass, at four different redshifts, . It is clear that, at fixed halo mass, the total gas mass of these low-mass haloes evolves with time. At high redshift, the universe is denser and so the external pressure on the gaseous haloes is greater. As a result, the critical mass above which gas is expected to lose pressure support shifts to lower halo masses. This invites us to define the redshift-dependent critical mass for gas to undergo gravitational collapse, , as the halo mass above which the fraction of baryons needed to ensure hydrostatic equilibrium exceeds the universal fraction, , indicated in the figure as a dashed line. Clearly, the exact value of this fraction is not crucial as long as .
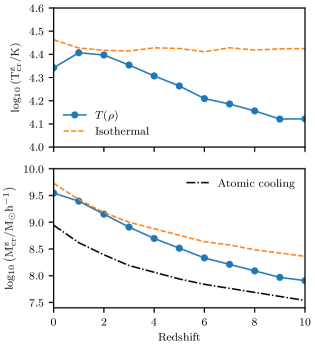
The blues lines in Fig. 6 show the redshift evolution of the critical mass that results from our model, expressed either as a virial temperature (top), or as a gas mass (bottom)777For , we use the Haardt & Madau (2001) UVB background that corresponds to the earlier tabulated redshift, .. Note that the critical virial temperature for gas to become self-gravitating and collapse is not a constant, contrary to common assumptions (e.g. Bullock et al., 2000; Okamoto & Frenk, 2009; Bose et al., 2019; Graus et al., 2019). Moreover, the critical temperature exhibits a maximum at , when the Haardt & Madau (2001) photoheating rate peaks.
For comparison, we also show the critical mass and virial temperature for the particular isothermal case in which . For this particular case, the critical temperature remains constant, as expected. Interestingly, for this particular value of , the isothermal case resembles our model reasonably well. Note, however, that it can depart from our model by more than a factor of at high redshift. The black dashed line in the bottom panel shows the critical halo mass above which atomic hydrogen cooling becomes efficient (equation 1), and corresponds to the critical halo mass for galaxy formation in the absence of an external UVB radiation field.
We conclude this section by highlighting another central feature of our model:
-
•
Dark matter haloes less massive than at that did not exceed either the atomic hydrogen cooling limit prior to cosmic reionization or the critical mass imposed by the external UVB afterwards will remain “dark” at ; otherwise they will be luminous (see also Fig. 1). Galaxy formation below the (present-day) mass scale is thus largely stochastic and dependent on the assembly history of individual CDM haloes.
We now turn our attention to a comparison between the predictions of our models and the results of high-resolution hydrodynamical cosmological simulations. We introduce the simulation in Section 3.1, provide details of the identification of substructures in Section 3.2, and present the detailed comparison in Section 3.3.
3 Techniques
3.1 Simulation details
We consider a random realisation of a periodic cosmological cubic volume of side , with initial conditions obtained using the publicly available code MUSIC (Hahn & Abel, 2011). The simulation volume is filled with dark matter particles and the same number of gas particles, so that the dark matter and gas particle masses are: and , respectively. The Plummer-equivalent gravitational softening, , adopted in our simulation never exceeds of the mean interparticle separation. This gives for both the gas and the dark matter particles. We assume cosmological parameters consistent with early Planck results (Planck Collaboration et al., 2014)888We have chosen these parameters so that our simulation is consistent with those of the EAGLE collaboration..
We performed the simulation with the version of the code P-Gadget3 (last described in Springel, 2005) previously used for the EAGLE project (Schaye et al., 2015; Crain et al., 2015). We refer the reader to the original papers for further details about the physics modules included in the simulation. We describe here only those relevant for our analysis.
The simulation includes radiative cooling and a uniform, isotropic, redshift-dependent UVB spectrum (Haardt & Madau, 2001). The simulation follows star formation, stellar evolution, supernova feedback and chemical enrichment. Gas cooling is calculated using the Wiersma et al. (2009) cooling tables, which include cooling due to several metal species. For our purposes, however, cooling by primordial hydrogen and helium are the only relevant processes.
Reionization is modelled by turning on the isotropic Haardt & Madau (2001) UVB at the redshift of reionization, assumed to be 999Recent results (Planck Collaboration et al., 2018) are consistent with a redshift of reionization, . We show in Sec. 4 that our results are not significantly affected by the choice of provided .. In order to ensure that gas is quickly heated to at high redshift, an energy of 2 eV per proton mass is injected instantaneously at .
Star formation proceeds stochastically according to the Kennicut-Schmidt law in gas particles whose density is above a threshold, . In the EAGLE simulations, the density threshold for star formation is a function of metallicity. We do not make this assumption here and instead assume a constant value, , motivated by the discussion of Section 2 (see also Fig. 2). The results of our simulation should not be strongly dependent on the assumed value of provided this value is comparable to or larger than , above which gas becomes self-gravitating in low-mass haloes (e.g., Benítez-Llambay et al., 2019). Once the gas in the simulation becomes self-gravitating, its maximum density is limited either by resolution or by the adopted threshold.
The EAGLE model imposes a temperature floor, for high-density gas, , where is the ratio of specific heats, and . We adopt this temperature floor to prevent the development of extremely high densities, which might impact the run time of the simulation. This density-dependent temperature floor affects only star-forming gas, so it should not affect the comparison between the starless haloes of our model and those from the simulation.
3.2 Identification of haloes in the simulation and mass assembly histories
Dark matter haloes are identified using the publicly available code HBT+ (Han et al., 2018). In short, HBT+ uses an input catalogue of friends-of-friends haloes, constructed using the standard linking length, (Davis et al., 1985), and determines which particles are gravitationally bound to each halo, discarding the rest. The unbinding procedure starts at the earliest snapshot ( in our case) and the list of gravitationally bound particles in each halo is then passed to the next snapshot to identify the descendant halo. When multiple progenitors end up in the same descendant, a main progenitor is determined according to mass, and the remaining particles are subject to the unbinding procedure to create satellite subhaloes. Finally, the bound particles that do not belong to any satellite are assigned to the main progenitor. These steps are repeated between consecutive snapshots until the final snapshot of the simulation is reached.
Applying this algorithm to all the simulation outputs results in a catalogue of central and satellite galaxies at redshift along with their time evolution. We shall refer to the evolution of the mass of the main progenitor as the Mass Assembly History. High completeness of the halo and subhalo catalogues can be achieved by sampling the evolution from redshift to with 60 snapshots (Han et al., 2012). Our simulation has more than twice this number.
The HBT+ catalogue provides an extensive set of halo properties, such as position, velocity, virial mass, gas mass, stellar mass, etc. It also provides a list of particles (gas, dark matter and stars) gravitationally bound to each central and satellite halo. We shall refer to these particles as the bound particles.
3.3 Comparison between our model and our CDM hydrodynamics simulation
The properties of RELHICs (REionization Limited HI Clouds; Benítez-Llambay et al. 2017) –starless haloes whose gas is in thermal equilibrium with the external UVB radiation field and in hydrostatic equilibrium within the halo– provide an important test of our model. The model (Section 2) predicts the existence of these RELHICs in the mass range at . In order to test the model we select all field dark matter haloes in our simulation of mass, , that contain at least one bound gas particle and no stars. These haloes are resolved with more than 150 dark matter particles in our simulation.
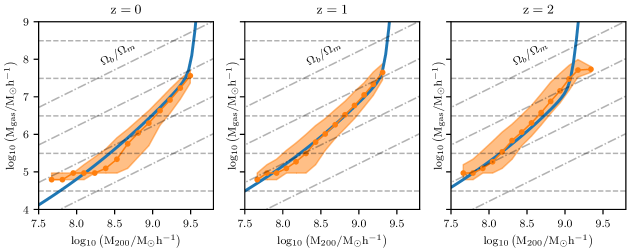
Fig. 7 shows the bound gas mass within the virial radius of the selected haloes, as a function of halo mass at redshifts and . The running medians and the 10-90th percentiles of the distributions are shown by the orange circles and shaded regions, respectively.
The overall agreement between the gas mass of the simulated RELHICs and the predictions of our model is remarkable, even in systems that contain fewer than 10 bound gas particles. Both, the zero point and the slope of the relation agree. This is not entirely surprising when we consider that the thermodynamic properties of the gas inside starless systems are largely established by external processes. One of these is the presence of an external gravitational potential sourced by (well-resolved) dark matter haloes; the other is the interplay between photoheating and cooling. The agreement between our model and the simulation demonstrates that the gas particles inside the RELHICs trace the local gas density fluctuations of the intergalactic medium induced by the presence of a dark matter halo.
This result extends those of Benítez-Llambay et al. (2017), where we probed this regime using a limited sample of haloes taken from a zoom-in simulation of the Local Group at redshift only. Our simulation validates the assumptions made in Section 2 in a cosmological context, for a large sample of haloes as a function of time. Interestingly, the number of gaseous haloes decreases dramatically as the halo mass approaches the critical mass, where the model predicts a sharp upturn in gas mass (see Fig. 5). This is because the fraction of dark matter haloes that host a luminous galaxy increases steadily with halo mass above and becomes unity above the critical mass. As a consequence, the number of starless gaseous haloes drops significantly near the critical mass. This validates our interpretation that the gas in RELHICs is expected to lose pressure support and collapse once the halo mass . We will return to this point in Section 4.
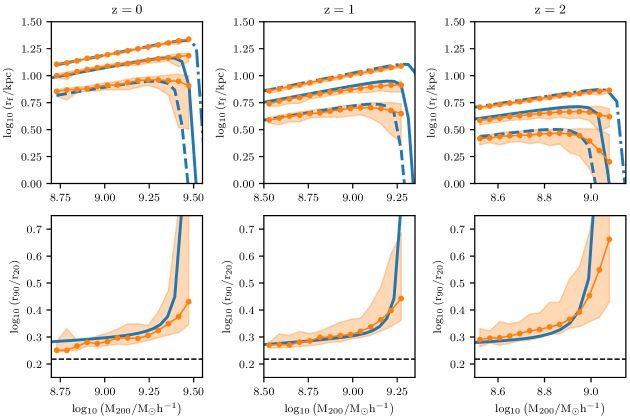
A further test of the model is provided by the detailed radial structure of the RELHICs, which we characterise by the radii, , encompassing a fraction, , of the total gas mass. For the haloes in the simulation, is obtained from the gas particles bound to the systems while for the model, is calculated numerically. In order to measure reliably in the simulation we restrict our analysis to systems that contain more than 100 bound gas particles at the redshift of interest.
The top panel of Fig. 8 shows , for , as a function of halo virial mass at the same three redshifts as before. The orange circles and shaded regions show the running median and 10-90th percentiles for the simulated haloes. The blue lines show the results of our model. The agreement between the simulated density profiles and the predictions of the model of Section 2 is very good. This is a non-trivial result that further validates the model and demonstrates that the gaseous structure of RELHICs is well understood. The bottom panel of the same figure shows the concentration of RELHICs, defined as the ratio, , as a function of halo mass. For comparison, the horizontal dashed line shows the expected concentration if the gas density profile were constant, i.e., .
We conclude that the detailed structure of RELHICs, i.e., post-reionization starless gaseous haloes in CDM, can be understood from three simple considerations:
-
•
The dark matter profiles of dark matter haloes are well described by the NFW form.
-
•
Gas in RELHICs is in thermal equilibrium with the external UVB radiation field.
-
•
The external pressure of RELHICs is equal to that of the intergalactic medium.
3.4 Synthetic Mass Assembly Histories
The limited resolution of our simulation precludes following the formation of dark matter haloes below a minimum mass of a few . This imposes a maximum (mass-dependent) redshift above which our simulation is no longer valid. In order to overcome this limitation we construct a set of synthetic assembly histories using the Extended Press-Schechter formalism (EPS, Bond et al., 1991; Bower, 1991) and the method proposed by Lacey & Cole (1993). Specifically, for 50 mass bins equally spaced logarithmically in the range , we calculate 500 CDM assembly histories per mass bin, from redshift to , in 406 equally-spaced redshift bins. We shall refer to these synthetic assembly histories as “EPS assembly histories”.
As we demonstrate in Appendix C, our set of EPS assembly histories agree well with those measured in the simulation down to the resolution limit of the simulation ().
4 RESULTS
4.1 Mass assembly histories and the onset of galaxy formation
Prior to reionization, we will assume that galaxies can only form in haloes in which atomic hydrogen cooling becomes efficient, as discussed in the Introduction. (We will test the impact of a different assumption in Section 4.3.) Once the universe is reionized, we can follow the fate of the gas in haloes using our model of Section 2. Gas is not able to collapse into every dark matter halo so not all haloes will host a visible galaxy. We define the Halo Occupation Fraction (HOF) as the fraction of dark matter haloes that host a luminous galaxy, as a function of redshift and halo mass. Similar definitions have been adopted by other authors to quantify the ability of dark matter haloes to host stars prior to reionization (e.g., Xu et al., 2016).
The onset of galaxy formation is closely related to the assembly history of CDM haloes and to the redshift-dependent critical mass for gas to lose pressure support and collapse. As we have seen, after reionization the critical mass is set by the presence of the UVB radiation field; before reionization further assumptions are required.
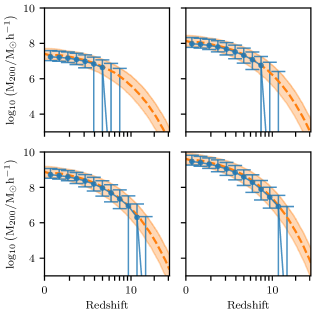
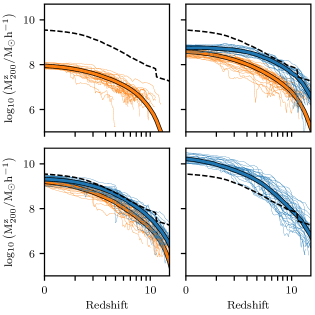
Fig. 9 shows the assembly history of a random selection of haloes identified in our CDM cosmological hydrodynamics simulation, split into four bins according to their mass at . A variety of different formation histories can give rise to the same final mass. The black dot-dashed line shows the critical mass for galaxy formation derived in Section 2, assuming a constant concentration, , for all haloes, a redshift of reionization, (i.e. consistent with that in our simulation) and a critical mass for galaxy formation prior to cosmic reionization described by equation (1). Haloes that do not host a luminous galaxy at are shown by orange lines; those that have a stellar component (of at least one star particle) at are shown by blue lines. The medians of each set are shown by the thick lines of the corresponding colour.
The top left panel shows that the mass of all dark matter haloes with present-day mass, , always remain below the critical mass required for galaxies to form. As expected, none of these haloes hosts a galaxy in our simulation. More massive haloes may or may not cross the critical mass for galaxy formation; only those whose mass exceeded, or was comparable to the critical mass some time in the past will host a luminous galaxy at . Remarkably, we find in the simulation that indeed the only dark matter haloes that contain a galaxy at their centre at are those whose mass was above or close to the critical mass in the past (see, e.g., top-right panel). Moreover, we find that galaxy formation actually begins soon after the haloes cross this critical mass (see Appendix B).
As the present-day halo mass increases, so does the fraction of haloes that cross the critical mass. If the mass today is large enough so that every dark matter halo once exceeded the critical mass, then the fraction of dark matter haloes hosting a luminous galaxy today becomes unity. This trend was already seen in a number of studies of the formation of dwarf galaxies in cosmological hydrodynamical simulations (e.g., Hoeft et al., 2006; Okamoto et al., 2008; Okamoto & Frenk, 2009; Sawala et al., 2016; Benítez-Llambay et al., 2015; Fitts et al., 2017, and references therein), but the exact value of the critical mass for galaxy formation is somewhat uncertain, although it is not far from the mass corresponding to a virial temperature, . This uncertainty is removed by our model which can be used to understand quantitatively the Halo Occupation Fraction.
The key to understanding the HOF is the mass accretion history. To demonstrate this we select all field dark matter haloes in our simulation identified by HBT+ and compare their growing mass, determined by their individual assembly histories, to the critical mass, . If the mass of a simulated halo exceeds the critical mass at some redshift, we label this halo as luminous, that is, we assume that gas will be able to collapse and form a galaxy at its centre. Otherwise we label the halo as dark. We then calculate the HOF as a function of halo mass, based on this classification only and compare it to the fraction of halos that actually host a galaxy in the simulation.
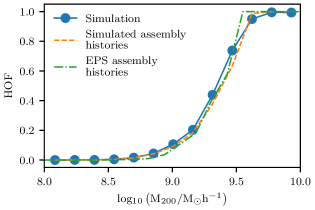
Fig. 10 compares the HOF measured in three ways: directly in our cosmological simulation at , from our model applied to the assembly histories inferred in the simulation and from our model applied to synthetic assembly histories derived from EPS theory. The agreement amongst all three is excellent. This demonstrates that the HOF is a result of the existence of a critical halo mass for galaxies to form and the stochastic nature of the growth of CDM haloes. We thus conclude the following (where the numbers are valid for the Haardt & Madau 2001 UVB assumed in our simulation):
-
•
At field dark matter haloes less massive than do not host a luminous galaxy. The gravitational force in these haloes is not strong enough to overcome the pressure of the gas imparted by the UVB.
-
•
All dark matter haloes more massive than host a galaxy at . Gas pressure cannot prevent gravitational collapse. Once dark matter haloes exceed this mass, they will inevitably form a galaxy at their centre.
-
•
The halo occupation fraction in the mass range is determined by the scatter in the assembly histories of CDM haloes.
Two main assumptions lie behind these conclusions: (i) galaxy formation is largely determined by atomic hydrogen cooling prior to cosmic reionization; (ii) cosmic reionization occurred at . We now discuss how sensitive our conclusions are to variations of these assumptions. First we consider the impact of varying the redshift of reionization and then of relaxing our criterion for galaxy formation in low-mass haloes prior to reionization. To this end we will use our set of EPS assembly histories.
4.2 The effect of on the Halo Occupation Fraction
To assess the effect of the redshift of reionization, , on the HOF at , we use our set of EPS assembly histories and vary the value of . This has a direct impact on the value of the critical mass for galaxy formation. For , we assume that galaxy formation occurs only in haloes in which atomic hydrogen cooling is efficient. We model the effect of reionization by assuming that the cosmic gas is suddenly placed on the density-temperature relation shown in Fig. 4, for the appropriate redshift.
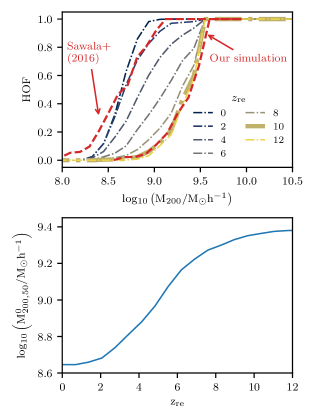
Fig. 11 shows the result of this calculation. The HOF is clearly sensitive to the assumed value of unless reionization occurred either early or very late. For example, the bottom panel of Fig. 11 shows that for (thick line in the top panel), the halo mass at which only half the dark matter haloes host a luminous galaxy is . On the other hand, if the universe is reionized at , the value of is a factor of 4 lower. In the limiting case of a universe that experiences very late reionization (or no reionization), the assumption that galaxies form through atomic hydrogen cooling yields . For comparison, the left red dashed line in the top panel shows the HOF measured in a zoom-in simulation of the Local Group carried out by Sawala et al. (2016) that does not include reionization. Reassuringly, our model reproduces their simulation results very well. We also plot the result of our own simulation, in which cosmic reionization occurs at , i.e., early enough that the measured HOF is independent of the exact value of .
We conclude that if galaxy formation is largely determined by atomic hydrogen cooling prior to cosmic reionization, then:
-
•
the HOF is insensitive to the redshift of reionization provided and .
-
•
the HOF depends strongly on the redshift of reionization if .
The model of Section 2 thus provides a simple framework to account for both the qualitative and quantitative effect of on the HOF. We now turn our attention to the impact of varying the critical mass for galaxy formation prior to reionization.
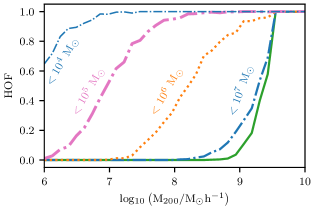
4.3 Pre-reionization galaxy formation and the Halo Occupation Fraction
We now investigate the sensitivity of the HOF to assumptions about how galaxy formation proceeds prior to reionization. For the purposes of this discussion we fix the redshift of reionization to .
Fig. 12 shows the HOF obtained from our model, using our set of EPS assembly histories for different assumptions. Specifically, we consider the limiting case where all dark matter haloes reach without hosting a luminous galaxy (green solid curve), as well as the cases when galaxy formation before occurs in halos of mass (blue dot-dashed line), (orange dotted line), (pink dot-dashed line), and (blue dot-dashed line). Not surprisingly, these different assumptions about pre-reionization galaxy formation have a dramatic impact on the HOF.
The critical mass for atomic hydrogen cooling to become efficient at is . For this value of , the present-day HOF varies little if we assume that all dark matter haloes reach without a luminous galaxy in them or only those with . However, if we allow less massive haloes to be populated with luminous galaxies prior to reionization - such as haloes of mass at - then the HOF becomes very sensitive to our assumptions.
One caveat of the exercise carried out in Fig. 12 is that the halo occupation fraction prior to reionization may not be a simple step function. Although the formation of the first galaxies depends primarily on halo mass, it may also depend on secondary parameters possibly related to the local environment (e.g. Couchman & Rees, 1986; Yoshida et al., 2003, 2006, and references therein). Recent numerical simulations by Wise et al. (2014) show, however, that although the halo occupation fraction is not a step function prior to reionization, the transition between luminous and starless haloes occurs over a very narrow range of halo mass at (roughly a factor of 3 in halo mass below the atomic hydrogen cooling limit).
We will next show that if the redshift of reionization is lower than , the HOF depends quite strongly on the assumptions about galaxy formation before reionization whereas if the redshift is higher, the converse is true.
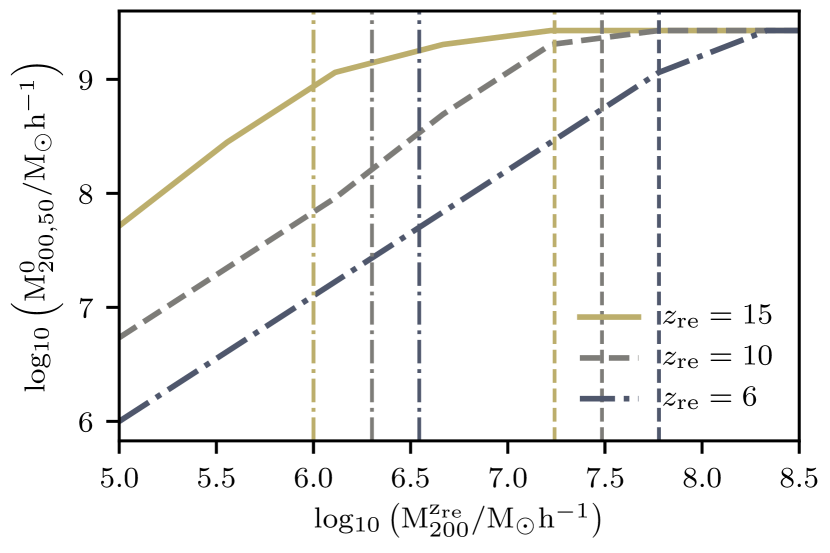
4.4 Combined impact of and pre-reionization galaxy formation
We now explore how the HOF depends on variations of both the assumed redshift of reionization, , and the pre-reionization critical mass for galaxy formation, . For each value of , we compute the HOF by comparing the individual EPS assembly histories to the critical mass derived from our model (Section 2), assuming that haloes more massive than at are already luminous at . We express the outcome of this calculation as the halo mass at at which only half of the dark matter haloes are luminous, , as a function of both, and . This is shown in Fig. 13 for three different assumed values of .
Fig. 13 shows that both and affect the characteristic mass scale at which of the haloes are luminous at . As discussed in the previous section, if reionization occurred early, the characteristic halo mass at at which of the haloes remain dark is roughly independent of assumptions about early galaxy formation, as long as galaxies form in haloes more massive than prior to . However, if reionization occurs much later, then the critical halo mass for galaxy formation before reionization has a much greater impact on the HOF.
Detailed cosmological simulations of the formation of the first galaxies - which include cooling processes, such as molecular hydrogen cooling, ignored by our simulation - seem to support the idea that the process of galaxy formation is largely triggered only in haloes in which atomic hydrogen cooling becomes efficient, i.e., those more massive than at (see e.g., Xu et al., 2013; Xu et al., 2016, and references therein). For such high redshift of reionization, our results are already robust even if we allow haloes 10 times smaller than this to host a galaxy by that time.
If the redshift of reionization is much lower, say, then the critical halo mass at which of the dark matter haloes host a galaxy by today becomes independent of the exact assumptions about early galaxy formation, provided galaxy formation occurs in haloes more massive than before reionization. This mass is not far from the atomic hydrogen cooling limit at (vertical green dashed line), but allowing low-mass haloes with virial temperature (vertical dot-dashed lines) to host a galaxy at , has a large impact on the HOF.
We conclude that the lower the redshift of reionization, the more dependent the HOF is on assumptions about pre-reionization galaxy formation. Neglecting cooling processes that are important below a virial temperature of , as we have done, might affect the expected HOF if reionization occurred as late as .
5 DISCUSSION
The agreement between the model of Section 2 and our high-resolution cosmological hydrodynamic simulation suggests that the onset of galaxy formation in low-mass haloes, as well as the detailed structure of RELHICs, can be understood in detail in the context of the CDM cosmology. The key inputs are: (i) the redshift at which hydrogen was reionized, (ii) the redshift-dependent temperature of the intergalactic medium after reionization (which is largely set by the external UVB radiation field), and (iii) the minimum halo mass in which galaxies can form prior to reionization. Some of the predictions of our model are relatively insensitive to the details of these inputs.
If reionization occurred in the redshift range, , as indicated by recent Planck results (Planck Collaboration et al., 2018), then the minimum halo mass today that can host a luminous galaxy cannot be much smaller than , unless galaxy formation was able to take place in haloes of virial temperature prior to reionization (or at ). Recent hydrodynamical simulations indicate that this is unlikely (Xu et al., 2016). Thus, the mass scale should be a general outcome of simulations of galaxy formation, regardless of the details of the physical modelling.
Shen et al. (2014) studied the formation of dwarf galaxies in seven halos in the mass range , in high-resolution zoom simulations carried out with the GASOLINE code. They assumed the Haardt & Madau (2012) UVB external radiation field and a redshift of reionization, . They found that three of their haloes, of mass less than , remained starless at . They also found that the gas density in these “dark” haloes had never exceeded , a value well below the imposed density threshold for star formation in their simulations (). These results are in excellent agreement with ours and are readily understood in terms of our model of Section 2. In this mass range, our model predicts a maximum central gas density almost two orders of magnitude lower than that reached in haloes that are close to the critical mass (see bottom panel of Fig. 3).
The same minimum halo mass for galaxy formation also emerges from the high-resolution zoom cosmological simulations of dwarf galaxies carried out by Munshi et al. (2019), also with the GASOLINE code, but with different assumptions for star formation. They found that both simulations that include, and simulations that ignore molecular hydrogen cooling make galaxies only in field haloes more massive than at , as predicted by our model. The authors find that neglecting molecular hydrogen cooling produces twice as many luminous galaxies as when this cooling process is included. This counterintuitive result, which is at odds with the expectations of our model, may simply reflect the particular treatment of star formation in the latter simulations, which is closely tied to the fraction of molecular hydrogen. There is observational (e.g., Michałowski et al., 2015) and theoretical (e.g. Hu et al., 2016) evidence suggesting that the presence of molecules is a sufficient, but not a necessary condition for star formation, which is mostly regulated by atomic hydrogen. For example, the high-resolution cosmological hydrodynamical simulations of Xu et al. (2013) that include radiative transfer, non-equilibrium chemistry and cooling by molecular hydrogen are consistent with the onset of galaxy formation being regulated mainly by atomic, rather than molecular hydrogen cooling prior to reionization.
Thus, our results, together with those from other authors, provide strong evidence for the existence of a minimum halo mass below which galaxy formation cannot proceed. The descendents of these barren haloes have mass, , at . Finding a luminous galaxy in a dark matter halo close to this mass scale should be rare, but not impossible. For example, our simulation indicates that there should be luminous galaxies inhabiting haloes of mass . Claims challenging the CDM model on the grounds that there are nearby field dwarfs surrounded by low-mass haloes of mass (Ferrero et al., 2012) should therefore be treated with caution.
Finally, our results also indicate that field dark matter haloes above the mass scale, , should always host a luminous galaxy at . As far as we are aware, no simulation of galaxy formation has ever found a dark matter halo with mass above this mass scale that remains devoid of stars at (e.g. Benítez-Llambay et al., 2015; Sawala et al., 2016; Fitts et al., 2017; Munshi et al., 2019, and references therein).
6 SUMMARY AND CONCLUSIONS
We have developed a simple theoretical framework, in the context of the CDM cosmological model, to follow the formation of the first galaxies before and after the reionization of hydrogen at early times. In particular, we have introduced a simple analytical model to calculate the properties of the gas component of haloes after reionization. Within this framework we have addressed two specific problems: the mass of the smallest haloes that can sustain galaxy formation, and the properties of RELHICs -starless gaseous haloes whose gas was unable to collapse by the time the universe reionized-. We introduced the concept of the Halo Occupation Fraction (HOF), which we have defined as the fraction of dark matter haloes that host a luminous galaxy today as a function of halo mass.
In our model galaxy formation can only take place in haloes whose mass exceeds a redshift-dependent critical value, . Before reionization, is the mass at which atomic hydrogen cooling becomes effective, at , for example. After reionization, is the mass above which gas, which was previously kept in equilibrium in a halo by the pressure of the UVB radiation, can no longer remain in hydrostatic equilibrium and therefore collapses to make a galaxy. The HOF is then the result of the interplay between the evolution of this critical mass and the assembly history of haloes. It is completely determined by three factors: the minimum halo mass for galaxy formation before reionization; the redshift of reionization, ; and the intensity of the (evolving) external photoheating rate.
The properties of haloes whose gaseous component has not yet collapsed to make a luminous galaxy by are determined by the effects of reionization. After reionization, the temperature of the gas in the high-density intergalactic medium is set by the balance between radiative cooling and photoheating and, in low density gas, by photoheating alone. We developed a simple analytical model to study how the properties of the ionized intergalactic medium affects the properties of gaseous haloes as a function of time.
We validated our model by comparing with results of a cosmological hydrodynamics simulation that models the main astrophysical processes involved in galaxy formation. The main conclusions arising from our model may be summarised as follows.
-
•
If, prior to reionization, galaxies form predominantly from gas that condenses through atomic hydrogen cooling, then the HOF at is almost insensitive to provided . We tested two limiting cases, and , with our high-resolution cosmological hydrodynamical simulation and found that the HOF agrees remarkably well with the predictions of our model (see Fig. 11).
-
•
If the redshift of reionization is , then the HOF becomes insensitive to the details of how gas cools within haloes before reionization. For example, if , and galaxies were able to form before this redshift in haloes more massive than (in which molecular hydrogen cooling could be relevant) there would be very little change in the HOF.
-
•
If the redshift of reionization is , the HOF depends sensitively on the minimum halo mass that can host a luminous galaxy before reionization. For example, if gas cooled mainly by molecular (rather than atomic) hydrogen processes in haloes of virial temperature , then the mass scale at which 50% of the haloes are luminous at can vary by more than a factor of 10 compared to the atomic hydrogen cooling case (see, e.g., Fig. 13).
-
•
The potential well of dark matter haloes less massive than at is not deep enough to overcome the pressure force produced by the external Haardt & Madau (2001) UVB radiation field. The gas completely evaporates from these haloes which are therefore gas free at . They will also be star-free unless galaxy formation occurred in haloes of mass prior , which is unlikely.
-
•
The gas content of dark matter haloes in the mass range at is drastically reduced (but not completely removed) by the presence of the UVB radiation field. A small fraction of the remaining gas is prevented from collapsing by the external radiation field, with which it is in thermal equilibrium, and is confined, in hydrostatic equilibrium, within the potential well of the halo, without forming stars. These are the objects we previously identified in cosmological hydrodynamics simulations and called RELHICs (Reionization limited HI clouds; Benítez-Llambay et al. 2017). The gas density profiles of RELHICs are flat at large distances from the halo centre and have a well-defined maximum value at the centre; this latter property is a direct consequence of the gas being in equilibrium in the cuspy dark matter distribution of CDM haloes.
-
•
The amount of gas required to overcome the gravitational acceleration of dark matter haloes more massive than exceeds the universal baryon fraction () by orders of magnitude. This gas cannot remain in hydrostatic equilibrium and will therefore collapse to make a luminous galaxy.
We tested the results of our analytical model by comparing with cosmological hydrodynamics simulations. We find that our predicted HOF is reproduced remarkably well in the simulations. Similarly, the gas mass and internal structure of RELHICs predicted by our model are reproduced very well in the simulations.
Our results apply strictly to field (or central) dark matter haloes, not to satellites of more massive systems. Unlike field haloes whose mass can only grow with time, satellites can lose mass by tidal stripping. Note, however, that our model applies to satellites before they fell into their host halo.
Our simulation indicates that there should be fewer than field luminous galaxies inhabiting dark matter haloes of mass in the Local Volume101010We take the Local Volume to be sphere of Mpc centred on the Milky Way, and assume that our simulation is representative of the Local Volume.. Finding many more nearby field dwarfs in such low-mass haloes would require either a revision of our current understanding of how (and when) reionization occurred or of how galaxy formation proceeded before reionization. Interestingly, Jethwa et al. (2018) and Graus et al. (2019) have recently claimed, based on simulations, that such a population of galaxies might be required to explain the sheer number and radial distribution of ultrafaint galaxies observed around the Milky Way but Bose et al. (2019) argue that these results are affected by numerical resolution and that, when these effects are taken into account, the data are in good agreement with the observed number of ultrafaint satellites. In any case, our model provides a theoretical framework to address these issues and interpret that data without the need for cosmological simulations and thus, independent of computational cost or resolution limitations.
In summary, if the onset of galaxy formation is largely determined by atomic hydrogen cooling in small haloes before reionization, then we expect a cutoff in the galaxy mass function at a halo mass, , at . Finding an isolated luminous galaxy in a dark matter halo below this mass scale would be a remarkable discovery that would challenge not only the current cosmological model, but also current understanding of galaxy formation.
7 Acknowledgements
We are particularly grateful to Tom Theuns, John Regan and John Wise for providing detailed comments on an earlier version of our paper. These helped to improve our presentation. We also acknowledge the anonymous referee for their report which helped to improve the current manuscript. We acknowledge support from the European Research Council through ERC Advanced Investigator grant, DMIDAS [GA 786910] to CSF. This work was also supported by STFC Consolidated Grants for Astronomy at Durham ST/P000541/1 and ST/T000244/1. This work used the DiRAC Data Centric system at Durham University, operated by the Institute for Computational Cosmology on behalf of the STFC DiRAC HPC Facility (www.dirac.ac.uk). This equipment was funded by BIS National E-infrastructure capital grants ST/P002293/1, ST/R002371/1 and ST/S002502/1, Durham University and STFC operations grant ST/R000832/1. DiRAC is part of the National e-Infrastructure. The simulation used in this work was performed using DiRAC’s director discretionary time. We are grateful to Prof. Mark Wilkinson for awarding this time.
Data availability
The data underlying this article will be shared on reasonable request to the corresponding author.
References
- Babul & Rees (1992) Babul A., Rees M. J., 1992, MNRAS, 255, 346
- Barkana & Loeb (1999) Barkana R., Loeb A., 1999, ApJ, 523, 54
- Benítez-Llambay et al. (2015) Benítez-Llambay A., Navarro J. F., Abadi M. G., Gottlöber S., Yepes G., Hoffman Y., Steinmetz M., 2015, MNRAS, 450, 4207
- Benítez-Llambay et al. (2017) Benítez-Llambay A., et al., 2017, MNRAS, 465, 3913
- Benítez-Llambay et al. (2019) Benítez-Llambay A., Frenk C. S., Ludlow A. D., Navarro J. F., 2019, MNRAS, 488, 2387
- Benson et al. (2002a) Benson A. J., Lacey C. G., Baugh C. M., Cole S., Frenk C. S., 2002a, MNRAS, 333, 156
- Benson et al. (2002b) Benson A. J., Frenk C. S., Lacey C. G., Baugh C. M., Cole S., 2002b, MNRAS, 333, 177
- Bond et al. (1991) Bond J. R., Cole S., Efstathiou G., Kaiser N., 1991, ApJ, 379, 440
- Bose et al. (2019) Bose S., Deason A. J., Belokurov V., Frenk C. S., 2019, arXiv e-prints, p. arXiv:1909.04039
- Bower (1991) Bower R. G., 1991, MNRAS, 248, 332
- Bullock et al. (2000) Bullock J. S., Kravtsov A. V., Weinberg D. H., 2000, ApJ, 539, 517
- Couchman & Rees (1986) Couchman H. M. P., Rees M. J., 1986, MNRAS, 221, 53
- Crain et al. (2015) Crain R. A., et al., 2015, MNRAS, 450, 1937
- Davis et al. (1985) Davis M., Efstathiou G., Frenk C. S., White S. D. M., 1985, ApJ, 292, 371
- Efstathiou (1992) Efstathiou G., 1992, MNRAS, 256, 43P
- Ferrero et al. (2012) Ferrero I., Abadi M. G., Navarro J. F., Sales L. V., Gurovich S., 2012, MNRAS, 425, 2817
- Fitts et al. (2017) Fitts A., et al., 2017, MNRAS, 471, 3547
- Gnedin (2000) Gnedin N. Y., 2000, ApJ, 542, 535
- Graus et al. (2019) Graus A. S., Bullock J. S., Kelley T., Boylan-Kolchin M., Garrison-Kimmel S., Qi Y., 2019, MNRAS, 488, 4585
- Haardt & Madau (2001) Haardt F., Madau P., 2001, in Neumann D. M., Tran J. T. V., eds, Clusters of Galaxies and the High Redshift Universe Observed in X-rays. p. 64 (arXiv:astro-ph/0106018)
- Haardt & Madau (2012) Haardt F., Madau P., 2012, ApJ, 746, 125
- Hahn & Abel (2011) Hahn O., Abel T., 2011, MNRAS, 415, 2101
- Han et al. (2012) Han J., Jing Y. P., Wang H., Wang W., 2012, MNRAS, 427, 2437
- Han et al. (2018) Han J., Cole S., Frenk C. S., Benitez-Llambay A., Helly J., 2018, MNRAS, 474, 604
- Hoeft et al. (2006) Hoeft M., Yepes G., Gottlöber S., Springel V., 2006, MNRAS, 371, 401
- Hu et al. (2016) Hu C.-Y., Naab T., Walch S., Glover S. C. O., Clark P. C., 2016, MNRAS, 458, 3528
- Ikeuchi (1986) Ikeuchi S., 1986, Ap&SS, 118, 509
- Jenkins et al. (2001) Jenkins A., Frenk C. S., White S. D. M., Colberg J. M., Cole S., Evrard A. E., Couchman H. M. P., Yoshida N., 2001, MNRAS, 321, 372
- Jethwa et al. (2018) Jethwa P., Erkal D., Belokurov V., 2018, MNRAS, 473, 2060
- Jorgenson et al. (2014) Jorgenson R. A., Murphy M. T., Thompson R., Carswell R. F., 2014, MNRAS, 443, 2783
- Klypin et al. (1999) Klypin A., Kravtsov A. V., Valenzuela O., Prada F., 1999, ApJ, 522, 82
- Krumholz et al. (2009) Krumholz M. R., Ellison S. L., Prochaska J. X., Tumlinson J., 2009, ApJ, 701, L12
- Lacey & Cole (1993) Lacey C., Cole S., 1993, MNRAS, 262, 627
- Ludlow et al. (2014) Ludlow A. D., Navarro J. F., Angulo R. E., Boylan-Kolchin M., Springel V., Frenk C., White S. D. M., 2014, MNRAS, 441, 378
- Michałowski et al. (2015) Michałowski M. J., et al., 2015, A&A, 582, A78
- Munshi et al. (2019) Munshi F., Brooks A. M., Christensen C., Applebaum E., Holley-Bockelmann K., Quinn T. R., Wadsley J., 2019, ApJ, 874, 40
- Navarro et al. (1996) Navarro J. F., Frenk C. S., White S. D. M., 1996, ApJ, 462, 563
- Navarro et al. (1997) Navarro J. F., Frenk C. S., White S. D. M., 1997, ApJ, 490, 493
- Okamoto & Frenk (2009) Okamoto T., Frenk C. S., 2009, MNRAS, 399, L174
- Okamoto et al. (2008) Okamoto T., Gao L., Theuns T., 2008, MNRAS, 390, 920
- Planck Collaboration et al. (2014) Planck Collaboration et al., 2014, A&A, 571, A1
- Planck Collaboration et al. (2018) Planck Collaboration et al., 2018, arXiv e-prints, p. arXiv:1807.06209
- Press & Schechter (1974) Press W. H., Schechter P., 1974, ApJ, 187, 425
- Quinn et al. (1996) Quinn T., Katz N., Efstathiou G., 1996, MNRAS, 278, L49
- Rees (1986) Rees M. J., 1986, MNRAS, 218, 25P
- Sawala et al. (2016) Sawala T., et al., 2016, MNRAS, 456, 85
- Schaye (2001) Schaye J., 2001, ApJ, 562, L95
- Schaye et al. (2015) Schaye J., et al., 2015, MNRAS, 446, 521
- Shen et al. (2014) Shen S., Madau P., Conroy C., Governato F., Mayer L., 2014, ApJ, 792, 99
- Somerville (2002) Somerville R. S., 2002, ApJ, 572, L23
- Springel (2005) Springel V., 2005, MNRAS, 364, 1105
- Sykes et al. (2019) Sykes C., Fumagalli M., Cooke R., Theuns T., Benítez-Llambay A., 2019, MNRAS, 487, 609
- Theuns et al. (1998) Theuns T., Leonard A., Efstathiou G., Pearce F. R., Thomas P. A., 1998, MNRAS, 301, 478
- Thoul & Weinberg (1996) Thoul A. A., Weinberg D. H., 1996, ApJ, 465, 608
- Wang et al. (2019) Wang J., Bose S., Frenk C. S., Gao L., Jenkins A., Springel V., White S. D. M., 2019, arXiv e-prints, p. arXiv:1911.09720
- Wiersma et al. (2009) Wiersma R. P. C., Schaye J., Smith B. D., 2009, MNRAS, 393, 99
- Wise et al. (2014) Wise J. H., Demchenko V. G., Halicek M. T., Norman M. L., Turk M. J., Abel T., Smith B. D., 2014, MNRAS, 442, 2560
- Xu et al. (2013) Xu H., Wise J. H., Norman M. L., 2013, ApJ, 773, 83
- Xu et al. (2016) Xu H., Wise J. H., Norman M. L., Ahn K., O’Shea B. W., 2016, ApJ, 833, 84
- Yoshida et al. (2003) Yoshida N., Abel T., Hernquist L., Sugiyama N., 2003, ApJ, 592, 645
- Yoshida et al. (2006) Yoshida N., Omukai K., Hernquist L., Abel T., 2006, ApJ, 652, 6
Appendix A Effective density-temperature relation of star-free gaseous haloes
Table 1 summarises the density-temperature relation used in this work which is derived from the Wiersma et al. (2009) cooling tables.
| -8.0 | -7.5 | -7.0 | -6.5 | -6.0 | -5.5 | -5.0 | -4.5 | -4.0 | -3.5 | -3.0 | -2.5 | -2.0 | -1.5 | -1.0 | -0.5 | 0.0 | |
|---|---|---|---|---|---|---|---|---|---|---|---|---|---|---|---|---|---|
| 2.89 | 3.16 | 3.45 | 3.73 | 4.02 | 4.28 | 4.49 | 4.54 | 4.43 | 4.30 | 4.20 | 4.13 | 4.08 | 4.03 | 4.00 | 3.97 | 3.94 | |
| 2.83 | 3.00 | 3.23 | 3.49 | 3.76 | 4.03 | 4.29 | 4.51 | 4.63 | 4.53 | 4.40 | 4.29 | 4.20 | 4.14 | 4.09 | 4.04 | 4.00 | |
| 2.79 | 2.91 | 3.10 | 3.33 | 3.59 | 3.86 | 4.13 | 4.37 | 4.59 | 4.57 | 4.47 | 4.36 | 4.26 | 4.18 | 4.12 | 4.07 | 4.03 | |
| 2.81 | 2.89 | 3.03 | 3.24 | 3.49 | 3.75 | 4.02 | 4.27 | 4.51 | 4.54 | 4.44 | 4.33 | 4.23 | 4.17 | 4.11 | 4.06 | 4.02 | |
| 2.78 | 2.84 | 2.96 | 3.15 | 3.39 | 3.65 | 3.93 | 4.20 | 4.43 | 4.49 | 4.39 | 4.29 | 4.21 | 4.15 | 4.09 | 4.05 | 4.01 | |
| 2.70 | 2.76 | 2.88 | 3.07 | 3.31 | 3.57 | 3.84 | 4.13 | 4.35 | 4.43 | 4.35 | 4.26 | 4.18 | 4.13 | 4.08 | 4.03 | 4.00 | |
| 2.60 | 2.69 | 2.84 | 3.03 | 3.27 | 3.53 | 3.79 | 4.05 | 4.27 | 4.35 | 4.31 | 4.23 | 4.16 | 4.11 | 4.06 | 4.02 | 3.99 | |
| 2.44 | 2.54 | 2.72 | 2.93 | 3.19 | 3.45 | 3.71 | 3.95 | 4.15 | 4.29 | 4.27 | 4.21 | 4.15 | 4.10 | 4.05 | 4.01 | 3.98 | |
| 2.28 | 2.42 | 2.60 | 2.85 | 3.11 | 3.37 | 3.63 | 3.85 | 4.03 | 4.21 | 4.25 | 4.19 | 4.14 | 4.09 | 4.04 | 4.01 | 3.98 | |
| 2.04 | 2.24 | 2.48 | 2.73 | 3.03 | 3.27 | 3.51 | 3.71 | 3.91 | 4.11 | 4.22 | 4.18 | 4.12 | 4.08 | 4.03 | 4.00 | 3.97 |
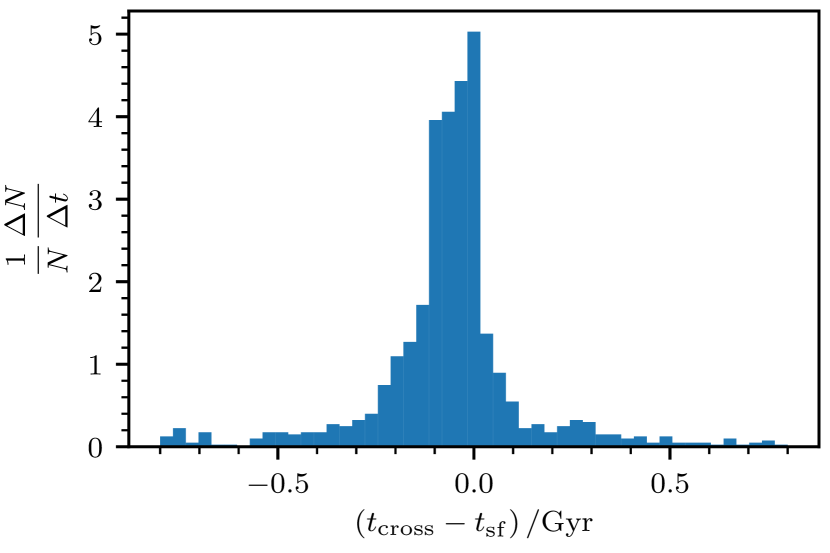
Appendix B Is galaxy formation triggered when gaseous haloes exceed the critical mass?
Galaxy formation in our simulation typically takes place soon after the RELHICs exceed the critical mass for gas to lose pressure support. We show this in Fig. 14, which displays the distribution of the difference, , i.e., the difference between the cosmic time at which the simulated dark matter haloes that host a luminous galaxy at first crossed the critical mass for galaxy formation to take place (), and the time at which the first star was formed in the halo (. The difference is close to 0, indicating that the process of galaxy formation is indeed linked to the event of exceeding the critical mass. The small bias towards negative values (i.e., ) is likely due to the time that it takes for the gas to undergo gravitational collapse before turning into stars, which is typically a few hundred .
Appendix C EPS mass assembly histories
Fig. 15 shows the comparison between the EPS assembly histories (orange dashed lines) and those constructed directly from the simulation using HBT+ (blue dots) for four bins of present-day halo mass. The shaded regions indicate the (10-90)th percentiles of the EPS assembly histories and the error bars the corresponding quantity for the simulated haloes. The EPS assembly histories agree well with those measured in the simulation down to the resolution limit of the simulation (). Furthermore, as shown in Fig. 10, the HOF derived using the EPS assembly histories (green dot-dashed line) agrees remarkably well with the HOF measured in the simulation.