A systematic study of galactic outflows via fluorescence emission:
implications for their size and structure
Abstract
Galactic outflows play a major role in the evolution of galaxies, but the underlying physical processes are poorly understood. This is mainly because we have little information about the outflow structure, especially on large scales. In this paper, we probe the structure of galactic outflows in low- starburst by using a combination of ultra-violet spectroscopy and imaging of the fluorescence emission lines (associated with transitions to excited fine-structure levels) and spectroscopy of the corresponding strongly blue-shifted resonance absorption lines. We find that in the majority of cases the observed fluorescence emission lines are much weaker and narrower than the absorption lines, originating in the star-forming interstellar medium and/or the slowest-moving part of the inner outflow. In a minority of cases, the outflowing absorbing material does make a significant contribution to the fluorescence emission. These latter systems are characterized by both strong emission lines and weak low-ionization absorption lines (both known to be empirical signs of Lyman-continuum leakage). We argue that the observed weakness of emission from the outflow seen in the majority of cases is due to the missing emission arising on scales larger than those encompassed by the aperture of the Hubble Space Telescope. This implies shallow radial density profiles in these outflows, and suggests that most of the observed absorbing material must be created/injected at radii much larger than that of the starburst. This has important implications for our understanding of both the physics of galactic outflows and for our estimation of their principal properties.
1 Introduction
Galactic outflows are invoked as the principal feedback mechanism in models of galaxy formation and evolution. Despite of a general agreement on their importance in regulating the galactic baryonic cycle, outflows are often parametrized in models or simulations by descriptions based on simple theoretical arguments and/or empirical relations. This is because the interplay among the relevant physical processes operates at scales below the resolution of any current simulation (Somerville & Davé 2015 and references therein).
Detailed observations of outflows spanning multiple scales would provide valuable inputs for “sub-grid” physics in simulations as well as help toward a complete understanding of feedbacks, but they too have been proven to be difficult (see Veilleux et al. 2005; Heckman & Thompson 2017 for recent reviews). Most of our knowledge has come from data on resonance lines seen in absorption in “down-the-barrel” spectra, from which characteristic outflow speeds and column densities can be inferred (e.g., Heckman et al. 2000, 2015; Chisholm et al. 2017). Unfortunately, those data alone provide little information on the radial structure of outflows, since they result from the integrated absorption along the line of sight. This makes it difficult to assess how and where outflows impact the rest of the galaxy’s gas supply.
One problem in particular is that the estimation of the outflow rates derived from the absorption lines depend directly on the effective size that is assumed for the absorbing material. That is, simple dimensional analysis implies that the mass outflow rate will be proportional to the column density times the outflow velocity times the outflow size. The first two quantities can be estimated from the absorption-line data, but the outflow size cannot. It is often assumed to be of-order a few times the radius of the starburst (e.g., Heckman et al. 2015). Thus, one of the most important missing pieces of data would be an estimate of the size of the region of outflowing absorbing material.
This requires mapping the outflow in emission. While this is commonly done using nebular emission lines like H (e.g., Armus et al. 1990), these nebular lines may not fairly trace the same material seen in absorption (they preferentially trace the highest density gas). Ideally, the outflow could be mapped using the resonance lines in themselves in emission. Many of these resonance transitions also have associated transitions to excited fine-structure levels that can produce fluorescence emission lines (e.g., Rubin et al. 2011; Jones et al. 2012; Erb et al. 2012; Tang et al. 2014; Finley et al. 2017). These fluorescence lines offer a major advantage over the resonance lines for probing the outflow structure. This is because it is not straightforward to disentangle the separate contributions of emission and absorption to the observed properties of the resonance lines. In contrast, the fluorescence lines are always optically-thin, and (in most cases) sufficiently offset in wavelength from the associated resonance lines that the profiles of the fluorescence and resonance lines are unaffected by the other. For this reason, the fluorescence emission lines will be the focus of this paper.
According to standard outflow models (Prochaska et al., 2011; Scarlata & Panagia, 2015; Zhu et al., 2015), the observed resonance absorption takes place in material located directly along the line-of-sight toward a background light source. For each absorbed resonance photon, a photon will be re-emitted isotropically. For ions with fine-structure splitting, this can either be a resonantly-scattered photon or a fluorescent photon. In the simple case of a spherically-symmetric outflow with no dust, the number of photons is conserved, so that the net absorbed flux should be equal to the sum of the resonantly-scattered and fluorescence emission. In contrast, observations typically show that the emission lines are significantly weaker than the absorption lines (e.g., Erb et al. 2012; Kornei et al. 2013; Tang et al. 2014; Alexandroff et al. 2015; Finley et al. 2017, 2017; Steidel et al. 2018). There are a number of ways in which weaker emission can occur. The most straightforward explanation is that the angular size of the absorbing/emitting region significantly exceeds the size of the spectroscopic aperture (“slit-loss”). This has been directly established for the emission line in Lyman Break Galaxies (LBGs) (Steidel et al., 2011). We are particularly interested in testing this possibility more generally, since it would have direct implications for the size and radial structure of outflows. In this paper, we therefore undertake a systematic comparison of the properties of the fluorescence emission lines and resonance absorption lines for a sample of star-forming galaxies driving outflows. We will utilize a combination of information coming from both ultra-violet (UV) spectroscopy and imaging.
The structure of this paper is as follows. In Section 2 we summarize the observational data sets, including both the new data taken by the Hubble Space Telescope (HST) and archival data, as well as their analysis. In Section 3 we present results on the relative strengths and widths of the fluorescence emission lines from the Cosmic Origins Spectrograph (COS; Green et al. (2012)), and discuss imaging of the fluorescence emission from the Wide Field Camera 3 (WFC3). In Section 4 we highlight correlations between line strengths and galaxy/starburst properties, and discuss implications for wind structure. We then conclude our findings in Section 5.
All the transitions considered in this paper are listed in Table 1. Also, when applicable, we adopt the best-fit cosmological parameters from the Planck 2018 analysis: , , and (Planck Collaboration et al., 2018).
| (Å) | (s-1) | (cm-1) | (cm-1) | ||
|---|---|---|---|---|---|
| 1190.42 | 6.53 | 0.277 | 0 | 84004.26 | |
| 1193.29 | 2.69 | 0.574 | 0 | 83801.95 | |
| 1194.50 | 3.45 | 0.738 | 287.24 | 84004.26 | |
| 1197.39 | 1.40 | 0.150 | 287.24 | 83801.95 | |
| 1260.42 | 2.57 | 1.224 | 0 | 79338.50 | |
| 1265.00 | 4.73 | 0.113 | 287.24 | 79338.50 | |
| 1304.37 | 3.64 | 0.093 | 0 | 76665.35 | |
| 1309.28 | 6.23 | 0.080 | 287.24 | 76665.35 | |
| 1526.72 | 3.81 | 0.133 | 0 | 65500.47 | |
| 1533.45 | 7.52 | 0.134 | 287.24 | 65500.47 | |
| 2586.65 | 8.94 | 0.072 | 0 | 38660.05 | |
| 2600.17 | 2.35 | 0.239 | 0 | 38458.99 | |
| 2612.65 | 1.20 | 0.122 | 384.7872 | 38660.05 | |
| 2626.45 | 3.52 | 0.046 | 384.7872 | 38458.99 |
Note. — Data are taken from the NIST Atomic Spectra Database.
2 Data
2.1 Sample selection
In the HST program GO-15340 (PI T. Heckman) we observed a sample of five galaxies with COS and WFC3. They were selected from SDSS based on the following criteria.
-
1.
0.064 < < 0.066. This range is determined by the transmission curve of F280N, which covers 2626 at 0.057 < < 0.072. A narrower redshift range is chosen to ensure the coverage of the bluer 2613 line, while not to include the 2600 absorption.
-
2.
Specific star-formation rate (sSFR) greater than and equivalent width (EW) of greater than 50 Å. Together they indicate substantial starbursts and therefore large outflow rate and extended fluorescence emission.
-
3.
NUV magnitude less than 19 mag. This ensures the feasibility for COS G130M observations.
-
4.
Diverse morphology. About 50 galaxies that pass the above criteria are categorized based on the optical morphology, including inclination. The galaxy with the highest NUV flux and/or EW is selected in each group.
-
5.
An estimated NUV flux of the star-bursting region inside a 3″ aperture less than 19.5 mag. This is inferred by assuming the difference between the total magnitude and the aperture magnitude in the NUV to be about the same as that in the SDSS -band.
The resulting sample is listed in Table 2.
| Name | Galaxy | WFC3 filter/COS grating | Exposure time | |
|---|---|---|---|---|
| (Central wavelength) | (s) | |||
| J0831(S) | GALEX-J083101.8+040317 | 0.065 | F280N (2832.2) | 1560+1560+2400 |
| F343N (3435.3) | 720 | |||
| F395N (3955.2) | 720 | |||
| G130M (1291) | 4928.384 | |||
| MIRRORA | 270 | |||
| J0831(N) | GALEX-J083101.8+040318 | 0.064 | G130M (1291) | 4928.352 |
| MIRRORA | 270 | |||
| J1157 | GALEX-J115747.0+583503 | 0.064 | F280N (2832.2) | 1840+1760+2640 |
| F343N (3435.3) | 720 | |||
| F395N (3955.2) | 720 | |||
| G130M (1291) | 5425.344 | |||
| MIRRORA | 270 | |||
| J1210 | GALEX-J121014.3+443958 | 0.065 | F280N (2832.2) | 1600+1600+2520 |
| F343N (3435.3) | 720 | |||
| F395N (3955.2) | 720 | |||
| G130M (1291) | 2060.384 | |||
| MIRRORA | 170 | |||
| J1618 | GALEX-J161832.6+274352 | 0.065 | F280N (2832.2) | 1600+1560+2400 |
| F343N (3435.3) | 720 | |||
| F395N (3955.2) | 720 | |||
| G130M (1291) | 2060.320 | |||
| MIRRORA | 150 |
2.2 Archival data
In addition to the five new observations listed above, we also include the following four samples from the literature.
First, we analyze the individual spectra of the Lyman break analogs (LBAs) which were previously investigated by Heckman et al. (2011); Alexandroff et al. (2015) (HST-GO-11727 and HST-GO-13017; PI T. Heckman). Second, we consider the -emitting galaxies (LAEs) as compiled in Scarlata & Panagia (2015). Lastly, we compare to two samples of high- () galaxies: the LBGs (Jones et al., 2012) and star-forming galaxies in the Keck Lyman Continuum Spectroscopic Survey (KLCS; Steidel et al. 2018).
2.3 Data processing and analysis
2.3.1 Spectra
A COS FUV spectrum usually consists of two segments. In our case, one segment covers the observed wavelength range approximately from 1286 Å to 1429 Å while another one covers from 1131 Å to 1274 Å. We first convert both segments to the rest frame of the galaxy, and then merge and smooth them with gaussian kernels of Å. An average is taken for any overlapping parts, weighted by the respective inverse uncertainties. We then remove the spectral features produced by stars using synthetic spectra generated from Starburst99 (hereafter SB99; Leitherer et al. 1999) in order to focus on the properties of the interstellar gas. The models are produced based on a star formation history of a continuous and constant rate of star formation. The stellar population, parameterized by a Kroupa initial mass function (IMF; Kroupa 2001), evolves from the zero-age main sequence using the evolutionary models of the Geneva Group. Both spectra are normalized to some local continuum near the spectral lines of interest. Those spectra are shown in three segments in Figure 1, each zooming in on: (1) 1190, 1193, 1195; (2) 1260, 1265; and (3) 1304, 1309.
We fit the spectral lines with gaussians, or multi-component gaussians in case of blended lines. We then measure EW, full width at half maximum (FWHM), and velocity centroid (). Since stellar features including the stellar continuum are removed, the average continuum level in the processed spectra lies at zero. For the purpose of defining the EW, we shift each spectrum along the y-axis to have the continuum lie at unit flux. Unless otherwise stated all measurements can be assumed to have errors on the order of 10-15% dominated by systematics in the polynomial fit to the continuum and subtraction of the SB99 models. We provide all the measurements in tabular form in the Appendix.
Unfortunately, at the 1309 line is likely to be contaminated by the Milky Way (MW) absorption line 1394. We check this by looking for another MW absorption line 1402.8. The 1309 lines in the spectra of J0831(N), J1157, and J1618 display various degrees of contamination.
Fig. Set1. Continuum-normalized spectra with the stellar features removed
2.3.2 Imaging
Images were taken with UVIS/F280N, F343N and F395N filters on the WFC3, all of which were reprocessed with the standard pipeline astrodrizzle. We align them through spline interpolation to achieve sub-pixel precision. The three exposures of F280N are stacked via exposure-time-weighted average, while the cosmic rays in the single exposures of F343N and F395N are identified using the L.A.Cosmic algorithm (van Dokkum, 2001; McCully et al., 2018) and subsequently masked.
All the images are then converted from units of electron/sec per pixel to that of flux density in per pixel.
As the F343N filter maps the UV stellar continuum, an image is obtained by subtracting an F343N image from the stacked F280N one, and an [] 3727 image is obtained by subtracting it from the F395N one.
We see small but systematic variations in the residual background in these difference images. We therefore undertake an additional step in subtracting this spatially-varying residual background. We estimate it on a mesh whose cells have scales larger than the source, but small enough to encapsulate the background variations. After subtracting the inferred spatially-varying background, we examine the histogram showing the distribution of individual pixel values after five sigma-clipping, and ensure that it follows a gaussian centered around zero.
We show contours of the continuum-subtracted and [] over-plotted on the continuum images in Figure 2.
The radial surface brightness as shown in Figure 3 is measured in a set of apertures/annuli, which centers on the strongest peak found in the continuum and extends to 6.4″. We estimate the uncertainty by measuring the flux in the same set of apertures/annuli centered on many locations of the blank sky, and then quote the values of the gaussian fits to the distribution of background fluctuations.
2.3.3 Archival data
The individual spectra of the LBAs are re-analyzed according to the description given in Section 2.3.1. For the sake of consistency, we include only galaxies with COS data and with the set of galaxy parameters that can be measured using the spectra in the SDSS. Their and line profiles are attached in the Appendix.
We also re-measure the EWs, FWHMs, and velocity centroids of the and lines in the composite spectrum of 25 LAEs at (Scarlata & Panagia, 2015).
As for the LBGs, we take the measurements of the two stacked spectra, which were obtained from two subsamples distinguished by redshifts, from the original paper (Jones et al., 2012). The mean redshifts are 3.76 and 4.70 respectively.
2.4 Measured ancillary parameters
In this section we list important ancillary parameters, all of which are listed in Table 3. Most of them are determined in the same way as in Wang et al. (2019), so we only briefly reiterate the procedure here for completeness.
We measure the SFRs in two ways. In both cases we use the same IMF as that used in our SB99 fit. is calculated by using the WISE IR data at 12 and 22 m (Wright et al., 2010) to estimate the rest-frame 24 m luminosity, and then using the relation given in Kennicutt & Evans (2012). is calculated from extinction-corrected and fluxes, and then using the relation given in Calzetti (2011).
We also determine the half-light radii, , in two sets of images. First, the COS NUV ACQ images are used, as shown in Figure 4. Second, the WFC3 images taken with the F343N filter are used, which maps the UV stellar continuum. We note that the ’s obtained in the UV continuum images are larger for J1210 and J1618. In the former case, diffuse light outside the field of view of the COS ACQ image is seen in the WFC3 image, while in the latter, extended faint light is detected by WFC3 due to its deeper imaging.
We use the FWHM of the Balmer emission lines in the SDSS to characterize the kinematics of the ionized inter-stellar medium in each galaxy. These widths have been corrected for the SDSS spectral resolution as part of the SDSS pipeline. Lastly, the stellar masses are taken from the median of the corresponding probability density function in the MPA-JHU catalog.
| FWHM(Balmer) | SFR(IR,UV) | (NUV) | (UV cont.) | ||||||
|---|---|---|---|---|---|---|---|---|---|
| (km/s) | () | (kpc) | (kpc) | (kpc) | |||||
| J0831(S) | 224 1 | 1.21 0.04 | 6.2 | 17.9 1.1 | 9.88 | 8.43 | 1.04 | 0.98 | 1.61 |
| J0831(N) | 205 1 | 0.76 0.03 | 7.0 | 12.0 1.1 | 9.76 | 8.00 | 0.99 | 1.17 | 1.61 |
| J1157 | 135 1 | 0.26 0.03 | 1.7 | 4.6 0.3 | 9.42 | 8.25 | 0.70 | 0.89 | 1.60 |
| J1210 | 235 1 | 0.71 0.03 | 4.6 | 10.4 0.4 | 9.88 | 8.41 | 0.17 | 1.26 | 1.64 |
| J1618 | 192 1 | 0.35 0.03 | 6.8 | 17.4 0.4 | 9.28 | 8.15 | 0.63 | 1.45 | 1.60 |
| J0055 | 339 1 | 0.60 0.02 | 28.8 | 23.6 | 9.70 | 8.28 | 0.32 | - | 3.70 |
| J0150 | 240 1 | 0.74 0.03 | 20.0 | 37.4 | 10.30 | 8.40 | 1.37 | - | 3.31 |
| J0213 | 218 5 | 0.80 0.11 | 5.7 | 19.0 | 10.50 | 8.76 | 0.39 | - | 4.57 |
| J0808 | 362 3 | 0.54 0.04 | 4.3 | 8.5 | 9.80 | 8.77 | 0.08 | - | 2.20 |
| J0921 | 395 4 | 0.86 0.06 | 23.4 | 29.4 | 10.80 | 8.69 | 0.78 | - | 4.82 |
| J0926 | 241 1 | 0.21 0.03 | 17.6 | 10.4 | 9.10 | 8.05 | 0.69 | - | 3.93 |
| J0938 | 213 1 | 0.38 0.02 | 16.1 | 11.2 | 9.40 | 8.19 | 0.67 | - | 2.43 |
| J2103 | 496 3 | 0.89 0.03 | 43.1 | 41.4 | 10.90 | 8.70 | 0.46 | - | 3.13 |
| J0021 | 307 1 | 0.09 0.01 | 18.6 | 14.9 | 9.30 | 8.19 | 0.53 | - | 2.35 |
| J0823 | 197 1 | 0.57 0.02 | 9.4 | 9.6 | 8.60 | 8.23 | 0.34 | - | 1.20 |
| J1025 | 187 1 | 0.25 0.03 | 12.2 | 7.6 | 9.20 | 8.11 | 0.61 | - | 2.92 |
| J1112 | 309 1 | 0.60 0.03 | 24.8 | 28.7 | 10.20 | 8.52 | 0.33 | - | 3.03 |
| J1113 | 179 9 | 0.17 0.16 | 1.2 | 7.1 | 9.60 | 8.35 | 1.09 | - | 3.83 |
| J1144 | 171 2 | 0.51 0.04 | 7.1 | 8.9 | 9.90 | 8.40 | 0.76 | - | 2.93 |
| J1414 | - | - | 6.3 | 5.1 | 8.50 | 8.28 | 0.63 | - | 1.99 |
| J1416 | 257 1 | 0.65 0.03 | 19.9 | 23.4 | 10.00 | 8.47 | 0.19 | - | 2.86 |
| J1428 | 214 1 | 0.37 0.03 | 19.8 | 13.9 | 9.60 | 8.31 | 0.71 | - | 3.95 |
| J1429 | 300 1 | 0.13 0.03 | 36.0 | 26.8 | 9.40 | 8.12 | 0.29 | - | 3.81 |
| J1521 | 258 1 | 0.32 0.03 | 6.0 | 5.8 | 9.50 | 8.27 | 0.37 | - | 2.26 |
| J1525 | 213 1 | 0.52 0.03 | 6.3 | 9.1 | 9.40 | 8.46 | 0.51 | - | 1.86 |
| J1612 | 290 1 | 0.77 0.03 | 32.2 | 36.1 | 10.00 | 8.51 | 0.31 | - | 3.36 |
| Uncertainty | - | - | 15% | - | - | 0.14 dex | <0.1 dex | <0.1 dex | - |
Note. — The typical uncertainties are estimated following Heckman et al. (2015). The uncertainties quoted for only account for that from the magnitude measurements of WISE.
3 Results
3.1 Spectra
In Figure 5 we show distributions of EW and FWHM of the fluorescence and resonance lines, and their ratios for the union of samples. They are estimated by applying gaussian kernels on the data sets. Four features are evident. First, the emission lines are mostly centered at the systemic velocity of the galaxy, while the absorption lines are blue-shifted. Second, the fluorescence line widths more closely trace the Balmer emission-line widths. Third, the fluorescence emission lines are usually significantly weaker and narrower than the resonance absorption lines. Finally, there is much greater similarity between the widths and strengths of the 1304, 1309 resonant, fluorescent pair than for the others. This is a significant clue, since the relatively small oscillator strength for the 1304 line means that it will have correspondingly smaller optical depth () at a given velocity than the other resonance lines (e.g., by a factor of 13 than the 1260 line).
Taken together, these results suggest that in most cases the fluorescence emission lines primarily trace the star-forming ionized ISM and/or the gas with the highest column densities and lowest outflow speeds.
However, we also note that there is a range in the relative strengths of the resonance absorption and fluorescence emission lines, even for the 1260, 1265 pair (tracing gas with the greatest optical depths). To study any trends that may be manifested in our data, we use the Kendall test in assessing the statistical significance between the ratios of emission/absorption line strength and other parameters. Those correlations, and their corresponding correlation coefficients and -values, are shown on each of the scatter plot in Figure 6.
Most notable is the correlation between the ratio of fluorescence line EW to resonance line EW with the ratio of the FWHM of the two lines. A weaker correlation (but still significant) is present between the fluorescence to resonance line EW ratio and the fluorescence to Balmer line widths ratio. Both these correlations imply that we observe a range of conditions, spanning the majority of cases where the fluorescence emission lines are weak and narrow to a minority of cases in which the emission and absorption lines have similar strengths and widths.
3.2 Images
The five galaxies for which we have obtained images of the fluorescence line emission are all members the majority population of weak and narrow emission lines. In Figure 2—we see that in each case the emission is concentrated within the star-bursting regions, which are characterized by high surface-brightness UV continuum and [Oii] 3727 line emission.
To further quantify the consistency between the amount of emission present in the spectra and the amount of emission in the images, we translate the photometric data of to spectral fluxes via the following relation:
| (1) |
where is the sum of the flux density inside the aperture of the same size as the COS, and is the width of the filter. We take from the WFC3 instrument handbook. A similar calculation is done to obtain the [] emission-line fluxes.
In Table 4 we summarize all the spectral and imaging measurements. Note that the uncertainties quoted for the flux include only those from the background fluctuations. It is worth pointing out that EW is subjected to an additional systematic uncertainty induced during the process of estimating its continuum level by an interpolation between the SDSS and COS spectra.
Given that the associated resonance absorption lines will be optically thick, the repeated scattering re-absorption of resonance photons will eventually convert all the absorbed photons into fluorescence emission lines. In this case:
| (2a) | |||||
To estimate the EWs for these Feii absorption lines we assume that they have the same value of EW/ as the Siii absorption lines measured with COS. More specifically, we use combinations of Siii line strengths that lead to the same mean oscillator strength as the corresponding Feii lines:
| (2b) | |||||
| (2c) |
Strictly speaking, Equation 2 applies to photon rates rather than fluxes, but we ignore this, since the fluorescence and resonance photons have nearly the same energy.
While the uncertainties in the measured/estimated fluxes in Table 4 are substantial, we conclude that the amount of emission is consistent with COS emission. This implies that a significant fraction of the weak and narrow fluorescence emission seen in the spectra can be ascribed to the emission associated with regions of intense star-formation seen in the images (consistent with an ISM-dominated origin).
| [] | aa is the expected total flux of emission estimated from emission, as given in Equation 2. | ||||
|---|---|---|---|---|---|
| () | () | () | () | ||
| J0831(S) | 5.1 7.5 | 6.1 8.9 | 118 9 | ||
| J0831(N) | 19.0 8.3 | 10.1 4.4 | 224 16 | ||
| J1157 | 23.0 7.0 | 12.6 3.9 | 168 5 | ||
| J1210 | 31.4 7.6 | 12.9 3.1 | 157 5 | ||
| J1618 | 31.1 10.5 | 10.8 3.7 | 203 3 |
Note. — The flux densities of are measured in apertures the same size as the COS (″), and the uncertainties are the 1 variances from many measurements on the blank sky using the same apertures.
4 Discussion
So far we have presented a continuum of relative emission-line strengths and widths. In the majority of cases the emission lines are much weaker and narrower than the absorption lines. Direct imaging shows that the fluorescence emission in such cases is produced in regions with high surface-brightness in the UV continuum and [] 3737 emission lines. These results indicate that in these cases the emission is “ISM-dominated” (the outflow makes little contribution). In other cases, the presence of stronger and broader emission lines suggest that the outflow is making a significant contribution. In this section, we discuss implications for wind structure based on both these empirical properties and a simple outflow model.
4.1 A Brief Primer
The use of the fluorescence emission lines as probes of the structure of galactic outflows has been discussed at length in a number of papers (Prochaska et al., 2011; Scarlata & Panagia, 2015; Zhu et al., 2015). Here, we want to simply summarize a few salient points that will be used below to interpret our data.
Concerning the resonance absorption lines, the profiles (line depth at a given velocity) are specified by the product of the column density of the relevant ion along the line-of-sight times the oscillator strength of a given transition times the covering factor (the fraction of the background continuum source covered by the foreground gas at a given velocity). It is important to note that the observed resonance transition span a range of 13 in oscillator strength and hence optical depth (see Table 1).
Once a resonance photon has been absorbed, the excited ion will decay radiatively into either the ground state (emission due to resonance scattering) or into the excited fine-structure level (emission due to fluorescence). The ratio of the number of photons initially produced in these two ways is just given by the ratio of the respective Einstein A’s (see Table 1). The most and least effective reprocessing of absorbed resonance photons into fluorescence emission occurs for the 1190, 1193 pair (84% efficiency) and the 1260, 1265 pair (16% efficiency). This will be true in the limit where the resonance lines are optically thin (a single absorption occurs). If the resonance lines are optically think, then eventually (via multiple absorption events) all the absorbed photons are converted into fluorescence emission lines.
With that in mind, we show in Figure 7 the correlation between the oscillator strength and EW for four of the observed transitions. From this we see that the absorption lines are mainly optically-thick for the 1260, 1193, and 1190 transitions (they show the same EWs), but are starting to become optically thin for the 1304 line.
It is even more instructive to compare the absorption-line profiles for different transitions. To do so, we stack all the COS spectra of the LBAs and fit the resulting profiles gaussians. The results are shown in Figure 8 for the 1260, 1527, and 1304 lines (in order of decreasing ), with the lines becoming progressively narrower and less blue-shifted. This shows that the highest velocity material has the lowest column density. Combining this with our previous result showing that the best agreement between the strengths and widths of the resonance and fluorescence lines was for the 1304, 1309 pair (Figure 5) implies that the observed fluorescence emission lines are primarily tracing the highest column-density gas (e.g., either a static ISM or the slower parts of the outflow).
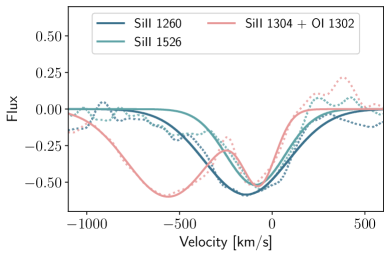
Figure 7 also shows that the ratio of the strengths of the fluorescence emission lines and the resonance absorption lines does not depend on the reprocessing efficiency. This implies that the gas responsible for the observed fluorescence emission is optically thick for the associated resonance lines (meaning that all the absorbed photons there are being reprocessed into fluorescence emission lines). The fact these emission lines are usually much weaker (and narrower) than the absorption lines returns us to the question raised in the introduction to the paper—why are these emission lines usually so weak and narrow in the majority of the starbursts?
There are several processes/circumstances that could explain this: 1) outflows are confined to small solid angles ( sr); 2) the material producing the absorption is located at radii beyond those probed by the spectra; 3) the emission-line photons from the outflow are absorbed by dust in the outflow rather than escaping. The fact that outflows are seen in 100% of the galaxies we have observed is inconsistent with the first explanation, and so we do not consider it further. To test the other possibilities, and gain more insight into the nature of the emission lines, we examine correlations between their properties and other potentially relevant parameters.
4.2 Correlations
Here we examine correlations of properties of fluorescence and resonance absorption lines with properties of the galaxy and its starburst.
To begin, we can further test our inference of a continuum of properties, ranging from spectra in which the fluorescence lines are ISM-dominated (the majority) to more wind-dominated (the minority). We have argued that the key diagnostics are the ratios of both the EWs and line-widths of the fluorescence emission lines and the resonance absorption lines. Indeed, Figure 6 shows that these two ratios are correlated for both the most and least optically thick transitions ( 1260 and 1304). We also see that as the EW ratio increases, the ratio of the widths of the fluorescence emission lines and the Balmer emission lines (tracing the static ionized ISM) increases.
Perhaps most importantly, we find little correlation between relative strengths of the fluorescence emission lines and the resonance absorption lines with the projected size of the COS aperture (e.g., the ratio of radius of the COS aperture and the radius of the starburst measured in the NUV). In fact, Figure 9 reveals that in most cases, the fluorescence lines remain weak even when the COS aperture is more than an order-of-magnitude larger than the starburst. We will explore the implications of this quantitatively in the next section.
As noted above, the weakness of the emission lines could be due in part to their absorption by dust that is located in the outflow. To test this, we show the correlations between the relative emission-line strengths and the amount of extinction (from the Balmer decrement in SDSS data). We see no correlation in the case of the 1260, 1265 pair, but a significant correlation in the case of the 1304, 1309 pair. Since the 1260 transition is much more optically thick than 1304 (requiring many more resonance scattering event to escape), and has such a low reprocessing efficiency (low likelihood of producing fluorescence emission), the lack of a correlation between the relative strengths of 1265 and 1260 features with the Balmer decrement argues against dust absorption in the outflow as the cause of the weak emission. Regarding the 1304, 1309 pair, we lean toward an explanation alluded to earlier: the 1304 absorption line only traces the high column density but low velocity gas, much of which is likely to be the static ISM. Therefore this particular correlation is likely between the strength of absorption from this material and the amount of dust along the line-of-sight (as already seen in Heckman et al. (1998)).
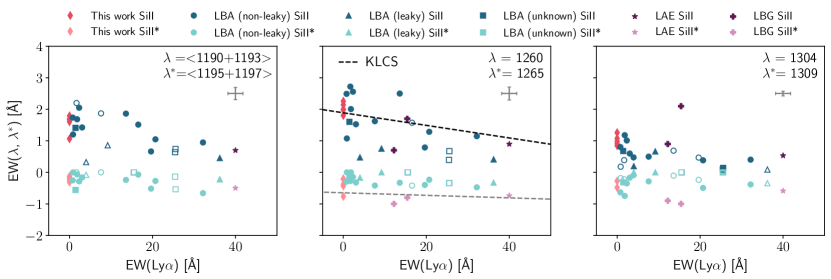
The strongest correlation is found between the fluorescence to resonance line EW ratio and the emission-line EW. This is driven mainly by the inverse correlation between the and resonant EWs (see Figure 10). This finding was also reported at high in KLCS (Steidel et al., 2018). This correlation is intriguing because both large values of EW and weak low-ionization absorption lines have been empirically linked to the galaxies with significant amounts of escaping Lyman-continuum (LyC) emission in stacked samples (e.g., Marchi et al. 2018; Steidel et al. 2018) and among individual low- LyC emitters (e.g., Verhamme et al. 2017; Chisholm et al. 2018; Wang et al. 2019). Taken together, the cases with the relatively strong fluorescence emission perhaps have clearer channels through which ionizing photons can escape the hosting galaxy (Heckman et al., 2015). However, a note of caution is due here since we see no correlations between the relative strengths and widths of the emission lines and other proposed LyC leakage-diagnostics such as a significantly blue-shifted component in emission or [Oiii]/[Oii] as discussed in Wang et al. (2019).
4.3 Implications for the structure of outflows
From the above discussion, we establish the cause for the weakness of the observed fluorescence emission being that most of the actual emission lying beyond the radii probed by the COS data (“slit-loss”). We therefore conclude by considering the implications of this result for the structure of starburst-driven outflows. We begin with the subsample of our data which has the most constraining power: the group of galaxies observed with the largest apertures as compared to their observed sizes (; see Figure 9).
To start, it is useful to remind ourselves that most of the fluorescence emission is expected to be generated within the “photosphere” of the outflow: the region where for the associated resonance line. The fact that the observed fluorescence emission lines are much weaker and narrower than the resonance absorption lines then implies that this photosphere is located at a greater distance from the starburst than what is captured in the COS aperture. This is quite plausible as the projected radii of the COS apertures are typically two to four kpc (as shown in Table 3). In what follows, we use this idea to constrain the properties of the radial profile of the outflowing material responsible for the observed absorption lines.
We note that any fluorescence emission from the portion of the outflow captured by the COS aperture must be associated with material that is optically thin in the associated resonance line (otherwise the emission-line strength should be similar to that of the absorption-line). Taking then the case where inside the region probed by COS, we can approximate the ratio between the observed flux of the fluorescence emission, , and that of the resonance absorption, , as
| (3) |
where is the fraction of the total absorbed photons that have been reprocessed into emission-line photons, and can be simply determined by the corresponding Einstein A’s:
| (4) |
We focus on the 1190/ 1195 pair, where its numerical value is about 0.84. This means that by measuring , we effectively probe in the resonance line integrated from the starburst to the projected radius of the COS aperture.
For simplicity, we assume that the radial density, , follows a power law for the ion of interest:
| (5) |
where and is the distance to the starburst. We assume this power law extends inward only as far as the starburst radius (i.e., the launch point for the outflow, which we effectively take to be ). Then the column density as a function of , , is simply given as
| (6) |
Since , we can then relate to our directly observable so that we have
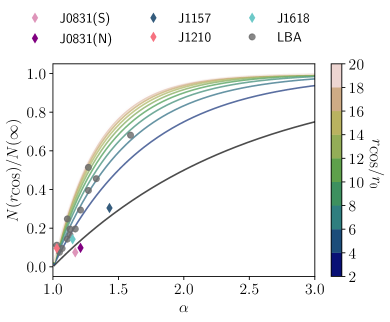
| (7) |
More generally, we show the -dependence of Equation 7 in Figure 11 for a range of . Taking Equation 7, we can plot each galaxy in our sample in this figure. From this, we see those galaxies observed with smaller effective aperture sizes (even most of the “wind-dominated” cases), require (the only exception is the LBA J1428).
These results have some important implications. Let us adopt an outflow velocity that scales with radius as a power law:
| (8) |
and adopt a mass-outflow rate that varies with radius as
| (9) |
Then from
| (10) |
we arrive at the result that
| (11) |
For the outflow to be mass-conserving (), the requirement of means the outflow must be strongly decelerating as it travels out (). This would require that the fastest moving material is closest to the starburst. This is inconsistent with the both the narrowness of the fluorescence emission lines observed within the COS aperture, and with direct observations of the nebular emission-line gas in outflows (Heckman et al., 1990; Shopbell & Bland-Hawthorn, 1998).
As an example, for the simple case of a constant wind velocity (), yields . Thus, the wind would not be mass-conserving, and most of the outflowing material would be added at radii much larger than the starburst. Such a “mass-growing” scenario is consistent with several recent studies which have found that the gas producing the absorption lines may form in situ via radiative cooling instabilities in a much hotter wind fluid (Thompson et al., 2016; Schneider et al., 2018). The latter would be too hot to produce the observed absorption lines. In particular, Gronke & Oh (2018, 2019) have shown that absorbing clouds that exceed a critical size can not only survive destruction by the wind fluid, they enable new gas to condense out of the wind. This could increase the mass-flux in absorbing gas with increasing radius through the depletion of the hot gas (e.g., the outflow as-a-whole could still be mass-conserving). Alternatively, models of wind-blown bubbles driven by starbursts (e.g., Lochhaas et al. 2018) imply an increasing mass in swept-up material with increasing radius (are not mass-conserving).
Those new models are certainly encouraging, but more studies are needed to bridge the theoretical and observational fronts—e.g., simulations of mass growth in a full galactic context, as well as more sensitive imaging observations of emission from large-scale galactic outflows.
4.4 Implications for deriving outflow rates
As emphasized in the introduction, one of the main motivations for better understanding the structure of the outflow of the absorbing material is to use this to improve estimates of the outflow rates as derived from the analysis of the absorption-line data. A simple argument showing the importance of the size/structure of the outflow is as follows:
The mass-outflow rate is given by the outflowing mass divided by the outflow time. The latter is just the outflow size divided by the outflow velocity. What can be estimated from the absorption-line data is actually the total column density (), which is essentially (half) the total mass divided by the cross-sectional area of the outflow. For a spherically-symmetric outflow this implies that
| (12) |
where is the mean mass per particle and is some kind of column-density weighted mean outflow radius. This is usually taken to be only a few times larger than the starburst radius (e.g., Heckman et al. 2000, 2015). Taken at face value, our results imply that the effective value for is much larger than the starburst radius, and therefore the mass outflow rates will be correspondingly larger. More fundamentally, the outflow is unlikely to be mass-conserving, so there is no single well-defined value for .
Finally, we wish to emphasize a further complication. Galactic outflows are known to be multiphase, with hot, warm, and cold gas spanning about five orders-of-magnitude in temperature (Heckman & Thompson, 2017). Whatever information about mass-outflow rates are derived from the resonance absorption-line data will only pertain to the warm phase ( to K).
5 Conclusions
We have reported on the analysis of HST imaging and spectroscopic data for a sample of low- starburst galaxies, focusing on exploiting the diagnostic power of the UV emission lines that are created via fluorescent reprocessing of absorbed resonance-line photons in galactic outflows. Our principal conclusions are as follows:
-
1.
We find that in the majority of cases the emission lines in the COS spectra have significantly smaller EWs than the associated resonance absorption lines, and are usually much narrower. The resonance absorption lines are strongly blue-shifted, tracing an outflow, while the emission lines are usually centered near the systemic velocity of the galaxy.
-
2.
Direct imaging of the emission in five of these galaxies shows that the emission arises in or near regions of intense star-formation (regions with high surface-brightness in the UV continuum and the [] 3727 emission line).
-
3.
By comparing the properties of the five different resonance lines, which span a range of 13 in oscillator strength (optical depth), we find that the highest column density gas has the lowest outflow velocity. The weakest absorption line ( 1304) also most strongly resembles its associated fluorescence line ( 1309) in terms of EW and FWHM.
-
4.
These results all imply that in the majority of cases, the observed fluorescence emission is associated with the static ISM and/or the slow-moving, central-most region in the outflow.
-
5.
We do however, see a range in these properties, and find a good correlation between the ratio of the EWs of the fluorescence emission and resonance absorption lines and the ratio of their line widths. We interpret this as sequence from a majority of cases in which the fluorescence lines are “ISM-dominated” to a minority of cases in which the outflow contributes significantly.
-
6.
The strongest correlation we see is between the ratio of the fluorescence and resonance EWs and the EW of the emission line. This is driven largely by an inverse correlation between the and EWs. This is very similar to what is observed in high- star-forming galaxies. Intriguingly, both strong emission and weak absorption from low-ions like have been empirically related to the escape of LyC radiation. This suggests a link between the outflow structure and LyC leakage.
-
7.
We conclude that the relative weakness of fluorescence from the outflow (as traced by the absorption lines) means that the bulk of the wind emission arises on larger scales than what is probed by the COS aperture. We use a simple model to show that the radial fall-off in the outflow density cannot be significantly steeper than , where 1 to 1.5.
-
8.
Unless the outflow is rapidly decelerating with radius (which is inconsistent with other observations of outflows), the shallow radial density profile implies that the mass-flux in the outflowing absorbing material increases with radius. This is consistent with some recent models in which either relatively cool absorbing gas condenses out of a hotter wind fluid at large radii, or in which the wind fluid sweeps up more and more ambient cool gas as it travels outward.
-
9.
These results imply that existing estimates of the outflow rates in starbursts are unlikely to be accurate, may systematically underestimate the true values, and do not capture any radial dependence in the rates.
References
- Alexandroff et al. (2015) Alexandroff, R. M., Heckman, T. M., Borthakur, S., Overzier, R., & Leitherer, C. 2015, ApJ, 810, 104, doi: 10.1088/0004-637X/810/2/104
- Armus et al. (1990) Armus, L., Heckman, T. M., & Miley, G. K. 1990, ApJ, 364, 471, doi: 10.1086/169431
- Astropy Collaboration et al. (2013) Astropy Collaboration, Robitaille, T. P., Tollerud, E. J., et al. 2013, A&A, 558, A33, doi: 10.1051/0004-6361/201322068
- Astropy Collaboration et al. (2018) Astropy Collaboration, Price-Whelan, A. M., Sipőcz, B. M., et al. 2018, AJ, 156, 123, doi: 10.3847/1538-3881/aabc4f
- Calzetti (2011) Calzetti, D. 2011, in Secul. Evol. Galaxies, ed. J. Falcon-Barroso & J. H. Knapen (Cambridge: Cambridge University Press), 419–458, doi: 10.1017/CBO9781139547420.008
- Chisholm et al. (2017) Chisholm, J., Tremonti, C. A., Leitherer, C., & Chen, Y. 2017, MNRAS, 469, 4831, doi: 10.1093/mnras/stx1164
- Chisholm et al. (2018) Chisholm, J., Gazagnes, S., Schaerer, D., et al. 2018, A&A, 616, A30, doi: 10.1051/0004-6361/201832758
- Erb et al. (2012) Erb, D. K., Quider, A. M., Henry, A. L., & Martin, C. L. 2012, ApJ, 759, 26, doi: 10.1088/0004-637X/759/1/26
- Finley et al. (2017) Finley, H., Bouché, N., Contini, T., et al. 2017, A&A, 605, A118, doi: 10.1051/0004-6361/201730428
- Finley et al. (2017) Finley, H., Bouché, N., Contini, T., et al. 2017, A&A, 608, A7, doi: 10.1051/0004-6361/201731499
- Gronke & Oh (2018) Gronke, M., & Oh, S. P. 2018, MNRAS, 480, L111, doi: 10.1093/mnrasl/sly131
- Gronke & Oh (2019) —. 2019, MNRAS, 2995, doi: 10.1093/mnras/stz3332
- Heckman et al. (2015) Heckman, T. M., Alexandroff, R. M., Borthakur, S., Overzier, R., & Leitherer, C. 2015, ApJ, 809, 147, doi: 10.1088/0004-637X/809/2/147
- Heckman et al. (1990) Heckman, T. M., Armus, L., & Miley, G. K. 1990, ApJS, 74, 833, doi: 10.1086/191522
- Heckman et al. (2000) Heckman, T. M., Lehnert, M. D., Strickland, D. K., & Armus, L. 2000, ApJS, 129, 493, doi: 10.1086/313421
- Heckman et al. (1998) Heckman, T. M., Robert, C., Leitherer, C., Garnett, D. R., & van der Rydt, F. 1998, ApJ, 503, 646, doi: 10.1086/306035
- Heckman & Thompson (2017) Heckman, T. M., & Thompson, T. A. 2017, arXiv e-prints, arXiv:1701.09062. https://arxiv.org/abs/1701.09062
- Heckman et al. (2011) Heckman, T. M., Borthakur, S., Overzier, R., et al. 2011, ApJ, 730, 5, doi: 10.1088/0004-637X/730/1/5
- Hunter (2007) Hunter, J. D. 2007, Computing in Science Engineering, 9, 90, doi: 10.1109/MCSE.2007.55
- Jones et al. (2001) Jones, E., Oliphant, T., Peterson, P., et al. 2001, SciPy: Open source scientific tools for Python. http://www.scipy.org/
- Jones et al. (2012) Jones, T., Stark, D. P., & Ellis, R. S. 2012, ApJ, 751, 51, doi: 10.1088/0004-637X/751/1/51
- Kennicutt & Evans (2012) Kennicutt, R. C., & Evans, N. J. 2012, ARA&A, 50, 531, doi: 10.1146/annurev-astro-081811-125610
- Kornei et al. (2013) Kornei, K. A., Shapley, A. E., Martin, C. L., et al. 2013, ApJ, 774, 50, doi: 10.1088/0004-637X/774/1/50
- Kroupa (2001) Kroupa, P. 2001, MNRAS, 322, 231, doi: 10.1046/j.1365-8711.2001.04022.x
- Leitherer et al. (1999) Leitherer, C., Schaerer, D., Goldader, J. D., et al. 1999, ApJS, 123, 3, doi: 10.1086/313233
- Lochhaas et al. (2018) Lochhaas, C., Thompson, T. A., Quataert, E., & Weinberg, D. H. 2018, MNRAS, 481, 1873, doi: 10.1093/mnras/sty2421
- Marchi et al. (2018) Marchi, F., Pentericci, L., Guaita, L., et al. 2018, A&A, 614, A11, doi: 10.1051/0004-6361/201732133
- McCully et al. (2018) McCully, C., Crawford, S., Kovacs, G., et al. 2018, astropy/astroscrappy: v1.0.5 Zenodo Release, v1.0.5, Zenodo, doi: 10.5281/zenodo.1482019
- Planck Collaboration et al. (2018) Planck Collaboration, Aghanim, N., Akrami, Y., et al. 2018, arXiv e-prints, arXiv:1807.06209. https://arxiv.org/abs/1807.06209
- Prochaska et al. (2011) Prochaska, J. X., Kasen, D., & Rubin, K. 2011, ApJ, 734, 24, doi: 10.1088/0004-637X/734/1/24
- Rubin et al. (2011) Rubin, K. H. R., Prochaska, J. X., Ménard, B., et al. 2011, ApJ, 728, 55, doi: 10.1088/0004-637X/728/1/55
- Scarlata & Panagia (2015) Scarlata, C., & Panagia, N. 2015, ApJ, 801, 43, doi: 10.1088/0004-637X/801/1/43
- Schneider et al. (2018) Schneider, E. E., Robertson, B. E., & Thompson, T. A. 2018, ApJ, 862, 56, doi: 10.3847/1538-4357/aacce1
- Shopbell & Bland-Hawthorn (1998) Shopbell, P. L., & Bland-Hawthorn, J. 1998, ApJ, 493, 129, doi: 10.1086/305108
- Somerville & Davé (2015) Somerville, R. S., & Davé, R. 2015, ARA&A, 53, 51, doi: 10.1146/annurev-astro-082812-140951
- Steidel et al. (2011) Steidel, C. C., Bogosavljević, M., Shapley, A. E., et al. 2011, ApJ, 736, 160, doi: 10.1088/0004-637X/736/2/160
- Steidel et al. (2018) Steidel, C. C., Bogosavljević, M., Shapley, A. E., et al. 2018, ApJ, 869, 123, doi: 10.3847/1538-4357/aaed28
- Tang et al. (2014) Tang, Y., Giavalisco, M., Guo, Y., & Kurk, J. 2014, ApJ, 793, 92, doi: 10.1088/0004-637X/793/2/92
- Thompson et al. (2016) Thompson, T. A., Quataert, E., Zhang, D., & Weinberg, D. H. 2016, MNRAS, 455, 1830, doi: 10.1093/mnras/stv2428
- van der Walt et al. (2011) van der Walt, S., Colbert, S. C., & Varoquaux, G. 2011, Computing in Science Engineering, 13, 22, doi: 10.1109/MCSE.2011.37
- van Dokkum (2001) van Dokkum, P. G. 2001, PASP, 113, 1420, doi: 10.1086/323894
- Veilleux et al. (2005) Veilleux, S., Cecil, G., & Bland-Hawthorn, J. 2005, ARA&A, 43, 769, doi: 10.1146/annurev.astro.43.072103.150610
- Verhamme et al. (2017) Verhamme, A., Orlitová, I., Schaerer, D., et al. 2017, A&A, 597, A13, doi: 10.1051/0004-6361/201629264
- Wang et al. (2019) Wang, B., Heckman, T. M., Leitherer, C., et al. 2019, ApJ, 885, 57, doi: 10.3847/1538-4357/ab418f
- Wright et al. (2010) Wright, E. L., Eisenhardt, P. R. M., Mainzer, A. K., et al. 2010, AJ, 140, 1868, doi: 10.1088/0004-6256/140/6/1868
- Zhu et al. (2015) Zhu, G. B., Comparat, J., Kneib, J.-P., et al. 2015, ApJ, 815, 48, doi: 10.1088/0004-637X/815/1/48
Measured and line profiles of the five galaxies of this paper and LBAs are listed in Table 5 and 6 respectively.
| Galaxy | Line | EW | FWHM | FW90aaFW90: FW at 90% continuum. | |
|---|---|---|---|---|---|
| (km/s) | (Å) | (km/s) | (km/s) | ||
| J0831(S) | |||||
| 1190 | -106 | 1.7 | 403 | 737 | |
| 1193 | -66 | 1.5 | 343 | 625 | |
| 1195 | 98 | -0.1 | 89 | 162 | |
| 1197bbLine falls on the detector gap. | - | - | - | - | |
| 1260 | -94 | 2.0 | 412 | 748 | |
| 1265 | 80 | -0.4 | 248 | 450 | |
| 1304 | -41 | 1.0 | 232 | 422 | |
| 1309 | 82 | -0.5 | 154 | 283 | |
| J0831(N) | |||||
| 1190 | -82 | 1.8 | 403 | 733 | |
| 1193 | -72 | 1.6 | 383 | 703 | |
| 1195 | -9 | -0.2 | 129 | 237 | |
| 1197bbLine falls on the detector gap. | - | - | - | - | |
| 1260 | -76 | 2.1 | 425 | 777 | |
| 1265 | -12 | -0.8 | 240 | 439 | |
| 1304 | -20 | 1.3 | 312 | 568 | |
| 1309ccLine is likely contaminated by the MW absorption 1402.8. | - | - | - | - | |
| J1157 | |||||
| 1190 | -75 | 1.0 | 250 | 457 | |
| 1193 | -69 | 1.1 | 278 | 508 | |
| 1195 | -23 | -0.3 | 183 | 329 | |
| 1197bbLine falls on the detector gap. | - | - | - | - | |
| 1260 | -105 | 1.8 | 352 | 642 | |
| 1265 | 57 | -0.4 | 200 | 360 | |
| 1304 | -55 | 0.8 | 185 | 338 | |
| 1309ccLine is likely contaminated by the MW absorption 1402.8. | - | - | - | - | |
| J1210 | |||||
| 1190 | -117 | 1.8 | 374 | 680 | |
| 1193 | -60 | 1.8 | 439 | 796 | |
| 1195 | 4 | -0.2 | 115 | 204 | |
| 1197bbLine falls on the detector gap. | - | - | - | - | |
| 1260 | -80 | 2.0 | 385 | 701 | |
| 1265 | 43 | -0.2 | 137 | 248 | |
| 1304 | -35 | 1.1 | 234 | 423 | |
| 1309 | -22 | -0.3 | 270 | 490 | |
| J1618 | |||||
| 1190 | -133 | 1.7 | 387 | 703 | |
| 1193 | -138 | 1.7 | 402 | 736 | |
| 1195 | 21 | -0.2 | 176 | 322 | |
| 1197bbLine falls on the detector gap. | - | - | - | - | |
| 1260 | -168 | 2.3 | 472 | 862 | |
| 1265 | 66 | -0.2 | 107 | 193 | |
| 1304 | -87 | 0.9 | 209 | 379 | |
| 1309ccLine is likely contaminated by the MW absorption 1402.8. | - | - | - | - |
Note. — All measurements can be assumed to have errors on the order of 10-15% dominated by systematics in the polynomial fit to the continuum and subtraction of the SB99 models.
| Galaxy | Line | EW | FWHM | FW90 | |
|---|---|---|---|---|---|
| (km/s) | (Å) | (km/s) | (km/s) | ||
| J0055 | |||||
| 1190 | -145 | 2.0 | 477 | 868 | |
| 1193 | -110 | 2.1 | 457 | 834 | |
| 1195 | 59 | -0.2 | 266 | 484 | |
| 1197 | -32 | -0.3 | 271 | 496 | |
| 1260 | -169 | 2.6 | 576 | 1047 | |
| 1265 | 6 | -0.1 | 164 | 298 | |
| 1304 | -59 | 1.0 | 260 | 472 | |
| 1309 | 41 | -0.4 | 180 | 331 | |
| J0150 | |||||
| 1190 | -131 | 1.4 | 368 | 670 | |
| 1193 | -98 | 1.5 | 433 | 789 | |
| 1195 | 0 | 0.0 | 0 | 0 | |
| 1197 | 55 | -0.3 | 233 | 422 | |
| 1260 | -139 | 1.5 | 371 | 670 | |
| 1265 | 151 | -0.3 | 349 | 633 | |
| 1304 | -85 | 0.6 | 255 | 466 | |
| 1309 | 96 | -0.2 | 240 | 435 | |
| J0921 | |||||
| 1190 | 42 | 0.4 | 152 | 277 | |
| 1193 | 48 | 0.3 | 142 | 261 | |
| 1195 | 142 | -0.2 | 191 | 351 | |
| 1197 | 0 | 0.0 | 0 | 0 | |
| 1260 | 73 | 0.5 | 179 | 330 | |
| 1265 | 84 | -0.2 | 279 | 509 | |
| 1304 | 67 | 0.2 | 84 | 148 | |
| 1309 | 0 | 0.0 | 0 | 0 | |
| J0926 | |||||
| 1190 | -329 | 0.5 | 402 | 733 | |
| 1193 | -282 | 0.4 | 286 | 522 | |
| 1195 | -20 | -0.2 | 161 | 292 | |
| 1197 | -18 | -0.2 | 142 | 258 | |
| 1260 | -371 | 0.4 | 301 | 547 | |
| 1265 | 4 | -0.3 | 214 | 388 | |
| 1304 | -100 | 0.1 | 124 | 224 | |
| 1309 | -11 | -0.3 | 233 | 425 | |
| J0938 | |||||
| 1190 | -52 | 1.4 | 410 | 745 | |
| 1193 | 2 | 1.4 | 434 | 788 | |
| 1195 | 70 | -0.2 | 150 | 277 | |
| 1197 | -49 | -0.9 | 566 | 1028 | |
| 1260 | -3 | 1.6 | 383 | 697 | |
| 1265 | 58 | -0.2 | 154 | 283 | |
| 1304 | -1 | 0.7 | 242 | 444 | |
| 1309 | -11 | -0.3 | 247 | 448 | |
| J2103 | |||||
| 1190 | -337 | 0.9 | 303 | 552 | |
| 1193 | -299 | 0.6 | 185 | 337 | |
| 1195 | -46 | -0.6 | 189 | 343 | |
| 1197 | -119 | -0.5 | 369 | 672 | |
| 1260 | -168 | 0.7 | 265 | 481 | |
| 1265 | 83 | -0.3 | 396 | 720 | |
| 1304 | -74 | 0.1 | 104 | 191 | |
| 1309 | 0 | 0.0 | 0 | 0 | |
| J0021 | |||||
| 1190 | -212 | 0.6 | 410 | 746 | |
| 1193 | -212 | 0.6 | 410 | 746 | |
| 1195 | 115 | -0.1 | 162 | 296 | |
| 1197 | -49 | -0.2 | 311 | 568 | |
| 1260 | -227 | 0.4 | 265 | 483 | |
| 1265 | 19 | -0.3 | 385 | 701 | |
| 1304 | -95 | 0.1 | 105 | 187 | |
| 1309 | 0 | 0.0 | 0 | 0 | |
| J0823 | |||||
| 1190 | -38 | 1.6 | 378 | 690 | |
| 1193 | 8 | 1.8 | 413 | 753 | |
| 1195 | 126 | -0.3 | 212 | 389 | |
| 1197 | 124 | -0.1 | 90 | 167 | |
| 1260 | -64 | 2.2 | 443 | 808 | |
| 1265 | 165 | -0.3 | 327 | 593 | |
| 1304 | 16 | 1.1 | 232 | 396 | |
| 1309 | - | - | - | - | |
| J1025 | |||||
| 1190 | -147 | 1.0 | 332 | 608 | |
| 1193 | -147 | 1.1 | 371 | 674 | |
| 1195 | 60 | -0.3 | 184 | 338 | |
| 1197 | -35 | -0.2 | 246 | 450 | |
| 1260 | -139 | 1.3 | 379 | 690 | |
| 1265 | 18 | -0.2 | 178 | 323 | |
| 1304 | -130 | 0.4 | 207 | 377 | |
| 1309 | 10 | -0.5 | 398 | 727 | |
| J1112 | |||||
| 1190 | -94 | 2.4 | 657 | 1194 | |
| 1193 | -175 | 1.3 | 409 | 748 | |
| 1195 | 0 | 0.0 | 0 | 0 | |
| 1197 | 0 | 0.0 | 0 | 0 | |
| 1260 | -151 | 1.6 | 381 | 696 | |
| 1265 | 43 | -0.4 | 221 | 407 | |
| 1304 | -71 | 0.5 | 216 | 393 | |
| 1309 | -43 | -0.3 | 250 | 458 | |
| J1113 | |||||
| 1190 | -236 | 1.0 | 363 | 662 | |
| 1193 | -118 | 1.4 | 482 | 876 | |
| 1195 | 0 | 0.0 | 0 | 0 | |
| 1197 | 0 | 0.0 | 0 | 0 | |
| 1260 | -84 | 1.1 | 354 | 647 | |
| 1265 | 0 | 0.0 | 0 | 0 | |
| 1304 | -39 | 0.2 | 184 | 338 | |
| 1309 | -133 | -0.2 | 150 | 274 | |
| J1144 | |||||
| 1190 | -196 | 1.8 | 439 | 798 | |
| 1193 | -181 | 1.7 | 427 | 778 | |
| 1195 | 4 | -0.3 | 186 | 340 | |
| 1197 | -61 | -0.3 | 210 | 385 | |
| 1260 | -151 | 2.5 | 570 | 1042 | |
| 1265 | 41 | -0.3 | 130 | 239 | |
| 1304 | -158 | 0.8 | 285 | 517 | |
| 1309 | -88 | -0.6 | 336 | 610 | |
| J1414 | |||||
| 1190 | -78 | 1.7 | 389 | 712 | |
| 1193 | -65 | 1.7 | 433 | 789 | |
| 1195 | 19 | -0.1 | 159 | 289 | |
| 1197 | 0 | 0.0 | 0 | 0 | |
| 1260 | -62 | 2.0 | 383 | 699 | |
| 1265 | 0 | 0.0 | 0 | 0 | |
| 1304 | -14 | 1.2 | 260 | 476 | |
| 1309 | 12 | -0.7 | 329 | 596 | |
| J1416 | |||||
| 1190 | -39 | 3.2 | 968 | 1768 | |
| 1193 | 33 | 1.2 | 426 | 778 | |
| 1195 | 0 | 0.0 | 0 | 0 | |
| 1197 | 0 | 0.0 | 0 | 0 | |
| 1260 | -49 | 2.7 | 701 | 1279 | |
| 1265 | 61 | -0.3 | 245 | 447 | |
| 1304 | -36 | 0.4 | 193 | 351 | |
| 1309 | -49 | -0.2 | 297 | 542 | |
| J1428 | |||||
| 1190 | -181 | 0.6 | 227 | 416 | |
| 1193 | -152 | 0.7 | 273 | 496 | |
| 1195 | 167 | -0.7 | 485 | 881 | |
| 1197 | -41 | -0.3 | 184 | 334 | |
| 1260 | -152 | 0.8 | 271 | 495 | |
| 1265 | 1 | -0.4 | 201 | 366 | |
| 1304 | -411 | 0.5 | 226 | 412 | |
| 1309 | -79 | -0.2 | 135 | 249 | |
| J1429 | |||||
| 1190 | -179 | 1.0 | 319 | 580 | |
| 1193 | -147 | 0.9 | 316 | 574 | |
| 1195 | 2 | -0.5 | 171 | 313 | |
| 1197 | 38 | -0.8 | 251 | 455 | |
| 1260 | -139 | 1.1 | 352 | 640 | |
| 1265 | 30 | -0.5 | 203 | 368 | |
| 1304 | -100 | 0.4 | 182 | 336 | |
| 1309 | 16 | -0.4 | 205 | 373 | |
| J1521 | |||||
| 1190 | - | - | - | - | |
| 1193 | - | - | - | - | |
| 1195 | - | - | - | - | |
| 1197 | 0 | 0.0 | 0 | 0 | |
| 1260 | - | - | - | - | |
| 1265 | - | - | - | - | |
| 1304 | -69 | 0.5 | 224 | 404 | |
| 1309 | -86 | -0.1 | 164 | 302 | |
| J1525 | |||||
| 1190 | -375 | 1.5 | 471 | 860 | |
| 1193 | -358 | 1.5 | 498 | 905 | |
| 1195 | 1 | -0.1 | 121 | 221 | |
| 1197 | 0 | 0.0 | 0 | 0 | |
| 1260 | -343 | 1.6 | 482 | 879 | |
| 1265 | 102 | -0.4 | 290 | 529 | |
| 1304 | - | - | - | - | |
| 1309 | - | - | - | - | |
| J1612 | |||||
| 1190 | -410 | 1.9 | 636 | 1160 | |
| 1193 | -354 | 1.8 | 573 | 1044 | |
| 1195 | 270 | -0.5 | 459 | 836 | |
| 1197 | 0 | 0.0 | 0 | 0 | |
| 1260 | -395 | 2.5 | 687 | 1249 | |
| 1265 | 3 | -0.3 | 263 | 480 | |
| 1304 | -369 | 0.7 | 274 | 504 | |
| 1309 | -70 | -0.1 | 134 | 246 |
Note. — “-” indicates that data is not valid due to MW absorption or detector gap. All measurements can be assumed to have errors on the order of 10-15% dominated by systematics in the polynomial fit to the continuum and subtraction of the SB99 models.