An extremely energetic supernova from a very massive star in a dense medium
The interaction of a supernova (SN) with a circumstellar medium (CSM) can dramatically increase the emitted luminosity by converting kinetic energy to thermal energy. In ‘superluminous’ supernovae (SLSNe) of Type IIn – named for narrow hydrogen lines in their spectra [1] – the integrated emission can reach erg [2, 3, 4, 5, 6], attainable by thermalising most of the kinetic energy of a conventional SN. A few transients in the centres of active galaxies have shown similar spectra and even larger energies [7, 8], but are difficult to distinguish from accretion onto the supermassive black hole. Here we present a new event, SN2016aps, offset from the centre of a low-mass galaxy, that radiated erg, necessitating a hyper-energetic supernova explosion. We find a total (SN ejecta CSM) mass likely exceeding M⊙, with energy erg, consistent with some models of pair-instability supernovae (PISNe) or pulsational PISNe – theoretically-predicted thermonuclear explosions from helium cores M⊙. Independent of the explosion mechanism, this event demonstrates the existence of extremely energetic stellar explosions, detectable at very high redshifts, and provides insight into dense CSM formation in the most massive stars.
SN2016aps (internal designation, PS16aqy) was discovered by the Pan-STARRS Survey for Transients [9] on 2016 February 22 UT with an apparent magnitude mag in the band (7545 Å). We selected this target for spectroscopic follow-up due to its large brightness contrast relative to the previously undetected host galaxy, with mag in Pan-STARRS1 survey data. Our first spectrum [10], on 2016 March 2 UT, showed hydrogen Balmer emission lines at a redshift of , and hence an absolute magnitude of mag at the time of discovery (Methods). A search of archival images from the intermediate Palomar Transient Factory [11] revealed a rising light curve going back to at least 2015 December 02 UT, with maximum brightness on 2016 January 17 UT. We obtained further spectra spanning 500 days, and optical and UV imaging spanning 1000 days. All phases are in the SN rest-frame relative to the date of maximum brightness.
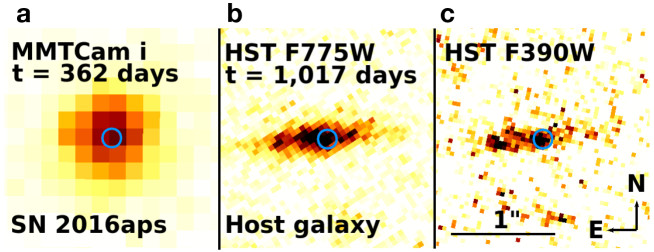
We imaged the location of SN2016aps 1,017 rest-frame days after maximum brightness using the Hubble Space Telescope, identifying the previously undetected host galaxy (Figure 1). The absolute magnitude of the galaxy, mag (intermediate between the Small and Large Magellanic Clouds), indicates a stellar mass M⊙ (assuming ) and likely a sub-solar metallicity (Methods). A compact bright region, visible in both the F775W (optical) and F390W (ultraviolet) images, is coincident with the SN position and significantly offset from the center of the galaxy by (Methods). While some energetic, hydrogen-rich transients may represent supermassive black hole accretion rather than SNe [7, 8, 12], the faint galaxy and offset from the nucleus require a SN origin for SN2016aps. The UV image shows that it occurred in the brightest star-forming region within the galaxy, pointing to a massive star progenitor.
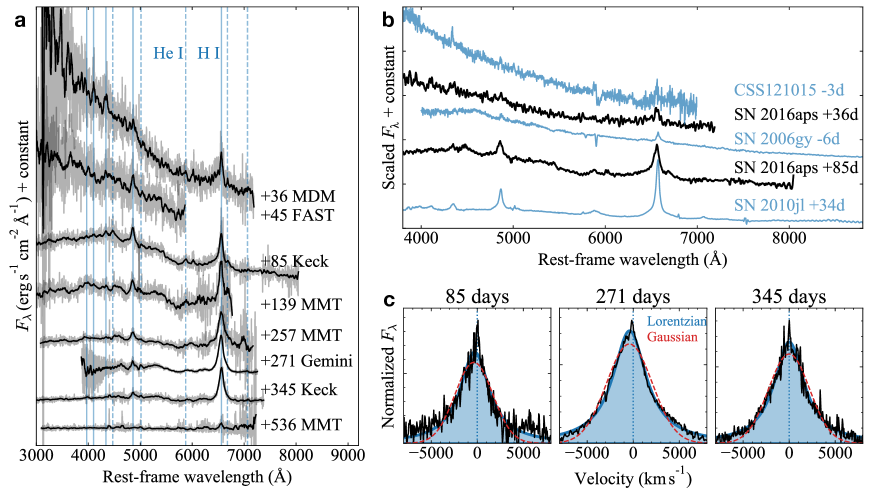
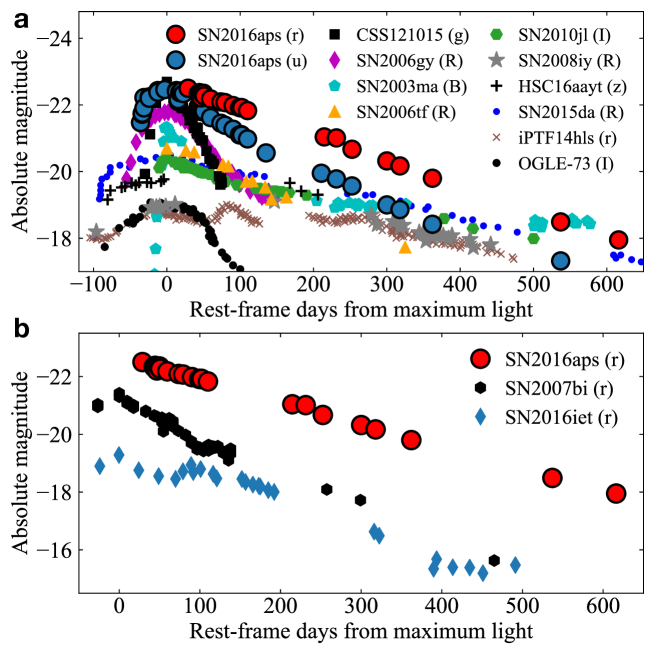
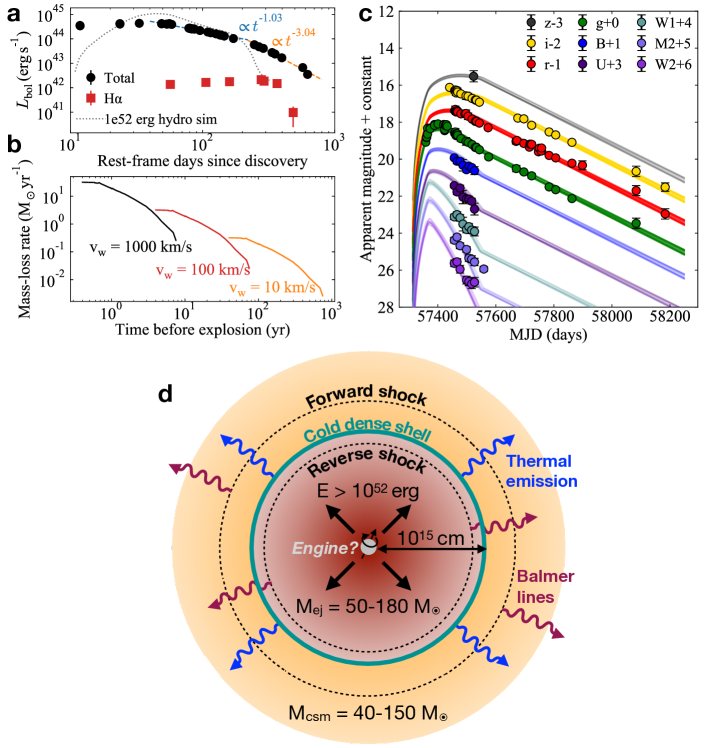
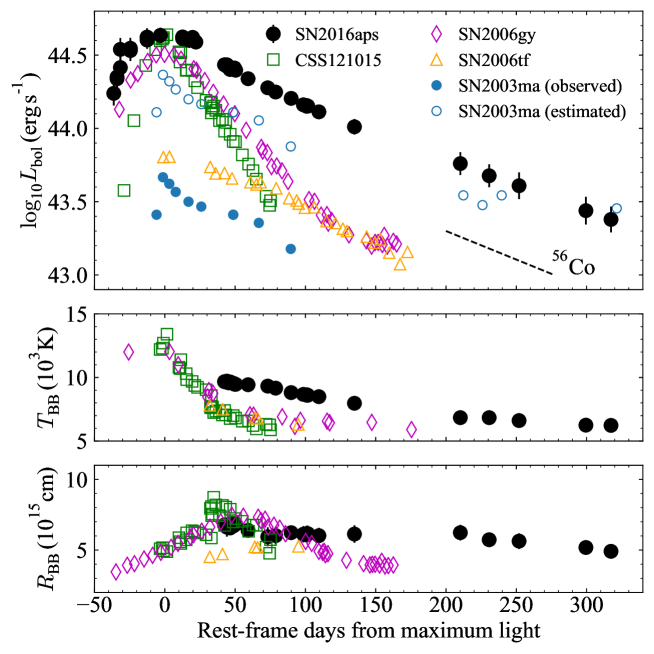
The spectra (Figure 2) are typical of SLSNe IIn [2, 6], while the peak absolute magnitude is equal to the most luminous events [6] (Figure 3). What sets SN2016aps apart from all previous events is the unprecedented combination of a large peak luminosity characteristic of the brightest ‘compact shell’ SLSNe IIn [2], and a slow rate of fading (0.8 mag per 100 days) similar to long-lived events [13, 14], thought to have more extended CSM. To measure the total optical output of SN2016aps, we integrate our photometry at each point in the light curve, and fit a blackbody function to estimate the flux outside of the observed bands (Methods). The radius is roughly constant at cm, while the temperature decreases from 10,000 K near peak to 6,000 K after 200 days (Extended Data Figure 1). The peak luminosity is erg s-1, and the integrated energy radiated over the time of our observations is erg. This is the largest radiated energy for any confirmed SN; the maximum observed energy for previous SLSNe is erg [2, 3, 4, 5, 6]. It was argued that SN2003ma may have emitted up to erg [5], but this is highly uncertain as only 20% of this energy was within the wavelength range covered by observations, compared to 70% for SN2016aps. Where a normal SN has (just) enough kinetic energy to power previous SLSNe IIn, the total emission from SN2016aps cannot be explained without a hyper-energetic explosion [15].
Assuming the light curve is powered by shock-heating of CSM, we use common relations [16] to estimate the kinetic energy and shock velocity from the luminosity and total emission (see Supplementary Information). We find an explosion energy (in units of erg and M⊙) and a shock velocity of km s-1. In this model, [16], giving an ejected mass M⊙ for our measured erg. We map the pre-explosion mass-loss, , by inverting the bolometric light curve according to [17], where is the shock velocity and is the efficiency of converting kinetic energy to radiation [18]. This gives M⊙ yr-1 for a wind with velocity km s-1 (Figure 4). We can estimate the time of mass ejection as , where the shock radius . The integrated CSM mass, lost years to centuries before explosion, is M⊙. Photoionization from external UV radiation in the local star-forming region may help to confine this mass-loss close to the progenitor [19]. However, compared to a blue supergiant star with km s-1, the inferred mass loss rate exceeds typical values by 6 orders of magnitude [20].
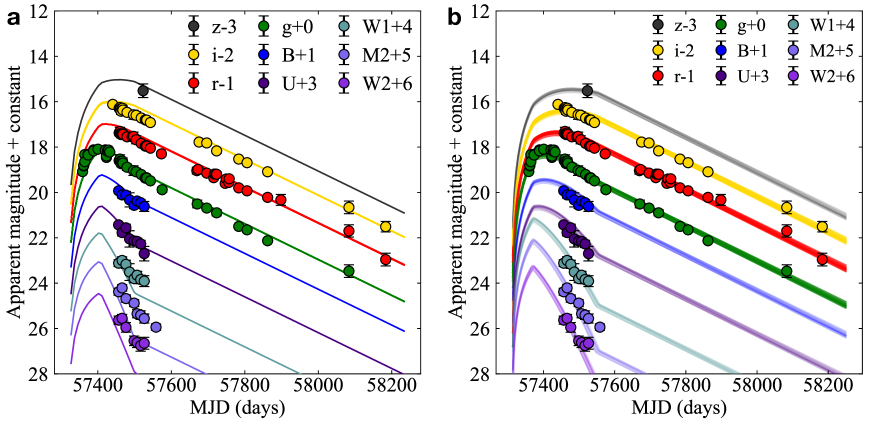
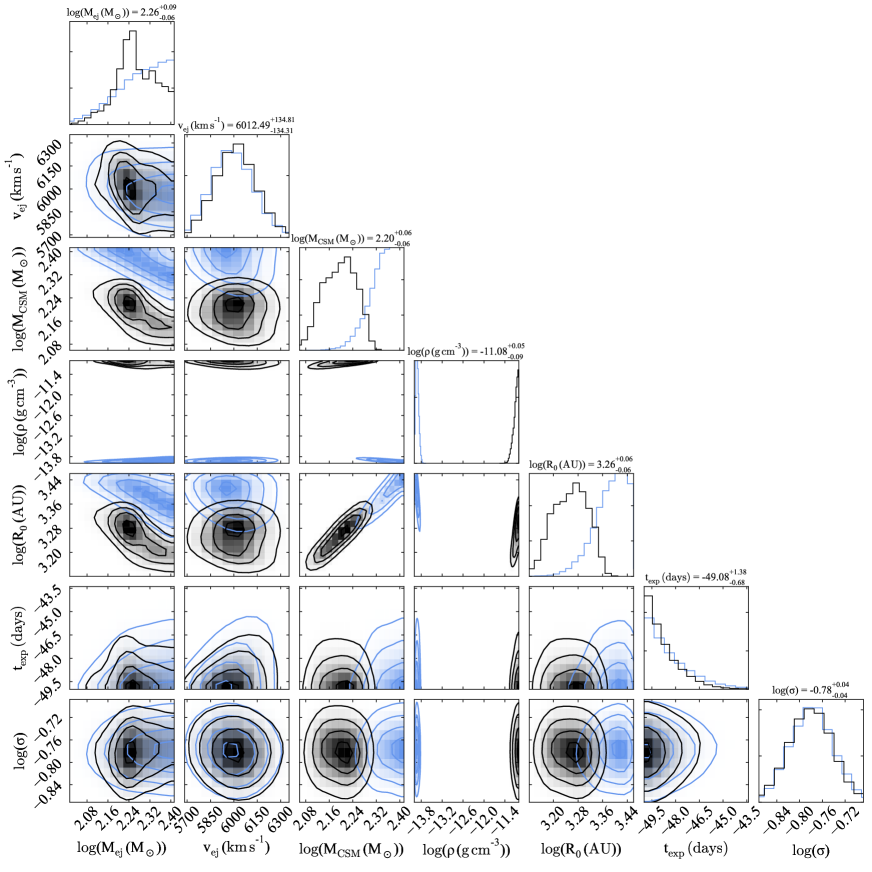
As the CSM must be ejected shortly before explosion, a constant density corresponding to a single massive outburst may be more appropriate than a wind. We use the CSM model [21, 22] in the light curve fitting package mosfit to fit the multi-band data (Supplementary Information). Although we can reasonably reproduce the light curve with the parameters estimated above, it underestimates the UV luminosity (Extended Data Figure 2). If we vary these parameters in a Markov Chain Monte Carlo fit, we find that the formal best fit (Figure 4) has M⊙, km s-1, and M⊙ (uncertainties correspond to range). These posteriors are relatively insensitive to the CSM density profile (Extended Data Figures 2, 3).
The estimated masses should be treated with caution due to various simplifications (central heat input, constant opacity, neglecting recombination) inherent in modelling a complex process with an analytic formalism. However, the requirement for M⊙ of ejecta and CSM is robust, as evidenced by the long timescale of the light curve and optically thick spectrum, and comparison to more detailed hydrodynamic models [23] (Figure 4). We now turn to progenitor and explosion scenarios that can explain the extreme radiated energy in combination with a massive and hydrogen-rich CSM.
Stars with initial masses of M⊙ experience large ‘pulsational PISN’ (PPISN) eruptions following core carbon burning [24], before an eventual iron core collapse. A recent example may have been observed in the hydrogen-poor SN2016iet [25]. Specifically, a progenitor with a helium core M⊙ (total initial mass M⊙ at SMC metallicity) begins pulsing and ejects its envelope years before core collapse. Single star models have difficulty retaining hydrogen rich material until the final years before explosion, but mergers in massive binaries can produce the same core mass while retaining a hydrogen envelope [26]. The rate of mergers in the necessary mass range is estimated to be of the core-collapse SN rate [26] (Methods).
However, the final supernova following the pulses can only meet the observed energy budget of SN2016aps if it forms a millisecond magnetar [24], which then accelerates the ejecta as it spins down. The massive pre-explosion core may require very rapid rotation to avoid collapse to a black hole, but a merger in a binary could conceivably spin up the star to facilitate this process. A millisecond magnetar could also directly contribute to (or even dominate) the radiative output through its spin-down luminosity, relaxing the requirement for a very massive ejecta, but the observed spectrum still requires massive CSM ejected shortly before explosion. Several hydrogen-poor SLSNe have shown evidence of CSM shells at larger radii [27, 28, 29], indicating that engine formation is still possible following mass ejection. The need for a magnetar lowers the predicted rate of SN2016aps-like events, likely by an order of magnitude (Methods). The implied rate of per core-collapse SN and per SLSN IIn is roughly consistent with not having detected such an event until now.
An exciting alternative is a ‘full’ PISN interacting with a dense environment (a non-interacting PISN, even from a very massive star, cannot reach the observed luminosity [15]). Blue supergiant progenitors with zero-age main sequence masses M⊙ can retain sufficiently massive helium cores ( M⊙) to encounter a terminal PISN explosion on their second pulse, following an initial failed PISN that expels only the hydrogen envelope (a more massive analogue of PPISNe) [30, 31]. The kinetic energy of erg can power an extremely bright interaction. To retain a hydrogen envelope until explosion likely requires a merger in this case too, but avoiding excessive wind losses from the very massive post-merger remnant may necessitate merging only after core helium burning. With such fine-tuning, the predicted rate in this case is of the core-collapse rate [26].
Detailed simulations will confirm whether SN2016aps is a PPISN, or even the less likely case of an interacting PISN. This event opens up new possibilities for finding very massive explosions at high redshift, being much brighter than either non-interacting PISNe or PPISNe without a central engine. The brightest radioactively-powered PISNe, from M⊙ helium cores, are faint at rest-frame UV wavelengths due to iron group absorption [30]. The Large Synoptic Survey Telescope (LSST) will be able to detect a radioactive PISN at , whereas a SN2016aps-like event could be detected out to redshift (Methods, Extended Data Figure 4). This increases the volume over which these massive stars can be detected by a factor . The PISN candidate SN2213-1745 at redshift [32] may have been an analogue of SN2016aps, but was not observed spectroscopically. The upcoming James Webb Space Telescope could spectroscopically classify a SN2016aps-like event at , offering a means to directly probe the deaths of first-generation stars.
Acknowledgements M.N. is a Royal Astronomical Society Research Fellow. The Berger Time-Domain Group acknowledge NSF grant AST-1714498 and NASA grant NNX15AE50G. R.L. acknowledges a Marie Skłodowska-Curie Individual Fellowship within the Horizon 2020 European Union Framework (H2020-MSCA-IF-2017-794467). W.F. and K.P. acknowledge support from NSF Grant Nos. AST-1814782 and AST-1909358. The Margutti group acknowledges NSF Grant No. AST‐1909796, NASA grants 80NSSC19K0384 and 80NSSC19K0646. A.A.M. is supported by the LSST Corporation, the Brinson Foundation, the Moore Foundation via the LSSTC Data Science Fellowship Program, and the CIERA Fellowship Program. A.V-G. acknowledges support by the Danish National Research Foundation (DNRF132). Data were obtained via the NASA/ESA Hubble Space Telescope archive at the Space Telescope Science Institute, the Swift archive, the Smithsonian Astrophysical Observatory OIR Data Center, the MMT Observatory, the MDM Observatory, the Gemini Observatory, operated by the Association of Universities for Research in Astronomy, Inc., under agreement with the NSF, and the W.M. Keck Observatory, operated as a partnership among the California Institute of Technology, the University of California, and NASA. Operation of the Pan-STARRS1 telescope is supported by NASA under Grants NNX12AR65G and NNX14AM74G. The authors respect the very significant cultural role of Mauna Kea within the indigenous Hawaiian community.
Author contributions M.N. wrote the manuscript, led the analysis and obtained the HST and Gemini data. P.K.B. devised the selection algorithm and identified SN2016aps as an interesting source, and analysed the HST images. E.B. advised on the manuscript and leads the overall project. R.C. and K.B. obtained the MDM spectrum and classified SN2016aps. R.M. analysed the UVOT data. P.K.B., S.G., A.B. and P.C. obtained FLWO data. R.L. obtained the Keck spectra. A.V.-G. did the rate calculations. A.A.M., F.J.M. and R.R.L. provided PTF data. W.F. and P.K.B. obtained MMT imaging. G.T., A.A.M. and K.P. obtained Keck imaging. All authors helped with the interpretation.
Data availability All data will be made publicly available upon publication, via the Open Supernova Catalog [33] and Weizmann Interactive Supernova Data Repository [34].
Code Availability MOSFiT [22] is publicly available at https://github.com/guillochon/MOSFiT. SuperBol [35] is publicly available at https://github.com/mnicholl/superbol.
Appendix A Methods
Spectroscopy We observed SN2016aps spectroscopically using the Ohio State Multi-Object Spectrograph (OSMOS) [38] on the 2.4-m Hiltner telescope at MDM observatory, the FAST spectrograph on the FLWO 1.5-m telescope [39], the Blue Channel spectrograph on MMT [40], GMOS [41] on Gemini North, and the Low Resolution Imaging Spectrograph (LRIS) [42] on the Keck I 10-m telescope. The majority of these data were reduced in Pyraf, applying bias subtraction, flat-fielding, and extraction of the 1-dimensional spectrum. Wavelength solutions were derived using arc lamps, and flux calibration achieved using observations of standard stars. Keck spectra were reduced using the dedicated lpipe package [43]. We corrected all spectra for a foreground extinction of [44] and for a cosmological redshift . We assumed a Planck cosmology in all distance calculations [45].
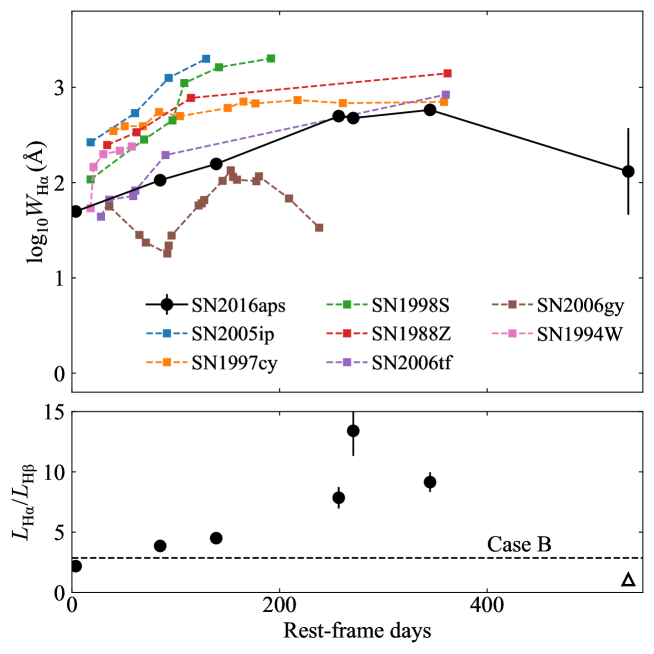
Fits to the line profiles with Gaussian and Lorentzian functions were conducted using scipy. We approximated the local continuum by fitting a linear function to the following relatively line-free regions. For H, we used 6100-6300Å and 6700-6800Å and for H we used 4600-4780Å and 4980-5000Å. The profiles are well fit with a Lorentzian function, indicating that broadening is due to electron scattering rather than expansion. Fluxes and equivalent widths were obtained by direct integration. The flux ratio between the H and H lines evolves from during the first 50 days, to after 200 days (Extended Data Figure 5). The early ratio is consistent with hydrogen recombination in ionised CSM, while the late emission can be excited [37] by the passage of shock fronts through the CSM and ejecta. SN2006gy initially exhibited a similar evolution, with an early ratio of , but at times days the ratio increased to more extreme values . However, a direct comparison of these values with SN2016aps may be misleading, as SN2006gy showed significant absorption components (both narrow and broad) in both emission lines.
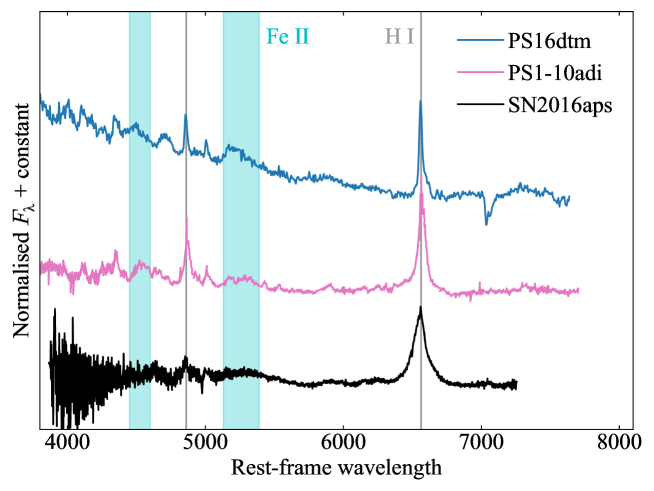
The spectra shown in Figure 2 have been smoothed using a Savitsky-Golay filter [46]. They are initially dominated by a blue continuum superposed with hydrogen Balmer emission lines, typical [2, 6] of these events. As the spectra evolve, SN2016aps most closely resembles [13, 14] long-duration SLSNe IIn such as SN2010jl and SN2006tf. SLSNe IIn also share some spectroscopic similarities with energetic nuclear transients [7, 8], however we argue in the Supplementary Information that these are physically distinct classes. We show a spectroscopic comparison in Extended Data Figure 6, highlighting significant differences in the Balmer profiles and iron lines.
Photometry
Optical photometric observations of SN2016aps in bands were obtained using KeplerCam on the 1.2-m telescope at Fred Lawrence Whipple Observatory (FLWO), MMTCam on the 6.5-m MMT telescope , the Gemini Multi-Object Spectrograph (GMOS) on the 8-m Gemini North telescope, and DEIMOS on the 10-m Keck II telescope. Images were reduced using pyraf to apply bias subtraction and flat-fielding. Dark correction was also performed for the MMTCam images. Photometry was measured with a custom wrapper for daophot, using nearby stars from PanSTARRS Data Release [47] 1 to determine the point-spread function (PSF) and photometric zeropoint of each image. At later epochs, FLWO images from neighbouring nights were co-added to improve the signal-to-noise ratio.
We subtracted the underlying host galaxy flux from each measurement using the galaxy magnitudes measured in late-time imaging. In the band, where no host imaging is available, we assumed mag by interpolating across the and bands. We assume a 20% uncertainty on the host flux in all cases. The change in magnitude following host subtraction becomes significant ( mag) only after days of the light curve fading, and therefore has no effect on our estimate of the total luminosity from SN2016aps.
Publicly available Pan-STARRS data in and bands, obtained as part of the Pan-STARRS Survey for Transients [9], were downloaded from the Pan-STARRS Transient Science Server hosted at Queen’s University Belfast. These magnitudes are measured by the Pan-STARRS Data Processing System [48] after subtraction of a reference image, and hence are free of host galaxy light.
Additional optical photometry was obtained with the CFH12K camera [49] on the Palomar Observatory 48-inch telescope [50] (P48). Images were processed by the IPAC image-subtraction pipeline, which subtracts background galaxy light using deep pre-SN images and performs forced point-spread function (PSF) photometry at the location of the SN [51]. The photometry is then calibrated to the PTF photometric catalog [52]. We estimate the time of maximum light as MJD 57404 (2016 January 17 UT) using a 4th-order polynomial fit to the PTF -band data.
We also carried out imaging using the Neil Gehrels Swift Observatory with the UV-Optical Telescope (UVOT) in the UVW2, UVM2, UVW1, , , and filters. We extracted the SN flux in each image using a 3” aperture and following the recommended procedures [53], and calibrated to Vega magnitudes in the UVOT photometric system [54]. As UV imaging covers only the first days, we assume the host contribution to be negligible in these observations.
When analysing the light curves we accounted for a Galactic extinction [44], but assumed internal extinction within the host galaxy was negligible. The galaxy appears to be a dwarf galaxy similar to the hosts of SLSNe I, which generally have low extinction (consistent with zero in many cases) [55]. At early times, the Balmer decrement (H/H) in the spectra of SN2016aps is consistent with the expected value for Case B recombination, which lends support to a low internal extinction. Finally, we do not see a strong Na I absorption line (thought to be correlated with dust extinction) [56] from the host galaxy. Including a significant host extinction would serve to increase the total luminosity of SN2016aps even further, so would only strengthen the results presented here.
To obtain the absolute and -band light curves in Figure 3, we used the s3 package [57] to derive cross -corrections from our spectra. We linearly interpolated these corrections to epochs with photometry. At this redshift, observed -band was closest to rest-frame , and observed to rest-frame . The comparison data [5, 6, 14, 13, 58, 59, 37, 60, 61, 62, 63, 64] in the figure were obtained from the Open Supernova Catalog [33] if possible, or otherwise directly from these papers.
The bolometric light curve was calculated using superbol [35], including extinction corrections, interpolation to a common set of epochs, transformation to the rest-frame and blackbody fits. The bolometric light curve, (on log-linear scale), the derived temperature and radius evolution, and comparisons to other events, are shown in Extended Data Figure 1. We assume constant colours prior to discovery, as we only have PTF -band data at early times. If the photospheric temperature was higher during the rising phase, as is often the case in SNe, the total luminosity would be even greater. We also note that we do not have near-infrared data to look for dust formation, common in interacting SNe at late times [65, 66]. Any late-time infrared excess, as seen [65, 14, 62] in the spectroscopically similar and slowly-evolving SLSNe IIn SN2010jl and SN2015da, would also increase the total further. Thus the integrated observed erg is a conservative lower limit on the total energy.
To power the peak luminosity with radioactive decay would require M⊙ of 56Ni. This decays to 56Co on a half-life of 6 days then to 56Fe on a half-life of 77 days; thus at peak the energy would be primarily from 56Co decays. Although we favour circumstellar interaction as the power source in SN2016aps, we note that a radioactively powered light curve still requires a huge progenitor mass consistent with a PISN: to produce 20 M⊙ of 56Ni needs a core mass [30] M⊙.
X-rays
We imaged SN2016aps with the X-ray Telescope (XRT) on-board Swift. Stacking all the data for a total exposure time of 37 ks obtained between MJD 57456.7- 57558.4, we detect no X-rays to a limiting count-rate of ct s-1. We use the online WebPIMMS tool to convert this to flux, assuming a thermal Brehmsstrahlung spectrum with keV, similar to SN2014C [67] (one of the best-observed interacting SNe at X-ray wavelengths), and a Galactic hydrogen column density of cm-2 in the direction of SN2016aps. The unabsorbed flux is erg s-1 cm-2, corresponding to a luminosity erg s-1 (0.3-10 keV). Taking our peak bolometric luminosity from the UV-optical data, this implies . SN2010jl had , argued to be low due to attenuation of X-rays from the shock by the optically thick CSM [14]. Our measurement therefore implies that SN2016aps exhibits at least as much X-ray attenuation as SN2010jl.
HST imaging and host galaxy properties
We obtained late-time data using the Hubble Space Telescope (HST) on 2019-07-27 UT, corresponding to 1017 days after maximum light in the SN rest-frame (Program ID: 15709, PI: Nicholl). Drizzled data were downloaded from the Mikulski Archive for Space Telescopes. We used the F775W filter on the Advanced Camera for Surveys (ACS) and the F390W filter on Wide Field Camera 3 (WFC3). We matched the F390W image, and an earlier image from MMTCam, to the F775W image using 12 common sources. The uncertainty in the astrometric tie is 0.0282” between the ground- and space-based images, and 0.0061” between the two HST images. We determine the SN position to be 10h19m02.124s, +74∘42’24”.82 in the system of the F775W image, using sextractor, with an uncertainty of 0.0084”.
The host galaxy, previously undetected in ground-based surveys, is easily identified in the HST images. We measure integrated host galaxy AB magnitudes of mag and mag, where we have checked using PanSTARRS DR1 sources that any deviations of the HST imaging zeropoints are smaller than the photometric errors.
An unresolved source at the same position in Keck images obtained on 2019-02-26 has an -band measurement consistent with the ACS magnitude, we therefore assume that this measurement is host-dominated. An -band image on the same night gives mag.
We used galfit [68] to measure the physical size of the galaxy, finding an effective radius of kpc with an axis ratio in the F775W image. We also find that SN2016aps is offset from the center, as measured in red/optical light, by 3.1 HST pixels, or 0.15”. This is greater than the uncertainty in the astrometric tie between the SN and host images. Thus SN2016aps is inconsistent at the level with having occurred in the nucleus of its host galaxy.
The F775W filter is very close to rest-frame band at this redshift. For an inferred absolute magnitude mag, we estimate the galaxy stellar mass as , where , giving M⊙. Using the mass-metallicity relation from [69], this implies a metallicity . A more accurate determination of the host galaxy properties will require deep spectroscopy and imaging over a broad wavelength range after we are more confident that SN2016aps has completely faded.
The UV luminosity and spatial extent of the host indicate a mean star-formation rate surface density of M⊙ yr-1 [70], consistent with the lower end of the distribution measured for Type I (hydrogen-poor) SLSNe [71]. Those explosions are known to favour the brightest UV (most star-forming) regions of their hosts, suggesting young, massive progenitors [71]. The association of SN2016aps with the UV-brightest region of its host thus points to a massive star progenitor.
Rate estimates for interacting (P)PISNe
For each of our suggested progenitor channels, we estimate the rates of forming core masses in the necessary range via binary mergers using a pre-established method [26]. The rate is given by:
| (1) |
where is the fraction of massive stars in close binaries [72]. The next factor is the fraction of primary stars sufficiently massive to form the desired core mass post-merger (modelled using Modules for Experiments in Stellar Astrophysics [73, 74]), normalised to the core-collapse SN rate assuming a Salpeter initial mass function and that stars with masses in the range M⊙ experience CCSNe. The factor is the fraction of secondary stars, given a suitable primary, that are sufficiently massive for this channel [26], and is the fraction of suitable binaries with the appropriate separation to merge during a given evolutionary phase. The largest uncertainty is on , which can be lower by an order of magnitude for more pessimistic assumptions requiring near-equal-mass binaries [26].
For the PPISN channel, we look for existing models [24] that begin pulsing between years before core collapse. This corresponds to a range in helium core mass of M⊙. In this case we find (from the MESA models) . We assume the merger can happen at any point after core hydrogen burning; for a log-flat distribution of separations and a maximum stellar radius of , this gives . Thus the overall rate of formation of suitable progenitors is per CCSN. The rate of SN2016aps-like transients will include another factor accounting for those progenitors with sufficiently rapid core rotation to form magnetars. We estimate , i.e. the fastest 10% of rapidly rotating massive stars can produce magnetars [75, 76, 77], giving an overall rate per CCSN.
For the more massive PISN channel, the core mass range of interest [30] is M⊙, which gives . However, in this case it is less clear whether the massive merger product can retain its hydrogen envelope unless the merger happens late (after core helium burning), giving a much narrower range of allowed separations (). In this case, the estimated rate is per CCSN. Thus the PPISN channel appears the more likely, even with its requirement for a central engine.
Detectability with LSST and JWST
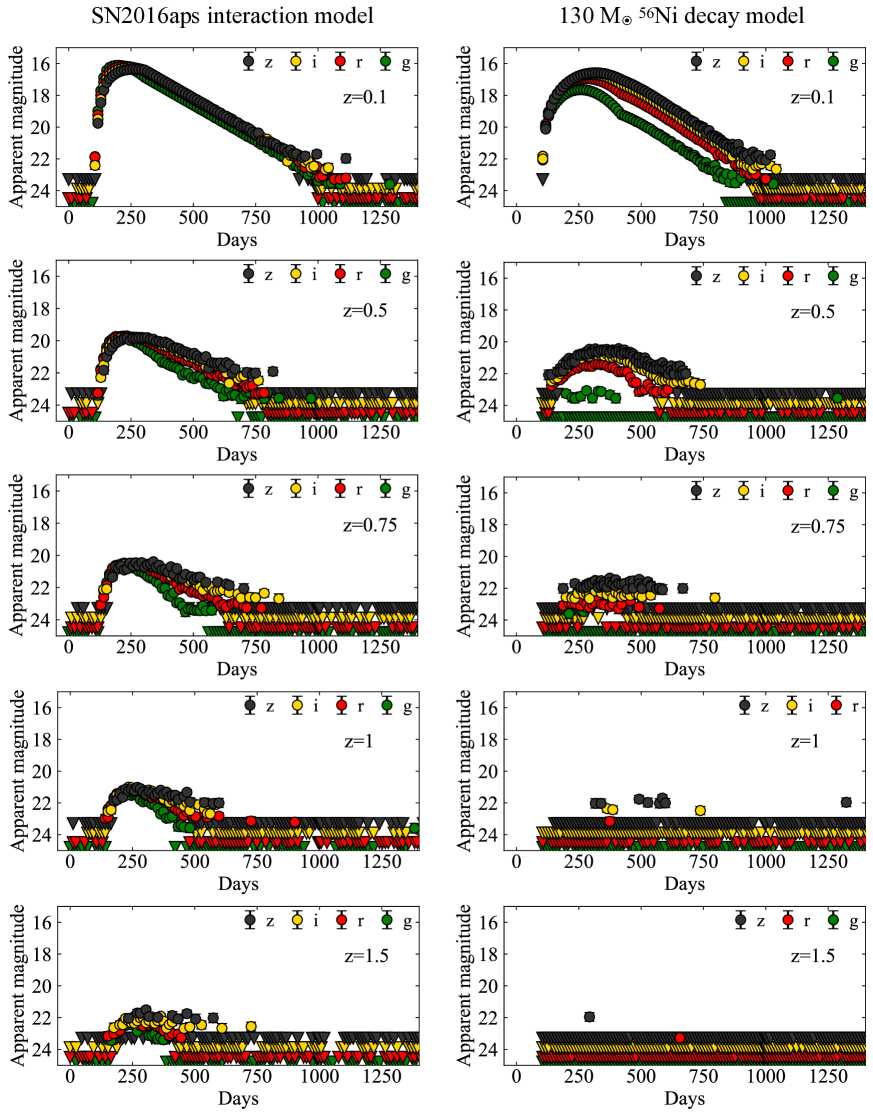
We use our light curve model (see also Supplementary Information) to estimate the observability of a transient like SN2016aps for next-generation instruments. mosfit provides a simple built-in routine to estimate the signal-to-noise for a transient observation given a specified filter and limiting magnitude. We generate synthetic light curves in the and bands taking the limiting magnitudes appropriate for the Large Synoptic Survey Telescope (LSST) [78]: mag, mag, mag and mag. Observations in the and bands are shallower so we do not consider them here. We place the best-fitting CSM shell model at redshifts for these simulations.
We perform the same calculation for a massive radioactively-powered PISN model, based on a 130 M⊙ helium core. Our mosfit implementation uses an ejecta mass of 130 M⊙, a radioactive nickel mass of 39 M⊙, and an ejecta velocity of 8000 km s-1. Absorption by heavy elements is implemented via a linear cut-off [77] in the blackbody spectral energy distribution below 5000 Å, to mimic the red spectra from more detailed simulations [30, 79, 80].
The results are shown in Extended Data Figure 4. While both models are detectable at low-redshift for 2-3 years in the LSST survey, the situation is very different at higher redshift. Radioactive PISNe are only detected at as above this the bulk of their emission is redshifted out of the optical bands. However a SN2016aps-like massive interacting event can be detected as far as , as they do not suffer from the same rest-frame UV absorption (the power source is not coupled to heavy element production). Thus strong CSM can increase the volume over which PISNe are detectable by up to a factor , increasing our chances of finding PISNe with LSST. However, the distribution of CSM and ejecta properties is currently unknown, and the volumetric rate of PISNe is highly uncertain (but constrained [32, 81] to be Gpc-3 yr-1), making a quantitative estimate of the number of interacting PISNe unfeasible at this time.
We note that characteristics of a SN2016aps-like event at are consistent with the transient SN2213-1745, discovered [32] in stacked Canada-France-Hawaii Telescope Legacy Survey data and confirmed to be in a galaxy at . This event is one of the best candidates for a PISN due to its luminosity and slow light curve evolution, but it was found [32] that the observed flux was brighter and bluer than massive 56Ni decay-powered PISN models [30]. Interaction with a massive CSM can explain this blue flux excess, while the required mass is likely still consistent with a PISN. The peak apparent magnitude confirms that events like SN2213-1745 and SN2016aps will be detectable at with LSST.
We also calculate the observability of a SN2016aps-like transient with the James Webb Space Telescope (JWST). At , SN2016aps would have reached mag in the NIRCam F410M filter (40,900 Å in the observer frame, corresponding to Å in the rest frame). This matches the limiting magnitude for spectroscopy with NIRSpec to achieve a S/N ratio of 10 with the G495M disperser (covering Å). Thus we could comfortably detect the strong H emission and spectroscopically classify a SN2016aps-like event with high confidence as far as .
Appendix B Supplementary Information
Ruling out a tidal disruption event
One issue that arises in understanding the origin of the most luminous transients is the difficulty in distinguishing SLSNe from extremely bright tidal disruption events (TDEs), i.e. transients powered by the destruction of a star passing within the tidal radius of a supermassive black hole. ASASSN-15lh was previously thought to be the most luminous known SN [12], but subsequent studies argued that its properties were more consistent with a TDE interpretation [82, 83].
In the case of SN2016aps, we can clearly rule out a TDE explanation. Most TDEs show a constant or even increasing temperature over time, whereas SN2016aps shows a decreasing temperature typical of SN cooling (Extended Data Figure 1). The spectrum is also typical of SLSNe IIn, in particular Lorentzian line profiles (Figure 2) and the evolution of the H equivalent width with time (Extended Data Figure 5). SN2016aps is inconsistent at the level with having occurred in the centre of its host, whereas a TDE would have occurred in the nucleus.
Comparison to SLSNe IIn
Figures 2 and 3 show spectroscopic and photometric comparisons with a number of SLSNe IIn. Although SN2016aps is more than twice as energetic as any of the other events, there are a number of similar properties among the class. Considering only events that emit erg (SN2006gy, SN2003ma, SN2008am, SN2008fz, SN2015da, CSS121015) or fade on a similar timescale to SN2016aps (SN2006tf, SN2010jl), all events show similar maximum light spectra, with blue continua and dominated by roughly symmetric, scattering-broadened (i.e. Lorentzian) Balmer lines. This similarity persists for most events [5, 4, 84, 13, 62] throughout their evolution, as the continuum cools and the equivalent widths of the lines increase. SN2006gy and CSS121015 are exceptions. From around 90 days after explosion, SN2006gy displays a rather asymmetric H line, with a serious of narrow P Cygni absorption lines from slow, unshocked CSM [37], whereas CSS121015 instead shows broad metal lines resembling [6] SLSNe I. These events may require a more complex CSM structure. However, the key point is that SN2016aps is not unusual spectroscopically for a SLSN IIn.
The host galaxy environments provide another point of overlap between many of these events. CSS121015, SN2008fz, SN2010jl and SN2006tf all occurred in dwarf galaxies, with absolute magnitudes to mag, comparable to SN2016aps. The host metallicities estimated from emission line diagnostics are for SN2010jl [85] and SN2008am [4]. In contrast, SN2006gy, SN2003ma, and SN2015da occurred in more massive galaxies with mag. SN2006gy exploded close to the center of a galaxy hosting an active galactic nucleus, whereas the others were significantly offset from the centers of their hosts [5, 62]. There was no evidence of AGN variability in the host of SN2003ma in 7 years of pre-SN observations [5]. This will be important in the next section, when we compare to a population of transients that seem to occur exclusively in active galactic nuclei.
To summarise: of the eight SLSNe IIn that come closest to SN2016aps in photometric properties, all show similar maximum light spectra, with six showing similar spectra throughout the photospheric phases (nebular spectra are not available). Five events occurred in metal-poor or dwarf galaxy environments. Four events satisfied both of these similarity criteria. The spectroscopic consistency is not surprising, as interaction with an opaque, hydrogen-rich circumstellar shell can lead to similar spectra across a wide range of explosion parameters [23]. Pulsational PISN mass ejections have been suggested as a plausible means to build up a massive CSM in other events [37]. The key difference with SN2016aps is that the total energy and long timescale demand an extremely high final explosion energy beyond what is possible with conventional core-collapse. Thus while these events certainly form an observational class, and possibly a physical class if the CSM is produced by the same mechanism, SN2016aps requires an extra ingredient: either a significantly larger mass or an extremely energetic explosion.
Simulations of very energetic core collapse SNe leading to SLSNe exist [86, 87], however the explosion energy is often a free parameter in these models. One physically-motivated way to get a large explosion energy is through rotation – either in the form of a magnetar central engine accelerating the ejecta on the spin-down timescale [88], or the launching of jets in a collapsar-like model [89]. In the latter case at least, the explosion may be highly asymmetric [90]. Unfortunately, the presence of dense CSM in events such as SN2016aps obscures the geometry of the underlying ejecta.
Comparison to hydrogen-rich transients in active galactic nuclei
Recently a population of extremely energetic hydrogen-rich transients have been discovered in the centres of active galaxies [84, 7, 8]. In particular, PS1-10adi radiated [8] erg. They have been interpreted by some authors [8, 84] as most likely resulting from SNe interacting with dense material in the centres of these galaxies, though they do not rule out TDEs as an alternative explanation. In this section we argue that the latter interpretation is more likely, and that despite superficial spectral similarity, the off-nuclear SN2016aps is distinct from these events.
Extended Data Figure 6 shows the spectrum [8] of PS1-10adi at around 200 days after maximum, compared to our Gemini spectrum of SN2016aps at a similar phase. Although the strongest features in both spectra are the Balmer lines, these lines show a red shoulder in PS1-10adi but are symmetric (and slightly blueshifted) in SN2016aps, more typical [14] of SLSNe IIn with electron scattering in an expanding atmosphere. The line profiles, and the presence of narrow Fe II emission, are much more similar to PS16dtm [7]. This is another transient in an AGN, but in this case there is strong evidence that the source is associated with the supermassive black hole, rather than being a SN.
In particular, historical observations from XMM-Newton showed that the AGN is an X-ray source, but observations with Swift during the optical flare showed that X-rays had faded by at least an order of magnitude. A SN is unable to obscure the AGN accretion disk, but formation of an atmosphere or disruption of the existing disk by a TDE naturally explains the X-ray fading. Interestingly, PS1-10adi showed X-rays that appeared 5 years after the optical flare, which could be due to the formation of a disk following the TDE, or an existing disk that is revealed after the debris settles down (the inverse of the process that explains PS16dtm).
Another discriminant between SN2016aps and this population of nuclear transients is the lack of a mid-IR echo. All of these event studied to date [8], including PS16dtm [7], have shown very bright mir-IR emission, detected by the Wide-field Infrared Survery Explorer (WISE), following the optical flare [91]. This has been interpreted [91] as a TDE signature, as the mid-IR luminosity in these events is challenging to produce with a SN, but consistent with a dusty AGN torus. At the distance of SN2016aps, a mid-IR echo of a similar brightness to that seen [91] in PS1-10adi would have been easily detectable, but no variability is seen in WISE data spanning days around the optical peak.
The AGN torus model can also explain [91] two further features of PS1-10adi. The Fe II emission can occur from sublimation of the same dust responsible for the mid-IR echo (note that narrow Fe II can also arise from dense gas close to an accretion disk [92]). Furthermore, the observed optical re-brightening days after the light curve peak (not typically seen in SNe) can arise when an outflow driven by the TDE eventually collides with the torus.
As well as the locations within their host galaxies differing, the properties of the galaxies themselves differ between SN2016aps and the nuclear events. The absolute magnitude of the SN2016aps host is mag, whereas the hosts of the other events are brighter by mag, i.e. a factor (note that these are also significantly brigher than most of the SLSN IIn hosts discussed in the previous section). The peak luminosity of PS1-10adi is consistent with the estimated Eddington luminosity of the associated AGN [8], and the other nuclear events are either less luminous or in brighter galaxies, i.e. all are likely radiating below the Eddington luminosity for the AGN in these galaxies. In comparison, the luminosity of SN2016aps would be approximately Eddington if it was associated with a supermassive black hole in such a faint galaxy, assuming typical scaling of the black hole mass with the galaxy mass [93]. Thus while all the nuclear events can be naturally accommodated within the context of black hole accretion, from TDEs or otherwise, SN2016aps is much more likely a SN.
The interacting SN model proposed for the nuclear transients can account for the dense CSM, either as a result of runaway mergers, an existing narrow-line region, and/or ionisation confinement in the AGN radiation field [8]. However, dense CSM is not the only requirement; a large explosion energy is also needed to power the light curve. We are not aware of any reason why such explosions would occur preferentially near AGN. Most observed (SLSNe, long gamma-ray bursts) and theoretical (PISNe) SNe with large explosion energies favour low metallicity environments [55, 94, 95], quite unlike the centres of massive galaxies. Moreover, the integrated radiation from PS1-10adi is somewhat uncomfortable for SN models, exceeding by a factor the maximum predicted emission for hydrogen rich SNe [15]. We therefore conclude that extremely energetic nuclear transients are quite unlikely to be SNe, leaving SN2016aps as the most secure case of a SN radiating erg.
Light curve models
Models from the literature. We estimate the mass and energetics of SN2016aps using analytic relations [16] for the interaction of SN ejecta with a dense wind. The total radiative energy released is given by
| (2) |
where is the opacity in units of cm2 g-1, the kinetic energy in units of erg, is the ejected mass in units of M⊙, and is the density parameter for pre-explosion mass-loss with rate in M⊙ yr-1 and velocity in km s-1. is obtained by integrating the bolometric light curve. The luminosity is given by
| (3) |
We divide these two equations to eliminate and , and assume cm2 g-1 as appropriate for electron scattering in hydrogen-rich material. This gives the useful relation . i.e., a flatter light curve (longer time-scale) indicates a higher density. We find . This gives M⊙ yr-1 for km s-1, fully consistent with our result in the main text and Figure 4 that used a different relation for the wind density [17]. Putting these values back into either equation allows one to find .
We then find the interaction radius by putting these values into the relation
| (4) |
valid as long as the outer CSM radius is much greater than . This gives cm, which is reassuringly consistent with the blackbody radius of the continuum emission (Extended Data Figure 1). This implies that most of the continuum emission comes from close to the contact discontinuity.
Finally, the shock velocity is found using
| (5) |
where is in units of km s-1. Putting in our earlier results gives km s-1. Interestingly, this means that the transition to a steeper light curve at days (Figure 4) corresponds to the doubling timescale of the shocked region.
We also compare to published SLSN IIn models from more realistic simulations [23] in Figure 4. The data are reasonably consistent with models calculated for a CSM mass of 17.3 M⊙ and explosion energy between erg ( times larger than a canonical SN). The ejecta mass in the model is 9.8 M⊙; the sensitivity to this parameter was not explored in that study. However, we note that the steeper and earlier drop in the model luminosity compared to SN2016aps may be an indication that a larger mass is needed to match this event.
Bayesian light curve fit. We fit a circumstellar interaction model to the observed UV and optical photometry using mosfit: the Modular Open Source Fitter for Transients [22]. This is a semi-analytic code employing a range of modules that can be linked together to produce model light curves of astronomical transients, and determine the best fitting model parameters through Bayesian analysis. The interaction model and its implementation in mosfit are described in a number of previous works [21, 96, 97].
We first demonstrate that the model gives a reasonable match to the light curve using the parameters derived in the previous section. We take the lower limit on ejected mass and assume M⊙, and the integrated shocked CSM mass [17], M⊙. We further assume that the observed photospheric radius corresponds to the contact discontinuity (i.e. the inner CSM radius), and the mass above this radius is set by our derived (with a corresponding wind profile for the CSM). We use and for the ejecta outer and inner density profiles, though are results are largely insensitive to these parameters. We set km s-1, larger than our derived shock velocity, but required to give a total energy erg and match the peak luminosity. The result, shown in Extended Data Figure 2, gives a good match to the observations.
Next we free these parameters to find the best fit and Bayesian posteriors for our parameters. To sample the parameter space we used the affine-invariant ensemble method [98, 99]. We ran the Markov Chain with 100 walkers for 25,000 iterations, checking for convergence by ensuring that the Potential Scale Reduction Factor was at the end of the run [100]. Our model has 7 free parameters: the masses of the star and CSM; the ejecta velocity; the inner radius of the CSM; the density at this inner radius; the time of explosion; and a white-noise term parameterising any unaccounted-for variance. We use the same priors as for SN2016iet [25], with a few modifications. We fix the opacity at cm2 g-1, appropriate for electron scattering in hydrogen-rich matter, and the final continuum temperature at 6000 K based on our photometry (Extended Data Figure 1). If left free, the temperature posteriors always converged to this value anyway, so we fixed it to speed up our model runs. We run one model for a shell-like (constant density) CSM, and one for a wind-like () CSM, but otherwise use the same priors for both models.
To further reduce the number of free parameters, we assume 100% efficiency in radiating the deposited energy. This efficiency follows that used in similar model fits [96]; a lower efficiency would require a correspondingly larger explosion energy. The large efficiency is warranted as this model assumes an extremely optically thick interaction and therefore applies only in the limit of large masses. We note that for the analytic wind model [17], which does not require a large CSM mass, we used a lower efficiency of 50%, also guided by previous work [18]. Assuming 100% efficiency in that model would reduce the mass-loss curves in Figure 4 by a factor of 2, resulting in a total mass M⊙.
We obtain a similarly good fit for either a wind or shell CSM. The Watanabe-Akaike Information Criterion (WAIC) [101, 102] is essentially indistinguishable between them, with WAIC for the shell and 147.6 for the wind model. We show the shell model in Figure 4 and the wind model in Extended Data Figure 2. The posterior probability densities of the free parameters is shown for both models in Extended Data Figure 3. In the wind model, some of the posteriors lie close to the upper bounds of the priors.
Uncertainties in PISN rate estimates
Both our PISN and PPISN rate estimates contain significant uncertainty, particularly in the parameter (Methods). Furthermore, the MESA models underpinning these calculations were computed at SMC metallicity. Retaining sufficient mass to reach the pair-unstable threshold depends on mass-loss rates that are highly sensitive to metallicty. Single star MESA models over a wider range in metallicity [95] suggest that PISNe should not occur at all at solar metallicity. The host galaxy of SN2016aps likely has a metallicity intermediate between the LMC and SMC. At the higher metallicity of the LMC, PPISNe can occur for stars with initial masses M⊙, while full PISNe require M⊙. On the other hand, rapid rotation can lead to chemically homogeneous evolution and a larger core mass for a given initial mass, thus lowering these thresholds [31]. This also facilitates engine formation. Given these rather large uncertainties, all rate estimates should be considered indicative only.
However it is instructive to compare them to the observed rates of strongly interacting SNe. While literature estimates to date have been based on small numbers, the best current measurement [103] of the SLSN II rate is Gpc-3 yr-1, corresponding to per CCSN. This is in broad agreement with the post-merger PPISN rate. The discovery of SN2016aps suggests that up to of SLSNe IIn may exceed the energy budget of a typical SN; the estimated rates are consistent with such events being those that form magnetars.
References
- [1] Schlegel, E. M. A new subclass of Type II supernovae? Mon. Not. R. Astron. Soc. 244, 269–271 (1990).
- [2] Smith, N. et al. SN 2006gy: discovery of the most luminous supernova ever recorded, powered by the death of an extremely massive star like Carinae. Astrophys. J. 666, 1116 (2007).
- [3] Drake, A. et al. Discovery of the extremely energetic supernova 2008fz. Astrophys. J. 718, L127 (2010).
- [4] Chatzopoulos, E. et al. SN 2008am: a super-luminous Type IIn supernova. Astrophys. J. 729, 143 (2011).
- [5] Rest, A. et al. Pushing the Boundaries of Conventional Core-collapse Supernovae: The Extremely Energetic Supernova SN 2003ma. Astrophys. J. 729, 88 (2011).
- [6] Benetti, S. et al. The supernova CSS121015:004244+132827: a clue for understanding superluminous supernovae. Mon. Not. R. Astron. Soc. 441, 289–303 (2014).
- [7] Blanchard, P. K. et al. PS16dtm: A Tidal Disruption Event in a Narrow-line Seyfert 1 Galaxy. Astrophys. J. 843, 106 (2017).
- [8] Kankare, E. et al. A population of highly energetic transient events in the centres of active galaxies. Nat. Astron. 1, 865–871 (2017).
- [9] Huber, M. et al. The Pan-STARRS Survey for Transients (PSST)-first announcement and public release. Astron. Tel. 7153, 1 (2015).
- [10] Chornock, R. et al. Spectroscopic classification of two superluminous supernovae. Astron. Tel. 8790 (2016).
- [11] Law, N. M. et al. The Palomar Transient Factory: System Overview, Performance, and First Results. Publ. Astron. Soc. Pac. 121, 1395 (2009).
- [12] Dong, S. et al. ASASSN-15lh: A highly super-luminous supernova. Science 351, 257–260 (2016).
- [13] Smith, N. et al. SN 2006tf: precursor eruptions and the optically thick regime of extremely luminous Type IIn supernovae. Astrophys. J. 686, 467 (2008).
- [14] Fransson, C. et al. High-density Circumstellar Interaction in the Luminous Type IIn SN 2010jl: The First 1100 Days. Astrophys. J. 797, 118 (2014).
- [15] Sukhbold, T. & Woosley, S. E. The Most Luminous Supernovae. Astrophys. J. 820, L38 (2016).
- [16] Chevalier, R. A. & Irwin, C. M. Shock breakout in dense mass loss: luminous supernovae. Astrophys. J. 729, L6 (2011).
- [17] Chugai, N. N. & Danziger, I. J. SN 1988Z: low-mass ejecta colliding with the clumpy wind? Mon. Not. R. Astron. Soc. 268, 173–180 (1994).
- [18] Chevalier, R. A. & Irwin, C. M. X-Rays from Supernova Shocks in Dense Mass Loss. Astrophys. J. 747, L17 (2012).
- [19] Mackey, J. et al. Interacting supernovae from photoionization-confined shells around red supergiant stars. Nature 512, 282–285 (2014).
- [20] Vink, J. S. Fast and slow winds from supergiants and luminous blue variables. Astron. Astrophys. 619, A54 (2018).
- [21] Chatzopoulos, E., Wheeler, J. C. & Vinko, J. Generalized Semi-analytical Models of Supernova Light Curves. Astrophys. J. 746, 121 (2012).
- [22] Guillochon, J. et al. MOSFiT: Modular Open Source Fitter for Transients. Astrophys. J. Suppl. 236, 6 (2018).
- [23] Dessart, L., Audit, E. & Hillier, D. J. Numerical simulations of superluminous supernovae of type IIn. Mon. Not. R. Astron. Soc. 449, 4304–4325 (2015).
- [24] Woosley, S. E. Pulsational Pair-instability Supernovae. Astrophys. J. 836, 244 (2017).
- [25] Gomez, S. et al. SN 2016iet: The Pulsational or Pair Instability Explosion of a Low-metallicity Massive CO Core Embedded in a Dense Hydrogen-poor Circumstellar Medium. Astrophys. J. 881, 87 (2019).
- [26] Vigna-Gómez, A., Justham, S., Mandel, I., de Mink, S. E. & Podsiadlowski, P. Massive Stellar Mergers as Precursors of Hydrogen-rich Pulsational Pair Instability Supernovae. Astrophys. J. 876, L29 (2019).
- [27] Yan, L. et al. Hydrogen-poor Superluminous Supernovae with Late-time H Emission: Three Events From the Intermediate Palomar Transient Factory. Astrophys. J. 848, 6 (2017).
- [28] Lunnan, R. et al. A UV resonance line echo from a shell around a hydrogen-poor superluminous supernova. Nat. Astron. 2, 887–895 (2018).
- [29] Chen, T. W. et al. SN 2017ens: The Metamorphosis of a Luminous Broadlined Type Ic Supernova into an SN IIn. Astrophys. J. 867, L31 (2018).
- [30] Kasen, D., Woosley, S. E. & Heger, A. Pair Instability Supernovae: Light Curves, Spectra, and Shock Breakout. Astrophys. J. 734, 102 (2011).
- [31] Chatzopoulos, E. & Wheeler, J. C. Hydrogen-poor Circumstellar Shells from Pulsational Pair-instability Supernovae with Rapidly Rotating Progenitors. Astrophys. J. 760, 154 (2012).
- [32] Cooke, J. et al. Superluminous supernovae at redshifts of 2.05 and 3.90. Nature 491, 228–231 (2012).
- [33] Guillochon, J., Parrent, J., Kelley, L. Z. & Margutti, R. An Open Catalog for Supernova Data. Astrophys. J. 835, 64 (2017).
- [34] Yaron, O. & Gal-Yam, A. WISeREP—An Interactive Supernova Data Repository. Publ. Astron. Soc. Pac. 124, 668 (2012).
- [35] Nicholl, M. SuperBol: A User-friendly Python Routine for Bolometric Light Curves. Res. Notes Am. Astron. Soc. 2, 230 (2018).
- [36] Gal-Yam, A. et al. Supernova 2007bi as a pair-instability explosion. Nature 462, 624–627 (2009).
- [37] Smith, N., Chornock, R., Silverman, J. M., Filippenko, A. V. & Foley, R. J. Spectral Evolution of the Extraordinary Type IIn Supernova 2006gy. Astrophys. J. 709, 856–883 (2010).
- [38] Martini, P. et al. The Ohio State Multi-Object Spectrograph. Publ. Astron. Soc. Pac. 123, 187 (2011).
- [39] Fabricant, D., Cheimets, P., Caldwell, N. & Geary, J. The FAST Spectrograph for the Tillinghast Telescope. Publ. Astron. Soc. Pac. 110, 79–85 (1998).
- [40] Schmidt, G. D., Weymann, R. J. & Foltz, C. B. A Moderate-Resolution, High-Throughput CCD Channel for the MMT Spectrograph. Publ. Astron. Soc. Pac. 101, 713 (1989).
- [41] Hook, I. M. et al. The Gemini-North Multi-Object Spectrograph: Performance in Imaging, Long-Slit, and Multi-Object Spectroscopic Modes. Publ. Astron. Soc. Pac. 116, 425–440 (2004).
- [42] Oke, J. B. et al. The Keck Low-Resolution Imaging Spectrometer. Publ. Astron. Soc. Pac. 107, 375 (1995).
- [43] Perley, D. A. Fully Automated Reduction of Longslit Spectroscopy with the Low Resolution Imaging Spectrometer at the Keck Observatory. Publ. Astron. Soc. Pac. 131, 084503 (2019).
- [44] Schlafly, E. F. & Finkbeiner, D. P. Measuring Reddening with Sloan Digital Sky Survey Stellar Spectra and Recalibrating SFD. Astrophys. J. 737, 103 (2011).
- [45] Planck Collaboration et al. Planck 2015 results. XIII. Cosmological parameters. Astron. Astrophys. 594, A13 (2016).
- [46] Savitzky, A. & Golay, M. J. E. Smoothing and differentiation of data by simplified least squares procedures. Anal. Chem. 36, 1627–1639 (1964).
- [47] Flewelling, H. A. et al. The Pan-STARRS1 Database and Data Products. Preprint at https://arxiv.org/abs/1612.05243 (2016).
- [48] Magnier, E. A. et al. The Pan-STARRS Data Processing System. Preprint at https://arxiv.org/abs/1612:05240 (2016).
- [49] Rahmer, G. et al. The 12Kx8K CCD mosaic camera for the Palomar Transient Factory Vol. 7014, (Society of Photo–Optical Instrumentation Engineers (SPIE) Conference Series, 4, 2008).
- [50] Law, N. M. et al. The Palomar Transient Factory: System Overview, Performance, and First Results. Publ. Astron. Soc. Pac. 121, 1395–1408 (2009).
- [51] Masci, F. J. et al. The IPAC Image Subtraction and Discovery Pipeline for the Intermediate Palomar Transient Factory. Publ. Astron. Soc. Pac. 129, 014002 (2017).
- [52] Ofek, E. O. et al. The Palomar Transient Factory Photometric Calibration. Publ. Astron. Soc. Pac. 124, 62–73 (2012).
- [53] Brown, P. J. et al. Ultraviolet Light Curves of Supernovae with the Swift Ultraviolet/Optical Telescope. Astron. J. 137, 4517–4525 (2009).
- [54] Breeveld, A. A. et al. An Updated Ultraviolet Calibration for the Swift/UVOT. AIP Conf. Ser. 1358, 373–376 (2011).
- [55] Lunnan, R. et al. Hydrogen-poor Superluminous Supernovae and Long-duration Gamma-Ray Bursts Have Similar Host Galaxies. Astrophys. J. 787, 138 (2014).
- [56] Poznanski, D., Prochaska, J. X. & Bloom, J. S. An empirical relation between sodium absorption and dust extinction. Mon. Not. R. Astron. Soc. 426, 1465–1474 (2012).
- [57] Inserra, C. et al. On the nature of hydrogen-rich superluminous supernovae. Mon. Not. R. Astron. Soc. 475, 1046–1072 (2018).
- [58] Ofek, E. et al. SN 2006gy: An extremely luminous supernova in the galaxy NGC 1260. Astrophys. J. 659, L13 (2007).
- [59] Agnoletto, I. et al. SN 2006gy: Was it really extraordinary? Astrophys. J. 691, 1348 (2009).
- [60] Miller, A. A. et al. SN 2008iy: an unusual Type IIn Supernova with an enduring 400-d rise time. Mon. Not. R. Astron. Soc. 404, 305–317 (2010).
- [61] Moriya, T. J. et al. HSC16aayt: A Slowly Evolving Interacting Transient Rising for More than 100 Days. Astrophys. J. 882, 70 (2019).
- [62] Tartaglia, L. et al. The long-lived Type IIn SN 2015da: Infrared echoes and strong interaction within an extended massive shell. Accepted in Astron. Astrophys. Preprint at https://arxiv.org/abs/1908.08580 (2019).
- [63] Arcavi, I. et al. Energetic eruptions leading to a peculiar hydrogen-rich explosion of a massive star. Nature 551, 210–213 (2017).
- [64] Terreran, G. et al. Hydrogen-rich supernovae beyond the neutrino-driven core-collapse paradigm. Nat. Astron. 1, 713–720 (2017).
- [65] Gall, C. et al. Rapid formation of large dust grains in the luminous supernova 2010jl. Nature 511, 326–329 (2014).
- [66] Bhirombhakdi, K. et al. The Type II superluminous SN 2008es at late times: near-infrared excess and circumstellar interaction. Mon. Not. R. Astron. Soc. 488, 3783–3793 (2019).
- [67] Margutti, R. et al. Ejection of the Massive Hydrogen-rich Envelope Timed with the Collapse of the Stripped SN 2014C. Astrophys. J. 835, 140 (2017).
- [68] Peng, C. Y., Ho, L. C., Impey, C. D. & Rix, H.-W. Detailed Structural Decomposition of Galaxy Images. Astron. J. 124, 266–293 (2002).
- [69] Andrews, B. H. & Martini, P. The Mass-Metallicity Relation with the Direct Method on Stacked Spectra of SDSS Galaxies. Astrophys. J. 765, 140 (2013).
- [70] Kennicutt, J., Robert C. Star Formation in Galaxies Along the Hubble Sequence. Annu. Rev. Astron. Astrophys. 36, 189–232 (1998).
- [71] Lunnan, R. et al. Zooming In on the Progenitors of Superluminous Supernovae With the HST. Astrophys. J. 804, 90 (2015).
- [72] Sana, H. et al. Binary Interaction Dominates the Evolution of Massive Stars. Science 337, 444 (2012).
- [73] Paxton, B. et al. Modules for Experiments in Stellar Astrophysics (MESA). Astrophys. J. Suppl. 192, 3 (2011).
- [74] Paxton, B. et al. Modules for Experiments in Stellar Astrophysics (MESA): Convective Boundaries, Element Diffusion, and Massive Star Explosions. Astrophys. J. Suppl. 234, 34 (2018).
- [75] Yoon, S. C., Langer, N. & Norman, C. Single star progenitors of long gamma-ray bursts. I. Model grids and redshift dependent GRB rate. Astron. Astrophys. 460, 199–208 (2006).
- [76] de Mink, S. E., Langer, N., Izzard, R. G., Sana, H. & de Koter, A. The Rotation Rates of Massive Stars: The Role of Binary Interaction through Tides, Mass Transfer, and Mergers. Astrophys. J. 764, 166 (2013).
- [77] Nicholl, M., Guillochon, J. & Berger, E. The Magnetar Model for Type I Superluminous Supernovae. I. Bayesian Analysis of the Full Multicolor Light-curve Sample with MOSFiT. Astrophys. J. 850, 55 (2017).
- [78] LSST Science Collaboration et al. LSST Science Book, Version 2.0. Preprint at https://arxiv.org/abs/0912.0201 (2009).
- [79] Dessart, L., Hillier, D. J., Waldman, R., Livne, E. & Blondin, S. Superluminous supernovae: 56Ni power versus magnetar radiation. Mon. Not. R. Astron. Soc. 426, L76–L80 (2012).
- [80] Jerkstrand, A., Smartt, S. J. & Heger, A. Nebular spectra of pair-instability supernovae. Mon. Not. R. Astron. Soc. 455, 3207–3229 (2016).
- [81] Nicholl, M. et al. Slowly fading super-luminous supernovae that are not pair-instability explosions. Nature 502, 346–349 (2013).
- [82] Leloudas, G. et al. The superluminous transient ASASSN-15lh as a tidal disruption event from a Kerr black hole. Nat. Astron. 1, 0002 (2016).
- [83] Margutti, R. et al. X-Rays from the Location of the Double-humped Transient ASASSN-15lh. Astrophys. J. 836, 25 (2017).
- [84] Drake, A. J. et al. The Discovery and Nature of the Optical Transient CSS100217:102913+404220. Astrophys. J. 735, 106 (2011).
- [85] Stoll, R. et al. SN 2010jl in UGC 5189: Yet Another Luminous Type IIn Supernova in a Metal-poor Galaxy. Astrophys. J. 730, 34 (2011).
- [86] Umeda, H. & Nomoto, K. How Much 56Ni Can Be Produced in Core-Collapse Supernovae? Evolution and Explosions of 30-100 M⊙ Stars. Astrophys. J. 673, 1014–1022 (2008).
- [87] Moriya, T., Tominaga, N., Tanaka, M., Maeda, K. & Nomoto, K. A Core-collapse Supernova Model for the Extremely Luminous Type Ic Supernova 2007bi: An Alternative to the Pair-instability Supernova Model. Astrophys. J. 717, L83–L86 (2010).
- [88] Kasen, D. & Bildsten, L. Supernova light curves powered by young magnetars. Astrophys. J. 717, 245 (2010).
- [89] Wheeler, J. C., Yi, I., Höflich, P. & Wang, L. Asymmetric Supernovae, Pulsars, Magnetars, and Gamma-Ray Bursts. Astrophys. J. 537, 810–823 (2000).
- [90] Couch, S. M., Wheeler, J. C. & Milosavljević, M. Aspherical Core-Collapse Supernovae in Red Supergiants Powered by Nonrelativistic Jets. Astrophys. J. 696, 953–970 (2009).
- [91] Jiang, N. et al. Infrared Echo and Late-stage Rebrightening of Nuclear Transient Ps1-10adi: Exploring the Torus with Tidal Disruption Events in Active Galactic Nuclei. Astrophys. J. 871, 15 (2019).
- [92] Wevers, T. et al. Evidence for rapid disc formation and reprocessing in the X-ray bright tidal disruption event candidate AT 2018fyk. Mon. Not. R. Astron. Soc. 488, 4816–4830 (2019).
- [93] Kormendy, J. & Ho, L. C. Coevolution (Or Not) of Supermassive Black Holes and Host Galaxies. Annu. Rev. Astron. Astrophys. 51, 511–653 (2013).
- [94] Schulze, S. et al. Cosmic evolution and metal aversion in superluminous supernova host galaxies. Mon. Not. R. Astron. Soc. 473, 1258–1285 (2018).
- [95] Yusof, N. et al. Evolution and fate of very massive stars. Mon. Not. R. Astron. Soc. 433, 1114–1132 (2013).
- [96] Chatzopoulos, E., Wheeler, J. C., Vinko, J., Horvath, Z. & Nagy, A. Analytical Light Curve Models of Superluminous Supernovae: 2-minimization of Parameter Fits. Astrophys. J. 773, 76 (2013).
- [97] Villar, V. A., Berger, E., Metzger, B. D. & Guillochon, J. Theoretical Models of Optical Transients. I. A Broad Exploration of the Duration-Luminosity Phase Space. Astrophys. J. 849, 70 (2017).
- [98] Goodman, J. & Weare, J. Ensemble samplers with affine invariance. Commun. Appl. Math. Comput. Sci. 5, 65–80 (2010).
- [99] Foreman-Mackey, D., Hogg, D. W., Lang, D. & Goodman, J. emcee: The MCMC hammer. Publ. Astron. Soc. Pac. 125, 306 (2013).
- [100] Brooks, S. P. & Gelman, A. General methods for monitoring convergence of iterative simulations. J. Comput. Graph. Stat. 7, 434–455 (1998).
- [101] Watanabe, S. Asymptotic equivalence of Bayes cross validation and widely applicable information criterion in singular learning theory. J. Mach. Learn. Res. 11, 3571–3594 (2010).
- [102] Gelman, A., Hwang, J. & Vehtari, A. Understanding predictive information criteria for Bayesian models. Stat. Comput. 24, 997–1016 (2014).
- [103] Quimby, R. M., Yuan, F., Akerlof, C. & Wheeler, J. C. Rates of superluminous supernovae at z0.2. Mon. Not. R. Astron. Soc. 431, 912–922 (2013).
- [104] Dexter, J. & Kasen, D. Supernova Light Curves Powered by Fallback Accretion. Astrophys. J. 772, 30 (2013).