GAPP: A Fast Profiler for Detecting Serialization Bottlenecks in Parallel Linux Applications
Abstract.
We present a parallel profiling tool, GAPP, that identifies serialization bottlenecks in parallel Linux applications arising from load imbalance or contention for shared resources . It works by tracing kernel context switch events using kernel probes managed by the extended Berkeley Packet Filter (eBPF) framework. The overhead is thus extremely low (an average 4% runtime overhead for the applications explored), the tool requires no program instrumentation and works for a variety of serialization bottlenecks. We evaluate GAPP using the Parsec3.0 benchmark suite and two large open-source projects: MySQL and Nektar++ (a spectral/hp element framework). We show that GAPP is able to reveal a wide range of bottleneck-related performance issues, for example arising from synchronization primitives, busy-wait loops, memory operations, thread imbalance and resource contention.
1. Introduction
A key challenge for multi-core program developers is identifying and fixing performance problems and this is exacerbated in multi-core systems because of competition for shared resources. Such resources may be physical, e.g. a hardware accelerator which can only be accessed by one thread of computation at a time, or logical, e.g. a lock protecting access to parts of, or the entirety of, a shared data structure. The speed-up achievable in such cases is thus limited by the inherent serialization that occurs, as governed by Amdahl’s law.
The resource(s) that experience the greatest contention are called the bottleneck resources, or just bottlenecks, akin to the terminology used in queuing theory. Such resources have a queue of service requests associated with them and the immediate symptom of a bottleneck is excessive queuing at one or more of those resources. The key insight from queuing theory is that performance can only be improved significantly by “fixing the bottleneck”, i.e. by reducing the load placed on the resource, e.g. by accessing it less often or holding it for less time, on average. Moreover, when there are multiple bottlenecks in a system, we can rank them based on a metric that takes into account how long the bottleneck is active and the length of the queue.
This paper presents a new bottleneck detection tool, called GAPP (Generic Automatic Parallel Profiler), which automatically pinpoints the line(s) of code that represent bottlenecks in a parallel Linux application. In contrast to some other bottleneck detection systems which work by instrumenting specific languages, libraries or synchronization primitives (Yoga and Nagarakatte, 2017; Yu and Pradel, 2016; ul Alam et al., 2017; Tallent et al., 2010; David et al., 2014), GAPP uses lightweight instrumentation at the kernel level. Furthermore, all bottleneck analysis in GAPP is performed at run time, which avoids the need to generate, and subsequently process, potentially expensive trace files. Indeed, a key objective in GAPP’s design has been to minimize overhead, both during program execution and in post processing.
The idea is to use the extended Berkeley Packet Filter (eBPF) framework (Corbet, 2014) (eBPF has been a standard feature of Linux since v4.1) to trace context-switching events inside the Linux kernel and keep track of the number of active threads at all times during a program’s execution. We then identify the bottleneck thread(s) by taking account of both the duration of the thread’s time-slices and the degree of parallelism exhibited whilst each is executing. We use a weighting algorithm similar to that described in (Joao et al., 2012; Du Bois et al., 2013a) and later also in (Kambadur et al., 2014) in order to do this. The information captured at context switching events is augmented by information from a lightweight sampling-based profiler that identifies the program counter location(s) that correspond to the bottleneck in the code. This is also implemented using eBPF. If the program under test is compiled to allow stack tracing, we are then able to use the information gathered to pinpoint the line(s) of source code that constitute the bottleneck and which should therefore be the target for optimization.
We make the following contributions:
-
•
We present GAPP, a tool to identify arbitrary serialization bottlenecks in parallel Linux applications based on a weighted criticality metric (CMetric) (Section 2). The tool has very low overhead, requires no instrumentation and works for a variety of bottlenecks, where there is reduced parallelism.
-
•
We show how eBPF can be used to build a lightweight sample-based profiler that, when used in conjunction with the bottleneck detector, is able to point the programmer at the line(s) of source code where the bottleneck is located (Section 4.3).
-
•
We evaluate the effectiveness of GAPP using MySQL and Nektar++ (Cantwell et al., 2015) and benchmarks from the Parsec 3.0 suite (Section 5). We confirm known bottlenecks in Parsec 3.0 and also expose and discuss new, previously unreported bottlenecks.
Performance experiments show that GAPP introduces an average overhead of circa 4% (maximum circa 13%) for the applications considered.
2. Thread Criticality
Existing parallel profilers identify bottlenecks by ranking code regions in terms of their share of parallelism (Kambadur et al., 2014), optimization opportunity (Curtsinger and Berger, 2015) and asymptotic parallelism, i.e the ratio of total work to critical work (Yoga and Nagarakatte, 2017). GAPP identifies bottlenecks by ranking thread execution slices in terms of their execution time, weighted by the number of active threads. We use the term Criticality Metric (CMetric) for this weighted metric, borrowing the terminology from (Du Bois et al., 2013a). The advantage of this metric is that it distinguishes threads that execute for short periods with low parallelism from those that execute for longer periods with a similar low degree of parallelism.
2.1. Calculating the CMetric
The CMetric is calculated at the end of each execution timeslice. Timeslices are further divided into switching intervals demarcated by instants when any thread in the application changes state from the active to inactive state, or vice versa, as it is only this action that can change the degree of parallelism (threads are considered to be active in TASK_RUNNING state and inactive otherwise). Figure 1 shows an example trace of a multithreaded application with four threads. The are context switching events and the are the time intervals between consecutive events, and . Thus, for example, Thread3’s timeslice spans two switching intervals: and .
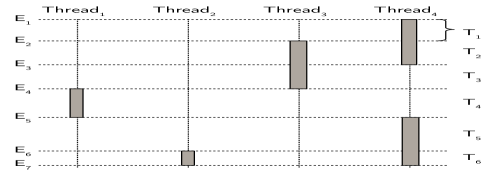
The CMetric for every active thread is updated at the end of each switching interval. For example, in the interval in Figure 1, there are two active threads, and hence the CMetric for that interval is , which is added to the individual CMetric of both Thread3 and Thread4. The CMetric for a timeslice of execution is the sum of the contributions from each switching interval that occurred during the timeslice.
As an example, if a thread’s timeslice spans the switching intervals then the CMetric at the end of its timeslice will be , where is the number of application threads that are active during interval .
In (Du Bois et al., 2013a) the idea was to use special-purpose hardware to keep track of the criticality metric with low cost. Here, we seek to achieve a similar effect in software, by exploiting existing mechanisms for tracing, and subsequently filtering, context-switch events in the Linux kernel.
3. Application tracing using eBPF
Calculating the CMetric requires tracking the duration and the number of active threads for each switching interval. In order to avoid instrumenting thread library primitives, and to capture scheduling activities triggered by other events, for example I/O, we keep track of active threads and their execution duration by tracing context-switch events using the eBPF framework, which provides a fast and secure mechanism to selectively trace kernel events (Fleming, 2017; Sharma and Dagenais, 2016).
Kernel events are traced by eBPF using place holders in the kernel, called tracepoints which, when enabled, can be monitored by attaching user defined
probe functions to them (Desnoyers, 2018). GAPP attaches a
probe function to such a tracepoint, sched_switch, which is triggered at
each context switch. This probe function keeps track of the number
of active threads and also calculates the CMetric for each switching interval, as
specified above.
Information about context-switches are maintained and shared with the user-space using eBPF maps. Maps can be global (shared between all cores) or per-cpu (local to a core). The GAPP architecture is shown in Figure 2.
In order to compute the CMetric for the application threads, GAPP’s probe functions set up the following eBPF maps:
| Map name | Description |
|---|---|
cm_hash |
Global hash map to store the CMetric of each thread |
global_cm |
Global scalar - cumulative sum of CMetrics across all switching events |
local_cm |
Local scalar - records value of global_cm when a thread switches in |
thread_count |
Global scalar - keeps track of the no. of active threads at any time |
total_count |
Global scalar - stores the total number of threads in the application |
thread_list |
Global hash - for each thread, if thread is inactive and if active |
t_switch |
Local scalar - stores the timestamp of the most recent switching event |
3.1. Identifying application threads
The sched_switch
probe function need to be executed only if either or both of the threads being
switched in/out belong to the application. We therefore capture and store to
thread_list, the identifiers of the application tasks, by attaching
additional probes to task_rename and task_newtask tracepoints, which are invoked when new processes/threads are created. They also increment total_count as new tasks are created,
and a probe attached to sched_process_exit tracepoint decrements it,
when
threads exit. Hence at any time, total_count represents the total number
of threads in the application.
3.2. Maintaining the number of active threads
The thread_count is maintained in part by the probe
function attached to the sched_switch
tracepoint. The arguments to this tracepoint include a. prev_pid: id of the thread being switched out and b. next_pid: id of the thread being switched in.
The thread_count is incremented whenever the next_pid
belongs to the application and was marked inactive in the thread_list.
Threads that were already in the running state do not alter the
thread_count when they are switched in. Thread_count is
decremented only when prev_pid is switched out to an inactive state.
When a waiting thread is woken up
it will eventually be switched in, but there may be a delay between the wake-up
and the context switch. During this time the thread is runnable, so it should be marked active in thread_list as soon as it is woken up. We therefore also trace wake-up events by attaching a
probe function to the sched_wakeup tracepoint. This decrements thread_count if the thread being woken up belongs
to the application.
4. Bottleneck Detection
4.1. Calculating the CMetric
Bottlenecks are identified by ranking execution timeslices in terms of their
CMetric, as detailed in Section 4.4 below. At each context switch
event, global_cm is updated from the kernel probe thus: global_cm += (t-t_switch)/thread_count, where t is
the current time and t_switch is the timestamp of the last switching
event. Notice that t-t_switch corresponds to the length of the latest
switching interval ( for some in Figure 1). When an
application thread is switched out, the cm_hash entry for that thread
(identifier prev_pid) is then updated thus:
cm_hash[prev_pid] += global_cm -local_cm
Note that if is the number of active application threads in the interval and the current timeslice spans the switching intervals between and inclusive, then the right-hand side above is equivalent to , as required.
If the thread being switched in belongs to the application then we store the value of global_cm to prepare for the next update to
cm_hash, viz. local_cm = global_cm.
4.2. Stack traces
At the end of a time-slice, we need to determine if it represents a potential bottleneck, and if so, we wish to pinpoint the line(s) of code that correspond to the bottleneck and also the call path that led to it by means of stack traces. The latter is important as it may be that a bottleneck appears only for a specific call path, even though other paths may lead to the same line of code.
A stack trace is recorded if the average level of
parallelism during the timeslice is below a given target threshold, ,
a tunable parameter, thus indicating
the execution of a potential bottleneck at some stage during that timeslice. To
do this we compute the weighted average of the number of active threads during a
timeslice, threads_av, similar to the calculation of the CMetric
detailed
above. A stack trace is triggered if threads_av .
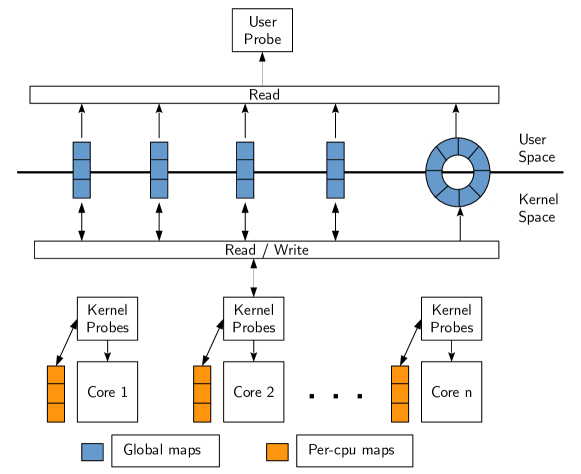
At the end of a time-slice, if a stack trace has been triggered, then the thread id, CMetric and stack trace are written to a circular buffer managed by eBPF (Figure 2). This buffer is readable from a user-space probe that runs in parallel with the application threads. To avoid having to store every entry in deep stack traces we only record the top (user-specified) entries in each.
4.3. Sampling probes
The above scheme works well if threads happen to be executing bottleneck code when a context switch happens. However, in many cases bottleneck code can be expected to complete its execution before the next context-switch event, i.e. before the next stack tracing opportunity. Because of this we have found that stack traces taken at context switches alone are often not enough to pinpoint the root cause of a bottleneck.
To address this problem, we use eBPF to add an additional lightweight
periodic sampling probe, with period (another tunable parameter) which
additionally records the instruction pointer whenever the absolute number of
active threads, as given by thread _count, is less than .
If these conditions are met then the thread id and instruction pointer are written
to the same eBPF circular buffer referred to above.
4.4. User space probe
The user-space probe, written using the BPF Compiler Collection (bcc) (Fleming, 2017) tool kit, runs in parallel with the application threads and communicates with the kernel probes via the circular buffer.
Instruction pointers from the sampling probe are read and assembled in a hash
map that is indexed by the thread id. When a CMetric and stack trace associated
with the same thread id are read from the buffer the information accumulated is
used to populate three locally-managed hash maps, indexed by a unique id,
ts_id, associated with the timeslice. These hash maps contain the CMetric,
the call path corresponding to the stack trace, and a list of addresses which
include those from the sampling probe. These addresses are the candidates for
bottleneck lines of code. If a stack trace is not triggered at the end of
a timeslice then a special entry is written to the circular buffer, along with
the current thread id, which instructs the user probe to reject any instruction
pointers from sample probes associated with that thread.
When the program terminates, the user probe enters a post-processing phase
which
seeks to determine the instruction pointers that have the highest collective
CMetric. At this point there will, in general, be a number of identical call paths
whose ts_id indices are included in the list of CMetric entries. If i
and j are two such indices, then the corresponding entries in the
address
lists and CMetric map are merged by: a. summing the CMetric values
at
indices i and j, b. combining the addresses at indices
i and j to generate a frequency table for those addresses.
At the end of the merge process, we are thus left with two hash maps, each indexed by a unique call path; one with the accumulated CMetric for the call path and the other with the list of sampled addresses for the same call path. The entries with the top total CMetrics are then taken as the bottlenecks.
The reason why the top entries are chosen instead of the top one alone is because one call path could be a subset of another, as would occur if a context-switch happened during execution of one function that indirectly calls another that contains a bottleneck.
Finally, the items in the address map(s) are mapped to function names and the
lines of code associated with them by calling the Linux addr2line
utility. The final profile is presented as a frequency table of functions and
lines of code as illustrated in Figure 7.
Critical timeslices with no samples
Sometimes, a timeslice may be identified as critical, but the sampler may fail to gather the instruction pointer(s) that define the location of the bottleneck. This can happen due to two reasons: either the timeslice was too short, so that the sampler missed it, or the sample belonged to a shared library or kernel code and hence could not be mapped to the source code. In the absence of any samples, the next best thing is to add the address at top of the stack, i.e., the return address of the caller, to the list of samples. In summary, the top stack address is attached to the samples, if a. the sample count is zero and b. the active thread count is less than or equal to , when the thread is switched out. Such samples are labelled as being from stack top to help the user interpret results correctly.
5. Evaluation
We now detail a series of experiments that aim to achieve: a) Evaluate GAPP’s ability to pinpoint bottlenecks in parallel applications and b) Quantify the overhead of the tool for various benchmarks.
5.1. Experimental Setup
We evaluate GAPP using applications from
the Parsec 3.0 benchmark suite (Bienia
et al., 2008) and two larger
open-source projects: MySQL and Nektar++(Cantwell
et al., 2015), a spectral/hp element framework for solving partial differential equations. Experiments were performed on a server machine with four AMD Opteron 6282SE eight-core/16-thread CPUs
(with
a total capability to run 64 threads in parallel) and 128GB of RAM. The system
runs on Linux 4.15 with the bcc toolkit installed. The applications were
compiled with gcc version 7.3.0 at the -O3 optimization level.
The
compiler options -g and -fno-omit-frame-pointer were enabled to
aid effective call stack retrieval. Recent versions of gcc generates
position-independent executable by default. To map addresses to source code
using addr2line, this behaviour need to be overridden through compiler
and linker options -fno-pie and -no-pie respectively.
In the initial set of experiments we used where is the
number of application threads, and a sampling period of . The sensitivity of the framework to these parameters is evaluated in
the README file of GAPP’s Github repository (GAP, 2019).
5.2. Results and Analysis
In this section, we analyze the results of profiling different parallel applications with GAPP.
Parsec 3.0 benchmark
We evaluated GAPP with 11 multi-threaded applications from the Parsec3.0 (Bienia
et al., 2008) benchmark suite.
The applications were executed with 64 threads on the native input set, as we were using a 64-core machine, although the framework does not restrict the number of threads in any way. All the applications except Freqmine
were compiled with the Pthreads library. Freqmine uses the OpenMP threading library.
Out of the 11 applications used for evaluation, two, namely Dedup and Ferret, are task-parallel; the remaining are data-parallel. GAPP is able to identify not only previously established bottlenecks, but also several that have not previously been reported. We compare the results with those from previous studies and show that GAPP is able to detect, and pinpoint, serialization bottlenecks resulting from, e.g. synchronization primitives, workload imbalance, busy-wait loops and contention.
Since these applications have been extensively analyzed in previous studies, we only report results which add to the existing analysis. The results obtained for other applications are listed in Table-2, which summarizes the critical functions along with original program execution time (T), the GAPP overhead as a percentage of the original time (O/H), the proportion of critical timeslices to the total timeslices as a percentage (CR), the memory usage of the tool (M) in MB and the post processing time (PPT) in seconds.
| Application | Critical Functions identified by GAPP | O/H | T (s) | CR | M (MB) | PPT (s) |
|---|---|---|---|---|---|---|
| Blackscholes | CNDF() | ¡ 1% | 29.4 | 470 (2%) | 109 | 0.02 |
| Bodytrack | OutBMP, RecvCmd | 5% | 21.3 | 6823 (0.5%) | 112 | 0.4 |
| Canneal | netlist_elem::swap_cost | 2.2 % | 62 | 267 (0.06%) | 112 | 0.1 |
| Dedup | deflate_slow | 12% | 13 | 362544 (40%) | 372 | 3.3 |
| Facesim | Update_Position_Based_State_Helper | 4.4% | 59 | 334 (0.004%) | 118 | 0.8 |
| Ferret | dist_L2_float | 3% | 30 | 42127 (51%) | 132 | 1.2 |
| Fluidanimate | parsec_barrier_wait | 2% | 37 | 11512 (1%) | 112 | 0.3 |
| Freqmine | FPArray_scan2_DB | 2% | 34 | 11721 (13%) | 110 | 0.6 |
| Streamcluster | parsec_barrier_wait, dist | 5.6% | 201 | 2246172 (10.6%) | 784 | 2.5 |
| Swaptions | HJM_SimPath_Forward_Blocking | 1% | 8.6 | 43 (0.07%) | 111 | 0.2 |
| Vips | imb_LabQ2Lab | 4% | 14 | 10460 (3.2%) | 118 | 2.3 |
| MySQL | fil_flush, sync_array_reserve_cell | ¡ 1% | 60 | 825 (0%) | 194 | 3 |
| Nektar++ | dgemv_ | 9% | 37 | 189990 (16%) | 446 | 2.1 |
Bodytrack
Bodytrack is a vision application that tracks the 3D pose of a
marker-less human body with multiple cameras through an image sequence. The
application uses worker threads to process video frames as per the
commands from the parent thread. GAPP identified OutputBMP() and RecvCmd() as the top critical functions. In RecvCmd(), the worker threads wait on a conditional variable till they receive commands from the parent thread.
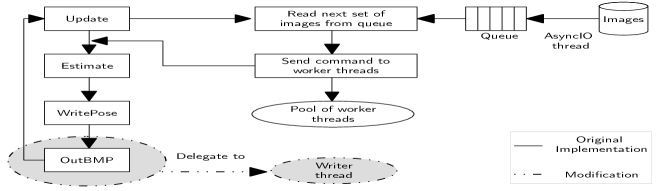
The OutputBMP function invoked by the parent thread, generates the camera image and saves it in BMP format. While the images are processed by OutputBMP, the worker threads are waiting on the conditional variable in the RecvCmd function. We commented out OutputBMP function and profiled all threads with GAPP, which showed 45% reduction in the number of samples from RecvCmd. This confirms that the OutputBMP function is indeed the bottleneck.
We offloaded the OutputBMP function from the parent thread to a new
thread called writerThread. Consequently, the parent passed commands to
the worker threads at a faster pace, thereby reducing the worker’s waiting
time. The modification improved the performance of Bodytrack by 22%.
This bottleneck has not been reported before. Figure 3 outlines the logic of Bodytrack, before and after optimization.
Ferret and Dedup
Ferret and Dedup are task-parallel applications designed with different pipeline stages, with a queue connecting each stage to the next one.
Ferret implements content-based similarity search on images, audio, 3D shapes etc, and is implemented with six pipeline stages. The first
and last phases, which perform I/O, are serial phases. The middle four stages
implement query image segmentation, feature extraction, indexing and ranking
respectively. We executed Ferret with threads in each of the
parallel phase making a total of threads for the whole execution. The top
critical functions identified by GAPP were invoked by emd()
(Earth Mover’s Distance) which finds the pair-wise distance between query
image and candidate images, and also forms the core of the ranking phase.
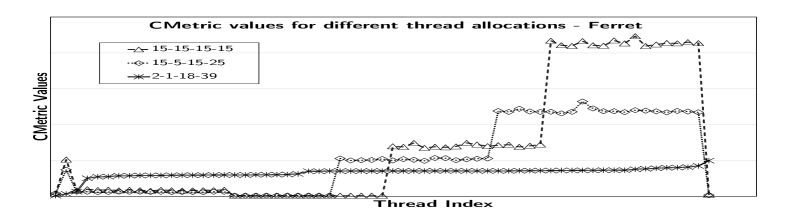
As evident from Figure 4, Ferret exhibited huge imbalance in
CMetric among the threads(We have used a line chart to represent this discrete data
in order to highlight the variation in CMetricamong the phases, for a particular
thread allocation). The threads with higher CMetric belonged to the
ranking phase as was evident from the critical functions identified by
GAPP (see Table 2:Ferret).
We redistributed the load among the parallel phases in Ferret, until we obtained a uniform CMetric for the threads, as shown in figure 4. Threads were reallocated as 2-1-18-39 among the parallel phases, which improved the run time of Ferret by 50%, almost double the speed-up achieved by the reallocation of 20-1-22-21 suggested by (Curtsinger and Berger, 2015) (23% speed up on the test bed).
Dedup is designed with five pipeline stages, viz., Fragment, FragmentRefine, Deduplicate, Compress and Reorder. The first and last stages perform I/O with a single thread, and the rest parallelize the task among a pool of worker threads. In our experiments, Dedup was configured to run with threads in the intermediate stages to make a total of threads for the application.
With an initial thread allocation of 1-20-20-20-1, the write_file() function from the Reorder phase, and the deflate_slow function from the Compress phase were identified as the top critical paths. The sequential phase, Reorder, which writes the compressed chunks to a file, is known to be a bottleneck (De Sensi et al., 2017). To accelerate the Compress phase, we moved threads from the FragmentRefine and Deduplicate stages to the Compress stage, and ran the experiment with 1-16-16-28-1 threads in the respective stages. However, increasing parallelism in the Compress stage increased the run time, which indicates possible contention in the particular stage. We decreased the number of threads in the Compress stage from to (thread allocation 1-20-20-15-1), and this improved the run time by 14%.
The workload imbalance among threads in Dedup and Ferret was reported in (ul Alam et al., 2017) for a 16 core machine, which also suggests an optimal thread allocation for the two applications. We have included it here to show how GAPP can be used to tune the load among threads in such cases.
5.3. GAPP on real world applications
We have also tested GAPP with two large applications viz.,
Nektar++ and MySQL.
Nektar++ is a multi-process application that uses
OpenMPI, while MySQL is a multi-threaded database management system.
Nektar++
We evaluate GAPP on an MPI application, Nektar++, which
implements scalable PDE solvers using the spectral/hp element
method (Cantwell
et al., 2015). We focused the evaluation on the
Incompressible Navier-Stokes Solver (IncNSS), which was configured to run with processes on a cylindrical surface. The solver divides the complex problem into several small elements represented as an unstructured mesh, partitions the mesh and assigns each partition to an individual process.
Message passing in Nektar++ is implemented with OpenMPI, and by
default, MPI processes are configured to run in “aggressive” mode. In this
mode, rather than blocking waiting for messages, processes spin on a busy-wait
loop. Hence the initial profile generated by GAPP exhibited uniform
CMetric for all processes, as they are never idle. However, this behaviour masks any load
imbalances in the application.
To disable busy waiting, we recompiled Nektar++ with MPICH, an
alternate implementation of the MPI standard, enabling the
--with-device=ch3:sock option. This revealed a substantial
non-uniformity in load, as shown in Figure 5.
A likely cause of such load imbalances is non-uniform partitioning. To test this we artificially created a structured mesh for a cuboid surface and uniformly partitioned it among eight processes. The use of a structured mesh makes it easier to generate uniform partitions. With this partitioning, processes exhibited negligible variation in CMetric, which confirms that the imbalance in the cylidrical solver was indeed non-uniform partitioning. Fixing this would involve re-engineering the mesh partitioner, which is beyond the scope of the current work.
As well as identifying the above load imbalance
GAPP pinpointed dgemv_(), a matrix multiplication routine exported by the BLAS library, as the top critical function in IncNSS. We recompiled Nektar++ with OpenBLAS, an
optimized version of the BLAS library. This improved the performance of
the application by % and moved the bottleneck from dgemv_() to
Vmath::Dot2() function (Figure 6). Note that this led to
negligable change in the observed load imbalance.
Note also that dgemv_() doesn’t represent a serialization bottleneck – it is simply an
expensive function that happened to be executing with reduced parallelism.
MySQL
We profiled MySQL 5.7 with GAPP, while executing the
OLTP_Read_Write workload from Sysbench benchmark. The top
critical samples were from pfs_os_file_flush_func(), which flushes the
write buffers of a given file to disk. The call path shows that this function
was invoked by InnoDB, the transactional storage engine for
MySQL (Figure 7a.). To optimize InnoDB disk I/O, we
increased the buffer pool size to GB (70% of the total system memory) as
suggested in (mys, 2019b). This improved the transaction rate (measured
in transactions per second) by 19% and reduced the average latency by 16%.
a. Critical Path 1:

fil_flush()[mysqld]
<---log_write_up_to()
<---trx_commit_complete_for_mysql()
<---innobase_commit()
<---ha_commit_low()
<---TC_LOG_DUMMY::commit()
<---ha_commit_trans()
<---trans_commit()
<---mysql_execute_command()
<---Prepared_statement::execute()

Functions and lines + frequency
-------------------------------
pfs_os_file_flush_func -- 1462
  os0file.ic:507 (StackTop) -- 1462
b. Critical Path 2:

sync_array_reserve_cell()
<---rw_lock_s_lock_spin()
<---pfs_rw_lock_s_lock_func()
<---row_search_mvcc()
<---ha_innobase::index_read()
<---handler::ha_index_read_idx_map()
<---join_read_const_table()
<---JOIN::extract_func_dependent_tables()
<---JOIN::make_join_plan()
<---JOIN::optimize()

Functions and lines + frequency
-------------------------------
sync_array_reserve_cell() -- 469
  sync0arr.cc:389 (StackTop) -- 469
The second most critical samples were from a spin-wait loop in
sync_array_reserve_cell() invoked from
rw_lock_s_lock_spin, as shown in Figure 7b.
Mutexes and read-write locks in MySQL are designed such that the threads poll for them for a short period of time before they block.
The duration of the spin-wait loop is dependent on a random number between
and INNODB_SPIN_WAIT_DELAY (a configurable constant). The default
value of this constant is . (mys, 2019a) advises to set the constant to a higher value to improve performance on machines with large number of cores. We set the constant to a value , and this cumulatively improved the transactions rate by 34% and reduced the average latency by 25%. Moreover, the number of cache misses decreased by 10.5%, when compared with the default delay variable value. This shows better cache performance with increased spin-wait delay.
Interestingly, optimising the spin-wait delay without first optimising
the buffer size made negligible difference to the overall performance. This
emphasises the importance of ranking the bottlenecks by criticality and tackling
each in turn.
The bottlenecks detected in MySQL were fixed by tuning configuration parameters, rather than re-factoring the source code. Existing MySQL performance tuning tools are designed to identify similar optimization opportunities. Nonetheless, the experiments show that GAPP, which is a generic tool, is capable of identifying similar architecture dependent bottlenecks.
5.4. Overhead
For the 13 applications evaluated, the maximum overhead incurred was only 13% (Table-2). The overhead induced by a profiler on the application is important, as it can alter the application’s normal behaviour. To minimize the effect of tracing on program behaviour we collect call paths only at the end of a context-switch and only if the time-slice exhibited reduced parallelism; similarly instruction pointers from the sampling probe.
The overhead was found to be dependent on the ratio of critical time slices to the total time slices, the depth of the stack traces and the number of distinct stack traces. This is because GAPP caches address-to-symbol mapping, and hence the mapping time will be less when stack traces are identical.
The memory overhead was found to be proportional to the number of samples and the number of critical timeslices/ stacktraces.
6. Related work
Bottleneck detection in multithreaded applications is by no means new and several techniques have been proposed. Some of them identify parallelism bottlenecks based on critical sections (Yu and Pradel, 2016; Joao et al., 2012), critical paths (Chen and Stenstrom, 2012), bottlenecks introduced by specific resource access (synchronization) mechanisms, for example locks (Tallent et al., 2010; David et al., 2014) or by native threading libraries, such as POSIX threads (ul Alam et al., 2017) and Intel TBB (Yoga and Nagarakatte, 2017). These strategies identify execution regions where the resource is acquired and released by instrumenting the source code or binary. The major benefit of using instrumentation mechanisms is the ease to map execution traces to the source code. Information is generated only at instrumentation points thereby limiting the amount of data collected, which makes post-processing faster and easier. However, they can only pin point bottlenecks that arise due to a particular class of resource and are also bound to a particular language or library which restricts their use.
Techniques that work independent of the language or library commonly rely on stack traces (Ammons et al., 2004; Han et al., 2012; Yu et al., 2014) or core dumps (Altman et al., 2010) to identify expensive call sequences or excessive idle time. They are designed to filter and analyze large amounts of data generated during program execution.
Yet another category of tools either categorize bottlenecks based on hardware events (Eyerman et al., 2012; Heirman et al., 2011; Yoo, 2012) or limit their scope in identifying the critical thread (Du Bois et al., 2013b, a) alone.
Bottlegraphs (Du Bois et al., 2013b) and Criticality Stacks (Du Bois et al., 2013a) identify the most critical thread by ranking threads based on the execution time and number of active threads. They were proposed as mechanisms to identify and accelerate critical threads for power/ performance optimizations.
GAPP’s logic bears some similarity to those proposed in (Du Bois et al., 2013b, a; Tallent and Mellor-Crummey, 2009) and (Kambadur et al., 2014). Bottlegraphs (Du Bois et al., 2013b) tracks active threads using kernel modules that intercept futex calls and system calls that create, destroy and schedule threads. Criticality Stacks (Du Bois et al., 2013a) proposes a hardware approach to calculate the Criticality Metric and identify the critical threads which are diverted to faster cores for performance and energy optimization. While both are capable of identifying critical threads, they do not provide information regarding the code section or function that causes the bottleneck. (Kambadur et al., 2014) ranks all basic blocks in a program based on their share of parallel execution. Execution information is gathered using Parallel Block Vectors (Kambadur et al., 2013), which uses an LLVM compiler pass to instrument the Pthread library routines in the application. (Tallent and Mellor-Crummey, 2009) quantifies insufficient parallelism by attaching an idleness metric to each call path. It samples a time-based counter, and a signal handler collects the calling contexts, if the application thread is active during the sample.
While GAPP’s logic is similar, it does not require any hardware modification or software instrumentation, produces accurate results as every scheduling event is captured, and achieves the same goal with very low overhead, as calling contexts are gathered only when critical. Moreover, GAPP will work with an arbitrary number of threads or when other applications are running concurrently. This is because GAPP uses the thread state to determine whether it is active or not, whereas similar approaches proposed in (Du
Bois et al., 2013a) and (Tallent and
Mellor-Crummey, 2009) considers a thread to be active only if it is occupying a CPU core. The calculation of degree of parallelism can go wrong in such cases when there are other applications running concurrently or when the number of threads in the application is greater than the number of CPUs. (Kambadur
et al., 2014) calculates the degree of parallelism by instrumenting thread creation/exit/synchronization primitives in the pthread library. Hence, if a thread gets blocked for some reason other than synchronization, it will not be captured by the framework.
GAPP’s approach is complementary to a recent study on off-cpu
analysis (Zhou
et al., 2018), which identifies waiting events critical to
throughput. Information regarding waiting events are recorded by tracking
interrupts and thread switching events using kprobes. This information is
used to build a wait-for-graph, which is post-processed to determine
threads that are influenced by a waiting event. Even though GAPP does not
explicitly state the waiting-relationship among tasks, we have observed that the
same information can be interpreted from stack traces generated during
context-switches. wPerf can provide more detailed information than
GAPP through its wait-for graphs, but the tradeoff is that it requires substantially longer
post-processing times, e.g. 271.9 sec for MySQL as quoted in (Zhou
et al., 2018). The reported application
execution time overheads are broadly similar to GAPP.
GAPP’s results are found to be consistent across multiple runs, and the results can be obtained in a single execution. With tools such as (Curtsinger and Berger, 2015), we have observed significant variations across experiments on an 8-core machine. This most likely happens because it uses a statistical approach based on sample count to determine the delay inserted in threads and we have found that this can make it difficult to reproduce results from one run to the next. Also (Curtsinger and Berger, 2015) does not report call paths and this can be important when the same code can be invoked from multiple paths. Moreover, none of these tools have been tested on parallel applications that use MPI or similar message passing constructs.
6.1. Limitations
Locks or synchronization primitives with low contention may not be identified by GAPP. Even though these are not strict serialization bottlenecks, it has been proven that using the proper primitive in such cases can improve the performance (ul Alam et al., 2017) and hence is a possible optimization opportunity.
GAPP may not identify spin locks that spin indefinitely. This is a problem shared by other frameworks that rely on instrumentation, as spin-locks can be implemented using custom-built primitives that instrumentation cannot detect.
As in the case of spin-locks, GAPP will not identify bottlenecks in applications that busy wait, such as MPI applications executing in aggressive mode. However, from our experience, disabling the aggressive mode, at least in the development phase, will help identify existing load imbalance among participating processes.
The default behaviour of gcc, of generating position-independent executables, needs to be overridden for the addr2line utility to work properly. This can be overcome by finding a way to map the offset provided by the sym() primitive of bcc to the source code.
Also it may be noted that, adding eBPF probes to the kernel and removing probes from it require root privileges and hence GAPP requires root privileges for its operation.
7. Conclusion and Future Work
GAPP works “out of the box” in that it can be used to profile an application without the need to instrument the source code, patch the operating system or undertake elaborate post-processing of data captured during a program’s execution. Moreover, the verifier in the eBPF framework ensures that the probes are safe to attach to a live kernel.
GAPP is able to identify a range of different bottlenecks, for example critical sections, execution hot-spots, bottlenecks identified from hardware events, busy-wait loops and resource contention. GAPP has proven to be remarkably good at detecting bottlenecks, but in order to classify the bottleneck type, e.g. as being due to synchronization or I/O, more work is required. In order to automate the process of bottleneck classification we have recently experimented with tracking I/O system calls with a view to determining which files, IP addresses etc. an application interacts with. We have also explored tracing kernel-level synchronization (“futex”) calls which are used by many higher-level libraries and macros. For example, by combining GAPP’s existing criticality information with an analysis of futex ‘wakers’ it is relatively easy to distinguish critical from non-critical lock holders; this can help to rank multiple call paths leading to the same lock. By accessing other hardware counters it is possible in principle to trace other sources of bottlenecks such as page faults.
It would be good to see how GAPP behaves with other parallel platforms such as Java, Intel TBB, Cilk etc. While the core concepts in GAPP is not attached with any language/library, we need to experiment and see how stack traces and address mapping work in the presence of virtual environments or intermediate schedulers present in such platforms.
References
- (1)
- GAP (2019) 2019. GAPP Development Repository. https://github.com/RN-dev-repo/GAPP.
- mys (2019a) 2019a. MySQL 5.7 Reference Manual. Retrieved 2019-09-15 from https://docs.oracle.com/cd/E17952_01/mysql-5.7-en/innodb-performance-spin_lock_polling.html
- mys (2019b) 2019b. MySQL 5.7 Reference Manual::8.5.8 Optimizing InnoDB Disk I/O. https://dev.mysql.com/doc/refman/5.7/en/optimizing-innodb-diskio.html
- Altman et al. (2010) Erik Altman, Matthew Arnold, Stephen Fink, and Nick Mitchell. 2010. Performance analysis of idle programs. In ACM Sigplan Notices, Vol. 45. ACM, 739–753.
- Ammons et al. (2004) Glenn Ammons, Jong-Deok Choi, Manish Gupta, and Nikhil Swamy. 2004. Finding and removing performance bottlenecks in large systems. In European Conference on Object-Oriented Programming. Springer, 172–196.
- Bienia et al. (2008) Christian Bienia, Sanjeev Kumar, Jaswinder Pal Singh, and Kai Li. 2008. The PARSEC benchmark suite: Characterization and architectural implications. In Proceedings of the 17th international conference on Parallel architectures and compilation techniques. ACM, 72–81.
- Cantwell et al. (2015) Chris D Cantwell, David Moxey, Andrew Comerford, Alessandro Bolis, Gabriele Rocco, Gianmarco Mengaldo, Daniele De Grazia, Sergey Yakovlev, J-E Lombard, Dirk Ekelschot, et al. 2015. Nektar++: An open-source spectral/hp element framework. Computer physics communications 192 (2015), 205–219.
- Chen and Stenstrom (2012) Guancheng Chen and Per Stenstrom. 2012. Critical lock analysis: Diagnosing critical section bottlenecks in multithreaded applications. In Proceedings of the international conference on high performance computing, networking, storage and analysis. IEEE Computer Society Press, 71.
- Corbet (2014) Jonathan Corbet. 2014. The BPF system call API, version 14. https://lwn.net/Articles/612878/
- Curtsinger and Berger (2015) Charlie Curtsinger and Emery D Berger. 2015. Coz: Finding Code that Counts with Causal Profiling Charlie. Sosp (2015), 184–197. https://doi.org/10.1145/2815400.2815409 arXiv:1608.03676
- David et al. (2014) Florian David, Gael Thomas, Julia Lawall, and Gilles Muller. 2014. Continuously measuring critical section pressure with the free-lunch profiler. In ACM SIGPLAN Notices, Vol. 49. ACM, 291–307.
- De Sensi et al. (2017) Daniele De Sensi, Tiziano De Matteis, Massimo Torquati, Gabriele Mencagli, and Marco Danelutto. 2017. Bringing Parallel Patterns Out of the Corner: The P3 ARSEC Benchmark Suite. ACM Trans. Archit. Code Optim. 14, 4, Article 33 (Oct. 2017), 26 pages. https://doi.org/10.1145/3132710
- Desnoyers (2018) Mathieu Desnoyers. 2018. Using the Linux Kernel Tracepoints @ONLINE. https://www.kernel.org/doc/Documentation/trace/tracepoints.txt
- Du Bois et al. (2013a) Kristof Du Bois, Stijn Eyerman, Jennifer B Sartor, and Lieven Eeckhout. 2013a. Criticality stacks: Identifying critical threads in parallel programs using synchronization behavior. In ACM SIGARCH Computer Architecture News, Vol. 41. ACM, 511–522.
- Du Bois et al. (2013b) Kristof Du Bois, Jennifer B Sartor, Stijn Eyerman, and Lieven Eeckhout. 2013b. Bottle graphs: visualizing scalability bottlenecks in multi-threaded applications. In ACM SIGPLAN Notices, Vol. 48. ACM, 355–372.
- Eyerman et al. (2012) Stijn Eyerman, Kristof Du Bois, and Lieven Eeckhout. 2012. Speedup stacks: Identifying scaling bottlenecks in multi-threaded applications. In Performance Analysis of Systems and Software (ISPASS), 2012 IEEE International Symposium on. IEEE, 145–155.
- Fleming (2017) Matt Fleming. 2017. A thorough introduction to eBPF. https://lwn.net/Articles/740157/
- Han et al. (2012) Shi Han, Yingnong Dang, Song Ge, Dongmei Zhang, and Tao Xie. 2012. Performance debugging in the large via mining millions of stack traces. In Proceedings of the 34th International Conference on Software Engineering. IEEE Press, 145–155.
- Heirman et al. (2011) W. Heirman, T. E. Carlson, S. Che, K. Skadron, and L. Eeckhout. 2011. Using cycle stacks to understand scaling bottlenecks in multi-threaded workloads. In 2011 IEEE International Symposium on Workload Characterization (IISWC). 38–49. https://doi.org/10.1109/IISWC.2011.6114195
- Joao et al. (2012) José A Joao, M Aater Suleman, Onur Mutlu, and Yale N Patt. 2012. Bottleneck identification and scheduling in multithreaded applications. ACM SIGPLAN Notices 47, 4 (2012), 223–234.
- Kambadur et al. (2013) Melanie Kambadur, Kui Tang, and Martha A Kim. 2013. Parallel Block Vectors: Collection, Analysis, and Uses. IEEE Micro 33, 3 (2013), 86–94.
- Kambadur et al. (2014) Melanie Kambadur, Kui Tang, and Martha A Kim. 2014. Parashares: Finding the important basic blocks in multithreaded programs. In European Conference on Parallel Processing. Springer, 75–86.
- Sharma and Dagenais (2016) Suchakrapani Datt Sharma and Michel Dagenais. 2016. Enhanced Userspace and In-Kernel Trace Filtering for Production Systems. Journal of Computer Science and Technology 31, 6 (2016), 1161–1178.
- Tallent and Mellor-Crummey (2009) Nathan R Tallent and John M Mellor-Crummey. 2009. Effective performance measurement and analysis of multithreaded applications. In ACM Sigplan Notices, Vol. 44. ACM, 229–240.
- Tallent et al. (2010) Nathan R. Tallent, John M. Mellor-Crummey, and Allan Porterfield. 2010. Analyzing Lock Contention in Multithreaded Applications. In Proceedings of the 15th ACM SIGPLAN Symposium on Principles and Practice of Parallel Programming (PPoPP ’10). ACM, New York, NY, USA, 269–280. https://doi.org/10.1145/1693453.1693489
- ul Alam et al. (2017) Mohammad Mejbah ul Alam, Tongping Liu, Guangming Zeng, and Abdullah Muzahid. 2017. Syncperf: Categorizing, detecting, and diagnosing synchronization performance bugs. In Proceedings of the Twelfth European Conference on Computer Systems (EuroSys’ 17). ACM, New York, NY, USA. 298–313.
- Yoga and Nagarakatte (2017) Adarsh Yoga and Santosh Nagarakatte. 2017. A fast causal profiler for task parallel programs. arXiv preprint arXiv:1705.01522 (2017).
- Yoo (2012) Wucherl Yoo. 2012. Automated performance characterization of applications using hardware monitoring events. University of Illinois at Urbana-Champaign.
- Yu and Pradel (2016) Tingting Yu and Michael Pradel. 2016. SyncProf: detecting, localizing, and optimizing synchronization bottlenecks. In Proceedings of the 25th International Symposium on Software Testing and Analysis. ACM, 389–400.
- Yu et al. (2014) Xiao Yu, Shi Han, Dongmei Zhang, and Tao Xie. 2014. Comprehending Performance from Real-world Execution Traces: A Device-driver Case. In Proceedings of the 19th International Conference on Architectural Support for Programming Languages and Operating Systems (ASPLOS ’14). ACM, New York, NY, USA, 193–206. https://doi.org/10.1145/2541940.2541968
- Zhou et al. (2018) Fang Zhou, Yifan Gan, Sixiang Ma, and Yang Wang. 2018. wPerf: generic Off-CPU analysis to identify bottleneck waiting events. In 13th USENIX Symposium on Operating Systems Design and Implementation (OSDI 18). 527–543.