On the absence of symbiotic stars in globular clusters
Abstract
Even though plenty of symbiotic stars (SySts) have been found in the Galactic field and nearby galaxies, not a single one has ever been confirmed in a Galactic globular cluster (GC). We investigate the lack of such systems in GCs for the first time by analysing 144 GC models evolved with the mocca code, which have different initial properties and are roughly representative of the Galactic GC population. We focus here on SySts formed through the wind-accretion channel, which can be consistently modelled in binary population synthesis codes. We found that the orbital periods of the majority of such SySts are sufficiently long ( d) so that, for very dense GC models, dynamical interactions play an important role in destroying their progenitors before the present day ( Gyr). In less dense GC models, some SySts are still predicted to exist. However, these systems tend to be located far from the central parts ( per cent are far beyond the half-light radius) and are sufficiently rare ( per GC per Myr), which makes their identification rather difficult in observational campaigns. We propose that future searches for SySts in GCs should be performed in the outskirts of nearby low-density GCs with sufficiently long half-mass relaxation times and relatively large Galactocentric distances. Finally, we obtained spectra of the candidate proposed in Cen (SOPS IV e-94) and showed that this object is most likely not a SySt.
keywords:
binaries: symbiotic – globular clusters: general – methods: numerical – stars: evolution – stars: individual: SOPS IV e-94.1 Introduction
Symbiotic Stars (SySts) are interacting binaries in which, usually, a white dwarf (WD) accretes matter from an evolved red giant (see Mikołajewska, 2012, for a review). They are characterized by high accretion rates (greater than a few M⊙ yr-1), which are needed to detect the WD beside an evolved red giant donor (e.g. Kenyon, 1986), and sufficiently long orbital periods, which are needed to accommodate the evolved giant. In many SySts, the accretion rate is high enough (greater than a few M⊙ yr-1) to trigger and support quasi-steady thermonuclear burning. The composition of SySts makes them very important luminous tracers of the late phases of low- and medium-mass binary star evolution and, in turn, excellent laboratories to test models of binary evolution. In particular, their studies have important implications for, e.g. understanding mass transfer in wide binaries, the interaction of novae with their interstellar surroundings, or the formation of astrophysical jets. Last but not least, SySts are also promising nurseries for type Ia supernovae, regardless of whether the path to the thermonuclear explosion of a Chandrasekhar-mass carbon-oxygen WD is through accretion, the so-called single degenerate scenario, or through coalescence of double WD systems, the so-called double degenerate scenario (e.g. Di Stefano, 2010; Mikołajewska, 2013; Iłkiewicz et al., 2019).
As in the case of other WD binaries, such as cataclysmic variables and AM CVn, SySts are usually defined by spectroscopic properties (Kenyon, 1986), i.e. (i) a red continuum with absorption features of a late-type red giant; (ii) a blue continuum with bright strong H i and He i emission lines; (iii) either additional lines with an ionizational potential of at least 30 eV (e.g. He ii, [O iii], [Ne v], and [Fe vii]) with an equivalent width of at least Å or an A- or F-type continuum with additional absorption lines from H i and He i and singly ionized metals. This definition seems quite convenient for Galactic SySts, since there is no contamination from the interstellar medium emission lines (Mikołajewska et al., 2017).
Depending on the red giant nature, SySts are divided into two main classes. The S-type SySts host normal red giants and have orbital periods of the order of a few years. The D-type SySts harbour Mira variables (e.g. Gromadzki et al., 2009) usually surrounded by a warm dust shell and are expected to have orbital periods of decades or longer (Whitelock, 1987), despite only one such system having a determined orbital period (R Aquarii: 43.6 yr, Gromadzki & Mikołajewska, 2009). Even though S-type SySts correspond to the majority of known systems ( per cent), the pathways leading to their formation is far from being understood, since their orbital period distribution cannot be accounted for by current binary populations models (e.g. Webbink, 1988; Mikołajewska, 2012).
Up to now, the most detailed study of SySts using binary population modelling was performed by Lü et al. (2006). These authors predicted that the orbital period distribution of SySts should peak at d and that only per cent SySts should have orbital periods shorter than d. Lü et al. (2006) explained the discrepancy between their result and the observed orbital period distribution, which peaks around d, by an observational incompleteness of the sample. These authors argued that the observations were biased towards bright SySts with small orbital periods. At that time, only 30 SySts had known orbital periods (Mikołajewska, 2003). That sample included SySts with orbital periods shorter than d, which were hardly predicted to exist in their binary population models. However, since then, the orbital periods of over 100 known SySts in the Milky Way and Magellanic Clouds have been measured and the main characteristics of their distribution remain practically unchanged (Mikołajewska, 2012; Gromadzki et al., 2013).
At the moment, there seems to be a general problem with binary population models that predict a bi-modal final orbital period distribution for binaries that have evolved off the first giant branch and the asymptotic giant branch, in which the common-envelope channel results in a rich variety of short-period ( day) binaries and the wind-accretion channel results in plenty of systems with orbital periods longer than d (Nie et al., 2012, see their fig. 13). The most peculiar result of the adopted evolutionary scenario is that there are virtually no binaries predicted with orbital periods of d, especially because we know they do exist from observations of both SySts and Galactic post-AGB binaries (e.g., van Winckel et al., 2009; Oomen et al., 2018). All these accentuate the need for more advanced models for mass transfer in binaries with red giant donors (e.g., Podsiadlowski & Mohamed, 2007; Chen et al., 2010; Iłkiewicz et al., 2019).
SySts have been found since the beginning of the last century in several different environments, and more than 200 such systems exist in the Milky Way (e.g., Belczyński et al., 2000; Miszalski et al., 2013; Miszalski & Mikołajewska, 2014; Rodríguez-Flores et al., 2014; Merc et al., 2019). In addition, there are plenty discovered in nearby galaxies, such as the Magellanic Clouds (Ilkiewicz et al., 2018), M31 (Mikołajewska et al., 2014), M33 (Mikołajewska et al., 2017) as well as single SySts in NGC 6822 (Kniazev et al., 2009) and NGC 205 (Gonçalves et al., 2015). Despite the frequency of SySts in several different environments, not a single one has ever been detected in a Galactic globular cluster (GC). So far, only a few attempts have been made to identify SySts in Galactic GCs. However, such investigations have not been designed for that purpose and, as pointed out by Zurek et al. (2016), due to their long orbital periods and the dominant contribution of the red giant at longer wavelengths, SySts will usually be missed by optical variability surveys. Spectroscopic surveys are ideal to identify emission lines and, in turn, SySts, but they are very time-consuming and, consequently, rare. However, photometric surveys using narrow-band filters centred on either the He ii and H (Ilkiewicz et al., 2018) or the Raman-scattered [O vi] emission lines (Angeloni et al., 2019) are another promising way to look for SySts in GCs.
The first SySt thought to be related to a GC is Pt 1, possibly associated with the GC NGC 6401 (Peterson, 1977). This system though was later classified as a Galactic halo SySt (Torres-Peimbert et al., 1980). After that, Zurek et al. (2016) suggested that the far-ultraviolet variable source N1851-FUV1, within the core of NGC 1851, could be a SySt, given that there is a red giant spatially coincident with this source. However, its spectrum clearly lacks any emission lines, which indicates that the SySt interpretation is probably not right and the presence of a red giant nearby is just a chance superposition of two unrelated objects. This source is now believed to be an AM CVn candidate, based on its X-ray properties, its spectral energy distribution and the amplitude of its light curve. More recently, Henleywillis et al. (2018) proposed that the second-brightest X-ray source in Cen, possibly associated with the carbon star SOPS IV e-94, is a promising SySt candidate. As we shall see in Section 2, based on published and new data, SOPS IV e-94 is most likely not a SySt.
GCs are one of the most important objects for investigating the formation and the physical nature of exotic systems such as X-ray binaries, degenerate binaries, black holes, blue straggler stars, cataclysmic variables, millisecond pulsars, etc (e.g. Benacquista & Downing, 2013). Such studies provide tools that can help to understand the formation and evolution processes of star clusters, galaxies and, in general, the young Universe. Therefore, understanding the absence of SySts in GCs might lead to important astrophysical implications.
We concentrate here on SySts formed through the wind-accretion channel, i.e. without Roche-lobe overflow in the WD formation. We notice that most SySts are S-type and, in most of them, the WD likely formed in an episode of Roche-lobe overflow. However, their formation channels are clearly not understood, which makes the modelling of these systems difficult, not only in isolation, but also in GCs. Therefore, we leave these systems for follow-up works, in which we will first try to explain their orbital period distribution, and subsequently investigate the role of dynamics in shaping their properties in GCs.
In this paper, we search for the physical reasons behind the absence of SySts in GCs. In particular, we check whether dynamics could play a significantly important role in destroying their progenitors during the GC evolution. In addition, for those GC SySt that are not destroyed, we predict their properties and correlations with their host GCs, by providing relevant information that might help future theoretical and observational efforts.
2 Is SOPS IV e-94 a symbiotic star in Cen?
The second-brightest X-ray source in Cen, CXOHCD J132601.59–473305.8, lies at about arcmin southwest of the cluster centre. The position of this X-ray source coincides closely with that of SOPS IV e-94, which is a Population II carbon star (Harding, 1962) and the first such a star identified in a GC. Indeed, SOPS IV e-94 is at arcsec from the Chandra position of CXOHCD J132601.59–473305.8, inside the per cent confidence radius of arcsec. van Loon et al. (2007) noticed that it is the brightest and reddest carbon star in the cluster, and its very high 12C:13C ratio points at the -process in an asymptotic giant branch carbon star to have been responsible for its large carbon overabundance. Based on the characteristics of carbon stars and the optical and X-ray properties of this source, Henleywillis et al. (2018) proposed that this could be the first SySt ever identified in a Galactic GC.
In order to identify SOPS IV e-94 as a SySt, particular features in the spectrum are expected (see Sec. 1) and until these are indeed observed, this object cannot be confidently classified as a SySt. The minimum requirement is the presence of Balmer emission lines in the optical spectrum. Whereas the published optical photometry of SOPS IV e-94 (, , , , , ; Bellini et al., 2009) indicates that there could be some H emission (), the published spectra (Harding, 1962; van Loon et al., 2007) do not show any emission lines. Instead, the negative H colour could be simply due to strong molecular bands that are present in the optical spectrum and affect the mag. In such a case, SOPS IV e-94 would represent another example of a chance superposition of two unrelated objects – the X-ray source and the carbon giant – as in the case of N1851-FUV1 in NGC 1851.
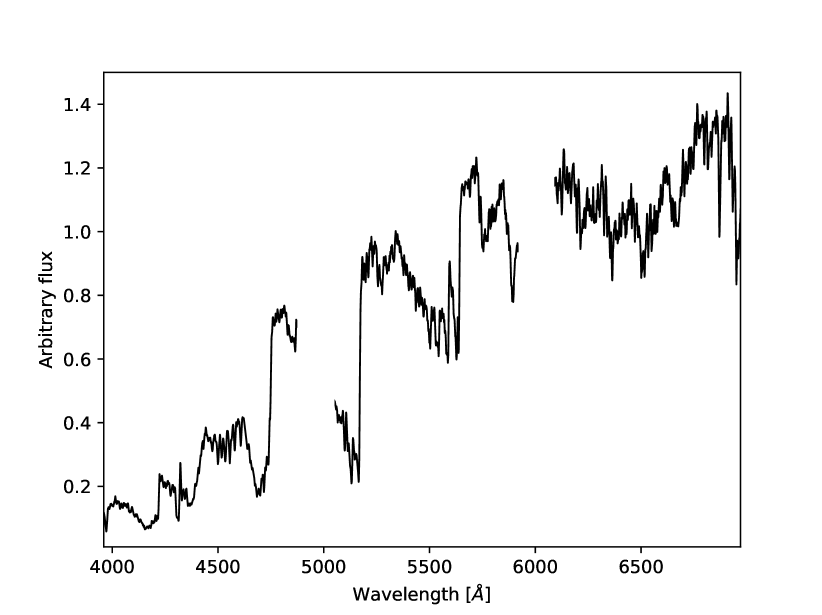
To refine the nature of SOPS IV e-94, we obtained a deep optical spectrum with the Robert Stobie Spectrograph (RSS; Burgh et al., 2003; Kobulnicky et al., 2003) mounted on the Southern African Large Telescope (SALT; Buckley et al., 2006; O’Donoghue et al., 2006) under programme 2019-2-SCI-021 (PI: Iłkiewicz). A single RSS configuration was adopted with PG900 grating and a slit width of 1.5 arcsec to give wavelength coverage from to Å with resolving power . The spectrum, presented in Fig. 1, was made on 14-01-2020 with a s exposure time.
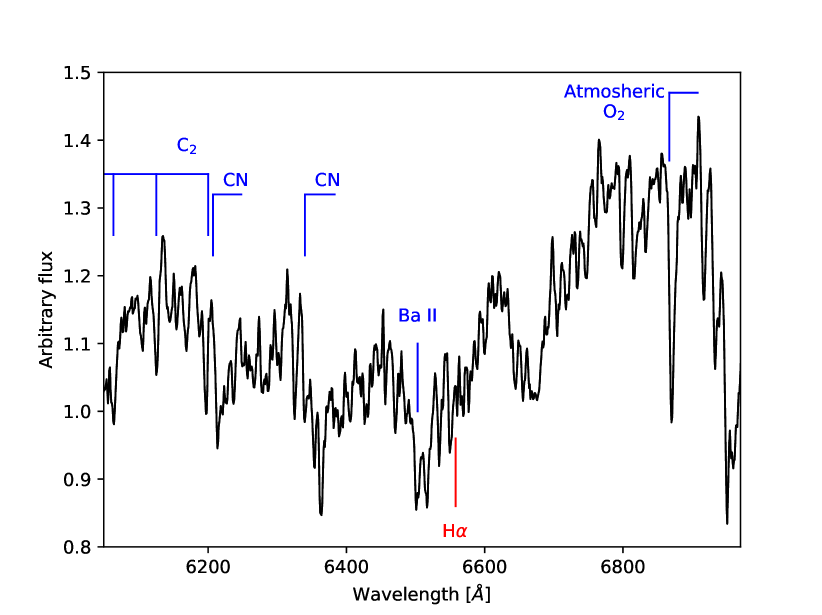
The spectrum of SOPS IV e-94 is dominated by strong C2 and CN molecular bands typical for a carbon star. At the same time, none of the features typical for a SySt are present. In particular, there is no trace of any emission lines, including the strongest H emission which is always visible in SySts. Given the X-ray luminosity of CXOHCD J132601.59–473305.8, which is comparable to known SySts (Henleywillis et al., 2018, and references therein), one should expect to detect at least the brightest H i Balmer emission lines. The lack of any emission lines in the spectrum of the carbon star indicates that there is no physical association between this star and CXOHCD J132601.59–473305.8, and the X-ray emission most probably originates from another object. Therefore, SOPS IV e-94 cannot be classified as a SySt.
3 Numerical Simulations
In what follows, we briefly describe the GC models and the mocca code (Hypki & Giersz, 2013; Giersz et al., 2013, and references therein) used to simulate them. More details about the modelling/models can be found in Belloni et al. (2019).
3.1 Globular Clusters
mocca includes the fewbody code (Fregeau et al., 2004) to perform numerical scattering experiments of small-number gravitational interactions and the bse code (Hurley et al., 2000, 2002), with the upgrades described in Belloni et al. (2018b) and Giacobbo et al. (2018), to deal with stellar and binary evolution. This version of the mocca code includes up-to-date prescriptions for metallicity-dependent stellar winds, which are based on Belczynski et al. (2010), but with the inclusion of the Eddington factor from Chen et al. (2015).
mocca assumes a point-mass Galactic potential with total mass equal to the enclosed Galaxy mass inside a circular orbit at the specified Galactocentric radius, and uses the description of escape processes in tidally limited clusters follows the procedure derived by Fukushige & Heggie (2000). We stress that mocca has been extensively tested against -body codes and reproduces -body results with good precision, including detailed distributions of mass and binding energy of binaries (e.g. Giersz et al., 2008; Giersz et al., 2013; Wang et al., 2016; Madrid et al., 2017). Most importantly, mocca is faster than -body codes, which allows us to simulate several hundreds of real GC models that permit more powerful statistical analyses for constraining the overall population of particular types of binaries in GCs.
In all models, we assume that all stars are on the zero-age main sequence when the simulation begins and that any residual gas from the star formation process has already been removed from the cluster. Additionally, all models have low metallicity (), are initially at virial equilibrium, and have neither rotation nor mass segregation. With respect to the density profile, all models follow a King (1966) model, and we adopted two values for the King parameter W0: 6 and 9. Regarding the tidal radius, we assumed two values, namely 60 and 120 pc. Finally, we have three different half-mass radii: 1.2, 2.4 and 4.8 pc.
The initial binary population adopted here for all models corresponds to models constructed based on the distributions derived by Kroupa (1995, 2008) and Kroupa et al. (2013), with the modifications described in Belloni et al. (2017c). We simulated models with three different numbers of objects (single stars binaries), namely k, k, and k, which have masses of approximately , and , respectively. All of them have very high initial binary fraction (nearly 100 per cent, e.g. Kroupa, 2008), which is needed to resolve the angular momentum problem in star formation and consistent with the fact that triples and higher order systems are rarely the outcome of star formation (e.g. Goodwin & Kroupa, 2005). In all models, we have used the Kroupa (2001) canonical initial mass function, with star masses in the range between and (Weidner et al., 2013).
For each initial cluster configuration, we simulated models with three values for the common-envelope efficiency, namely , and . In addition, we assumed that none of the recombination energy helps in the common-envelope ejection and that the binding energy parameter is automatically determined based on the giant properties (Claeys et al., 2014, appendix A). Even though we focus on SySts in which the WDs are formed without Roche-lobe overflow, several other types of binaries inside the cluster are affected by the choice of the CE efficiency. This choice thus influences the amount of particular types of GC binaries (see Belloni et al., 2019, for the case of cataclysmic variables). In this way, even though this has never been thoroughly checked, the choice of the CE efficiency may play a role in the global GC evolution.
For massive stars, we assumed the delayed core-collapse supernova model (Fryer et al., 2012). We also included pair-instability supernovae and pair-instability pulsation supernovae, as described in Spera & Mapelli (2017). Supernova natal kicks for neutron stars are distributed according to the Maxwellian distribution suggested by Hobbs et al. (2005). In the case of black holes, we have two options: either kicks are distributed according to Hobbs et al. (2005) and no fallback prescription is adopted; or kicks follow Hobbs et al. (2005) and are reduced according to mass fallback description given by Fryer et al. (2012), for the delayed core-collapse model. As part of the upgrades to the bse code, we included in our modelling the possibility of neutron star formation through electron-capture supernova (e.g. Kiel et al., 2008) and accretion induced collapse (e.g. Michel, 1987). In both cases, we assume no kick associated with the neutron star formation. All other binary evolution parameters are set as in Hurley et al. (2002).
Property Values Number of objects () 4, 7, 12 Mass ( M⊙) 4.72, 8.26, 14.2 King model parameter 6, 9 Tidal radius (pc) 60, 120 Half-mass radius (pc) 1.2, 2.4, 4.8 Fallback yes, no Common-envelope efficiency 0.25, 0.50, 1.00
All the parameters and initial GC conditions discussed above are summarized in Table 1. As shown by Belloni et al. (2019), by comparing the simulated and observed distributions of core to half-light radii, -band absolute magnitude, average surface brightness inside the half-light radius and central surface brightness, our models are very close to massive and intermediate-mass real GCs, and we only miss the low-mass GCs in our analysis. Additionally, our present-day GC models cover a reasonable range of concentrations, central surface brightness and half-mass relaxation times (see also Askar et al., 2017). Therefore, our models are consistent with a substantial fraction of the real GCs, and are in turn roughly representative of the Galactic GC population.
3.2 Symbiotic Stars
Our principal goal here is to investigate the properties of SySts formed through the wind-accretion channel in our simulations. For that end, we define SySts as WD + red giant binaries, in which the WDs are formed avoiding Roche-lobe overflow. In addition, those binaries are SySts only if their accretion-powered WD luminosities are at least 10 L⊙ (e.g. Mikołajewska & Kenyon, 1992; Lü et al., 2006). This is the luminosity resulting from the release of gravitational energy due to accretion and is given by
| (1) |
where is the WD mass, is the WD radius and is the accretion rate onto the WD. Given such high accretion luminosities, red giants in SySts are usually located towards the top of either the first giant branch or the asymptotic giant branch (e.g. Mikołajewska, 2007).
In the bse code, the accretion rate efficiency of mass loss through winds is estimated according to the Bondi & Hoyle (1944) mechanism, given by
| (2) |
where is the gravitational constant, and are the wind and orbital velocities, respectively, is the semi-major axis, is the eccentricity, and .
This prescription is known to underestimate the efficiency of wind mass transfer in binaries, especially in the case of red giants in the asymptotic giant branch, which have slow and dense winds. Thus, to properly identify the SySts in our simulations, we implemented into the bse code the wind Roche-lobe overflow mechanism, as described in Abate et al. (2013) and Iłkiewicz et al. (2019). Briefly, the enhanced accretion efficiency is given by Abate et al. (2013):
| (3) |
where , is the red giant mass, is the red giant Roche-lobe radius and is the dust condensation radius given by Höfner (2007):
| (4) |
where is the giant radius, is the giant effective temperature, is the dust condensation temperature, and is a parameter characterising wavelength dependence of the dust opacity.
The WD cannot accrete more mass than is lost by the red giant, which might happen for highly eccentric systems with Eq. 2. To avoid this, as in Hurley et al. (2002), we enforced that . In addition, as in Abate et al. (2013), we imposed that to be consistent with results from hydro-dynamical simulations. Moreover, we assumed dust consisting of amorphous carbon grains, which gives K and (Höfner, 2007). Finally, as in Iłkiewicz et al. (2019), in our simulations, having calculated both wind Roche-lobe overflow (Eq. 3) and Bondi-Hoyle (Eq. 2) accretion rate efficiencies, we took the higher to be the accretion rate efficiency.
We would like to stress that several potentially important parameters are kept constant, such as the metallicity, , the initial mass function, the initial binary population, amongst others, because simultaneously varying all possible parameters in GC modelling is not feasible. As such parameters could impact some of the results presented here, simulations in which the explored parameter space is extended will be useful to further test the results achieved in this work.
4 Symbiotic Star Properties
We start the presentation of our results by focusing on the initial and present-day properties of the simulated SySts in GCs and in isolated binary evolution, i.e. without dynamics. The initial time corresponds to the beginning of the simulation, i.e. roughly when the cluster is born, while the present-day time is assumed here to be Gyr, which is consistent with the measured ages of Galactic GCs (VandenBerg et al., 2013). In order to obtain the properties of SySts in a non-crowded environment, we selected all the initial binary populations (composed of zero-age main-sequence binaries), which follow the same distributions (Belloni et al., 2017c) in all models, and evolved them with the bse code till the present day.
4.1 Orbital Period
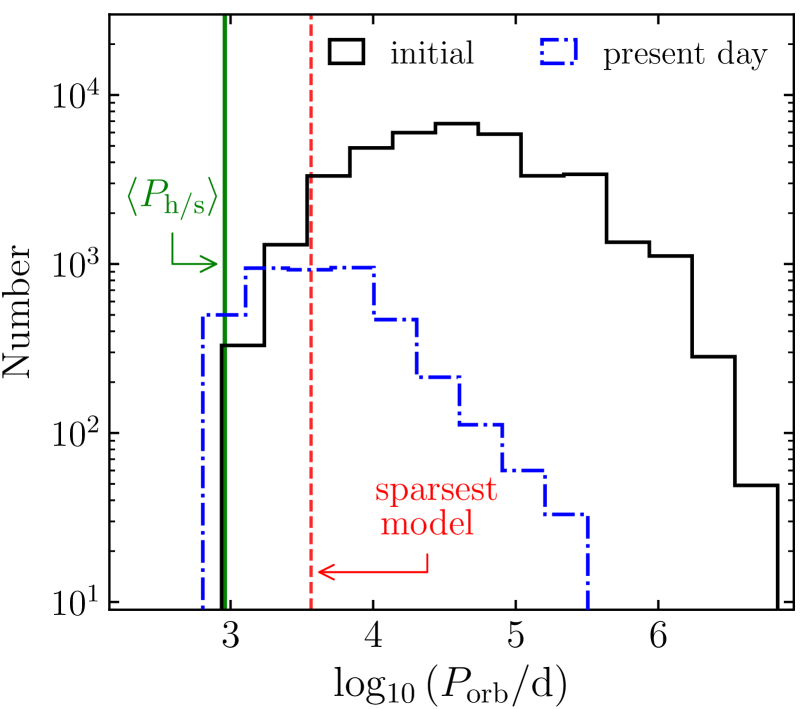
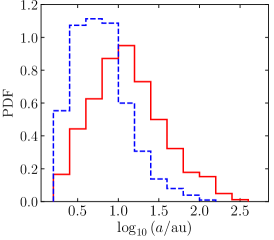
We show in Fig. 2 the initial orbital period distribution of SySt progenitors and the orbital period distribution of present-day GC SySts. The present-day orbital periods are those in which, during the SySt phase, the accretion-powered WD luminosity is highest. The orbital periods are sufficiently long to put SySts amongst the largest interacting binaries. Present-day orbital periods range from to d, while initial orbital periods of SySt progenitors extend up to . As one can see, our predicted orbital periods more likely resemble those of D-type SySts than S-type SySts. Moreover, while comparing both distributions in Fig. 2, we can see the role played by dynamics in shaping the parameter space of GC SySts and their progenitors. Due to dynamics, a lot of progenitors are disrupted, limiting the orbital periods from being very long.
In the same figure, we also show the average initial hard-soft boundary in our GC models ( d), and that of the sparsest model ( d). This boundary is set when the average binary binding energy equals to the average cluster kinetic energy. This separation is thus intrinsically related to the interplay between the binary binding energies with respect to host GC properties. Pragmatically, it corresponds to the orbital period separating hard and soft binaries (e.g. Heggie & Hut, 2003). Hard binaries are very strongly bound and are not expected to go through disruptive encounters. Soft binaries, on the other hand, are very weakly bound and tend to be destroyed in dynamical interactions. Some binaries have orbital periods comparable to the hard-soft boundary and can sometimes be destroyed or only significantly altered. Most binaries, on average, evolve according to the Heggie–Hills law: hard binaries get harder, while soft binaries get softer, after dynamical interactions (Heggie, 1975; Hills, 1975), which implies that soft binaries tend to be eventually disrupted.
The orbital period defining the hard-soft boundary, based on average properties, in a particular GC is given by
| (5) |
where is the average mass, given by , where is the number of objects (single binaries), is the total mass, and is the semi-major axis that defines the hard-soft boundary and is given by , where is the half-mass radius (Spitzer, 1987). We can safely apply Eq. 5 since SySts are not much more massive than an average star/binary in a cluster. More specifically, they are probably about two to three times more massive (red giants about times and WD about times). Thus, the time-scale for SySts being mass segregating is not extremely short. They need more than the half-mass relaxation time to sink to the centre from the GC halo (farther than the half-mass radius).
For clusters with similar , Eq. 5 says that the denser the cluster (i.e. the smaller the half-mass radius), the smaller the semi-major axis (or the shorter the orbital period) that defines the hard-soft boundary. Thus, at a particular density, the hard-soft boundary will penetrate the region occupied by SySt progenitors, as illustrated in Fig. 2. Therefore, beyond this density, more and more SySt progenitors are potentially destroyed, as the density increases. As mentioned before, the fate of SySt progenitors with orbital periods comparable to the orbital period defining the hard-soft boundary is not so easy to predict. Therefore, even though we expect many of them to be destroyed before the present-day, some might potentially survive the GC dynamical evolution. Indeed, those binaries with the shortest periods ( d) in the distribution might survive in less crowded regions inside the clusters, as the probability for interaction in such regions are much smaller than in the central parts. This is especially true for clusters with sufficiently long initial half-mass relaxation times, since in these clusters mass segregation is not very efficient.
4.2 Other Properties
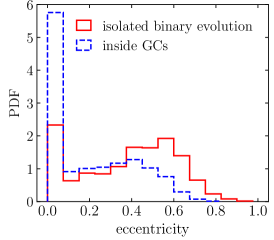
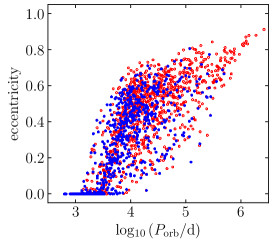
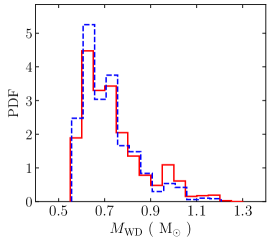
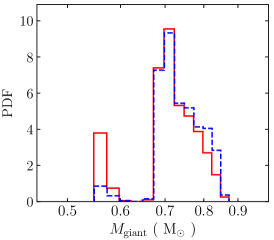
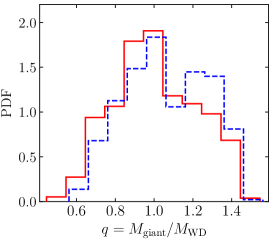
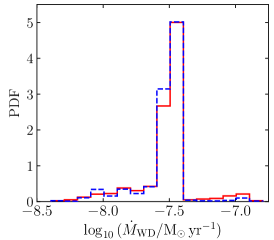
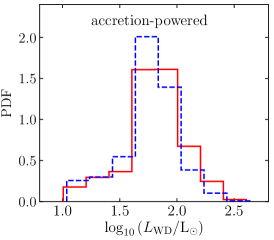
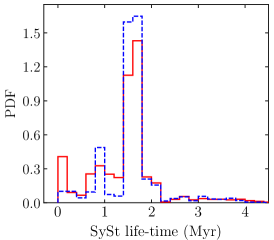
In Fig. 3 we show other present-day SySt properties (eccentricity, semi-major axis, WD and red giant masses, accretion rate and accretion-powered WD luminosity) and compare the distributions obtained in isolated binary evolution (i.e. without dynamics) and inside our GC models. As some of these properties might change during the SySt life-time, we show the properties at the moment the accretion-powered WD luminosity is maximum.
With respect to the main orbital elements, we can clearly see that differences with respect to SySts formed in isolation and those in GCs. In particular, GCs host relatively more systems with circular orbits and smaller semi-major axis. This is another illustration of the above-mentioned role played by dynamics in shaping the SySt properties. Additionally, we can see that the eccentricity distribution is roughly bimodal, in which we see the binaries that managed to circularize and the wider binaries that peak near . Moreover, most SySts have semi-major axis ranging from a few au up to au.
Concerning the component masses, not surprisingly, all WDs are carbon-oxygen, as they are formed similarly to single stars, i.e. without Roche-lobe overfilling. Additionally, most of them have masses between and M⊙, but a few are more massive than the Sun. The red giant masses are mostly concentrated between and M⊙, which is directly connected with the main-sequence turn-off for the metallicity and present-day time assumed here. However, some have masses smaller than M⊙, which is due to the strong mass loss through winds before reaching the SySt phase of maximum accretion-powered WD luminosity. Regarding the evolutionary status of the red giant donor, we found that most ( per cent) belong to the first giant branch, while the remaining are mostly thermally-pulsing asymptotic giant branch stars.
The accretion rates onto the WD range from to M⊙ yr-1, but most concentrate around M⊙ yr-1. Such rates are high enough so that thermonuclear burning of the accreted material on the WD surface occurs, either steadily or unstably. According to the Nomoto et al. (2007) criterion, per cent of the systems reached the phase of stable hydrogen burning, while the remaining are likely symbiotic (recurrent) novae. Concerning the accretion-powered WD luminosity, the distribution is much broader than the accretion rate one, but limited to values between and L⊙. The lower limit comes from our definition of SySt and the upper limit is a direct consequence of the accretion rates coupled with the WD properties. We would like to stress that such WD luminosities are basically lower limits, as we do not include in our modelling computations of nuclear-powered luminosities, i.e. luminosities powered by thermonuclear hydrogen burning, which provides WD luminosities greater than L⊙(e.g. Nomoto et al., 2007). Indeed, most known SySts have WD luminosities L⊙, which cannot be explained solely by accretion (Mikolajewska, 2010).
The last property we discuss is the SySt life-times. Most systems spend Myr in the SySt phase. These SySt life-times are likely due to their age (they are Gyr old), coupled with their red giant masses (they are close to the turn-off mass, which is M⊙) and the low mass loss rate (due to the low metallicity). The red giant phase in these systems is much longer, but only in a fraction of the red giant life the accretion-powered WD luminosity is L⊙, which is our condition for the occurrence of the symbiotic phenomenon.
While taking into account all properties together, we can see that properties of GC SySts and of those formed in isolation are rather similar, with the exception of the orbital period, semi-major axis, and eccentricity. In the parameter space comprised by these properties, the region from which GC SySts come is considerably smaller than that from which isolated SySts come. This is due to role played by dynamics in destroying SySt progenitors and reducing in turn the region in the parameter space. Interestingly, this is quite the opposite of what happens with cataclysmic variables in GCs, in which dynamics extend the region in the initial parameter space from where they come (e.g. Belloni et al., 2016, 2017a, 2017b, 2019).
5 Why not a single symbiotic star has ever been confirmed?
We have just seen that SySt formed through the wind-accretion channel have very long orbital periods ( d) and most have initial orbital periods longer than those defining the initial hard-soft boundaries in our models (see Fig. 2). Therefore, we do expect that most SySt would be destroyed during the GC evolution. However, binaries with such long orbital periods could in principle still survive in less dense GCs, especially if they are beyond the half-mass radius, residing in the GC outskirts. In this way, we shall investigate the physical reasons for the observational lack of SySts in real GCs.
5.1 Dynamical Destruction
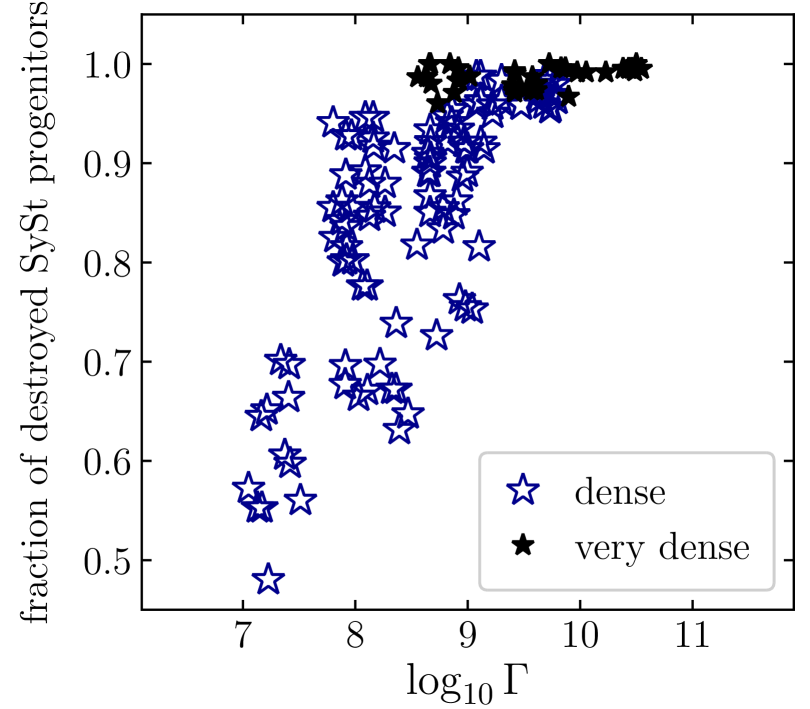
In Fig. 4, we show the fraction of destroyed SySt progenitors as a function of the initial GC stellar encounter rate, given by (Pooley & Hut, 2006), where , , and are the central density, the core radius, and the mass-weighted central velocity dispersion, respectively. We note that is a somewhat better indicator of the strength of dynamics one would expect during the GC evolution than individual quantities, e.g. the initial central density, initial concentration, etc. In the figure, we separate the clusters according to their concentration. Very dense models roughly follow the Marks & Kroupa (2012) radius–mass relation, i.e. models with initial half-mass radii of pc, which are likely more realistic models. This is because this relation is in good agreement with the observed density of molecular cloud clumps, star-forming regions and globular clusters, and provides dynamical evolutionary time-scales for embedded clusters consistent with the life-time of ultra-compact H ii regions and the time-scale needed for gas expulsion to be active in observed very young clusters, as based on their dynamical modelling (e.g. Belloni et al., 2018a, and references therein). Dense models comprise the remaining clusters, which are still dense, but somewhat less dense.
From Fig. 4, we can see that there is a clear correlation between and the fraction of destroyed SySt progenitors, which is similar to what has been found for their relatives cataclysmic variables (Belloni et al., 2019). We carried out Spearman’s rank correlation tests, and found a strong correlation for the dense models () with more than per cent confidence. However, for the very dense models, the test suggests no correlation, as these models have naturally high and very high destruction rates. The fractions of SySt progenitors that are destroyed in dense clusters are huge ( per cent, on average), which clearly suggests that the mass density of SySts are much lower (if not negligible) in GCs than in non-crowded environments. For those very dense, which are supposedly more realistic GC models, the fraction of destroyed SySts increases to impressive per cent.
Therefore, should GCs be born as dense as proposed by Marks & Kroupa (2012), our results provide a natural explanation for the lack of SySts in GCs, which is due to dynamics playing an extremely important role in destroying their progenitors. However, if GCs are not that dense initially, then dynamical destruction of SySts alone would not explain their absence in GCs. If so, we could still expect non-negligible numbers of SySts in GCs and there should be additional reasons for the fact that not a single one has been discovered so far.
5.2 Spatial Distribution
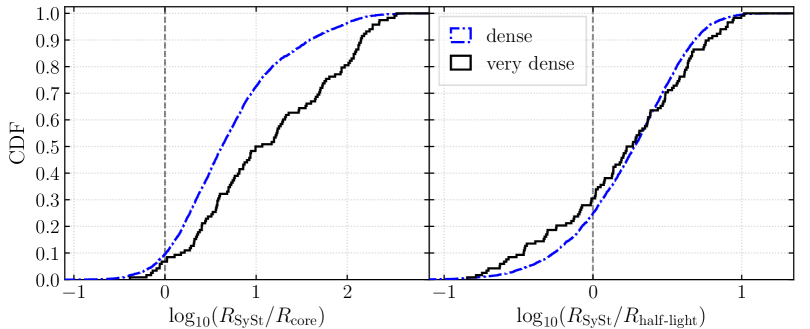
In Fig. 5, we depict the cumulative radial distribution function for present-day SySts in all our models, with respect to the cluster core radii (left-hand panel) and half-light radii (right-hand panel). As before, models are separated according to the initial concentration, very dense models being those closer to the Marks & Kroupa (2012) radius–mass relation. From the SySt spatial distribution, we can clearly see that the overwhelming majority of systems are far from the central parts. Additionally, given their long initial orbital periods, it is not surprising that they only managed to survive in (very) dense GC environments because of that.
Considering all models, we found that most ( per cent) are beyond the half-light radii and nearly all ( per cent) are beyond the core radii. Those models in which SySts survive inside (or nearly) the GC cores are characterized by large cores ( pc), which provides that, albeit rare, the core relaxation time might be still sufficiently long, preventing in turn very frequent and strong dynamical disruptive interactions. Indeed, long relaxation time means small density and, then, low number of dynamical interactions.
In the left-hand panel of Fig. 5, we can see that SySts are more centrally concentrated in the dense clusters than in the very dense ones. This is because SySts and their progenitors are more massive than the average stars inside the GCs. Thus, due to mass segregation, they sink, on a time-scale proportional (shorter by the ratio between the average mass and the SySt mass) to the half-mass relaxation time, towards the central parts. Moreover, in these less dense clusters, the probability for dynamical interaction, and in turn for binary (SySt progenitors) dynamical disruption, is smaller than in the very dense models. This provides better chances for the SySts to survive the mass segregation process and disruptive dynamical interactions. Indeed, for the very dense models, the mass segregation time-scale is shorter than for the dense models. So, SySt progenitors sink faster and are quicker destroyed in the very dense models. In the right-hand panel of Fig. 5, the relation between the distributions of dense and very dense models seem to be different than that in the left-hand panel. This apparent difference is caused by the non-linear interplay between core and half-mass radii amongst different cluster models.
Most importantly regarding observations, since most systems are found beyond the half-light radii, the spatial distribution of SySts in GCs implies that one would need at least extended observations so that the SySt population could be recovered. In particular, a good coverage of the GC outskirts seems to be crucial to have any real chances to identify them.
5.3 Expected Number
We have shown previously that dynamics play a significantly important role in destroying SySt progenitors, especially in very dense clusters. Despite that, we also showed that some SySts are still expected to exist in GCs at the present day, which are not destroyed because the less crowded region to which they belong. This is intrinsically connected with the half-mass relaxation time, which should be long enough so that SySts from the cluster halo will not have time to mass segregate and be destroyed in dynamical interactions. Provided these two facts, one might still wonder why we fail to observationally detect these systems. We provide in what follows additional arguments for that, which are based on the expected number of SySts in GCs.
We have considered that the present day is somewhere between and Gyr, which corresponds to the expected cluster ages in the Galactic GC population. Within these time interval, we found that the SySt formation rate is roughly uniform when taking into account all our 144 GC models. This provides, on average, a SySt formation rate given by SySt per Myr in the whole sample of GC models. Given such a uniform formation rate and the total number of GC models, we have, on average, a birth rate of SySt per Myr per GC. If we optimistically assume that the SySt life-time is one Myr, then we would expect to be able to observe this amount of SySt in a GC within an Myr. This then provides that we would expect a probability of detection, in observations taken in the past yr, to be times the formation rate in Myr-1, which gives .
We would like to stress that this estimate is based on ideal situations in which we would be able to detect the SySt with per cent confidence, which in reality is not the case. In addition, the SySt life-time could be shorter than an Myr in a significant fraction (or even most systems) of the population. Thus, this probability of should be interpreted as an upper limit, and a more realistic detection probability would be smaller than this. Therefore, albeit not impossible, it is rather unlikely that we would be able to detect any SySt in the Galactic GC population, provided the low occurrence of SySts in these stellar systems.
6 Best cluster targets for future observations
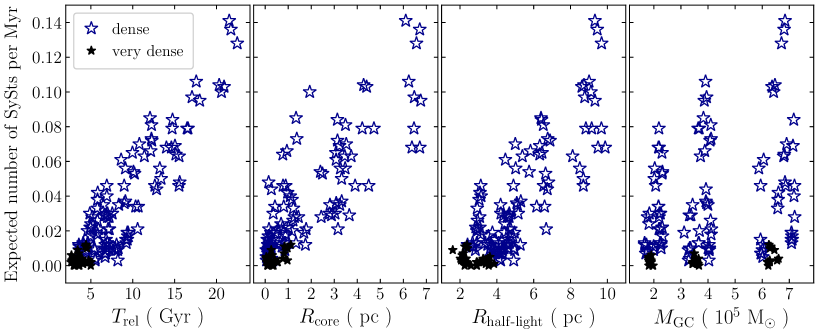
In Fig. 6, we present the expected number of SySts within an Myr against a few present-day GC properties, namely half-mass relaxation time (first panel), core radius (second panel), half-light radius (third panel), and total mass (fourth panel). As before, we separate the models according to its initial concentration, very dense being those closer to the Marks & Kroupa (2012) radius–mass relation. We can see a clear correlation between the expected number of SySts and the half-mass relaxation time, core and half-light radii. Indeed, we carried out Spearman’s rank correlation tests and found a strong correlation with more than per cent confidence, in all cases, being the rank values given by , , and , respectively. On the other hand, there is apparently no (or very weak, if at all) correlation between the expected number of SySts and the total GC mass, which is confirmed by the correlation test that provides a rank value of with at least per cent confidence. This suggests that the best GC targets are those relatively extended clusters with relatively long half-mass relaxation times.
Regarding correlations amongst GC properties, there is a clear correlation between their Galactocentric distances and their half-light radii (van den Bergh et al., 1991; Baumgardt & Hilker, 2018), which is likely due to the strong tidal fields in the inner parts of the Milky Way. Moreover, there is a clear observational correlation between the half-mass relaxation times and the half-mass radius (Baumgardt & Hilker, 2018), which is not surprising since the half-mass relaxation time is proportional to . These correlations indicate that the best GC targets should also be relatively far from the Milky Way centre and corroborate our finds discussed previously.
At this point, we are able to answer the question regarding the properties best GCs should have to be considered ideal targets to search for SySts. One should search for SySts in the outskirts of nearby low-density clusters (given their large radii, angular size, and brightness) whose half-mass relaxation times are considerably long and their locations are not so close to the Galactic Centre.
Within the catalogue by Baumgardt & Hilker (2018), nearby low-density clusters with relatively long half-mass relaxation times and relatively large Galactocentric distances are, e.g.: NGC 288, NGC 4372, NGC 4590, NGC 4833, NGC 5897, NGC 6362, NGC 6809, and Pal 11. All these clusters have half-mass relaxation times Gyr, central densities M⊙ pc-3, distances kpc, projected half-light radii pc, and Galactocentric distances kpc.
The clusters investigated in the MUSE survey are in general relatively dense, many being core-collapsed, and only the central parts have been covered (i.e. up to the half-light radii), which are usually preferred because there is less confusion regarding the GC membership. Only one cluster similar to those listed above was investigated with MUSE, namely NGC 3201 (Kamann et al., 2018; Giesers et al., 2018, 2019; Göttgens et al., 2019b). However, the pointings for this cluster covered basically the central parts, well inside the half-light radius. Despite these authors investigated binaries in detail, by providing the orbital period and eccentricity distributions (mainly for main-sequence binaries) for the first time in a GC, they could not find any cataclysmic variable nor SySt. Perhaps, if there were pointings in regions farther from the central parts, some interesting accreting WD binaries could be recovered, including the long-period ones, such as SySts.
Another interesting cluster investigated with MUSE is NGC 6656, which possibly harbours a nova remnant that could have originated in a symbiotic nova, instead of a classical nova (Göttgens et al., 2019a). This nova remnant lies within the core radius, which provides a rather low probability for long-period systems such as SySts to survive. From our results, per cent of the predicted SySts are inside the core radii of our models. So, albeit unlikely to find them there, it is not impossible. Additionally, NGC 6656 has one of the largest cores in the Galactic GC population (Harris, 1996, 2010 edition), so it is rather consistent with our results that such a type of GC might harbour an SySt within its core. Therefore, it is definitely worthwhile to put more observational efforts on this source to disentangle the possibility that it could be a symbiotic nova remnant.
Finally, we mention Cen and 47 Tuc as promising clusters to harbour SySts. Cen is an extended low-density cluster, characterized by a long half-mass relaxation time and large half-light and core radii. 47 Tuc, on the other hand, is one of the Galactic GCs with the largest stellar interaction rates (Bahramian et al., 2013; Cheng et al., 2018), due to its small and very dynamically active core. This likely explains the lack of SySt candidate detections in the central parts of this cluster, where most of the searches for interacting binaries have been performed so far (e.g. Edmonds et al., 2003a, b; Knigge et al., 2008; Rivera Sandoval et al., 2018; Campos et al., 2018). However, 47 Tuc is a non-core-collapsed cluster and, given its relatively long half-mass relaxation time and size, this cluster as a whole cannot be considered dynamically old. For this reason, it is a good candidate to look for SySts in its outer parts.
7 Summary and Conclusions
We refined here the nature of SOPS IV e-94, the promising SySt candidate in Cen, by obtaining a deep SALT optical spectrum and concluded that this object cannot be classified as an SySt. This is because none of the features typical for an SySt are present in the spectrum of SOPS IV e-94, e.g. there is no trace of any emission lines, including the strongest H emission that is always visible in SySts.
We investigated SySts formed through the wind-accretion channel in 144 globular cluster models evolved with the mocca code with the aim of explaining why not a single one has ever been identified in a Galactic globular cluster.
We found that most progenitors of these systems are destroyed in dense globular clusters before effectively becoming SySts at the present day. This happens because the progenitors of these systems have initially orbital periods ( d) that are comparable to (or even much longer than) the orbital period separating soft from hard binaries in the clusters. This puts them into the group of soft binaries and makes their destruction through dynamical interactions sufficiently easy over the cluster evolution time-scale ( Gyr).
However, in less dense clusters, SySts should still be present. Most of these SySts ( per cent) are located far from the cluster central parts and beyond the cluster half-light radii (i.e. less dense regions), which is the main reason why they managed to survive in the clusters. This also makes their detection difficult, provided the large areas of the globular cluster outskirts. Additionally, given the typical life-times of SySts ( Myr), their expected numbers are extremely low ( per globular cluster per Myr).
Our results provide therefore an explanation for the observed absence of SySts in Galactic globular clusters, which occurs due to a combination of three important effects: (i) most are destroyed in dynamical interactions, and most that survived (ii) are far from the central parts and (iii) are sufficiently rare, which makes their discovery in current dedicated observational surveys rather difficult.
Coupling the properties of SySts and globular clusters, we found that the best chances to identify them are in the outskirts of nearby low-density clusters with relatively long half-mass relaxation times and relatively large Galactocentric distances, by means of either high-quality spectroscopy or photometry using narrow-band filters centred on either the He ii and H or the Raman-scattered O vi emission lines.
Since the majority of known SySts are formed through the Roche-lobe overflow channel (not addressed here), it remains to be shown that the absence of whole population of SySts in globular clusters might be explained in a similar fashion to what we presented here. In follow-up works, we intend to investigate these systems not only in Galactic globular clusters but also in non-crowded fields of our Galaxy and of other galaxies.
Acknowledgements
We would like to thank Michael M. Shara for his feedback on this paper. We also thank an anonymous referee for the comments and suggestions that helped to improve this manuscript. We thank MCTIC/FINEP (CT-INFRA grant 0112052700) and the Embrace Space Weather Program for the computing facilities at the National Institute for Space Research, Brazil. This paper is based on spectroscopic observations made with the Southern African Large Telescope (SALT) under programme 2019-2-SCI-021 (PI: K. Iłlkiewicz). Polish participation in SALT is funded by grant No. MNiSW DIR/WK/2016/07. DB was supported by the grants #2017/14289-3 and #2018/23562-8, São Paulo Research Foundation (FAPESP). This research has been partly funded by the National Science Centre, Poland, through grant OPUS 2017/27/B/ST9/01940 to JM. MRS acknowledges financial support from FONDECYT grant number 1181404. MG and DB was partially supported by the Polish National Science Center (NCN) through the grant UMO-2016/23/B/ST9/02732. LERS thanks NASA for support under grant 80NSSC17K0334. CVR would like to thank funding support from Fundação de Amparo à Pesquisa do Estado de São Paulo (FAPESP, Proc. 2013/26258-4) and CNPq (Proc. 303444/2018-5).
Data availability
The data underlying this article can be obtained upon request to Mirek Giersz (mig@camk.edu.pl) and after agreeing to the terms of the mocca License. The license can be found in https://moccacode.net/license/.
References
- Abate et al. (2013) Abate C., Pols O. R., Izzard R. G., Mohamed S. S., de Mink S. E., 2013, A&A, 552, A26
- Angeloni et al. (2019) Angeloni R., et al., 2019, AJ, 157, 156
- Askar et al. (2017) Askar A., Szkudlarek M., Gondek-Rosińska D., Giersz M., Bulik T., 2017, MNRAS, 464, L36
- Bahramian et al. (2013) Bahramian A., Heinke C. O., Sivakoff G. R., Gladstone J. C., 2013, ApJ, 766, 136
- Baumgardt & Hilker (2018) Baumgardt H., Hilker M., 2018, MNRAS, 478, 1520
- Belczyński et al. (2000) Belczyński K., Mikołajewska J., Munari U., Ivison R. J., Friedjung M., 2000, A&AS, 146, 407
- Belczynski et al. (2010) Belczynski K., Bulik T., Fryer C. L., Ruiter A., Valsecchi F., Vink J. S., Hurley J. R., 2010, ApJ, 714, 1217
- Bellini et al. (2009) Bellini A., et al., 2009, A&A, 493, 959
- Belloni et al. (2016) Belloni D., Giersz M., Askar A., Leigh N., Hypki A., 2016, MNRAS, 462, 2950
- Belloni et al. (2017a) Belloni D., Giersz M., Rocha-Pinto H. J., Leigh N. W. C., Askar A., 2017a, MNRAS, 464, 4077
- Belloni et al. (2017b) Belloni D., Zorotovic M., Schreiber M. R., Leigh N. W. C., Giersz M., Askar A., 2017b, MNRAS, 468, 2429
- Belloni et al. (2017c) Belloni D., Askar A., Giersz M., Kroupa P., Rocha-Pinto H. J., 2017c, MNRAS, 471, 2812
- Belloni et al. (2018a) Belloni D., Kroupa P., Rocha-Pinto H. J., Giersz M., 2018a, MNRAS, 474, 3740
- Belloni et al. (2018b) Belloni D., Schreiber M. R., Zorotovic M., Iłkiewicz K., Hurley J. R., Giersz M., Lagos F., 2018b, MNRAS, 478, 5639
- Belloni et al. (2019) Belloni D., Giersz M., Rivera Sandoval L. E., Askar A., Ciecielag P., 2019, MNRAS, 483, 315
- Benacquista & Downing (2013) Benacquista M. J., Downing J. M. B., 2013, Living Reviews in Relativity, 16, 4
- Bondi & Hoyle (1944) Bondi H., Hoyle F., 1944, MNRAS, 104, 273
- Buckley et al. (2006) Buckley D. A. H., Burgh E. B., Cottrell P. L., Nordsieck K. H., O’Donoghue D., Williams T. B., 2006, in McLean I. S., Iye M., eds, Vol. 6269, Ground-based and Airborne Instrumentation for Astronomy. SPIE, pp 84 – 98, doi:10.1117/12.673838
- Burgh et al. (2003) Burgh E. B., Nordsieck K. H., Kobulnicky H. A., Williams T. B., O’Donoghue D., Smith M. P., Percival J. W., 2003, in Iye M., Moorwood A. F. M., eds, Vol. 4841, Instrument Design and Performance for Optical/Infrared Ground-based Telescopes. SPIE, pp 1463 – 1471, doi:10.1117/12.460312
- Campos et al. (2018) Campos F., et al., 2018, MNRAS, 481, 4397
- Chen et al. (2010) Chen X., Podsiadlowski P., Mikolajewska J., Han Z., 2010, in Kalogera V., van der Sluys M., eds, American Institute of Physics Conference Series Vol. 1314, American Institute of Physics Conference Series. pp 59–60, doi:10.1063/1.3536413
- Chen et al. (2015) Chen Y., Bressan A., Girardi L., Marigo P., Kong X., Lanza A., 2015, MNRAS, 452, 1068
- Cheng et al. (2018) Cheng Z., Li Z., Xu X., Li X., 2018, ApJ, 858, 33
- Claeys et al. (2014) Claeys J. S. W., Pols O. R., Izzard R. G., Vink J., Verbunt F. W. M., 2014, A&A, 563, A83
- Di Stefano (2010) Di Stefano R., 2010, ApJ, 719, 474
- Edmonds et al. (2003a) Edmonds P. D., Gilliland R. L., Heinke C. O., Grindlay J. E., 2003a, ApJ, 596, 1177
- Edmonds et al. (2003b) Edmonds P. D., Gilliland R. L., Heinke C. O., Grindlay J. E., 2003b, ApJ, 596, 1197
- Fregeau et al. (2004) Fregeau J. M., Cheung P., Portegies Zwart S. F., Rasio F. A., 2004, MNRAS, 352, 1
- Fryer et al. (2012) Fryer C. L., Belczynski K., Wiktorowicz G., Dominik M., Kalogera V., Holz D. E., 2012, ApJ, 749, 91
- Fukushige & Heggie (2000) Fukushige T., Heggie D. C., 2000, MNRAS, 318, 753
- Giacobbo et al. (2018) Giacobbo N., Mapelli M., Spera M., 2018, MNRAS, 474, 2959
- Giersz et al. (2008) Giersz M., Heggie D. C., Hurley J. R., 2008, MNRAS, 388, 429
- Giersz et al. (2013) Giersz M., Heggie D. C., Hurley J. R., Hypki A., 2013, MNRAS, 431, 2184
- Giesers et al. (2018) Giesers B., et al., 2018, MNRAS, 475, L15
- Giesers et al. (2019) Giesers B., et al., 2019, A&A, 632, A3
- Gonçalves et al. (2015) Gonçalves D. R., Magrini L., de la Rosa I. G., Akras S., 2015, MNRAS, 447, 993
- Goodwin & Kroupa (2005) Goodwin S. P., Kroupa P., 2005, A&A, 439, 565
- Göttgens et al. (2019a) Göttgens F., et al., 2019a, A&A, 626, A69
- Göttgens et al. (2019b) Göttgens F., et al., 2019b, A&A, 631, A118
- Gromadzki & Mikołajewska (2009) Gromadzki M., Mikołajewska J., 2009, A&A, 495, 931
- Gromadzki et al. (2009) Gromadzki M., Mikołajewska J., Whitelock P., Marang F., 2009, Acta Astron., 59, 169
- Gromadzki et al. (2013) Gromadzki M., Mikołajewska J., Soszyński I., 2013, Acta Astron., 63, 405
- Harding (1962) Harding G. A., 1962, The Observatory, 82, 205
- Harris (1996) Harris W. E., 1996, AJ, 112, 1487
- Heggie (1975) Heggie D. C., 1975, MNRAS, 173, 729
- Heggie & Hut (2003) Heggie D., Hut P., 2003, The gravitational million-body problem: a multidisciplinary approach to star cluster dynamics. Cambridge University Press, Cambridge, UK
- Henleywillis et al. (2018) Henleywillis S., Cool A. M., Haggard D., Heinke C., Callanan P., Zhao Y., 2018, MNRAS, 479, 2834
- Hills (1975) Hills J. G., 1975, AJ, 80, 809
- Hobbs et al. (2005) Hobbs G., Lorimer D. R., Lyne A. G., Kramer M., 2005, MNRAS, 360, 974
- Höfner (2007) Höfner S., 2007, in Kerschbaum F., Charbonnel C., Wing R. F., eds, Astronomical Society of the Pacific Conference Series Vol. 378, Why Galaxies Care About AGB Stars: Their Importance as Actors and Probes. p. 145 (arXiv:astro-ph/0702444)
- Hurley et al. (2000) Hurley J. R., Pols O. R., Tout C. A., 2000, MNRAS, 315, 543
- Hurley et al. (2002) Hurley J. R., Tout C. A., Pols O. R., 2002, MNRAS, 329, 897
- Hypki & Giersz (2013) Hypki A., Giersz M., 2013, MNRAS, 429, 1221
- Ilkiewicz et al. (2018) Ilkiewicz K., Mikolajewska J., Shara M. M., Udalski A., Drozd K., Faherty J. K., 2018, arXiv e-prints, p. arXiv:1811.06696
- Iłkiewicz et al. (2019) Iłkiewicz K., Mikołajewska J., Belczyński K., Wiktorowicz G., Karczmarek P., 2019, MNRAS, 485, 5468
- Kamann et al. (2018) Kamann S., et al., 2018, MNRAS, 473, 5591
- Kenyon (1986) Kenyon S. J., 1986, The symbiotic stars. Cambridge University Press, Cambridge, UK
- Kiel et al. (2008) Kiel P. D., Hurley J. R., Bailes M., Murray J. R., 2008, MNRAS, 388, 393
- King (1966) King I. R., 1966, AJ, 71, 64
- Kniazev et al. (2009) Kniazev A. Y., et al., 2009, MNRAS, 395, 1121
- Knigge et al. (2008) Knigge C., Dieball A., Maíz Apellániz J., Long K. S., Zurek D. R., Shara M. M., 2008, ApJ, 683, 1006
- Kobulnicky et al. (2003) Kobulnicky H. A., Nordsieck K. H., Burgh E. B., Smith M. P., Percival J. W., Williams T. B., O’Donoghue D., 2003, in Iye M., Moorwood A. F. M., eds, Vol. 4841, Instrument Design and Performance for Optical/Infrared Ground-based Telescopes. SPIE, pp 1634 – 1644, doi:10.1117/12.460315
- Kroupa (1995) Kroupa P., 1995, MNRAS, 277, 1507
- Kroupa (2001) Kroupa P., 2001, MNRAS, 322, 231
- Kroupa (2008) Kroupa P., 2008, in Aarseth S. J., Tout C. A., Mardling R. A., eds, Lecture Notes in Physics, Berlin Springer Verlag Vol. 760, The Cambridge N-Body Lectures. p. 181, doi:10.1007/978-1-4020-8431-7˙8
- Kroupa et al. (2013) Kroupa P., Weidner C., Pflamm-Altenburg J., Thies I., Dabringhausen J., Marks M., Maschberger T., 2013, in Oswalt T. D., Gilmore G. , eds, Planets, Stars and Stellar Systems, Vol. 5. Springer, Berlin, p. 115, doi:10.1007/978-94-007-5612-0˙4
- Lü et al. (2006) Lü G., Yungelson L., Han Z., 2006, MNRAS, 372, 1389
- Madrid et al. (2017) Madrid J. P., Leigh N. W. C., Hurley J. R., Giersz M., 2017, MNRAS, 470, 1729
- Marks & Kroupa (2012) Marks M., Kroupa P., 2012, A&A, 543, A8
- Merc et al. (2019) Merc J., Gális R., Wolf M., 2019, Research Notes of the American Astronomical Society, 3, 28
- Michel (1987) Michel F. C., 1987, Nature, 329, 310
- Mikołajewska (2003) Mikołajewska J., 2003, ASP Conf. Ser., 303, 9
- Mikołajewska (2007) Mikołajewska J., 2007, Baltic Astronomy, 16, 1
- Mikolajewska (2010) Mikolajewska J., 2010, arXiv e-prints, p. arXiv:1011.5657
- Mikołajewska (2012) Mikołajewska J., 2012, Baltic Astronomy, 21, 5
- Mikołajewska (2013) Mikołajewska J., 2013, in Di Stefano R., Orio M., Moe M., eds, IAU Symposium Vol. 281, Binary Paths to Type Ia Supernovae Explosions. Cambridge University Press, pp 162–165, doi:10.1017/S1743921312014925
- Mikołajewska & Kenyon (1992) Mikołajewska J., Kenyon S. J., 1992, MNRAS, 256, 177
- Mikołajewska et al. (2014) Mikołajewska J., Caldwell N., Shara M. M., 2014, MNRAS, 444, 586
- Mikołajewska et al. (2017) Mikołajewska J., Shara M. M., Caldwell N., Iłkiewicz K., Zurek D., 2017, MNRAS, 465, 1699
- Miszalski & Mikołajewska (2014) Miszalski B., Mikołajewska J., 2014, MNRAS, 440, 1410
- Miszalski et al. (2013) Miszalski B., Mikołajewska J., Udalski A., 2013, MNRAS, 432, 3186
- Nie et al. (2012) Nie J. D., Wood P. R., Nicholls C. P., 2012, MNRAS, 423, 2764
- Nomoto et al. (2007) Nomoto K., Saio H., Kato M., Hachisu I., 2007, ApJ, 663, 1269
- O’Donoghue et al. (2006) O’Donoghue D., et al., 2006, MNRAS, 372, 151
- Oomen et al. (2018) Oomen G.-M., Van Winckel H., Pols O., Nelemans G., Escorza A., Manick R., Kamath D., Waelkens C., 2018, A&A, 620, A85
- Peterson (1977) Peterson A. W., 1977, PASP, 89, 129
- Podsiadlowski & Mohamed (2007) Podsiadlowski P., Mohamed S., 2007, Baltic Astronomy, 16, 26
- Pooley & Hut (2006) Pooley D., Hut P., 2006, ApJ, 646, L143
- Rivera Sandoval et al. (2018) Rivera Sandoval L. E., et al., 2018, MNRAS, 475, 4841
- Rodríguez-Flores et al. (2014) Rodríguez-Flores E. R., Corradi R. L. M., Mampaso A., García-Alvarez D., Munari U., Greimel R., Rubio-Díez M. M., Santand er-García M., 2014, A&A, 567, A49
- Spera & Mapelli (2017) Spera M., Mapelli M., 2017, MNRAS, 470, 4739
- Spitzer (1987) Spitzer L., 1987, Dynamical evolution of globular clusters. Princeton University Press, Princeton, NJ
- Torres-Peimbert et al. (1980) Torres-Peimbert S., Recillas-Cruz E., Peimbert M., 1980, Rev. Mex. Astron. Astrofis., 5, 51
- VandenBerg et al. (2013) VandenBerg D. A., Brogaard K., Leaman R., Casagrand e L., 2013, ApJ, 775, 134
- Wang et al. (2016) Wang L., et al., 2016, MNRAS, 458, 1450
- Webbink (1988) Webbink R. F., 1988, in Mikolajewska J., Friedjung M., Kenyon S. J., Viotti R., eds, Astrophysics and Space Science Library Vol. 145, IAU Colloq. 103: The Symbiotic Phenomenon, Springer, Dordrecht. p. 311, doi:10.1007/978-94-009-2969-2˙69
- Weidner et al. (2013) Weidner C., Kroupa P., Pflamm-Altenburg J., Vazdekis A., 2013, Monthly Notices of the Royal Astronomical Society, 436, 3309
- Whitelock (1987) Whitelock P. A., 1987, PASP, 99, 573
- Zurek et al. (2016) Zurek D. R., Knigge C., Maccarone T. J., Pooley D., Dieball A., Long K. S., Shara M., Sarajedini A., 2016, MNRAS, 460, 3660
- van Loon et al. (2007) van Loon J. T., van Leeuwen F., Smalley B., Smith A. W., Lyons N. A., McDonald I., Boyer M. L., 2007, MNRAS, 382, 1353
- van Winckel et al. (2009) van Winckel H., et al., 2009, A&A, 505, 1221
- van den Bergh et al. (1991) van den Bergh S., Morbey C., Pazder J., 1991, ApJ, 375, 594