Efficient ground-state cooling of large trapped-ion chains with an EIT tripod scheme
Abstract
We report the electromagnetically-induced-transparency (EIT) cooling of a large trapped 171Yb+ ion chain to the quantum ground state. Unlike conventional EIT cooling, we engage a four-level tripod structure and achieve fast sub-Doppler cooling over all motional modes. We observe simultaneous ground-state cooling across the complete transverse mode spectrum of up to ions, occupying a bandwidth of over MHz. The cooling time is observed to be less than s, independent of the number of ions. Such efficient cooling across the entire spectrum is essential for high-fidelity quantum operations using trapped ion crystals for quantum simulators or quantum computers.
The laser cooling of mechanical oscillators to their motional ground state is an ongoing pursuit in quantum metrology, simulation, and computation Leibfried et al. (2003); Urvoy et al. (2019); T. J. and K. J. (2008); Metcalf and Straten (1999). In particular, the localization of individual atoms to well below optical wavelengths (the “Lamb-Dicke” regime) is a prerequisite for high fidelity quantum control of atomic systems Leibfried et al. (2003); Saffman (2018). In large trapped-ion crystals, quantum entangling gates exploit the collective motion of the ions Wineland and Blatt (2008); Monroe and Kim (2013). This motion must be prepared near the ground state in a cooling process that competes with heating from the coupling to the environment Turchette et al. (2000); Brownnutt et al. (2015). It is therefore critical to develop new methods to achieve high-bandwidth and fast cooling of all the motional modes used as a quantum bus for quantum information processing.
Resolved sideband cooling (RSC) is a general tool for cooling mechanical oscillators, and for trapped ions it is the standard method for cooling to the ground state Diedrich et al. (1989); Monroe et al. (1995); King et al. (1998); Leibfried et al. (2003). However, the RSC time typically grows linearly with the total mass of the oscillator, or the number of trapped ions in the chain. This scaling can be improved for large chains by implementing a parallel RSC strategy with single-ion addressing Chen et al. (2020).
Electromagnetically induced transparency (EIT) cooling of trapped ions and atoms is another well-known ground-state cooling method Morigi et al. (2000); Roos et al. (2000); Xia and Evers (2009); Kampschulte et al. (2014); Guo et al. (2014); Haller et al. (2015); Morigi (2003). It exploits quantum interference in a three-level system Lounis and Cohen-Tannoudji (1992) to create a tunable narrow spectroscopic feature tailored to the atomic motion for efficient cooling. Applied to trapped ions, EIT cooling allows simultaneous ground state cooling over a large portion of the motional spectrum without the need for single-ion addressing Jordan et al. (2019); Shankar et al. (2019); Lechner et al. (2016). Extensions of EIT cooling beyond the simple three-level system has stimulated several theoretical Semerikov et al. (2018); Lu et al. (2015); Evers and Keitel (2004) and experimental Scharnhorst et al. (2018); Ejtemaee and Haljan (2017); Qiao et al. (2020) studies. This extension is important for quantum information applications with trapped-ion hyperfine qubits Blinov et al. (2004); Monroe and Kim (2013), whose atoms feature four or more atomic ground states. Here, we demonstrate EIT cooling with a four-level tripod structure in a chain of up to 171Yb+ ions. We achieve fast ground-state cooling of nearly all motional modes of the chain, occupying a broadband spectrum of more than 3 MHz, in a time (s) that is independent of the number of ions.
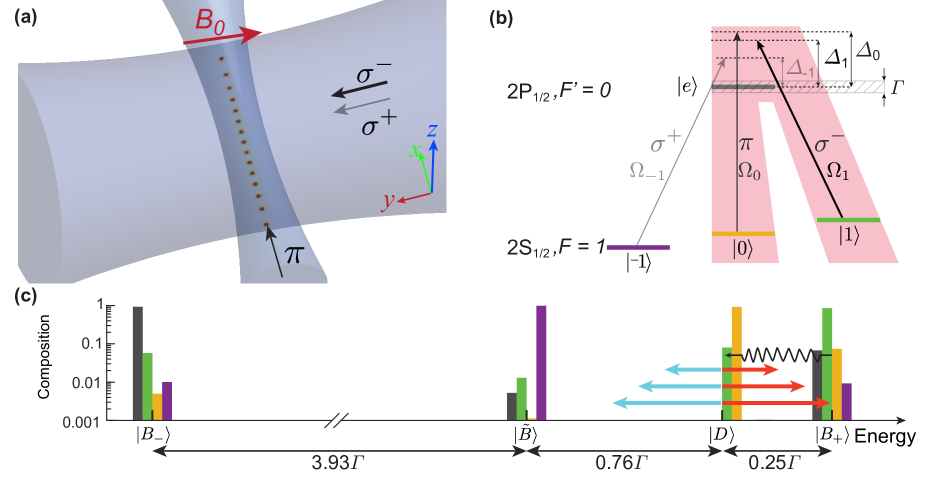
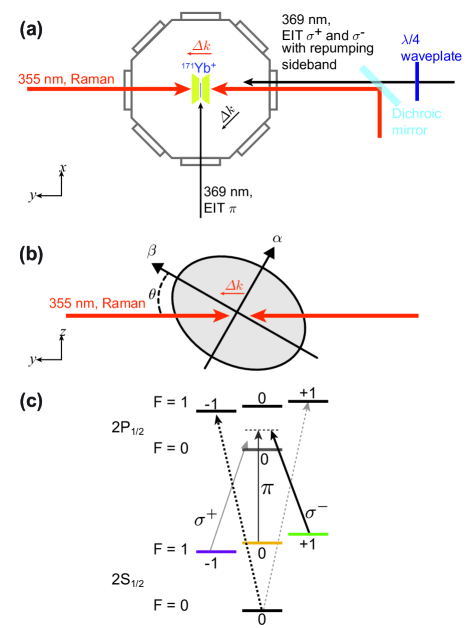
The EIT cooling of the tripod 171Yb+ system is implemented on the transition at an optical wavelength of nm and having a natural linewidth of = 19.6 MHz. A constant magnetic field G applied along the -axis (Fig. 1a) provides a Zeeman shift of 7.7 MHz for the states with respect to the state (Fig. 1b). The EIT laser configuration involves two beams simultaneously and globally addressing the ions, with three components of polarization, as depicted in Fig. 1b. The beam perpendicular to the ion chain is the strong pump beam, with a large component of and a small component of polarization, with the power ratio controlled by a birefringent waveplate. The beam along the chain of ions is the weak probe beam with polarization.
This tripod level configuration can be reduced to an effective system by setting the frequency of the (pump) and the (probe) components near two-photon resonance. The component is derived from the same laser as of , therefore it is naturally detuned from any two-photon resonance because of the Zeeman shift, but serves to remove population from the state by off-resonant scattering (Fig. 1b).
To understand this simplification, we consider the tripod system interacting with the EIT lasers (Fig. 1b), where is the Rabi frequency of the laser beam that couples the ground state () to the excited state with detuning of . We set and then obtain the eigenstates. A singular dark eigenstate consists of the and atomic states while two bright eigenstates contain a significant fraction of the excited state along with a negligible fraction of (Fig. 1b). The corresponding eigenvalues are and , where we use . The fourth remaining eigenstate is another bright state consisting mostly of the state with a tiny fraction of the excited state , and largely decoupled from the bare atomic states and . Thus we can ignore the state and consider just the effective system comprising , and (Fig. 1c)(see Supplement).
When the EIT beams are applied to stationary ions, the steady state population is trapped in the dark state irrespective of its initial state Lounis and Cohen-Tannoudji (1992). However, the ion motion can drive the population out of the dark state. When we set close to the oscillation frequency, the ions lose a quantum of vibrational energy as they are flipped from the dark state to the bright state . The population in the bright state subsequently spontaneously decays back to the dark state . In the Lamb-Dicke regime, the ions recoil with very low probability Leibfried et al. (2003), so this EIT absorption and emission process completes the cooling cycle, similar to RSC.
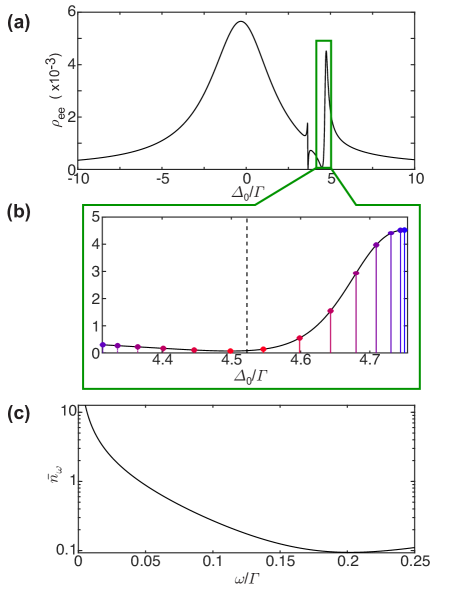
We estimate the limits of EIT cooling by considering the above cooling process balanced with heating arising from off-resonant scattering through the upper motional sidebands of the transitions. We calculate the EIT absorption spectrum by using a master equation for the full tripod system (see Supplement), and express the EIT cooling limit as the steady-state average phonon number of a motional mode at frequency Leibfried et al. (2003); Semerikov et al. (2018),
| (1) |
Here, and are the calculated steady-state populations of the excited state at the carrier and sidebands. In order to apply EIT to multiple modes, the idea is to set the Rabi frequencies and detunings to produce a low cooling limit for a wide spectrum of modes, as shown in Fig. 2.
In this work, we employ a cryogenic trapped-ion apparatus Pagano et al. (2018) based on a linear Paul trap that confines the ions with transverse center-of-mass (COM) frequencies MHz, and axial frequency kHz, depending on the number of ions. Because both principal axes of transverse motion have components along the wavevector difference between the EIT pump and probe beams (-axis in Fig. 1a), both directions of transverse motion are cooled by EIT. Following this cooling, we measure the vibrational population of the transverse modes by performing conventional sideband spectroscopy. We use a pair of counter-propagating 355 nm laser beams to drive motional-sensitive stimulated Raman transitions between qubit states and the Hayes et al. (2010), and measure the lower/upper sideband ratio for each transverse mode and extract Leibfried et al. (2003) (see Supplement).
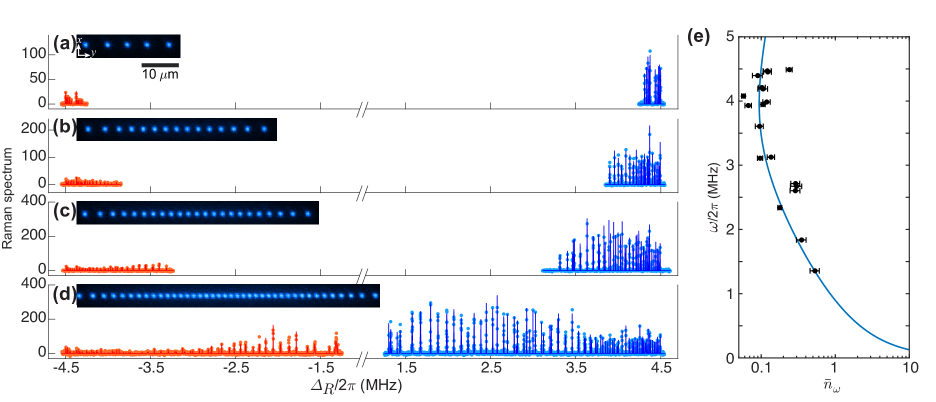
We first demonstrate the EIT cooling scheme for a single 171Yb+ ion. Beside the main EIT beams generated from a 369.5 nm diode laser,a 14.7 GHz sideband is added to the pump beam to avoid population trapping in the state Olmschenk et al. (2007). The Rabi frequency and laser detuning of the EIT pump and probe beams are optimized to achieve the best cooling for the transverse mode at (Fig. 3 inset)(see Supplement). We measure the steady-state phonon number for various cooling time and extract a cooling time of 48 and the steady-state average phonon number of = 0.08 with a cooling rate of 8.4104 quanta/s (Fig. 3).
We next perform EIT cooling on chains of and trapped ions following the same experimental procedure, with results shown in Fig. 4 (a)-(d). We see a total of sideband features corresponding to both sets of transverse modes. We apply the EIT cooling for a fixed time = 300 , independent of the number of ions, and observe a strong suppression of the lower sidebands compared to the upper sidebands, indicating efficient cooling of the motional modes close to their ground states. We observe average phonon numbers as low as for particular modes, and for all modes over a 3 MHz bandwidth (Fig. 4e), using the same amount of cooling time as that for a single ion. The EIT cooling method is thus found to be independent of the number of ions or modes, assuming that the sideband spectrum of modes remains within the cooling bandwidth and there is sufficient laser power available to provide the same intensity on each ion.
We finally investigate the cooling performance of a sequential combination of EIT cooling then RSC of select modes for a chain of 36 ions (See Supplement). We observe that this combination provides better cooling efficiency than either method individually. In the future, EIT cooling may be optimized further in the tripod system by applying a stronger beam further detuned from the useful two-photon resonance. This will keep atoms away from the spectator bright state , and should result in even larger cooling bandwidths, lower phonon populations, and shorter cooling times, as predicted by theoretical models (see Supplement). Overall, the EIT cooling mechanism discussed here appears to be an excellent tool for the quantum control of large chains of atomic ions for quantum information applications.
We acknowledge early discussions with Kristi Beck, Michael Foss-Feig, and Tobias Grass. This work is supported by the ARO MURI on Modular Quantum Systems, the DARPA DRINQS program, the DOE BES award de-sc0019449, the DOE HEP award de-sc0019380, and the Seed-Funding Program of the NSF Physics Frontier Center at JQI.
References
- Leibfried et al. (2003) D. Leibfried, R. Blatt, C. Monroe, and D. Wineland, Rev. Mod. Phys. 75, 281 (2003).
- Urvoy et al. (2019) A. Urvoy, Z. Vendeiro, J. Ramette, A. Adiyatullin, and V. Vuletić, Phys. Rev. Lett. 122, 203202 (2019).
- T. J. and K. J. (2008) K. T. J. and V. K. J., Science 321, 1172 (2008).
- Metcalf and Straten (1999) H. J. Metcalf and P. v. d. Straten, Laser cooling and trapping (Springer-Verige, New York, NY, 1999).
- Saffman (2018) M. Saffman, National Science Review 6, 24 (2018).
- Wineland and Blatt (2008) D. Wineland and R. Blatt, Nature 453, 1008 (2008).
- Monroe and Kim (2013) C. Monroe and J. Kim, Science 339, 1164 (2013).
- Turchette et al. (2000) Q. A. Turchette, C. J. Myatt, B. E. King, C. A. Sackett, D. Kielpinski, W. M. Itano, C. Monroe, and D. J. Wineland, Phys. Rev. A 62, 053807 (2000).
- Brownnutt et al. (2015) M. Brownnutt, M. Kumph, P. Rabl, and R. Blatt, Rev. Mod. Phys. 87, 1419 (2015).
- Diedrich et al. (1989) F. Diedrich, J. C. Bergquist, W. M. Itano, and D. J. Wineland, Phys. Rev. Lett. 62, 403 (1989).
- Monroe et al. (1995) C. Monroe, D. M. Meekhof, B. E. King, S. R. Jefferts, W. M. Itano, D. J. Wineland, and P. Gould, Phys. Rev. Lett. 75, 4011 (1995).
- King et al. (1998) B. E. King, C. S. Wood, C. J. Myatt, Q. A. Turchette, D. Leibfried, W. M. Itano, C. Monroe, and D. J. Wineland, Phys. Rev. Lett. 81, 1525 (1998).
- Chen et al. (2020) J. S. Chen, K. Wright, N. C. Pisenti, D. Murphy, K. M. Beck, K. Landsman, J. M. Amini, and Y. Nam, “Efficient sideband cooling protocol for long trapped-ion chains,” (2020), arXiv:2002.04133 [physics.atom-ph] .
- Morigi et al. (2000) G. Morigi, J. Eschner, and C. H. Keitel, Phys. Rev. Lett. 85, 4458 (2000).
- Roos et al. (2000) C. F. Roos, D. Leibfried, A. Mundt, F. Schmidt-Kaler, J. Eschner, and R. Blatt, Phys. Rev. Lett. 85, 5547 (2000).
- Xia and Evers (2009) K. Xia and J. Evers, Phys. Rev. Lett. 103, 227203 (2009).
- Kampschulte et al. (2014) T. Kampschulte, W. Alt, S. Manz, M. Martinez-Dorantes, R. Reimann, S. Yoon, D. Meschede, M. Bienert, and G. Morigi, Phys. Rev. A 89, 033404 (2014).
- Guo et al. (2014) Y. Guo, K. Li, W. Nie, and Y. Li, Phys. Rev. A 90, 053841 (2014).
- Haller et al. (2015) E. Haller, J. Hudson, A. Kelly, D. A. Cotta, B. Peaudecerf, G. D. Bruce, and S. Kuhr, Nature Physics 11, 738 (2015).
- Morigi (2003) G. Morigi, Phys. Rev. A 67, 033402 (2003).
- Lounis and Cohen-Tannoudji (1992) B. Lounis and C. Cohen-Tannoudji, J. Phys. II France 2, 579 (1992).
- Jordan et al. (2019) E. Jordan, K. A. Gilmore, A. Shankar, A. Safavi-Naini, J. G. Bohnet, M. J. Holland, and J. J. Bollinger, Phys. Rev. Lett. 122, 053603 (2019).
- Shankar et al. (2019) A. Shankar, E. Jordan, K. A. Gilmore, A. Safavi-Naini, J. J. Bollinger, and M. J. Holland, Phys. Rev. A 99, 023409 (2019).
- Lechner et al. (2016) R. Lechner, C. Maier, C. Hempel, P. Jurcevic, B. P. Lanyon, T. Monz, M. Brownnutt, R. Blatt, and C. F. Roos, Phys. Rev. A 93, 053401 (2016).
- Semerikov et al. (2018) I. A. Semerikov, I. V. Zalivako, A. S. Borisenko, K. Y. Khabarova, and N. N. Kolachevsky, Journal of Russian Laser Research 39, 568 (2018).
- Lu et al. (2015) Y. Lu, J.-Q. Zhang, J.-M. Cui, D.-Y. Cao, S. Zhang, Y.-F. Huang, C.-F. Li, and G.-C. Guo, Phys. Rev. A 92, 023420 (2015).
- Evers and Keitel (2004) J. Evers and C. H. Keitel, Europhysics Letters (EPL) 68, 370 (2004).
- Scharnhorst et al. (2018) N. Scharnhorst, J. Cerrillo, J. Kramer, I. D. Leroux, J. B. Wübbena, A. Retzker, and P. O. Schmidt, Phys. Rev. A 98, 023424 (2018).
- Ejtemaee and Haljan (2017) S. Ejtemaee and P. C. Haljan, Phys. Rev. Lett. 119, 043001 (2017).
- Qiao et al. (2020) M. Qiao, Y. Wang, Z. Cai, B. Du, P. Wang, C. Luan, W. Chen, H.-R. Noh, and K. Kim, “Double-EIT ground-state cooling of stationary two-dimensional ion lattices,” (2020), arXiv:2003.10276 [quant-ph] .
- Blinov et al. (2004) B. Blinov, D. Leibfried, C. Monroe, and D. Wineland, Quantum Information Processing 3 (2004), 10.1007/s11128-004-9417-3.
- Pagano et al. (2018) G. Pagano, P. W. Hess, H. B. Kaplan, W. L. Tan, P. Richerme, P. Becker, A. Kyprianidis, J. Zhang, E. Birckelbaw, M. R. Hernandez, Y. Wu, and C. Monroe, Quantum Science and Technology 4, 014004 (2018).
- Hayes et al. (2010) D. Hayes, D. N. Matsukevich, P. Maunz, D. Hucul, Q. Quraishi, S. Olmschenk, W. Campbell, J. Mizrahi, C. Senko, and C. Monroe, Phys. Rev. Lett. 104, 140501 (2010).
- Olmschenk et al. (2007) S. Olmschenk, K. C. Younge, D. L. Moehring, D. N. Matsukevich, P. Maunz, and C. Monroe, Phys. Rev. A 76, 052314 (2007).
I Supplement
I.1 Dressed-state picture of EIT cooling
To understand the EIT cooling in the tripod structure, we start considering the Hamiltonian of a single ion interacting with the EIT lasers without spontaneous emission ( = 1),
| (1) |
When we set while , only and beams satisfy two-photon resonance condition. We can therefore neglect the contribution of the beam and focus primarily on the strong dark feature (Fig. 2) of the effective three-level system described by the simplified Hamiltonian
| (2) |
By diagonalizing this Hamiltonian, we find that the three eigenstates of the system can be expressed as
| (3) | |||||
| (4) | |||||
| (5) |
The corresponding eigenvalues are and , with and . By inverting Eq. (3, 4, 5), the bare atomic states can be expressed in terms of the dressed states,
| (6) | |||||
| (7) | |||||
| (8) |
We next add an interaction term that couples the transition to a single mode of motion at frequency represented by creation and annihilation operators and and within the Lamb-Dicke regime Leibfried et al. (2003),
| (9) |
where the Lamb-Dicke parameter is with the wavevector of the pump beam and the mass of a single ion. Using Eqs. (6, 7, 8), we rewrite the interaction Hamiltonian (9) in the dressed-state basis and transform it into interaction picture. By tuning the energy splitting between bright and dark states to be comparable to the motional mode frequency, , we can focus exclusively on the lower sideband interaction that coupling state to , as the other terms average to zero in the rotating-wave approximation. We find the dressed state interaction Hamiltonian is
| (10) | |||||
where the effective Rabi frequency is
| (11) |
To complete the continuous EIT cooling cycle, the population in bright state spontaneously decays back to the dark state .
In order to obtain cooling limits accurately, we must include the dissipative effects of spontaneous emission along with the idealized coherent dynamics considered above. We calculate the absorption spectrum from the steady-state solution of the master equation with the EIT Hamiltonian above,
| (12) |
where is the density matrix of the tripod system and is the Lindblad operator capturing the effect of spontaneous emission, where with . For a steady-state solution, we take .
Following the master equation, we estimate the cooling bandwidth. The excited state population for a effective system can be obtained Leibfried et al. (2003),
| (13) |
where is given by
| (14) |
with . Assuming and , we have a simpler form of the excited state population
| (15) |
As expected, the minimum appears at , the dark state, and the nearest maximum appears at , the bright state. We calculate the cooling bandwidth by finding the detuning at which the cooling stops, where the upper sideband beats the lower sideband, . The cooling bandwidth is thus given by
| (16) |
Given the experimental parameters, we have a cooling bandwidth of , which is close to our observation in experiment.
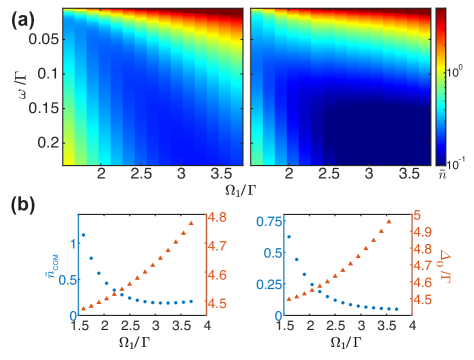
Using the master equation and Eq. (1) in the main text, we numerically calculate the average phonon number as a function of the pump beam Rabi frequency and trap frequency . We are interested in cooling motional modes ranging from COM frequency 4.45 MHz (0.23) to the lowest frequency zig-zag normal mode. In the current experiment configuration, we set the detuning of weak beam to = 3.69 with the Rabi frequency = 0.35. As we increase the pump beam Rabi frequency , the lowest average phonon number improves while the cooling bandwidth reduces as well (Fig. S1a). Here for each value of , we vary the detuning of the probe beam to get the lowest phonon number for the COM mode (Fig. S1b). We also find that this configuration can be further improved by increasing the Rabi frequency of the beam while detuning its frequency further away from the two-photon resonance of interest. One case is shown with = -4.47 with the Rabi frequency = . This also shortens the time for cooling since stronger is more effective in keeping atoms away from state while not affecting the dark resonance much.
I.2 Experimental setup for EIT cooling
The tripod-EIT scheme involves two laser beams derived from same 369.5nm laser, addressing the and manifolds (Fig. 1b) of 171Yb+ ions. The EIT beams are configured in a way such that the wavevector difference has a component along both the transverse principle directions of motion (Fig. S2b). As a result, the EIT cooling beams address all the transverse modes. The pump beam of the EIT is along the Raman lasers (Fig. S2a). Two acousto-optic-modulators (AOM) in pump and probe beams are used to add different frequency shifts for each beam. The pump beam frequency is shifted by 280 MHz. As a result, the component is detuned from the transition by and component is detuned () from the transition by (Fig. 1b). The detuning of the beam from the transition is scanned to optimize the EIT-cooling performance for the mode, and is set to (Fig. 3 inset). We also employ an electro-optic-modulator (EOM) to add a 2 14.4 GHz frequency shift in the probe beam to remove the atomic population from the state (Fig.S4b).
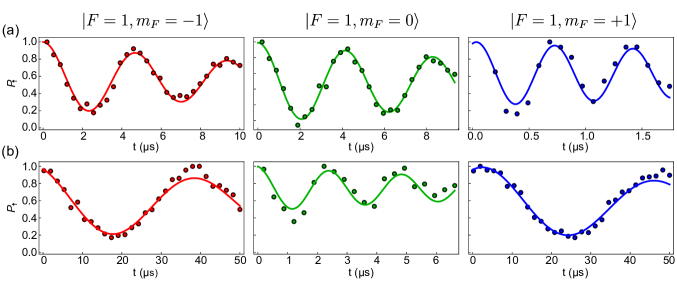
We characterize the Rabi frequencies of the corresponding optical fields using microwave Ramsey spectroscopy. We first apply a microwave pulse to prepare the ion in the superposition state of the and states with = -1,0 or 1. Next, we shine each of the EIT beam separately on the atom before another microwave analysis pulse. For each EIT beam, we obtain the AC stark shift for each polarization component from the Ramsey oscillations (Fig. S3) between the to with = -1,0 or 1, which is approximately given by
| (17) |
Thus from the measured stark shift, we extract the Rabi frequencies for the pump (pm) beam components, ()=(). For the probe (pr) beam, we have ()=(). The relavent Rabi frequencies in cooling experiment are , and .
In EIT cooling experiment, we first calibrate all the beams and optimize the cooling for mode with a single ion. Later we use the same parameters for cooling a large chain of ions. The experimental sequence involves an initial Doppler cooling of 2 ms, which reduces the phonon numbers down to , followed by a single pulse of EIT cooling for 300s.
I.3 Raman Spectroscopy
We perform conventional sideband spectroscopy on the lower/upper motional sideband of different vibrational modes. Assuming a thermal state distribution, we obtain from the population ratio () of lower/upper sidebands following (Leibfried et al. (2003)).
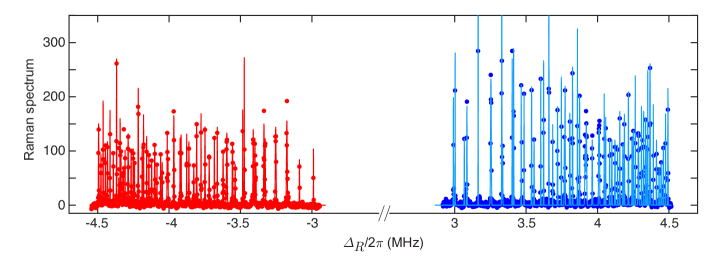
When performing sideband spectroscopy with large chains, we reduce the Raman laser power until motional mode frequencies are well-resolved. In addition, we lower the axial confinement to maintian the one-dimensional chain as we add more ions to the trap. As a result, the transverse mode separation exhibits strong fluctuates between measurements. To correctly measure the population ratio ( and estimate the statistical error, we scan the motional mode frequencies 5 times for each data point in Fig. 4e. Fig. S4 shows the Raman sideband spectra for 31-ions chain after Doppler cooling for 2 ms.
I.4 Motion-Sensitive Carrier Rabi Flopping
As we scale up the system size, the mode spectrum becomes dense, and spectrally isolating a single motional mode to determine the thermal number of quanta in each mode becomes challenging. An alternative metric for the efficacy of EIT cooling is to measure the motion-sensitive Rabi dynamics of the ions. This provides a global measure of the thermal motion of the ions.
For a collection of modes with phonon numbers , the carrier Rabi frequency on a particular ion includes Debye-Waller factors that suppress the interaction. Assuming each mode of motion is in a thermal state with mean phonon number , we find Leibfried et al. (2003),
| (18) |
Here we take each mode to be confined within the Lamb-Dicke limit where . The population of a given ion initially prepared in state is given by
| (19) |
with the phase . The contrast of the Rabi oscillations is
| (20) |
where the last approximation assumes sufficiently early evolution times. We see that due to motion, the measured Rabi frequency for each ion is suppressed and the contrast decays in time. Both observables can provide a global signature of the thermal motion.
We cannot extract the mean phonon number for each mode based on the global observables for the Rabi frequencies (Eq. 18) or Rabi flopping contrast (Eq. 20). However, by fitting the observed Rabi evolution of each ion, we can extract global information about the thermal motion of the ions and thereby gauge the efficacy of EIT cooling strategies.
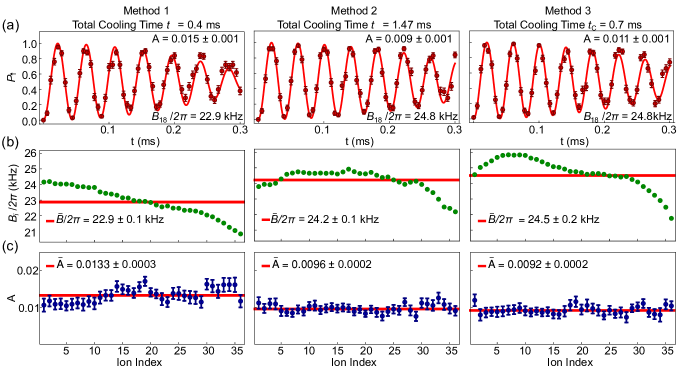
We fit observed Rabi oscillations of each ion in a chain to Eq. 19, according to the fit function
| (21) |
and extract values of the quadratic contrast decay (nominally ) and the Rabi frequencies for each ion. We also allow for an offset term to account for detection errors.
We use these global observables to gauge three different cooling schemes which we label method 1, 2, and 3 (Fig. S5). With method 1, we implement RSC on only two COM modes, thus cooling only these and neighboring modes. With method 2, we apply additional RSC at 4 more frequencies covering the full motional spectrum to ensure all the modes are cooled. With method 3, we combine broadband EIT cooling and RSC in method 1. Comparing the results with methods 1 and 3, we find that EIT cooling over a large bandwidth increases the Rabi frequency, indicating improved global cooling of the chain. With method 2, we see that RSC with full bandwidth coverage improves the Rabi flopping across the chain, which is comparable to that with method 3. However, it costs twice as much time as that of the more efficient method 3. We find that the fitted contrast improves along with the Rabi frequency for methods 2 and 3, although only weakly, likely due to other decay mechanisms insensitive to motion such as intensity noise.