Progenitor, Precursor and Evolution of the Dusty Remnant of the Stellar Merger M31-LRN-2015
Abstract
M31-LRN-2015 is a likely stellar merger discovered in the Andromeda Galaxy in 2015. We present new optical to mid-infrared photometry and optical spectroscopy for this event. Archival data shows that the source started to brighten 2 years before the nova event. During this precursor phase, the source brightened by 3 mag. The lightcurve at 6 and 1.5 months before the main outburst may show periodicity, with periods of 160.3 and 28.11.4 days respectively. This complex emission may be explained by runaway mass loss from the system after the binary undergoes Roche-lobe overflow, leading the system to coalesce in tens of orbital periods. While the progenitor spectral energy distribution shows no evidence of pre-existing warm dust in system, the remnant forms an optically thick dust shell at 4 months after the outburst peak. The optical depth of the shell increases dramatically after 1.5 years, suggesting the existence of shocks that enhance the dust formation process. We propose that the merger remnant is likely an inflated giant obscured by a cooling shell of gas with mass M⊙ ejected at the onset of the common envelope phase.
keywords:
binaries (including multiple): close – stars: evolution – (stars:) novae, cataclysmic variables – (ISM:) dust, extinction – ISM: jets and outflows1 Introduction
Luminous red novae (LRNe) are an observational class of astrophysical transients with peak luminosities in between novae and supernovae ( mag), making them members of the “gap transients” population (Kasliwal, 2012; Pastorello & Fraser, 2019). This population includes transients of very diverse nature, such as faint core-collapse supernovae (SNe), .Ia-like SN explosions (Bildsten et al., 2007), Ca-rich (strong) transients (Kasliwal et al., 2012), LRNe (Kulkarni et al., 2007), 2008S-like objects (Prieto et al., 2009; Thompson et al., 2009; Botticella et al., 2009) and LBV-like outbursts (Smith et al., 2011) among others. Within the gap category, there is an observational class characterized by strong interaction with a circumstellar medium (CSM), called Intermediate Luminosity Optical/Red Transients (ILOT/ILRT). LRNe belong to this group. Observationally, LRN transients quickly evolve towards colder (redder) temperatures, resembling K or M-type giant stars. Their spectra are characterized by hydrogen emission lines expanding at velocities and a forest of absorption lines for low ionization elements. At later stages, the progressively cooling photosphere shows the formation of molecules and new dust in the system, which quickly obscures the optical emission (Kamiński & Tylenda, 2011; Kamiński et al., 2015).
Since the discovery of the first “red variable” about 30 years ago (M31RV; Rich et al., 1989; Mould et al., 1990), LRNe have been sporadically detected both in the Milky Way and in galaxies within Mpc (Kulkarni et al., 2007; Smith et al., 2016; Mauerhan et al., 2018; Blagorodnova et al., 2017; Pastorello et al., 2019b). Although their fainter luminosities pose a challenge to their discovery, a few nearby well studied cases provided a great wealth of information about their origin as violently interacting binary systems. The best example to date is V1309 Sco (Mason et al., 2010). Archival data revealed it to be a contact eclipsing binary, whose period decreased exponentially for several years prior to the nova outburst (Tylenda et al., 2011). Other members of this class include the Galactic stellar mergers V838 Mon (Munari et al., 2002), V4332 Sgr (Martini et al., 1999) and OGLE-2002-BLG-360 (Tylenda et al., 2013).
LRNe provide unique observational clues about the final catastrophic stages of binary interaction, specially the termination of the so-called common envelope (CE) phase. This phase can be initiated by the Darwin instability (Darwin, 1879). The spin up of the primary component in an initially tidally-locked binary would extract angular momentum from the orbit, drive the orbital decay, and ultimately initiate Roche lobe overflow (Rasio, 1995). The donor star (typically the primary evolving off of the main-sequence) overfills its Roche lobe and starts unstable mass transfer towards its companion (see Izzard et al., 2012, for a detailed explanation). This process may culminate with both stars orbiting inside a shared non co-rotating layer of gas, called the common envelope (Paczynski, 1976). The less massive component quickly spirals inwards, transferring the angular momentum of the binary to the envelope. At the termination of this phase part (or all) of the envelope can be ejected, leaving a more compact binary, or a fully coalesced star.
The light curves of LRNe are potentially powered by three different mechanisms: free expansion and release of thermal energy from hot gas created during the dynamical phase of the merger (similar to “cooling envelope” emission in supernovae); recombination of ionized ejecta (Ivanova et al., 2013b), analogous to SNe IIP, and sustained luminosity due to reprocessed shock emission as the dynamical ejecta runs into surrounding layers of pre-existing gas (Metzger & Pejcha, 2017).
Well-studied stellar mergers are powerful probes of the dynamical onset of common envelope evolution, which is one of the most challenging phases of binary evolution (see Ivanova et al., 2013a, for a review). Currently, there are still important questions to be answered. Which progenitor systems undergoing Roche lobe overflow (RLOF) result in CE events via dynamically-unstable mass transfer? What is the role of pre-outburst mass loss from the system (Pejcha, 2014; Pejcha et al., 2016a, b; MacLeod et al., 2018a, b; Reichardt et al., 2019; MacLeod & Loeb, 2020)? What is the role of jets in the removal of the envelope (Moreno Méndez et al., 2017; Shiber & Soker, 2018; Shiber et al., 2019; Lopez-Camara et al., 2020)? How dust forms in the expanding ejecta (Lü et al., 2013; Iaconi et al., 2020) and what is the role of dust-driven winds in unbinding the loosely bound envelope after its ejection (Glanz & Perets, 2018)? Finally, understanding which common envelope events result in a complete merger and which result in a close binary binary is crucial for gravitational wave science (Dominik et al., 2012; Vigna-Gómez et al., 2020; Klencki et al., 2020).
The rate of transients associated to stellar mergers is high enough (Kochanek et al., 2014) to ensure several detections per year with ongoing surveys, such as the Zwicky Transient Facility (ZTF; Adams et al., 2018; Howitt et al., 2020). However, few are likely to happen as close as M31. The event we discuss here, M31-LRN-2015, is probably the closest extragalactic example of this transient family for the next 20 years, and thus provides the best opportunity for studying the evolution of the remnant at late times.
M31-LRN-2015 was discovered in the Andromeda galaxy (M31) at , , (6.8′ W and S of its galaxy centre) on UTC 2015 January 13.63 by the MASTER survey (Shumkov et al., 2015a). Though the transient was initially classified as a classical nova peaking at mag, it quickly evolved towards red colours and was re-classified as a LRN based on its luminosity, slow decline, color evolution, and spectroscopic similarities to V838 Mon by Kurtenkov et al. (2015b). Dong et al. (2015) identified a progenitor in archival Hubble Space Telescope (HST) imaging and noted that the progenitor had started brightening in later archival Canada France Hawaii Telescope (CFHT) photometry. Kurtenkov et al. (2015a), Williams et al. (2015), and Lipunov et al. (2017) presented optical and near infrared (NIR) light curves and optical spectra of the outburst spanning from 10 days pre-maximum to 60 days post-maximum.
Further analysis by MacLeod et al. (2017) used the archival photometry from Dong et al. (2015) and Williams et al. (2015) to estimate the evolutionary stage of the progenitor star for single stellar models. The best agreement was for a M⊙ sub-giant star with a radius R⊙ that was evolving off the main sequence. In their model, the optical transient lasted less than 10 orbits of the original binary, and the light curve was best explained by M⊙ of fast ejecta driven by shocks at the onset of CE followed by H recombination of an additional M⊙ of material ejected at slower velocities as the secondary continued to spiral in through the envelope of the primary.
Similar results were obtained by Lipunov et al. (2017), using hydrodynamic simulations designed to reproduce the multi-colour light curve of the transient. The observed 50 day plateau was explained by a stellar merger with a progenitor mass of 3 M⊙ and a radius of 10 R⊙, which underwent fast shock heating at the base of the envelope accelerating the matter to photospheric velocities of km s-1. In this scenario, the system is already a tight binary with a degenerate dwarf primary, and the unstable mass transfer is initiated by the secondary companion.
Alternatively, Metzger & Pejcha (2017) suggested that the M31-LRN-2015 had a more extended period of mass loss from the L2 point before the outburst, which powered the emission observed prior to the main peak. The light curve could then be explained by the release of thermal energy near the peak, followed by a plateau powered by the interaction of a dynamically ejected shell with the preexisting equatorial material.
In this paper we present new optical and infrared photometry, and optical spectroscopic data on M31-LRN-2015. We investigate the evolution of the progenitor up to 5.5 years before the outburst, which shows a more complex behaviour. We also provide the first analysis of the remnant, based on infrared photometry taken up to 5 years after the outburst. We present new observational data in Section 2. Our analysis of the object’s spectroscopic and photometric evolution is in Section 3. We discuss the implications of our results in Section 4 and summarize our conclusions in Section 5.
2 Observations
2.1 Distance and reddening
Following Williams et al. (2015) and Lipunov et al. (2017) we adopt a distance of 0.762 Mpc, corresponding to a distance modulus of mag (Freedman & Madore, 1990).
There is some uncertainty in the reddening that should be adopted for M31-LRN-2015. Based on the foreground reddening of mag (Schlegel et al., 1998) and the total line-of-sight extinction at the position of M31-LRN-2015 of (Montalto et al., 2009), Williams et al. (2015) and Lipunov et al. (2017) assume M31-LRN-2015 was reddened by mag. Kurtenkov et al. (2015a) report a line of sight reddening of mag based on dust maps of M31 (Draine et al., 2014), and find mag from modeling spectra taken between UTC 2015 January 15 and 2015 February 24. In this paper we adopt a foreground extinction of based on the Schlafly et al. (2012) recalibration of the Schlegel et al. (1998) dust maps plus an average host extinction of , which is a compromise between all previous studies. Therefore, the total extinction used in this study is .
2.2 Photometry
We monitored the photometric and spectroscopic evolution of M31-LRN-2015 with a variety of ground-based facilities and with the Spitzer Space Telescope (SST; Werner et al., 2004; Gehrz et al., 2007). We also collected all the published data on this source from literature. A full log of archival and follow-up photometry is shown in Table 1.
| Phase | MJD | Telescope | Filter | Mag | ATel |
|---|---|---|---|---|---|
| -3810.7 | 53233 | HST | I | 22.020.01 | 7173 |
| -3810.7 | 53233 | HST | V | 23.20.03 | 7173 |
| -3443.7 | 53600 | Spitzer | 3.6 | 17.99 | |
| -3443.7 | 53600 | Spitzer | 4.5 | 17.83 | |
| -3443.7 | 53600 | Spitzer | 5.8 | 17.03 | |
| -3443.7 | 53600 | Spitzer | 8.0 | 15.89 | |
| … | … | … | … | … | … |
| 1260.8 | 58304.5 | Keck | K | 24.26 | |
| 1291.8 | 58335.5 | Keck | J | 25.27 | |
| 1291.8 | 58335.5 | Keck | H | 24.81 | |
| 1793.2 | 58836.9 | Spitzer | 3.6 | 17.2 | |
| 1793.2 | 58836.9 | Spitzer | 4.5 | 15.730.02 |
-
•
References: ATel 7173 Dong et al. (2015)
The precursor and the nova photometry were retrieved from archival images from the Palomar Transient Facility (PTF; Law et al., 2009; Rau et al., 2009) and the Intermediate Palomar Transient Facility (iPTF; Kulkarni, 2013). The images were obtained between MJDs 55569.0 and 57642.0 (5.3 prior to discovery to 1.6 years after) with the CFH12K camera (Rahmer et al., 2008; Law et al., 2010) on the Palomar 48-inch Telescope (P48). The PTF/iPTF data were processed with the PTF image subtraction pipeline PTFIDE (Masci et al., 2017). The CFHT/MegaPrime light curves with 6 and 26 min cadence were obtained from three full nights monitoring the field for microlensing on 2014 October 24, 28 and 30 (PI: Subo Dong). The photometry was obtained using difference imaging analysis (Wozniak, 2000) and calibrated using the Pan-STARRS DR1 (PS1; Chambers et al., 2016).
Optical follow-up imaging was obtained with the Liverpool Telescope (Bersier et al., 2015) and with the Large Binocular Camera (LBC; Giallongo et al., 2008) on the Large Binocular Telescope (LBT; Hill et al., 2006).
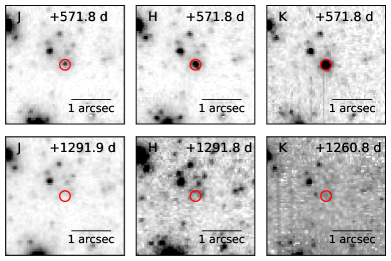
Near-IR imaging was collected with the LBT NIR-Spectroscopic Utility with Camera and Integral-Field Unit for Extragalactic Research (LUCIFER; Seifert et al., 2003), with the CAmara INfrarroja (CAIN) on the Telescopio Carlos Sánchez and, at late times, with the NIRC2-AO camera on the 10 m Keck II telescope. The observations were made with and filters in the wide camera mode, having 40 mas pixel-1. We used the laser guide star adaptative optics (LGS AO; Wizinowich et al., 2006) system to obtain diffraction limited images with an FWHM of approximately 2.5 pixels (equivalent to 0.1 arcsec), required to resolve the fading progenitor in a crowded M31 star field. Figure 1 shows the location of the outburst 1.5 and 3.5 years after discovery.
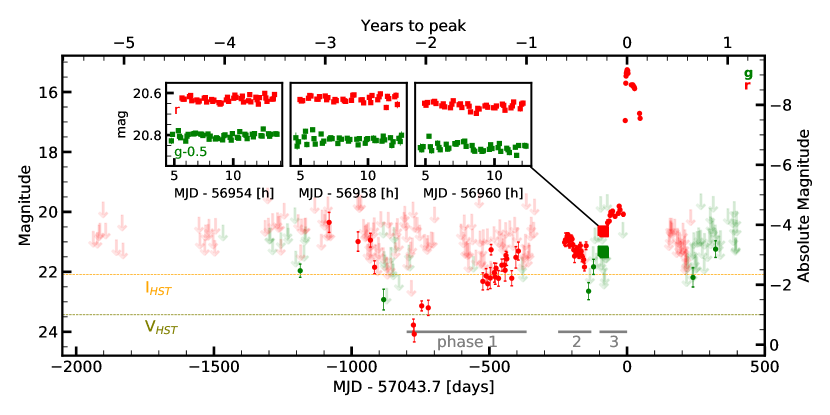
Confusion complicates the interpretation of ground-based (seeing-limited) photometry of the progenitor and remnant. Archival images from Hubble Space Telescope (HST) obtained on UTC 2004 August 16 also reveal multiple sources within 1 of the progenitor with comparable fluxes (Dong et al., 2015; Williams et al., 2015). Image subtraction via the PTFIDE pipeline for the PTF data and via ISIS for the LBT data enables accurate measurement of changes in flux, but not the total flux of the target. However, due to the faintness of the progenitor, we assume that the deviation from the total flux is negligible. The difference imaging precursor light curve is shown in Figure 2.
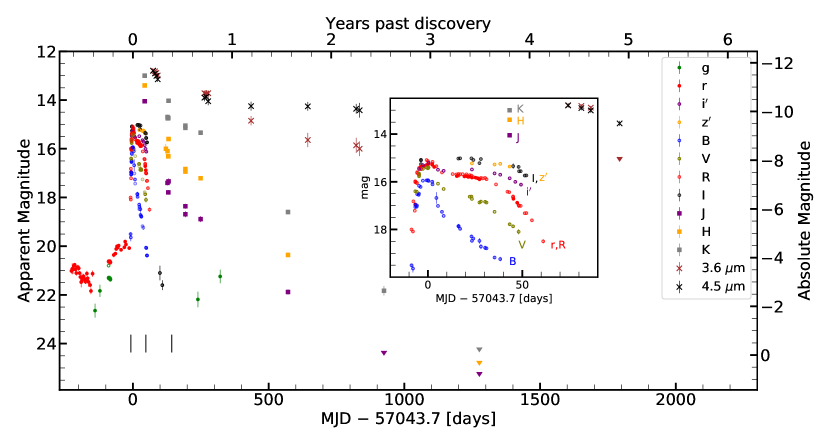
In our mid-IR follow-up (Figure 3), we utilize both new and archival mid-IR data in [3.6] and [4.5] bands from the Infrared Array Camera (IRAC; Fazio et al., 2004) on board Spitzer Space Telescope. Under programs 11181, 12063 PI: C. Kochanek), and 13053, 14089 (PI: M. Kasliwal), we obtained mid-IR imaging from UTC 2015 April 06 to UTC 2019 December 19). We also analyzed the archival images from UTC 2005 August 18/19 (program 3126; PI: P. Barmby)111We do not use archival imaging from this program taken on 2005-01-20/21 because a solar proton event flooded the detector with cosmic rays., and from 2015 taken under the program 11103 (PI: O. Jones). The Spitzer photometry was reduced using the difference imaging pipeline developed for the Spitzer InfraRed Intensive Transients Survey (SPIRITS) survey (Kasliwal et al., 2017).
2.3 Spectroscopy
We acquired optical follow-up spectra with the OSMOS spectrograph on the MDM Observatory 2.4 m Hiltner telescope on UTC 2015 March 10 (+47.4 days; Wagner et al., 2015) and with the Low Resolution Imaging Spectrograph (LRIS; Oke et al., 1995) on the 10 m Keck I telescope on UTC 2015 June 13 (+142.9 days). The OSMOS spectrum was reduced using standard IRAF routines. The LRIS spectrum was reducing using an IDL based pipeline lpipe developed by D. Perley 222http://www.astro.caltech.edu/~dperley/programs/lpipe.html.
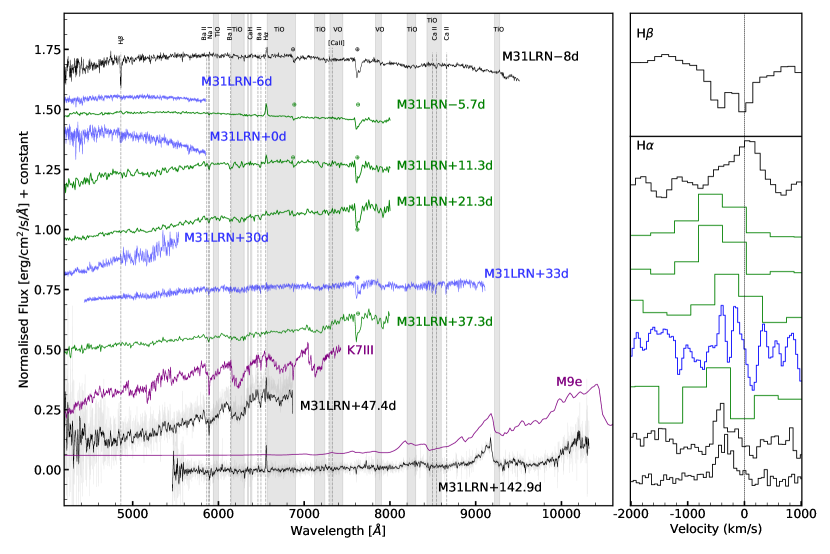
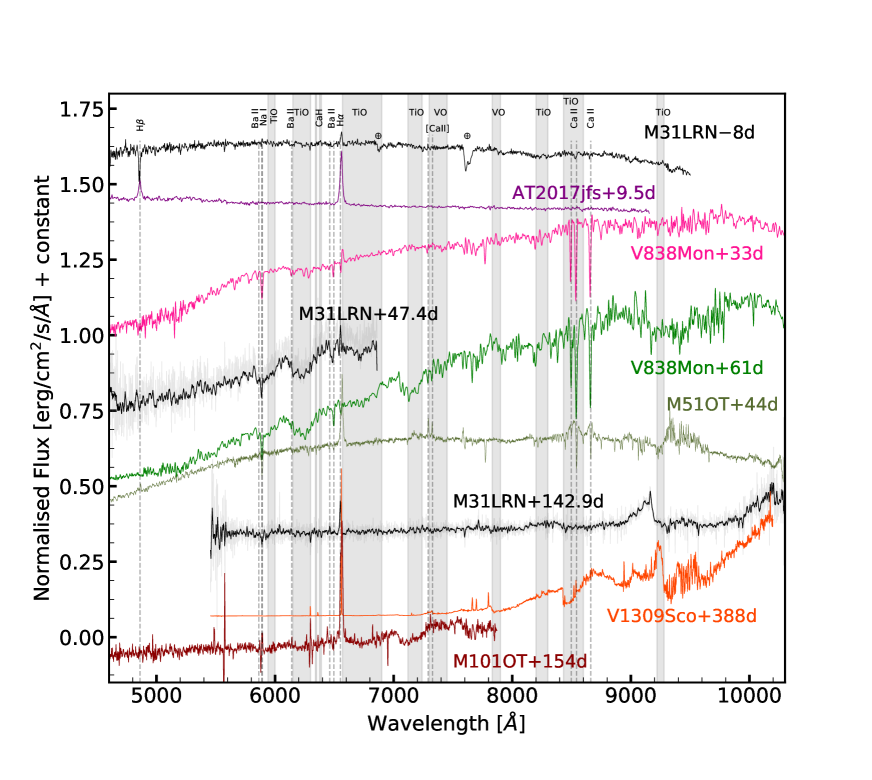
We also include early time (8 days pre-peak) spectroscopy from WHT/ACAM reported by Hodgkin et al. (2015), the Liverpool Telescope SPRAT Spectroscopy published in Williams et al. (2015) and spectroscopy from Kurtenkov et al. (2015a), constituting the most complete spectroscopic dataset up to date. The ACAM spectrum was reduced using the usual IRAF procedures, and scaled using the photometry in and bands of the nova reported for the same night by Kurtenkov et al. (2015a). The observation log for the unpublished spectra is provided in Table 2 and the spectral sequence is displayed in Figure 4.
In order to correct the spectra for the systemic velocity of Andromeda, we adopt km s-1 (Chemin et al., 2009). In addition, the transient is nearly aligned with the semi-major axis of M31 (6.8′ W and S of M31 centre). Assuming that the progenitor is a relatively young star (100 Myr for a 5 M⊙) which still follows the galaxy rotation curve, we estimate that the star may have an additional correction, related to its rotation within the galaxy of -200 km s-1, which should be considered as an upper limit for any additional correction to the velocity.
| Phasea | MJD | UTC | Telescope | Slit | Exposure | Airmass | Resolution | Hel. vel. |
|---|---|---|---|---|---|---|---|---|
| (d) | +Instrument | (arcsec) | (s) | (km/s) | (km/s) | |||
| 7.8 | 57035.88 | 2015-01-13T21:05:06 | WHT+ACAM | 1.5 | 1200 | 1.25 | 880 | 25.6 |
| +47.4 | 57091.11 | 2015-03-10T02:44:47 | MDM + OSMOS | 1.2 | 600 | 2.6 | 190 | 16.2 |
| +142.9 | 57186.58 | 2015-06-13T13:58:18 | Keck I + LRIS | 1.0 | 590 | 1.6 | 300 | 19.5 |
aThe phase is relative to -band peak date with MJD 57043.7.
3 Analysis
3.1 Spectroscopic Evolution
Our earliest spectrum was taken 8 days before optical peak. The fit for an extinction-corrected continuum shows a 5000 K black body emission along with narrow absorption lines for low-ionization elements such as Na i, Fe ii, Sc ii and Ba ii. We also detect the Ca ii triplet in absorption with a velocity of 130 km s-1. Note the lack of emission lines for [Ca ii], which are consistently observed in 2008S-like transients (Botticella et al., 2009; Bond et al., 2009) (see Figure 4). The peak of the H emission is located at 6558.8Å, indicating a redshift of 100 km s-1. Although the line shows a multi-component profile, the FWHM of the emission indicates that the line is likely unresolved (880 km s-1). The H line is detected in absorption, centered on 4855.7Å (50 km s-1) with a FWHM of 380247 km s-1 (see Table 3 for the fit parameters). The profile appears to be partly filled by an emission component, in agreement with the characteristics of the spectrum at 6 days reported by Fabrika et al. (2015) and Kurtenkov et al. (2015a).
The spectral sequences from Williams et al. (2015) and Kurtenkov et al. (2015a) show a quick progression (over 40 days) from an almost featureless spectrum into a one dominated by strong absorption bands from recently formed molecules. The H emission line detected at early times seems to disappear between +11 and +37 days, which coincides with the duration of the light curve plateau (see Figure 3). If the plateau is powered by recombination, this process must be occurring deeper in the ejecta, with any emission from hydrogen recombination being absorbed by the cooler outer shell.
Towards the end of the -band plateau at +47 days, the spectrum resembles a K7III star, with strong Na i and Ba ii absorption lines and TiO molecular absorption bands. The spectrum again shows the H line in emission, although its peak has shifted to km s-1. This line likely comes from an expanding, cooling shell. Analogous to cool Mira stars (Kamiński et al., 2017), the emission is accompanied by absorption at +200 km s-1, pointing to the existence of inflowing gas.
The final spectrum, taken on the decline of the plateau, shows an almost complete lack of continuum emission blueward of 8000Å, as the optical part of the spectrum has been totally absorbed by molecules, such as TiO , VO and Zr O, that are produced in O-rich atmospheres. The late time spectrum closely resembles the spectrum of the Mira star R Leo, classified at minimum as having an M9e spectral type (Gunn & Stryker, 1983; Keenan et al., 1974). The H line is still present in emission with a similar blueshifted velocity and signs of an absorption profile at a similar velocity.
| Phase | Ion | Velocitye | FWHMe | Velocitya | FWHMa |
|---|---|---|---|---|---|
| (day) | (km s-1) | (km s-1) | (km s-1) | (km s-1) | |
| 8 | H | – | – | 380 247 | |
| 8 | H | 9630 | 880 | – | – |
| +47.4 | H | 3091 | 11530 | 13622 | |
| +142.9 | H | 1 | 300 20 | – | – |
3.2 Spectroscopic comparison
In the context of stellar mergers, the spectroscopic evolution of M31-LRN-2015 appears closer to the events detected in our own Galaxy than the more luminous transients recently presented by Pastorello et al. (2019b). This last group, mainly consisting of mergers of more massive stars, usually displayed two peaks in their light curve: a first, fast, blue peak and a second, slower red peak, which sometimes is smoothed into a pleateau.
A comparison of the pre-peak spectra of M31-LRN-2015 with the extragalactic transient AT2017jfs (Pastorello et al., 2019a) (see Figure 5) shows an initial difference in the continuum temperature, which is also reflected in the emission lines seen during the first peak. AT2017jfs has an initial temperature corresponding to an ionized gas (7000 K) and the spectrum shows signatures of interaction with an optically thick circumstellar medium (CSM), due to the strong electron scattering wings on the Balmer lines, Ca ii and Fe ii. On the other hand, the lower temperature of M31-LRN-2015 (5000 K) corresponds to mostly neutral gas and shows the same elements in absorption. The H and H emission is likely related to recombination in an optically thin shell, surrounding the main outburst.
The evolution towards colder temperatures is similar to V838 Mon, where we see the appearance of TiO molecular absorption features. The H line, which disappeared between 11 and 37 days, starts to become detectable again at 47 days. We see very different signatures for spectra of 2008S-like transients taken at a similar phase. For example, M51 OT2019-1 (Jencson et al., 2019a) shows a much hotter continuum, and broadened Balmer emission lines due to electron scattering. These transients also show the Ca ii 3933, 3968 doublet in absorption, where de-excitation leads to emission in the Ca NIR triplet, followed by a final forbidden transition of [Ca ii] 7291, 7323. This emission is not detected in LRNe.
The late time spectrum of M31-LRN-2015 is analogous to other Galactic (V1309 Sco; Kamiński et al., 2015) and extragalactic (M101-OT2015; Blagorodnova et al., 2017) stellar mergers. The cold stellar photosphere shows almost no flux at wavelengths shorter than 7000Å, and the spectrum is dominated by molecular absorption features. Some low-ionization elements are detected as narrow emission lines, likely generated in an optically thin shell irradiated by unobscured emission from the central object. The increased optical depth due to formation of dust can also explain the blueshift commonly observed in the the H profiles.
3.3 Constraints on progenitor dust
Based on the archival SDSS and CFHT imaging data presented in Dong et al. (2015), we argue that the progenitor star had a relatively constant optical luminosity between 2002 and 2009. The photometry derived for this period agrees with the HST magnitudes 0.03 and in 2004, about 10.4 years before the outburst peak (Dong et al., 2015; Williams et al., 2015). The constant luminosity of the progenitor allows us to combine the optical data with Spitzer upper limits obtained 9.4 years before the outburst to place constraints on the pre-existing dust in the system.
Our simple progenitor model assumes optically thin dust of uniform grain size m, which radiates at a single equilibrium temperature . Given the abundance of oxygen-rich molecules in the ejecta of LRNe, we assume silicate dust for our analysis. The assumption of a different dust composition does not significantly alter our results.
The specific luminosity for a dust grain of radius and temperature radiating at wavelength is given by
| (1) |
where is the Plank function, and is the dust efficiency factor for extinction (absorption plus scattering). For silicate dust we use the tabulated values of Laor & Draine (1993)333Available from https://www.astro.princeton.edu/~draine/dust/dust.diel.html. Introducing the dust opacity, , where is the dust bulk density ( g cm-3 for graphitic dust and 3.5 g cm-3 for silicate), we can rewrite the equation as
| (2) |
where is the dust mass. The flux density for an observer at distance is
| (3) |
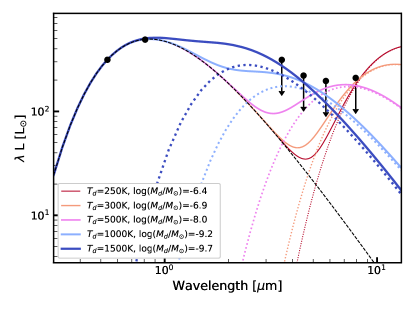
For our analysis of the progenitor SED, we initially fit the optical HST magnitudes with a single black body to estimate its contribution to the mid-infrared flux. The best fit given our extinction is K, R⊙ and bolometric luminosity of L⊙. Next, for each dust temperature K, we derive the maximum dust mass that is still consistent with a non-detection.
Our results, depicted in Figure 6, show that although the temperature has a strong influence on the dust mass, we still can place meaningful constraints for warmer dust. For example, for the hottest temperatures of we find that M⊙ and for K M⊙. For temperatures of 300 K and 100 K the peak of the emission shifts further into the far infrared, increasing the limits to M⊙ and M⊙. Due to the lack of far infrared measurements, our limits for colder dust are not that constraining, so we can not rule out the presence of a cold (30 K) dust shell, such as the one detected for the remnant of V1309 Sco (Tylenda & Kamiński, 2016).
3.4 Pre-outburst progenitor evolution
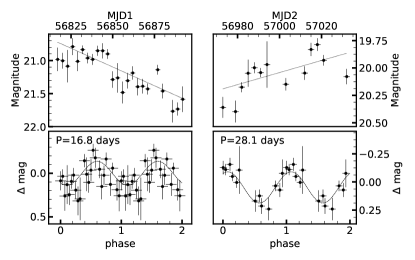
The extensive coverage of M31 by CFHT and the PTF/iPTF surveys since 2010 provides enough data to study the evolution of the progenitor up to five years before its outburst. Using the PTFIDE pipeline, we obtained hundreds of forced photometry measurements for observations taken between 2010 and the onset of the nova in January 2015, as shown in Figure 2. The Mould- band luminosity remained mostly below our detection threshold up to 2 years before the outburst. After that, in what we call phase 1, it steadily increased in brightness by nearly two magnitudes between 2 and 1 years. During phase 2, at the start of the summer 2014 ( days) the progenitor was an additional magnitude brighter than in spring 2014, but faded by nearly a magnitude over the next three months. During phase 3, starting about 150 days prior to the January 2015 outburst, the Mould- band flux reached its overall maximum of 20 mag and then remained relatively steady, with some minor fluctuations.
CFHT data taken at about 3 months before eruption (Dong et al., 2015) agrees with iPTF observations (see insets in Figure 3). A single black body fit to the and -bands SED shows that the temperature of the emission was 6300 K with a radius of 55 R⊙, which indicates that the precursor emission became hotter than the progenitor and its photospheric radius increased. The lack of extensive simultaneous multi-band photometry during the whole precursor period makes it difficult to determine whether the optical luminosity is linked to the apparent expansion and cooling of the photosphere, similar to the behaviour displayed by other stellar mergers such as V1309 Sco (Pejcha et al., 2017) or M101-2015OT (Blagorodnova et al., 2017), or to tidal heating (MacLeod et al., 2017), where the atmosphere of the primary star is disturbed by the secondary. Like other stellar mergers, M31-LRN-2015 also shows a smooth, monotonic brightening lasting about two years. After this, the light curve also shows a dip, followed by a short precursor, similar to the one observed for V838 Mon (Munari et al., 2002) or V1309 Sco. This behaviour is likely too complex to be caused by tidal heating. A possible explanation is the loss of mass from the system through the the L2 point during the RLOF, as proposed by Pejcha et al. (2017).
Mass loss progressively drains angular momentum from the binary, which causes the orbit to shrink. The outflowing gas can then form an expanding photosphere around the binary. Pejcha et al. (2017) showed that the slow rise of V1309 Sco for thousands of orbits prior to merger could be explained by such dynamical mass loss. Assuming that the brightening in phase 1 of M31-LRN-2015 is due to an expanding optically thick outflow, we would expect the luminosity to scale as , where is the period of the system. As the mass loss increases, the outflow is expected to completely engulf the binary, thereby causing the luminosity to decrease (phase 2). The observed emission now comes from shock interactions created by the L2 outflow. Depending on the binary mass ratio, further mass loss from the system can either form an expanding photosphere, or be marginally bound to the binary and interact with it. Either of these scenarios leads to a gradual increase in the luminosity (phase 3), as the orbit shrinks further until the binary finally merges, leading to the outburst.
Though the general trend of the M31-LRN-2015 light curve is similar to that of the V1309 Sco, there are a few differences. The most prominent difference is that the pre-outburst brightening of V1309 Sco smoothly transitioned into the outburst, with the photosphere expanding , whereas for M31-LRN-2015 the pre-outburst brightening reached a constant value before the main outburst. In this regard, M31-LRN-2015 is more similar to V838 Mon. Before its first eruption, V838 Mon brightened by more than 3 mags and plateaued for around 25 days (Munari et al., 2002). Tylenda (2005) found that during this phase, the photospheric radius of V838 Mon remained almost the same. This could occur if the mass ejected during the brightening is marginally bound, and falls back to interact with the binary (Pejcha et al., 2016a). For outflows launched in synchronicity with the binary, a necessary, but not sufficient condition is the binary mass ratio to be 0.064 or 0.78.
Close inspection of phases 2 and 3 shows that the residuals seem to be correlated once the general trend is removed, as the scatter in our measurements is larger than the error bars (the uncertainties for phase 1 are too large for a reliable analysis). Similar characteristics were observed for V1309 Sco (Pejcha et al., 2017), where the amplitude of the residuals oscillated by 0.3 mag. Deviations from the rise were observed, but no period could be determined for the residuals. These residuals were interpreted as being due to the clumpiness and asymmetry of the mass lost from the binary. Motivated by the apparent correlation, we tested our light curve for periodicity in phase 2 (between MJD 5680056895) and phase 3 (MJD 5696057035). After removing a linear trend from our data, we used the Lomb-Scargle (Lomb, 1976; Scargle, 1982) algorithm, to produce a periodogram using different binnings and offsets of the bins. For phase 2, none of our best fits exceeded a power of 0.5, indicating a low significance for any period. However, the results consistently show one best period around 17 days (see Fig. 7). Averaging all the periods for binnings from 1 to 4 days (weighted by their power) allows us to derive a possible period of days. For phase 3, the power increases above 0.7. The average period for this phase is days, nearly double than for phase 2.
If the period detected in phase 2 is real, its variability can be used to infer the characteristics of the binary system. MacLeod et al. (2017) derived a mass of 35.5 M⊙ and a radius of 2835R⊙ for the primary (depending on reddening). The period of a test mass at the surface of this binary is days depending on the mass and radius. However, if the primary is undergoing RLOF, the inferred radius corresponds to the Roche lobe of the primary. For our extinction value of =0.255, the primary has M⊙ and 32 R⊙. The period for the binary for a mass ratio of () is in the range of 1528 days.
Our first period of days would be in agreement with RLOF scenario with . However, an ellipsoidal variation would actually imply a period twice as large, which is outside the expected range we just derived. Our second period of days requires the binary to be of nearly equal mass. Ideally, earlier stages of the light curve would have provided an independent verification of the variability, but this is not possible due to the low SNR of the individual detections in our data.
The detection of periodicity at later stages of the lightcurve is nevertheless surprising, as the binary is expected to be completely engulfed at this point. For example, an apparent increase in the period was observed in the early phases of the V1309 Sco light curve, when the phased light curve changed from a double hump profile to a single hump, effectively doubling the detected period from 0.7 to 1.4 days (Tylenda et al., 2011). This doubling of the period was attributed to the asymmetric nature of the L2 mass loss, in that the ejected mass trailed around the binary and partly obscured the system. Provided the period for M31-LRN-2015 has increased by nearly a factor of 2 from phase 2 to phase 3, it could possibly be a manifestation of the same phenomenon as in V1309 Sco. It is also likely that the binary is in fact completely engulfed by the dust at this point, and the observed period is a result of interactions in the L2 mass outflow, as analyzed for the lightcurve of V1309 Sco (Pejcha, 2014).
3.5 Post-Outburst Remnant Evolution
The late time photometric evolution of M31-LRN-2015 was monitored in the infrared by a combination of ground and space telescopes, as detailed in Section 2.2. In order to analyze the SEDs of the transient, we fixed the times and values for the NIR observations, and linearly interpolated the Spitzer and optical observations to those epochs. In total, we obtained the SED for seven post-peak epochs from at 43 days up to 3.5 years post peak.
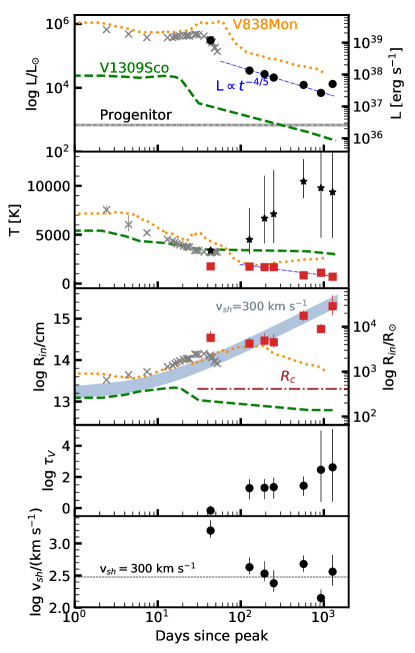
Following the methods of Adams & Kochanek (2015) and Adams et al. (2016, 2017), we modelled the SEDs with the dusty radiative transfer code DUSTY (Ivezic & Elitzur, 1997; Ivezic et al., 1999; Elitzur & Ivezić, 2001). In these models, DUSTY is embedded in an Markov Chain Monte Carlo (MCMC) wrapper to estimate the model parameters and their uncertainties. For the central source, we assume a black body radiation with a uniform prior on the temperature of 2500 K. The dust is treated as a shell with density profile . We assume that the shell was launched on the date of discovery (2015 Jan 14th), when the object brightened significantly. The velocity of the shell, , is computed as the ratio between the outer radius and the time elapsed since its ejection. In our analysis, we fix the outer radius of the dust shell to be twice the inner dust radius, . The temperature of the dust at the inner radius is and at the outer radius is . We examine optical depth values in the visual band within the range .
For our analysis, we tried with both silicate and graphitic grains from Draine & Lee (1984). For the dust grain sizes, we assume the standard MRN (Mathis et al., 1977) distribution function given by , with q = 3.5, m and m. Finally, the reddening from the Milky Way and within the host galaxy was included as a fixed parameter with =0.255.
One limitation of our analysis is the assumption of spherical symmetry. Outflows from stellar mergers are likely equatorial, due to previous episodes of mass loss in the binary orbital plane (Metzger & Pejcha, 2017; MacLeod et al., 2018a; Reichardt et al., 2019). Therefore, the estimated dust optical depth could be an over or underestimation depending on the viewing angle.
The best fit models for both silicate and graphitic dust analysis are shown in Figure 8. The model parameters and their 1 uncertainties are provided in Table 4, and depicted in Figure 9. Next we highlight the most important results of our analysis.
| Dust | Date | Phase | log | log | log | |||||
|---|---|---|---|---|---|---|---|---|---|---|
| model | [UTC] | [d] | () | [K] | (/cm) | [K] | (/km s-1) | [M⊙ ] | ||
| silicate | 2004-08-16 | -3811 | 7.8 | |||||||
| silicate | 2015-03-06 | 43 | 1.0 | |||||||
| silicate | 2015-05-29 | 127 | 1.5 | |||||||
| silicate | 2015-08-03 | 193 | 2.2 | |||||||
| silicate | 2015-09-28 | 249 | 2.0 | |||||||
| silicate | 2016-08-15 | 571 | 4.7 | |||||||
| silicate | 2017-08-03 | 924 | 1.3 | |||||||
| silicate | 2018-07-21 | 1276 | 2.1 | |||||||
| graphite | 2004-08-16 | -3811 | 2.7 | |||||||
| graphite | 2015-03-06 | 43 | 3.9 | |||||||
| graphite | 2015-05-29 | 127 | 1.6 | |||||||
| graphite | 2015-08-03 | 193 | 2.0 | |||||||
| graphite | 2015-09-28 | 249 | 1.8 | |||||||
| graphite | 2016-08-15 | 571 | 4.2 | |||||||
| graphite | 2017-08-03 | 924 | 9.5 | |||||||
| graphite | 2018-07-21 | 1276 | 2.0 |
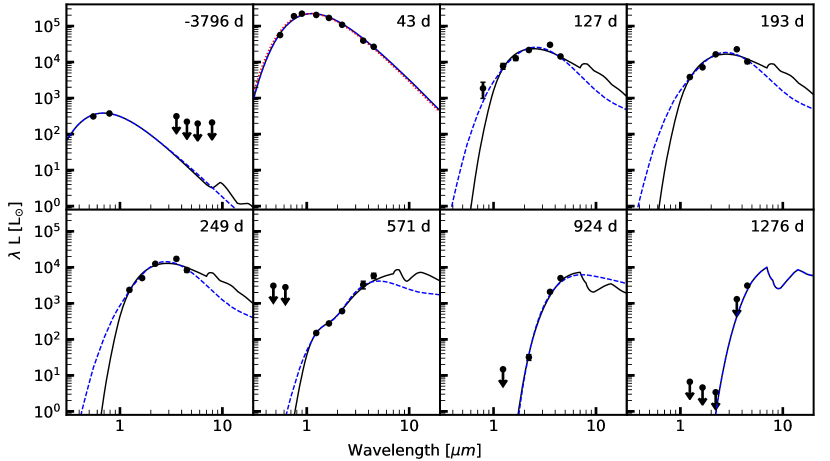
The DUSTY analysis of the progenitor SED obtained at 3795 days (10.4 years prior to the outburst) favours optically thin dust. This is consistent with our analysis in Section 3.5, where for a dust temperature of K the total dust mass in the system was below 10-7 M⊙.
Our earliest full optical to MIR SED is located towards the end of the -band plateau at 43 days. At this stage, the transient is well-fit by a single component 3400 K blackbody and a radius of 1700 R⊙, which is consistent with the size of the ejecta if assuming that it expanded at a uniform velocity of 300 km s-1. Albeit the evidence of dust at this phase is small (see the 43 days panel in Figure 8), we discuss the possible implications. If dust is present, it is optically thin and located far from the stellar photosphere. Our spectrum taken at +47.4 days already shows signs for TiO absorption, in agreement with a cold stellar temperature. The shell has a dust temperature of 1750 K, which would allow the dust condensation process to take place. If ejected around the discovery date, the large extent of this shell implies a much faster velocity than the velocity of the photosphere, with 1580 km s-1. The most likely scenario is that this shell was already formed during the years or months preceding the eruption. For example, if the gas travelled from the system at the escape velocity of 250 km s-1 (MacLeod et al., 2017), a thin shell could have been ejected 160 days before the outburst peak, which coincides with the luminosity increase in the transient’s light curve (phase 3).
By 127 days, the emission in the optical has almost faded below detection, as the dust shell has become optically thick () and has started to reprocess most of the radiation from the obscured remnant. The temperature of the star appears slightly hotter than during the plateau, with K. The radius of this shell is 4000 R⊙. Within the errors, this is consistent with the estimates for the previous phase when the shell had to be optically thin. The estimated temperature of this shell is also similar, K, which is close to the threshold for the condensation of O-rich minerals (Lodders, 2003).
A couple of months later, at 193 days and 249 days, we observe a continuous decrease in the bolometric luminosity of the source. Although the temperature of the star increases to K, the temperature and the inner radius of the dust shell remains relatively constant. Over the first year of observations, the optical depth of the shell also remains stable.
A major change in the system is observed at 571 days (1.5 years post-outburst). At this time, the SED has clearly developed two distinct emission components. While the temperature of the central star has risen even further to K, the temperature of the dust has cooled to 800 K. The shell also appears four times larger than before with R⊙.
After this phase, our last two epochs taken at 2.5 and 3.5 years show that the star possibly maintains a temperature of K. The lack of optical data makes this temperature mostly dependent on our prior. The dust temperature at 2.5 years appears slightly warmer than before, 1100 K and its internal radius shrinks to R⊙. However, by 3.5 years it cools again to 700 K and expands to its largest value of R⊙. The optical depth for these last two epochs is . Although our analysis for this phase is mostly based on non-detections, we suggest a possible final increase in the total luminosity of the source.
To summarize our analysis, we see that dust formation occurs in three main episodes. First, there is weak evidence for an initial ejection of gas at 160 days before the outburst, forming an optically thin shell of warm dust present during the post peak plateau.
The second episode takes place during the first 1.5 years after the outburst. The shell cools slowly, forming a moderate amount of dust (). Its inner radius is mostly consistent with the location of matter ejected at km s-1 near the discovery date (see Figure 9).
The final episode includes epochs later than 2.5 years. They are characterized by large optical depths, with values 200. In the first epoch, there is an apparent shrinkage of the inner radius. This measurement is not in agreement with the expanding shell trend, which may be a limitation of our model due to the limited data on the source’s SED. However, if the radius contraction is real, we attribute it to an increase in the dust opacity, perhaps due to the formation of smaller dust grains deeper in the ejecta (see Iaconi et al. (2020)) or to an increase in the dust temperature due to shocks. This argument is supported by our last epoch at 3.5 years: once the dust has cooled again, the radius seems to return to the trend of an expanding shell. Progressive cooling of the shell allows further dust condensation, increasing its mass up to an order of magnitude (see Table 4).
3.6 Estimate of the ejecta mass
For a shell with total ejecta mass and radius , the optical depth in the visual band is defined as
| (4) |
Provided our models fit for and the shell inner radius, we can estimate the total ejected mass as
| (5) |
Given that cm2g-1 for a typical dust-to-gas ratio (Ossenkopf & Henning, 1994), we derive the mass of the shell at different epochs (see Table 4). For our last epoch SED and adopting =50 cm2/g we derive 0.21 M⊙, which is consistent with the estimates by Williams et al. (2015) and MacLeod et al. (2017). Nevertheless, this value is likely only a lower limit, as simulations have shown that dust formation continues in the inner regions of the ejecta many years after the outburst has faded (Iaconi et al., 2020).
This estimate brings some tension with the models of Metzger & Pejcha (2017). In their shock powered scenario, the same luminosity would require a substantially lower ejecta mass than the 0.3 M⊙ derived for a recombination scenario (MacLeod et al., 2017). For shell velocities in the range of km s-1 the ejecta mass would drop by a factor of , requiring at most 0.1 M⊙. However, assumptions about the gas opacity can introduce large systematic errors in the mass estimates and remove the discrepancy.
4 Discussion
4.1 The origin of the precursor emission
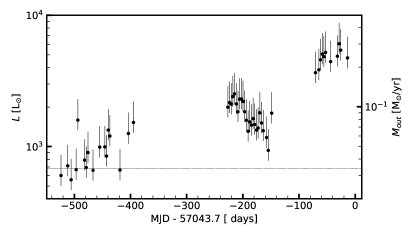
Our observations show an increase in the luminosity prior to the primary transient. One possible origin for the brightening is the dissipation of energy by shocks within the spiral stream that forms around the binary once the gas has left the L2 point. In order to infer the mass loss required to power this emission, we first reconstruct the total luminosity of the system (see Figure 10). We assume a black body emission at the estimated temperature of the progenitor star ( K). Scaling the synthetic photometry of the black body to the observed flux in -band allows us to estimate the total bolometric luminosity of the system. We vary between 3500 and 8000 K, to illustrate the effect of the temperature uncertainty.
Following Pejcha et al. (2016a), the luminosity of an optically thin outflow powered by the dissipation of energy from shocks within the stream is
| (6) |
where we adopt with . When matched to the observed luminosity, the resulting mass loss rate is shown in the left axis in Figure 10. The integrated mass loss within this period is M⊙.
For an optically thick outflow, not all the energy is radiated, as part goes into the adiabatic expansion of the gas. Numerical results presented in Pejcha et al. (2016a) showed that the maximum asymptotic luminosity of the outflow has a weak dependence on the vertical optical depth of the flow, with
| (7) |
Hence, if the temperature of the outflow is maintained constant, we should interpret our mass loss estimates as lower limits. However, a lower value could still be compatible with the observed luminosity. For example, an increase in the temperature at which matter is ejected from L2 can drive the spiral stream to becomes wider, causing the collisions to occur closer to the binary and increasing the radiative efficieny of the outflow (Pejcha et al., 2016b; Pejcha et al., 2017). Alternatively, if the outflow is bound to the system, it will form a circumbinary torus (MacLeod et al., 2018b), which can dissipate energy more efficiently than the thin disk approach.
4.2 Late time evolution of the remnant
The luminosity evolution of M31-LRN-2015 at late times (after the termination of the plateau) can be modelled as gravitational contraction of an inflated envelope surrounding the remnant. Similar explanations have been given for the post-outburst luminosity declines observed in V4332 Sgr and V838 Mon. Tylenda et al. (2005) models the photometric evolution assuming gravitational contraction of an envelope with binding energy
| (8) |
where is the mass of the remnant, is the mass of the envelope, is the inner radius of the envelope and is the outer radius of the envelope. If the luminosity is primarily from gravitational contraction, then
| (9) |
and since ,
| (10) |
For sake of simplicity, we will assume constant even though our SED analysis shows a possible increase in the temperature. In these phases our estimate of is strongly influenced by our priors and we consider our approximation acceptable for illustrative purposes. With fixed, Eqn 10 can be integrated to
| (11) |
where is the envelope radius at the start of the contraction at (). In this simplified model, the late-time luminosity evolution of a gravitationally settling envelope should be , which is plotted in the upper panel of Figure 9. This trend, similar to the one for V838 Mon and V1309 Sco, is observed until 2.5 years after peak. After that, the object seems to increase in luminosity possibly due to shocks in the ejecta.
4.3 The effect of dust driven winds
Dust-driven winds are one of the main mechanisms in removing the extended envelopes in asymptotic giant-branch (AGB) stars. The low-temperature and high density environments generated by stellar pulsations are suitable sites for dust growth. Because of the coupling between dust and gas, the radiation pressure from the star on dust grains provides an efficient way to accelerate the outermost layers to super-sonic velocities.
In the case of stellar mergers or successful CE remnants, the envelope has an expanding unbound component, but there is also a significant amount of gas which is still gravitationally bound to the system (Pejcha et al., 2016a; MacLeod et al., 2018b). If this gas is located beyond the dust condensation radius , the dust grains will be able to form and grow. The radiation pressure on the bound gas will eventually accelerate the grains to super-sonic speeds and allow gas to escape from the system.
Following Glanz & Perets (2018), we define the dust condensation radius using the properties of the primary star before the start of the CE
| (12) |
Assuming the progenitor parameters (, ) derived in Section 3.3, a condensation temperature of K will be reached at R⊙. During the outburst, this radius is well within the photosphere of the nova, which is located at R⊙, as shown in Figure 9.
Although a detailed analysis of the dust-driven outflows for M31-LRN-2015 is outside of the scope of this work (see Iaconi et al. (2020) for an analysis of dust formation in CE ejecta), we would like to highlight that this process may provide the long-sought channel for unbinding large part of the gas from binary systems after the spiral-in and common-envelope ejection had taken place.
5 Summary and conclusions
In this work we have made an extended observational study of the stellar merger M31-LRN-2015, from 5 years prior the peak, to 5 years after the peak. The main conclusions of our study are:
-
•
The progenitor of M31-LRN-2015 did not have a detectable dust emission component, which sets an upper limit on the dust masses between and M⊙ for optically thin dust with temperatures of 250 K and 1500 K respectively.
-
•
The system began to brighten 2 years before peak. At about 200 days, the light curve dimmed by 1 mag, but the brightening resumed shortly afterwards. This complex luminosity evolution is best explained by the RLOF of the primary and mass loss from L2 point. Assuming the observed emission is mainly powered by shocks within the self-intersecting stream, the total mass loss during the precursor phase is M⊙.
-
•
The light curve of the precursor may show a period of 16.80.3 days in the dimming phase and 28.11.4 days in the brightening phase. Although the significance of these period detections is low, we tentatively attribute this periodicity to the characteristics of the outflow from the binary, analogous to the trend observed in V1309 Sco.
-
•
The spectroscopic evolution of the merger initially shows a 5000 K continuum with a superposed forest of narrow absorption lines from low ionization elements. After peak, the temperature of the continuum quickly drops, and strong molecular absorption features of TiO and VO appear at +47 days. By +140 days, the object has no detectable emission blueward of 8000 Å and its spectrum resembles a Mira-like M9e type star.
-
•
Before peak, the spectrum shows an H emission component centred at the rest-frame velocity. The line temporarily disappears during the plateau phase, and then reappears with a blueshift of 300 km s-1. The redshifted component is likely obscured by dust formed in the eruption.
-
•
During the post-peak light curve plateau, the SED suggests the existence of an optically thin dust shell located outside the expanding photosphere of the remnant star. For gas at the system’s escape velocity, the shell would have been ejected about half a year before the nova event, coinciding with the last brightening episode in the precursor emission.
-
•
After the end of the plateau, the luminosity decreases at a rate consistent with a gravitationally settling giant star. While the merger remnant may become hotter with time, the dust shell cools down from 1700 K to K.
-
•
At late times, the ejecta forms an optically thick () shell that totally obscures the stellar remnant in optical and NIR wavelengths. The shell has an estimated mass of M⊙, in agreement with previous works. Its inner radius is located beyond the dust condensation radius, allowing radiation pressure to further accelerate this dusty matter.
The data and analysis presented in this work shows the importance of late time follow-up for a stellar merger in the infrared, revealing the fast dust formation mechanisms, which quickly obscure the nova remnant. Due to its large optical depth, the late-time merger remnant is undetectable in optical and near-infrared wavelenghts, although still visible in the mid-infrared. Some of the SPRITEs (eSPecially Red Intermediate-luminosity Transient Events) reported by the SPIRITS survey (Kasliwal et al., 2017; Jencson et al., 2019b) show similar characteristics to M31-LRN-2015 at late times, and may also be stellar mergers. The progressive evolution of the object’s emission into longer wavelengths makes it an exciting target for the James Webb Space Telescope (JWST).
Acknowledgements
N. B. would like to thank O. Pejcha, M. MacLeod, B. Metzer, O. De Marco and N. Soker for useful discussions, A. Kurtenkov and S. C. Williams for making available the spectra of M31-LRN-2015, A. Pastorello for data on AT2017fjs, and T. Kaminski for the spectrum of V1309Sco. To M. Fraser, D. Perley, and R. M. Wagner for observations and data reduction, and to T. Szalai for the dust emission models. This work is part of the research programme VENI, with project number 016.192.277, which is (partly) financed by the Netherlands Organisation for Scientific Research (NWO). SK acknowledges the financial support of the Polish National Science Center (NCN) through the OPUS grant 2018/31/B/ST9/00334. P.E.N. acknowledges support from the DOE under grant DE-AC02-05CH11231, Analytical Modeling for Extreme-Scale Computing Environments. CSK is supported by NSF grants AST-1908570 and AST-1814440. This research benefited from interactions with Natasha Ivanova, Brian Metzger and Lars Bildsten that were funded by the Gordon and Betty Moore Foundation through Grant GBMF5076. The Intermediate Palomar Transient Factory project is a scientific collaboration among the California Institute of Technology, Los Alamos National Laboratory, the University of Wisconsin, Milwaukee, the Oskar Klein Center, the Weizmann Institute of Science, the TANGO Program of the University System of Taiwan, and the Kavli Institute for the Physics and Mathematics of the Universe. The WHT spectrum was taken under program (2014B/P29). This research used resources of the National Energy Research Scientific Computing Center, a DOE Office of Science User Facility supported by the Office of Science of the U.S. Department of Energy under Contract No. DE-AC02-05CH11231.
Some of the data presented herein were obtained at the W.M. Keck Observatory, which is operated as a scientific partnership among the California Institute of Technology, the University of California and the National Aeronautics and Space Administration. The Observatory was made possible by the generous financial support of the W.M. Keck Foundation. The authors wish to recognize and acknowledge the very significant cultural role and reverence that the summit of Maunakea has always had within the indigenous Hawaiian community. We are most fortunate to have the opportunity to conduct observations from this mountain. This work is based in part on observations made with the Large Binocular Telescope. The LBT is an international collaboration among institutions in the United States, Italy and Germany. The LBT Corporation partners are: The University of Arizona on behalf of the Arizona university system; Istituto Nazionale di Astrofisica, Italy; LBT Beteiligungsge- sellschaft, Germany, representing the Max Planck Society, the Astrophysical Institute Potsdam, and Heidelberg University; The Ohio State University; The Research Corporation, on behalf of The University of Notre Dame, University of Minnesota and University of Virginia. Part of this research was carried out at the Jet Propulsion Laboratory, California Institute of Technology, under a contract with the National Aeronautics and Space Administration. We acknowledge Telescope Access Program (TAP) funded by the NAOC, CAS, and the Special Fund for Astronomy from the Ministry of Finance. This work is based in part on observations made with the Spitzer Space Telescope, which is operated by the Jet Propulsion Laboratory, California Institute of Technology under a contract with NASA. This research made use of Astropy,444http://www.astropy.org a community-developed core Python package for Astronomy (Astropy Collaboration et al., 2013, 2018).
Data availability: The photometric data and analysis results underlying this article are available in the article and in its online supplementary material. The spectroscopic data underlying this article are available in the online repository WiseRep (Yaron & Gal-Yam, 2012) at https://wiserep.weizmann.ac.il, and can be accessed with the id “iPTF15t”.
References
- Adams & Kochanek (2015) Adams S. M., Kochanek C. S., 2015, MNRAS, 452, 2195
- Adams et al. (2015a) Adams S., Kochanek C. S., Dong S., Wagner R. M., 2015a, The Astronomer’s Telegram, 7468
- Adams et al. (2015b) Adams S., Kochanek C. S., Dong S., Wagner R. M., 2015b, The Astronomer’s Telegram, 7485, 1
- Adams et al. (2016) Adams S. M., Kochanek C. S., Prieto J. L., Dai X., Shappee B. J., Stanek K. Z., 2016, MNRAS, 460, 1645
- Adams et al. (2017) Adams S. M., Kochanek C. S., Gerke J. R., Stanek K. Z., Dai X., 2017, MNRAS, 468, 4968
- Adams et al. (2018) Adams S. M., et al., 2018, PASP, 130, 034202
- Astropy Collaboration et al. (2013) Astropy Collaboration et al., 2013, A&A, 558, A33
- Astropy Collaboration et al. (2018) Astropy Collaboration et al., 2018, AJ, 156, 123
- Bersier et al. (2015) Bersier D., Kochanek C. S., Wagner R. M., Adams S., Dong S., 2015, The Astronomer’s Telegram, 7537
- Bildsten et al. (2007) Bildsten L., Shen K. J., Weinberg N. N., Nelemans G., 2007, ApJ, 662, L95
- Blagorodnova et al. (2017) Blagorodnova N., et al., 2017, ApJ, 834, 107
- Bond et al. (2009) Bond H. E., Bedin L. R., Bonanos A. Z., Humphreys R. M., Monard L. A. G. B., Prieto J. L., Walter F. M., 2009, ApJ, 695, L154
- Botticella et al. (2009) Botticella M. T., et al., 2009, MNRAS, 398, 1041
- Chambers et al. (2016) Chambers K. C., et al., 2016, arXiv:1612.05560,
- Chemin et al. (2009) Chemin L., Carignan C., Foster T., 2009, ApJ, 705, 1395
- Darwin (1879) Darwin G. H., 1879, Proceedings of the Royal Society of London Series I, 29, 168
- Dominik et al. (2012) Dominik M., Belczynski K., Fryer C., Holz D. E., Berti E., Bulik T., Mand el I., O’Shaughnessy R., 2012, ApJ, 759, 52
- Dong et al. (2015) Dong S., Kochanek C. S., Adams S., Prieto J.-L., 2015, The Astronomer’s Telegram, 7173
- Draine & Lee (1984) Draine B. T., Lee H. M., 1984, ApJ, 285, 89
- Draine et al. (2014) Draine B. T., et al., 2014, ApJ, 780, 172
- Elitzur & Ivezić (2001) Elitzur M., Ivezić Ž., 2001, MNRAS, 327, 403
- Fabrika et al. (2015) Fabrika S., et al., 2015, The Astronomer’s Telegram, 6985, 1
- Fazio et al. (2004) Fazio G. G., et al., 2004, The Astrophysical Journal Supplement Series, 154, 10
- Freedman & Madore (1990) Freedman W. L., Madore B. F., 1990, ApJ, 365, 186
- Gehrz et al. (2007) Gehrz R. D., et al., 2007, Review of Scientific Instruments, 78, 011302
- Geier & Pessev (2015) Geier S., Pessev P., 2015, The Astronomer’s Telegram, 8220, 1
- Giallongo et al. (2008) Giallongo E., et al., 2008, A&A, 482, 349
- Glanz & Perets (2018) Glanz H., Perets H. B., 2018, MNRAS, 478, L12
- Gunn & Stryker (1983) Gunn J. E., Stryker L. L., 1983, ApJS, 52, 121
- Harmanen et al. (2015) Harmanen J., McCollum B., Laine S., Rottler L., Bruhweiler F. C., 2015, The Astronomer’s Telegram, 7595, 1
- Hill et al. (2006) Hill J. M., Green R. F., Slagle J. H., 2006, in Society of Photo-Optical Instrumentation Engineers (SPIE) Conference Series. p. 62670Y, doi:10.1117/12.669832
- Hodgkin et al. (2015) Hodgkin S. T., et al., 2015, The Astronomer’s Telegram, 6952, 1
- Howitt et al. (2020) Howitt G., Stevenson S., Vigna-Gómez A. r., Justham S., Ivanova N., Woods T. E., Neijssel C. J., Mandel I., 2020, MNRAS, 492, 3229
- Iaconi et al. (2020) Iaconi R., Maeda K., Nozawa T., De Marco O., Reichardt T., 2020, arXiv e-prints, p. arXiv:2003.06151
- Ivanova et al. (2013a) Ivanova N., et al., 2013a, A&A Rev., 21, 59
- Ivanova et al. (2013b) Ivanova N., Justham S., Avendano Nandez J. L., Lombardi J. C., 2013b, Science, 339, 433
- Ivezic & Elitzur (1997) Ivezic Z., Elitzur M., 1997, MNRAS, 287, 799
- Ivezic et al. (1999) Ivezic Z., Nenkova M., Elitzur M., 1999, astro-ph/9910475,
- Izzard et al. (2012) Izzard R. G., Hall P. D., Tauris T. M., Tout C. A., 2012, in IAU Symposium. pp 95–102, doi:10.1017/S1743921312010769
- Jacoby et al. (1984) Jacoby G. H., Hunter D. A., Christian C. A., 1984, ApJS, 56, 257
- Jencson et al. (2019a) Jencson J. E., et al., 2019a, ApJ, 880, L20
- Jencson et al. (2019b) Jencson J. E., et al., 2019b, ApJ, 886, 40
- Kamiński & Tylenda (2011) Kamiński T., Tylenda R., 2011, A&A, 527, A75
- Kamiński et al. (2015) Kamiński T., Mason E., Tylenda R., Schmidt M. R., 2015, A&A, 580, A34
- Kamiński et al. (2017) Kamiński T., et al., 2017, A&A, 599, A59
- Kasliwal (2012) Kasliwal M. M., 2012, PASA, 29, 482
- Kasliwal et al. (2012) Kasliwal M. M., et al., 2012, ApJ, 755, 161
- Kasliwal et al. (2017) Kasliwal M. M., et al., 2017, ApJ, 839, 88
- Keenan et al. (1974) Keenan P. C., Garrison R. F., Deutsch A. J., 1974, ApJS, 28, 271
- Klencki et al. (2020) Klencki J., Nelemans G., Istrate A. G., Chruslinska M., 2020, arXiv e-prints, p. arXiv:2006.11286
- Kochanek et al. (2014) Kochanek C. S., Adams S. M., Belczynski K., 2014, MNRAS, 443, 1319
- Kulkarni (2013) Kulkarni S. R., 2013, The Astronomer’s Telegram, 4807
- Kulkarni et al. (2007) Kulkarni S. R., et al., 2007, Nature, 447, 458
- Kurtenkov et al. (2015a) Kurtenkov A. A., et al., 2015a, A&A, 578, L10
- Kurtenkov et al. (2015b) Kurtenkov A., Ovcharov E., Nedialkov P., Kostov A., Bachev R., Dimitrova R. V. M., Popov V., Valcheva A., 2015b, The Astronomer’s Telegram, 6941, 1
- Laor & Draine (1993) Laor A., Draine B. T., 1993, ApJ, 402, 441
- Law et al. (2009) Law N. M., et al., 2009, PASP, 121, 1395
- Law et al. (2010) Law N. M., et al., 2010, in Ground-based and Airborne Instrumentation for Astronomy III. p. 77353M, doi:10.1117/12.857400
- Lipunov et al. (2017) Lipunov V. M., et al., 2017, arXiv:1704.08178,
- Lodders (2003) Lodders K., 2003, ApJ, 591, 1220
- Lomb (1976) Lomb N. R., 1976, Ap&SS, 39, 447
- Lopez-Camara et al. (2020) Lopez-Camara D., Moreno Mendez E., De Colle F., 2020, arXiv e-prints, p. arXiv:2004.04158
- Lü et al. (2013) Lü G., Zhu C., Podsiadlowski P., 2013, ApJ, 768, 193
- MacLeod & Loeb (2020) MacLeod M., Loeb A., 2020, ApJ, 895, 29
- MacLeod et al. (2017) MacLeod M., Macias P., Ramirez-Ruiz E., Grindlay J., Batta A., Montes G., 2017, ApJ, 835, 282
- MacLeod et al. (2018a) MacLeod M., Ostriker E. C., Stone J. M., 2018a, ApJ, 863, 5
- MacLeod et al. (2018b) MacLeod M., Ostriker E. C., Stone J. M., 2018b, ApJ, 868, 136
- Martini et al. (1999) Martini P., Wagner R. M., Tomaney A., Rich R. M., della Valle M., Hauschildt P. H., 1999, AJ, 118, 1034
- Masci et al. (2017) Masci F. J., et al., 2017, PASP, 129, 014002
- Mason et al. (2010) Mason E., Diaz M., Williams R. E., Preston G., Bensby T., 2010, A&A, 516, A108
- Mathis et al. (1977) Mathis J. S., Rumpl W., Nordsieck K. H., 1977, ApJ, 217, 425
- Mauerhan et al. (2018) Mauerhan J. C., Van Dyk S. D., Johansson J., Fox O. D., Filippenko A. V., Graham M. L., 2018, MNRAS, 473, 3765
- Metzger & Pejcha (2017) Metzger B. D., Pejcha O., 2017, MNRAS, 471, 3200
- Montalto et al. (2009) Montalto M., Seitz S., Riffeser A., Hopp U., Lee C.-H., Schönrich R., 2009, A&A, 507, 283
- Moreno Méndez et al. (2017) Moreno Méndez E., López-Cámara D., De Colle F., 2017, MNRAS, 470, 2929
- Mould et al. (1990) Mould J., et al., 1990, ApJ, 353, L35
- Munari et al. (2002) Munari U., et al., 2002, A&A, 389, L51
- Oke et al. (1995) Oke J. B., et al., 1995, PASP, 107, 375
- Ossenkopf & Henning (1994) Ossenkopf V., Henning T., 1994, A&A, 291, 943
- Ovcharov et al. (2015) Ovcharov E., Kurtenkov A., Valcheva A., Nedialkov P., 2015, The Astronomer’s Telegram, 6924, 1
- Paczynski (1976) Paczynski B., 1976, in Eggleton P., Mitton S., Whelan J., eds, IAU Symposium Vol. 73, Structure and Evolution of Close Binary Systems. p. 75
- Pastorello & Fraser (2019) Pastorello A., Fraser M., 2019, Nature Astronomy, 3, 676
- Pastorello et al. (2019a) Pastorello A., et al., 2019a, A&A, 625, L8
- Pastorello et al. (2019b) Pastorello A., et al., 2019b, A&A, 630, A75
- Pejcha (2014) Pejcha O., 2014, ApJ, 788, 22
- Pejcha et al. (2016a) Pejcha O., Metzger B. D., Tomida K., 2016a, MNRAS, 455, 4351
- Pejcha et al. (2016b) Pejcha O., Metzger B. D., Tomida K., 2016b, MNRAS, 461, 2527
- Pejcha et al. (2017) Pejcha O., Metzger B. D., Tyles J. G., Tomida K., 2017, ApJ, 850, 59
- Pessev et al. (2015a) Pessev P., Geier S., Kurtenkov A., Nielsen L. D., Tomov T., 2015a, The Astronomer’s Telegram, 7272, 1
- Pessev et al. (2015b) Pessev P., Geier S., Kurtenkov A., Nielsen L. D., Slumstrup D., Tomov T., 2015b, The Astronomer’s Telegram, 7572, 1
- Pessev et al. (2015c) Pessev P., Geier S., Stritzinger M., Kurtenkov A., Tomov T., 2015c, The Astronomer’s Telegram, 7624, 1
- Pessev et al. (2015d) Pessev P., Geier S., Stritzinger M., Kurtenkov A., Tomov T., 2015d, The Astronomer’s Telegram, 8059, 1
- Prieto et al. (2009) Prieto J. L., Sellgren K., Thompson T. A., Kochanek C. S., 2009, ApJ, 705, 1425
- Rahmer et al. (2008) Rahmer G., Smith R., Velur V., Hale D., Law N., Bui K., Petrie H., Dekany R., 2008, in Ground-based and Airborne Instrumentation for Astronomy II. p. 70144Y, doi:10.1117/12.788086
- Rasio (1995) Rasio F. A., 1995, ApJ, 444, L41
- Rau et al. (2009) Rau A., et al., 2009, PASP, 121, 1334
- Reichardt et al. (2019) Reichardt T. A., De Marco O., Iaconi R., Tout C. A., Price D. J., 2019, MNRAS, 484, 631
- Rich et al. (1989) Rich R. M., Mould J., Picard A., Frogel J. A., Davies R., 1989, ApJ, 341, L51
- Scargle (1982) Scargle J. D., 1982, ApJ, 263, 835
- Schlafly et al. (2012) Schlafly E. F., et al., 2012, ApJ, 756, 158
- Schlegel et al. (1998) Schlegel D. J., Finkbeiner D. P., Davis M., 1998, ApJ, 500, 525
- Seifert et al. (2003) Seifert W., et al., 2003, in Iye M., Moorwood A. F. M., eds, Proc. SPIEVol. 4841, Instrument Design and Performance for Optical/Infrared Ground-based Telescopes. pp 962–973, doi:10.1117/12.459494
- Shiber & Soker (2018) Shiber S., Soker N., 2018, MNRAS, 477, 2584
- Shiber et al. (2019) Shiber S., Iaconi R., De Marco O., Soker N., 2019, MNRAS, 488, 5615
- Shumkov et al. (2015a) Shumkov V., et al., 2015a, The Astronomer’s Telegram, 6911
- Shumkov et al. (2015b) Shumkov V., et al., 2015b, The Astronomer’s Telegram, 6951, 1
- Smith et al. (2011) Smith N., Li W., Silverman J. M., Ganeshalingam M., Filippenko A. V., 2011, MNRAS, 415, 773
- Smith et al. (2016) Smith N., et al., 2016, MNRAS, 458, 950
- Srivastava et al. (2015) Srivastava M., Ashok N. M., Banerjee D. P. K., Venkataraman V., 2015, The Astronomer’s Telegram, 7236, 1
- Steele et al. (2015) Steele I. A., Williams S. C., Darnley M. J., Bode M. F., Barnsley R. M., Smith R. J., Jermak H. E., 2015, The Astronomer’s Telegram, 7555, 1
- Thompson et al. (2009) Thompson T. A., Prieto J. L., Stanek K. Z., Kistler M. D., Beacom J. F., Kochanek C. S., 2009, ApJ, 705, 1364
- Tylenda (2005) Tylenda R., 2005, A&A, 436, 1009
- Tylenda & Kamiński (2016) Tylenda R., Kamiński T., 2016, A&A, 592, A134
- Tylenda et al. (2005) Tylenda R., Crause L. A., Górny S. K., Schmidt M. R., 2005, A&A, 439, 651
- Tylenda et al. (2011) Tylenda R., et al., 2011, A&A, 528, A114
- Tylenda et al. (2013) Tylenda R., et al., 2013, A&A, 555, A16
- Vigna-Gómez et al. (2020) Vigna-Gómez A., MacLeod M., Neijssel C. J., Broekgaarden F. S., Justham S., Howitt G., de Mink S. E., Mand el I., 2020, arXiv e-prints, p. arXiv:2001.09829
- Wagner et al. (2015) Wagner R. M., Starrfield S. G., Wilber A., Kochanek C. S., Dong S., Prieto J.-L., Adams S., 2015, The Astronomer’s Telegram, 7208
- Werner et al. (2004) Werner M. W., et al., 2004, The Astrophysical Journal Supplement Series, 154, 1
- Williams et al. (2015) Williams S. C., Darnley M. J., Bode M. F., Steele I. A., 2015, ApJ, 805, L18
- Wizinowich et al. (2006) Wizinowich P. L., et al., 2006, PASP, 118, 297
- Wozniak (2000) Wozniak P. R., 2000, Acta Astron., 50, 421
- Yaron & Gal-Yam (2012) Yaron O., Gal-Yam A., 2012, PASP, 124, 668