2 Applied Sciences University Hessen-Friedberg, Friedberg, Germany
Alexander S. Gusev,
Young Stellar Complexes in the Giant Galaxy UGC 11973
Abstract
We present results of the analysis of photometric and spectroscopic
observations of the young stellar complexes in the late giant spiral galaxy UGC 11973.
Photometric analysis in the bands have been carried out for the 13 largest
complexes. For one of them, metallicity of the surrounding gas ,
the mass , and the age of the stellar complex
yr were evaluated, using spectroscopic data. It is shown
that all complexes are massive () stellar groups
younger than yr.
DOI: 10.1134/S1063772920060025
Keywords: galaxies: spiral – galaxies: star formation – galaxies: star complexes
1 INTRODUCTION
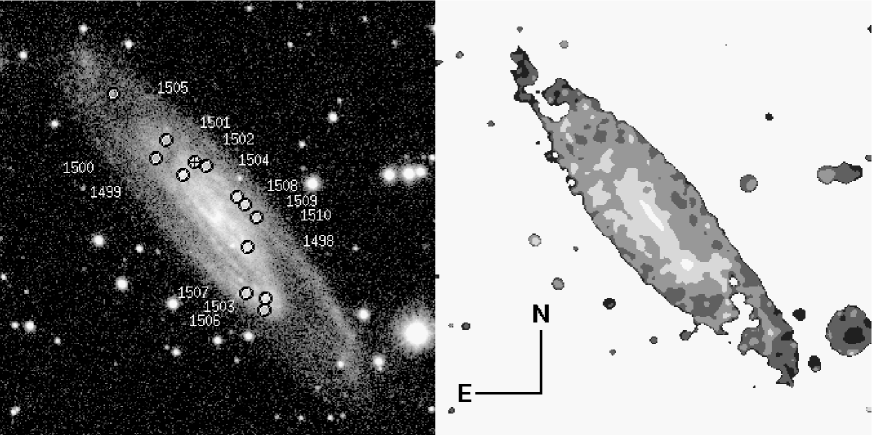
Among relatively close galaxies, UGC 11973 is one of the brightest, largest, and most massive stellar systems (see Table 1). Its radius reaches 30 kpc and absolute magnitude . The analysis of the rotation curve has shown that the total mass of the galaxy within only 10 kpc from the center (1/3 of the radius ) is (Afanas’ev et al., 1988). The total stellar mass of UGC 11973, as estimated from the luminosity in the and bands, is (Graur et al., 2017). According to observational data, in the 21 cm line, the HI mass is (Courtois & Tully, 2015). The galaxy belongs to a small group Garcia (1993), but has no nearby satellites. Despite the large inclination (), symmetric structure of UGC 11973 is clearly traced: powerful spiral arms with dust lines and a weak bar (Fig. 1).
Additionally to the large inclination, the difficulty in the study of this
galaxy is associated with its proximity to the plane of the Milky Way,
because of which the total attenuation of the light in the band exceeds
. Apparently, this explains the relatively poor knowledge about
UGC 11973. Although detailed studies of the galaxy were not carried out
(except in Afanas’ev et al., 1988), it was observed in large projects
in a wide wavelength range, from UV to radio. Observations in the radio
(Marvil et al., 2015; Condon et al., 2002), far and near IR (IRAS (Strauss et al., 1992)
and 2MASS projects (Skrutskie et al., 2006)) and optical ranges
(Gusev et al., 2015), as well as a significant brightness of the galaxy
in the UV range (GALEX
project111http://galex.stsci.edu/GR6/?page=explore&objid=
6372147238576064570),
consistently point to the active, constant in time star formation,
characteristic for the massive late-type spiral galaxies. The color
indices of UGC 11973, corrected for the Galactic absorption and
absorption due to the inclination of the disk, decrease from
and in the
central part (nucleus and bulge) to ,
in the region of spiral arms outside the
bright regions of star formation (Gusev et al., 2015)
(Fig. 1).
| Type | SAB(s)bc (3.9) | km/s | |||||
| P.A. | 59.2 kpc | ||||||
| 58.8 Mpc | km/s |
The basic information about the galaxy – morphological type, apparent magnitude , corrected for the Galactic absorption and the absorption due to the inclination of the disk absolute stellar magnitude , the inclination , and position angle P.A. of the disk, the distance , diameter along the isophote in the band with the account of the galactic absorption and absorption caused by the inclination of the galaxy , radial velocity , maximum rotation velocity , galactic absorption and absorption caused by the inclination of the galaxy – are presented in Table 1. The data on the magnitude of absorption in our Galaxy () and the morphological type of UGC 11973 are given according to the NED 222http://ned.ipac.caltech.edu/ database, the remaining parameters were taken from the HyperLEDA333http://leda.univ-lyon1.fr/ database. Note that in a number of papers the distance to the galaxy is taken as 49–55 Mpc, obtained by the Tully–Fisher method in Sorce et al. (2014). This somewhat reduces the estimates of the luminosity, mass, and linear size of UGC 11973. In particular, the latest version of the HyperLEDA provides the absolute magnitude of the galaxy . In this study, we use the values given in Table 1 based on the measurement of radial velocity of UGC 11973 (Afanas’ev et al., 1988).
The aim of this study is to analyze the photometric parameters and to estimate the physical ones of the 13 largest star formation complexes found in the galaxy. The basis for the analysis is the photometric data of the complexes that we obtained earlier, as well as the results of spectroscopic observations of complex No. 1502 (Gusev et al., 2018), which were not published previously.
This work is a part of an extensive project of the study of the physical parameters of the stellar population of the regions of current star formation in the disks of galaxies, based on the complex spectral and photometric observations (Gusev et al., 2012, 2013, 2016, 2018). The results of spectroscopic studies were published by us earlier in Gusev et al. (2012, 2013) with a single exception – the HII region (complex No. 1502) in the galaxy UGC 11973. The reason for the ”omission” was that for this HII region we were not able to measure the oxygen lines [O iii]4959 and 5007 (see Section 3.1 for more details). This required a special nonstandard method for determination of the chemical composition of the gas in the region. Such a technique was developed only in 2016 (Pilyugin & Grebel, 2016).
In the next work within the framework of the project, we plan to study physical parameters in several hundred star formation regions using, among other things, spectral data from the literature. For these regions, chemical composition of the gas will be determined by standard methods using the intensities of the oxygen lines. The nonstandard method for determination of the chemical parameters of the gas in the HII region in the galaxy UGC 11973 is, in our opinion, of independent interest.
2 OBSERVATIONS AND THEIR PROCESSING
Photometric observations of the galaxy in filters carried out at the 1.5-meter telescope of the Maidanak Observatory (Uzbekistan) were described by us earlier (Gusev et al., 2015). Identification of star formation complexes that was carried out using the SExtractor 5444http://sextractor.sourceforge.net/ program with the detection threshold above the local background equal to and the number of the pixels above the threshold, and the photometry of 13 detected complexes was described in Gusev et al. (2018). The catalog of photometric parameters of star-forming regions is also presented in the electronic form555http://lnfm1.sai.msu.ru/gusev/sfr_cat.html.
Spectral observations of one of the brightest HII regions in UGC 11973 – the complex No. 1502, located to the north and east of the center of the galaxy (see Fig. 1) – were carried out by one of the authors of this study on August 23/24, 2006 at 6-meter telescope BTA of Special Astrophysical observatory of the Russian Academy of Sciences using the SCORPIO focal reducer in the multi-slit mode (for a detailed description of the device see Afanasiev & Moiseev, 2005). An EEV 42-40 CCD camera was used as a receiver. The size of the matrix is pixels, which provides the field of view for the image scale /pixel. In multi-slit mode, the size of the slits is . Observations were carried out at air mass . The seeing was . In total, four expositions of 900 sec each were made. After each exposition, the positions of the slits were shifted left and right along the slit in the increments of 30 pixels.
To carry out standard data processing and calibration, before and after observations of the galaxy, the images of bias, the ”flat field”, the spectra of the helium-neon-argon lamp, and the comparison star BD+25∘4655 from the catalog of spectrophotometric standards of Oke (1990) were obtained.
Further processing was carried out according to the standard procedure using the ESO-MIDAS image processing system. The main stages of the processing included: elimination of the traces of cosmic rays, determination and correction of the data for the offset of the matrix amplifier (bias) and ”flat field”, transformation into the wavelength scale using the spectrum of He-Ne-Ar lamp, background subtraction, transformation of the instrumental fluxes into absolute ones according to the observations of the standard star, correction for atmospheric absorption, integration of two-dimensional spectra in the selected apertures and obtaining one-dimensional spectra of the HII region, and addition of spectra.
| Line | Flux , | Parameter | Value | Parameter | Value |
|---|---|---|---|---|---|
| 10-16erg/(scm2) | |||||
| H | (H) | ||||
| N ii]6548 | [N ii]6548+6584 | 12+(O/H) | |||
| H | [S ii]6717+6731 | ||||
| N ii]6584 | [S ii]6717/[S ii]6731 | , K | |||
| S ii]6717 | EW(H), Å | , cm-3 | |||
| S ii]6731 | EW(H), Å |
A detailed description of the methodology for the processing spectral observations was presented by us in Gusev et al. (2012, 2013).
The equivalent widths of the emission lines H and H were estimated from the spectrum of the HII region with the allowance for the continuum. Such a spectrum was constructed by subtracting the spectrum of the surrounding galactic disk substrate from the spectrum of the HII region. This made it possible to exclude the contribution of the stars and gas from the galactic disk to the radiation coming from the HII region.
Observed fluxes in the lines are presented in the left column of Table 2. The middle column of the table shows the absorption coefficient (H), corrected for interstellar light absorption relative intensities of the lines [N ii]6548+6584 and [S ii]6717+6731 (in the units of (H)), the ratio of the sulfur lines [S ii]6717/[S ii]6731, equivalent line widths of H and H lines.
Absorption of the gas emission lines was taken into account based on the Balmer decrement using the theoretical ratio H/H (Osterbrock, 1989) for the case B of recombination at the electron temperature K and analytical approximation of Whitford’s interstellar reddening law from Izotov et al. (1994). Moreover, the equivalent width of the hydrogen absorption lines EWa() was taken as 2Å, which is the average value for the HII regions (McCall et al., 1985). For the lines of other chemical elements, the value of EWa() was taken as equal to 0.
3 THE ANALYSIS OF RESULTS
3.1 Physical and chemical parameters of the gas in the star formation complex No. 1502
A number of gas characteristics can be estimated using gas emission lines. The [O iii]4959 and 5007 lines are very important for this. However, as was mentioned already in the Introduction, due to the relative weakness of these lines and large absorption in this region (see Table 2), it appeared impossible to measure them. Therefore, we carry out the analysis that is possible on the basis of the measurements of the obtained lines of hydrogen, nitrogen, and sulfur.
The classic diagrams for classification of the objects of various types of emission lines ( diagrams ([(N ii]6584/H) – ([O iii]5007/H) and ([S ii]6717+6731)/H) – ([O iii]5007/H)) allow us to determine the main mechanism of the gas excitation in the emission region. Despite the lack of the measurements of the [O iii]5007 line, we can estimate the upper limit of its intensity – ([O iii]5007/H. Given the relative intensities of the nitrogen and sulfur lines ([(N ii]6584/H) and ([S ii]6717+6731)/H), the source studied by us is located in the diagrams in the region occupied by the HII regions, that is, the objects with photoionization (according to the models of Kewley et al., 2001).
To assess the chemical composition and physical characteristics of the gas surrounding the stellar complex in the absence of data on the intensities of the oxygen lines, we can use the empirical dependences and correlations obtained by Pilyugin & Grebel (2016).
Relative intensity of the nitrogen lines indicates high metallicity of the HII region; therefore, we can use formula (9) from Pilyugin & Grebel (2016) to estimate the oxygen abundance: or , which, within the errors, corresponds to the solar metallicity. According to the relationship between the relative intensity of the nitrogen line (([(N ii]6548+6584)/(H)) and the electron temperature from Pilyugin & Grebel (2016), we estimated the gas temperature .
Such characteristics – high metallicity, close to the solar one and relatively low electron temperature – are typical for HII regions in the giant spiral galaxies. Similar O/H and values were obtained by us also for the large nearby galaxy NGC 6946 (Gusev et al., 2013), where an anticorrelation between the values of O/H and electron temperature was also noted.
The ratio of sulfur lines [S ii]6717/[S ii]6731 from the HII region corresponds to the electron density of gas cm-3.
Similar relatively low densities are characteristic for the giant HII regions observed in other galaxies (see, for example, Kennicutt, 1984; Gutiérrez & Beckman, 2010). Note that the diameter of region No. 1502 was estimated by us as 550 pc (Gusev et al., 2018), which is typical scale for stellar complexes – the largest regions of coherent star formation (Efremov, 1995).
Our estimates of the chemical and physical parameters of the gas in the region of star formation No. 1502 are presented in the right column of Table 2.
3.2 Photometric and Physical Parameters of the Star Formation Complexes in UGC 11973
The study of the earliest life stages of star formation regions and evaluation of their physical parameters is a difficult task, due to the action of gas and dust. Perhaps the most difficult task is evaluation of the age of the stellar population. While, in the closest galaxies, we can resolve a young stellar group into separate stars and to determine their age by the color-magnitude diagram (see, for instance, Whitmore et al., 2011), for the more distant galaxies, spectroscopic or photometric data or a combination of them is used. The spectroscopic method includes both an estimate of the spectral age indices (for instance, equivalent widths EW(H) and EW(H), the ratio [O iii]/H, the fluxes in the He ii emission lines, etc.) and a direct comparison of the observed spectra with the model ones (Copetti et al., 1986; Stasiñska & Leitherer, 1996; Schaerer & Vacca, 1998; Bastian et al., 2005, 2006, 2009; Konstantopoulos et al., 2009; Wofford et al., 2011). The photometric method includes comparison of the multicolor photometry data for star formation regions with predictions of the evolutionary or population synthesis models (Searle et al., 1980; Elson & Fall, 1985; Bresolin et al., 1996; Chandar et al., 2010; Hollyhead et al., 2015, 2016).
| No. | , mag | ||||
| , pc | , kpc | , % | , Myr | , | |
| 1498 | –13.290.15 | –0.270.20 | 0.210.13 | 0.080.18 | 0.340.25 |
| 700 | 6.01 | – | |||
| 1499 | –15.290.04 | –0.500.08 | 0.180.08 | 0.260.10 | 0.670.10 |
| 850 | 6.48 | – | |||
| 1500 | –13.560.12 | –0.370.30 | 0.230.16 | 0.050.21 | 0.450.22 |
| 650 | 12.96 | – | |||
| 1501 | –13.220.16 | –0.730.28 | 0.190.21 | 0.060.24 | 0.710.16 |
| 550 | 12.98 | – | |||
| 1502 | –15.990.56 | –1.190.23 | –0.340.27 | –0.060.27 | 0.190.35 |
| 550 | 14.53 | 7 | 2.01.1 | 4.61.6 | |
| 1503 | –13.550.06 | –0.620.11 | 0.250.08 | 0.410.10 | 0.700.09 |
| 650 | 14.91 | – | |||
| 1504 | –13.300.14 | –0.610.19 | 0.270.13 | – | 0.850.15 |
| 600 | 18.35 | – | |||
| 1505 | –14.060.04 | –1.290.04 | 0.110.06 | 0.140.09 | 0.470.09 |
| 550 | 19.35 | – | |||
| 1506 | –13.050.06 | –0.780.18 | –0.070.11 | 0.260.15 | –0.110.36 |
| 550 | 20.55 | – | |||
| 1507 | –14.420.04 | –0.750.09 | 0.140.06 | 0.330.07 | 0.300.08 |
| 650 | 20.74 | – | |||
| 1508 | –14.350.07 | –0.560.13 | 0.050.14 | 0.270.14 | 0.240.18 |
| 600 | 21.26 | – | |||
| 1509 | –14.430.06 | –0.570.12 | –0.100.12 | 0.180.13 | 0.300.19 |
| 500 | 22.43 | – | |||
| 1510 | –14.430.06 | –0.670.10 | 0.090.08 | 0.130.09 | 0.550.08 |
| 650 | 22.68 | – |
Although the ages estimated for the same stellar clusters using spectroscopic and photometric data are in fairly good agreement (Searle et al., 1980; Whitmore et al., 2011; Wofford et al., 2011), Kim et al. (2012), who studied individual clusters in M83, which can be resolved into stars, found that the correlation between the ages of stellar groups obtained from the ages of individual stars in the region and the ages obtained from integral color indices using the standard photometric method is not very strong.
Spectroscopic methods usually provide high-quality estimates of the age, but the latter can be determined for a limited number of objects. The main problem in estimating the photometric age is taking into account the influence of gas and dust in the measured photometric fluxes. The absence of independent data on the chemical composition and absorption leads to the degeneracy of the ”age–metallicity” and ”age–absorption” diagrams in the comparative analysis with theoretical evolutionary models of stellar clusters (Scalo, 1986).
To assess the physical parameters of the stellar population in the star formation complexes, we used the technique described in detail in Gusev et al. (2007, 2016) and tested in Bruevich et al. (2007) and Gusev et al. (2016). This is based on the observed luminosities and color indices of the objects obtained from the photometry, and the intensities of the emission lines, the estimates of metallicity and absorption in the gas, obtained from the spectroscopic observations. Then, using evolutionary models with specific chemical composition, from the luminosity and color indices of star formation regions corrected for the light absorption and the contribution of emission lines, we can estimate the mass and age of the young stellar population. When this technique is applied for solving the problem of determination of the parameters of mass and age , not only all local minima of the deviation functional are searched, but their depth is also calculated. As solution of the problem, the deepest minimum is taken.
In the simulation, version 3.1 of the Padova isochrones grid was used (see, for example, Marigo et al., 2017), which is accessible via the CMD666http://stev.oapd.inaf.it/cgi-bin/cmd online server. The sets of stellar evolutionary tracks for this version were calculated for the Salpeter initial mass function and the mass range from to .
To assess the age, a single starburst model (SSP model) was used. Although in large stellar complexes consisting of star clusters systems and OB-associations, star formation can occur over a longer period of time, the choice of star formation mode for them is ambiguous. Continuous constant-rate star formation in such systems is an extreme case. The most probable seems to be a series of star formation bursts that have various power and gaps between them. The largest contribution to the color characteristics of such a complex will be made by the last major burst of star formation. Due to the uncertainty in the history of star formation in large stellar complexes, we decided to abandon the modeling of the constant star formation mode. At the same time, it is worth remembering that the ages of the young stellar complexes that we determine are ”photometric”, but not real physical ages.
Relative contribution of the gas continuum to the radiation in wide photometric bands () was estimated using equations for the spectral intensity of radiation near the boundaries of the hydrogen series, free-free emission, and two-photon emission (Osterbrock, 1989; Kaplan & Pikelner, 1979). The contribution of the emission lines was calculated by summation of the intensities of the lines that appear in the given photometric band. The fluxes for unmeasured emission lines were calculated from the estimates of the emission measure EM, using the equations from Kaplan & Pikelner (1979) and Osterbrock (1989). In total, 18 main lines of the interstellar medium were taken into account.
In the evaluation of the ages and masses, we used color indices and , since in the case of a young stellar population, the fluxes in the bands and have weak sensitivity to the changes of the age, and their actual measurement errors increase the uncertainties of the estimates of the age and mass.
The value of luminosity in the band, , color indices , , and corrected for the light absorption and the contribution of the gas emission lines to the total flux, the estimates of the gas contribution , the age and mass obtained for the complex No. 1502, are presented in Table 3 and are shown there in boldface. For the rest of the star-forming complexes in the galaxy, we list in the table the values , , , and , corrected for the absorption in the galaxy and the absorption caused by the inclination of the UGC 11973 disk. Under the assumption that the absorption in the HII regions is greater than or equal to the sum of the absorption and and the metallicity of the stellar population in them corresponds to the solar one, we estimated the lower limit of the mass and the upper limit of the age for the remaining complexes in the galaxy.
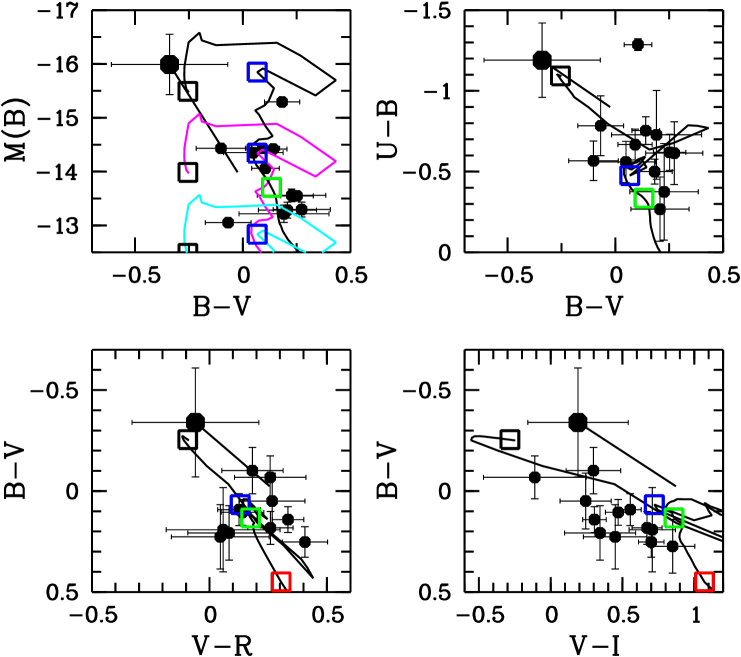
The limiting values of the mass and age correspond to the case of the absence of additional absorption in the HII region (absorption is equal to ). In the case of additional absorption caused by the dense HII envelope, the masses of objects will be larger and their ages smaller (in the diagrams in Fig. 2 this will correspond to an upward shift to the left along the absorption line). These limiting values are listed in Table 3 taking into account the errors of measurements of brightness and color indices of the objects. In Table 3 we also present galactocentric distances taking into account the inclination of the disk and the diameters of the complexes .
Figure 2 shows positions of the complexes under study in the color-magnitude diagram and two-color diagrams.
As it can be seen from the figure, in all diagrams, all star formation complexes within errors and with account for possible underestimate of absorption are located along the evolutionary tracks of aging stellar systems. We estimated the age and mass of the stellar complex No. 1502, using the methodology of Gusev et al. (2016): yr, . Remaining complexes that were not studied by the spectroscopic methods have masses and ages yr.
4 DISCUSSION
Our estimates of the age of stellar complex no. 1502 indicate the time of the last major burst of star formation in it. Apparently, the real physical age of the complex formation should be large. The time scale of star formation in stellar complexes of the size of No. 1502 (550 pc) is about 20 Myr (Efremov & Elmegreen, 1998). The estimates of the age of the complex obtained by other methods are more sensitive to the presence of a relatively ”old” stellar population and will give larger values of . In particular, the method of age determination from the equivalent width of the H line (Copetti et al., 1986; Stasiñska & Leitherer, 1996; Schaerer & Vacca, 1998), calculated for a single burst of star formation in the entire region, gives for the complex No. 1502 a slightly larger age – from 6 to 8 Myr. The reason for this is the superposition of the spectrum of the stellar population with the age exceeding 10 Myr (with a high level in continuum and absorption in the H line) over the spectrum of the last burst, which reduces the value of EW(H).
An indicator of the presence of a young stellar population with an age of less than 10 Myr is emission in the H line. Photometry of the galaxy in this line was not made; therefore, we cannot confidently state that all studied complexes are the regions of HII emission. However, according to the location in the two-color diagrams, it can be argued that at least five of the bluest complexes (Nos. 1505-1507, 1509, 1510) must be younger than 10 Myr (see Table 3 and Fig. 2).
The values of presented in Table 3 are the upper limit of the ages of the studied stellar complexes according to their color indices and . Color index , though a less reliable one, indicates even younger ages of the complexes: their position in the diagram corresponds to the age yr for all objects, except the four ones with the highest value of (see Fig. 2 and Table 3).
The complex No. 1502 does not stand out among other regions of star formation in terms of its observed photometric parameters (absolute magnitude and color indices corrected for and , see the position of the lower right ends of the black segments in Fig. 2). Its shift to the upper left corners in the diagrams is caused by the large internal absorption determined from the spectral data using the Balmer decrement. It is rather likely that other stellar complexes in UGC 11973 have similar internal absorption values and could be located in the diagrams , and other ones near the complex No. 1502.
In a highly tilted galaxy, such as UGC 11973, selection effects play an important role. Absorption caused by the inclination of the galactic disk is assumed, in the general case, to be constant. Actually, absorption varies along the disk field, it decreases from the center to the edge of the galaxy in proportion to the decrease in the surface density of the dust in the disk and from the far edge of the galaxy to the nearest one along the minor axis (see Fig. 1). Apparently, this is why most of the identified stellar complexes are located in the north-west part of UGC 11973, closest to us and located in the outer regions of the disk at the distances kpc from the galactic center (see Table 3). Due to selection effects, we do not analyze the spatial distribution of the complexes in the galaxy.
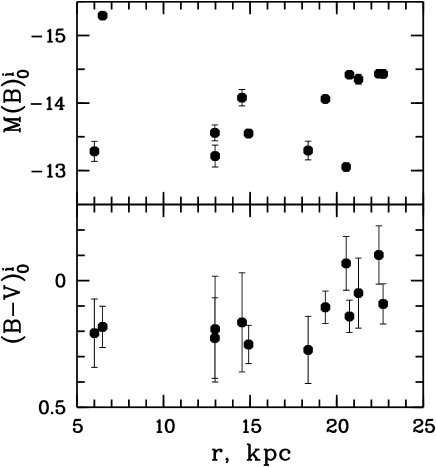
It should be noted that the complexes closer to the center of the galaxy are systematically less bright and more red than the outer ones (Fig. 3). The brightest complex No. 1499, which falls out of the general dependence in Fig. 3, has an area many times larger than the other ones (see Table 3).
In general, the measured and estimated parameters of the population of stellar complexes in UGC 11973 are typical for star formation regions in the large late-type spiral galaxies. A detailed analysis of the characteristics of star formation regions in the disks of galaxies of various types will be carried out by us in the next project work. The study will be based on a homogeneous catalog of photometric parameters of more than 1500 star formation regions in 19 galaxies (catalog Gusev et al., 2018), including the spectral characteristics of more than 500 HII regions.
5 CONCLUSIONS
1. We have carried out the analysis of the photometric and spectral observations of 13 young stellar complexes in the giant spiral galaxy UGC 11973. For the complex No. 1502, chemical and physical parameters of the surrounding gas, mass and age were estimated.
2. Metallicity of the gas in the vicinity of the stellar complex No. 1502 turned out to be, within errors, solar: ; the mass of the complex is , and its age is estimated as yr.
3. For remaining 12 galactic complexes we estimated the lower limit of their mass and the upper limit of their age. All complexes appeared to be massive , while their age does not exceed yr.
FUNDING
This work was partially supported by the grant of the Moscow State University Development Program ”Leading Scientific School: Physics of Stars, Relativistic Objects and Galaxies”. This work was carried out as part of a scientific project supported since 2020 by the Russian Foundation for Basic Research (RFBR) (project No. 20-02-00080).
ACKNOWLEDGEMENTS
The authors thank the referee for valuable comments and S.N. Dodonov (SAO RAS) for his help in observing with the BTA telescope.
The paper was translated by L.R. Yungelson.
References
- Afanasiev & Moiseev (2005) Afanasiev V.L. and Moiseev A.V., Astron. Lett. 31, 194 (2005).
- Afanas’ev et al. (1988) Afanas’ev V.L., Burenkov A.N., Zasov A.V., and Sil’chenko O.K., Astrofizika 29, 155 (1988).
- Bastian et al. (2005) Bastian N., Gieles M., Efremov Yu.N., and Lamers H.J.G.L.M., Astron. and Astrophys. 443, 79 (2005).
- Bastian et al. (2006) Bastian N., Emsellem E., Kissler-Patig M., and Maraston C., Astron. and Astrophys. 445, 471 (2006).
- Bastian et al. (2009) Bastian N., Trancho G., Konstantopoulos I.S., and Miller B.W., Astrophys. J. 701, 607 (2009).
- Bresolin et al. (1996) Bresolin F., Kennicutt R.C.Jr., and Stetson P.B., Astron. J. 112, 1009 (1996).
- Bruevich et al. (2007) Bruevich V.V., Gusev A.S., Ezhkova O.V., Sakhibov F.Kh., and Smirnov M.A., Astron. Rep. 51, 222 (2007).
- Chandar et al. (2010) Chandar R., Whitmore B.C., Kim H., Kaleida C. et al., Astrophys. J. 719, 966 (2010).
- Condon et al. (2002) Condon J.J., Cotton W.D., and Broderick J.J., Astron. J. 124, 675 (2002).
- Copetti et al. (1986) Copetti M.V.F., Pastoriza M.G., and Dottori H.A., Astron. and Astrophys. 156, 111 (1986).
- Courtois & Tully (2015) Courtois H.M. and Tully R.B., Monthly Not. Roy. Astron. Soc. 447, 1531 (2015).
- Efremov (1995) Efremov Yu.N., Astron. J. 110, 2757 (1995).
- Efremov & Elmegreen (1998) Efremov Y.N. and Elmegreen B., Monthly Not. Roy. Astron. Soc. 299, 588 (1998).
- Elson & Fall (1985) Elson R.A.W. and Fall S.M., Astrophys. J. 299, 211 (1985).
- Garcia (1993) Garcia A.M., Astron. and Astrophys. Suppl. Ser. 100, 47 (1993).
- Graur et al. (2017) Graur O., Bianco F.B., Huang S., Modjaz M., Shivvers I., Filippenko F.V., Li W., and Eldridge J.J., Astrophys. J. 837, 120 (2017).
- Gusev et al. (2007) Gusev A.S., Myakutin V.I., Sakhibov F.Kh., and Smirnov M.A., Astron. Rep. 51, 234 (2007).
- Gusev et al. (2012) Gusev A.S., Pilyugin L.S., Sakhibov F., Dodonov S.N., Ezhkova O.V., and Khramtsova M.S., Monthly Not. Roy. Astron. Soc. 424, 1930 (2012).
- Gusev et al. (2013) Gusev A.S., Sakhibov F.Kh., and Dodonov S.N., Astrophys. Bull. 68, 40 (2013).
- Gusev et al. (2015) Gusev A.S., Guslyakova S.A., Novikova A.P., Khramtsova M.S., Bruevich V.V., and Ezhkova O.V., Astron. Rep. 59, 899 (2015).
- Gusev et al. (2016) Gusev A.S., Sakhibov F., Piskunov A.E., Kharchenko N.V. et al., Monthly Not. Roy. Astron. Soc. 457, 3334 (2016).
- Gusev et al. (2018) Gusev A.S., Shimanovskaya E.V., Shatsky N.I., Sakhibov F., Piskunov A.E., and Kharchenko N.V., Open Astronomy 27, 98 (2018).
- Gutiérrez & Beckman (2010) Gutiérrez L. and Beckman J.E., Astrophys. J. 710, L44 (2010).
- Hollyhead et al. (2015) Hollyhead K., Bastian N., Adamo A., Silva-Villa E., Dale J., Ryon J.E., and Gazak Z., Monthly Not. Roy. Astron. Soc. 449, 1106 (2015).
- Hollyhead et al. (2016) Hollyhead K., Adamo A., Bastian N., Gieles M., and Ryon J.E., Monthly Not. Roy. Astron. Soc. 460, 2087 (2016).
- Izotov et al. (1994) Izotov Y.I., Thuan T.X., and Lipovetsky V.A., Astrophys. J. 435, 647 (1994).
- Kaplan & Pikelner (1979) Kaplan S.A. and Pikelner S.B., Physics of the Interstellar Medium (Nauka, Moscow, 1979). 592 pp. [in Russian].
- Kennicutt (1984) Kennicutt R.C., Astrophys. J. 287, 116 (1984).
- Kewley et al. (2001) Kewley L.J., Dopita M.A., Sutherland R.S., Heisler C.A., and Trevena J., Astrophys. J. 556, 121 (2001).
- Kim et al. (2012) Kim H., Whitmore B.C., Chandar R., Saha A. et al., Astrophys. J. 753, id. 26 (2012).
- Konstantopoulos et al. (2009) Konstantopoulos I.S., Bastian N., Smith L.J., Westmoquette M.S., Trancho G., and Gallagher J.S. III, Astrophys. J. 701, 1015 (2009).
- Marigo et al. (2017) Marigo P., Girardi L., Bressan A., Rosenfield P. et al., Astrophys. J. 835, id. 77 (2017).
- Marvil et al. (2015) Marvil J., Owen F., and Eilek J., Astron. J. 149, id. 32 (2015).
- McCall et al. (1985) McCall M.L., Rybski P.M., and Shields G.A., Astrophys. J. Suppl. Ser. 57, 1 (1985).
- Oke (1990) Oke J.B., Astron. J. 99, 1621 (1990).
- Osterbrock (1989) Osterbrock D.E., Astrophysics of gaseous nebulae and active galactic nuclei (Mill Valley, CA: University Science Books, 1989). 422 pp.
- Pilyugin & Grebel (2016) Pilyugin L.S. and Grebel E.K., Monthly Not. Roy. Astron. Soc. 457, 3678 (2016).
- Scalo (1986) Scalo J.M., Fundamen. Cosmic Phys. 11, 1 (1986).
- Schaerer & Vacca (1998) Schaerer D. and Vacca W.D., Astrophys. J. 497, 618 (1998).
- Searle et al. (1980) Searle L., Wilkinson A., and Bagnuolo W.G., Astrophys. J. 239, 803 (1980).
- Skrutskie et al. (2006) Skrutskie M.F., Cutri R.M., Stiening R., Weinberg M.D. et al., Astron. J. 131, 1163 (2006).
- Sorce et al. (2014) Sorce J.G., Tully R.B., Courtois H.M., Jarrett T.N., Neill J.D., and Shaya E.J., Monthly Not. Roy. Astron. Soc. 444, 527 (2014).
- Stasiñska & Leitherer (1996) Stasiñska G. and Leitherer C., Astrophys. J. Suppl. Ser. 107, 661 (1996).
- Strauss et al. (1992) Strauss M.A., Huchra J.P., Davis M., Yahil A., Fisher K.B., and Tonry J., Astrophys. J. Suppl. Ser. 83, 29 (1992).
- Whitmore et al. (2011) Whitmore B.C., Chandar R., Kim H., Kaleida C. et al., Astrophys. J. 729, 78 (2011).
- Wofford et al. (2011) Wofford A., Leitherer C., and Chandar R., Astrophys. J. 727, 100 (2011).