Photo-acoustic dual-frequency comb spectroscopy
Photo-acoustic spectroscopy (PAS) is one of the most sensitive non-destructive analysis techniques for gases, fluids and solids. It can operate background-free at any wavelength and is applicable to microscopic and even non-transparent samples. Extension of PAS to broadband wavelength coverage is a powerful tool, though challenging to implement without sacrifice of wavelength resolution and acquisition speed. Here, we show that the unmatched precision, speed and wavelength coverage of dual-frequency comb spectroscopy (DCS) can be combined with the advantages of photo-acoustic detection. Acoustic wave interferograms are generated in the sample by dual-comb absorption and detected by a microphone. As an example, weak gas absorption features are precisely and rapidly sampled; long-term coherent averaging further increases the sensitivity. This novel approach of photo-acoustic dual-frequency comb spectroscopy generates unprecedented opportunities for rapid and sensitive multi-species molecular analysis across all wavelengths of light.
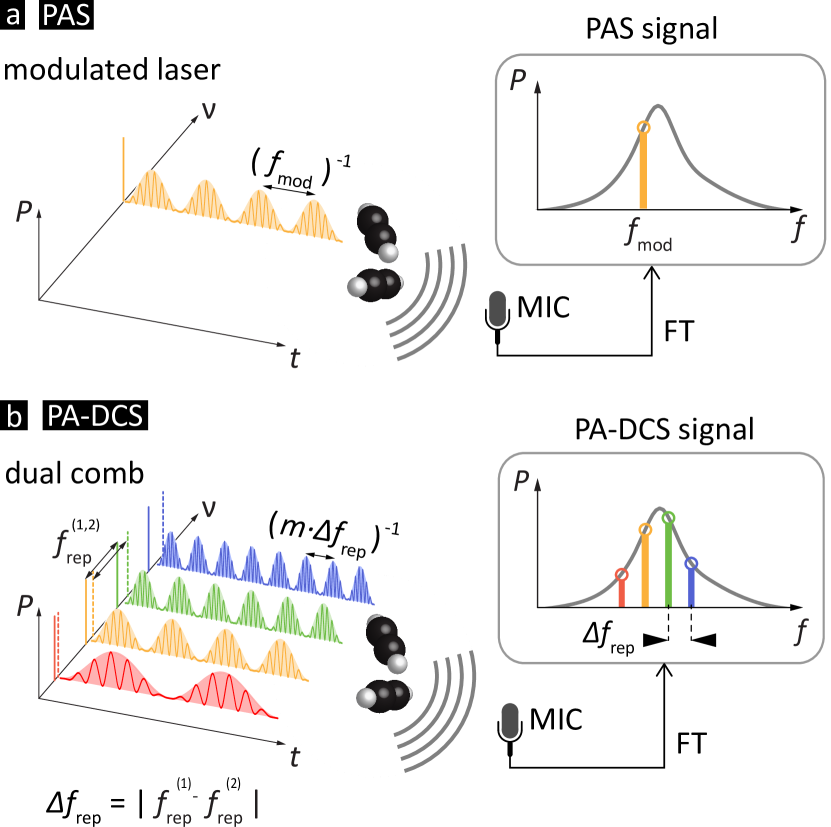
In PAS1; 2; 3; 4 , optical absorption of a modulated light source leads to periodic heating of a sample and the generation of an acoustic wave that can be detected by a microphone or an equivalent transducer (Figure 1a). As the detection relies on the acoustic waves (rather than a weak attenuation of an optical signal), photo-acoustic detection can be background-free, with high signal-to-noise ratio (SNR), and importantly, works at any wavelength of light. These unique properties have established PAS in environmental studies, solid state physics, chemical process control, medical application and life science, including for instance absorption measurements in atto-liter droplets 5, real-time monitoring of an ant’s respiration 6 and in-vivo tomographic imaging 7. Quartz-enhanced photo-acoustic spectroscopy (QEPAS)8; 9 and cantilever-enhanced photo-acoustic spectroscopy (CEPAS) 10; 11 have enabled ultra-sensitive trace gas detection below the part-per-trillion-level12; 13.
Usually, PAS is performed at one single probing laser wavelength not ideal for the study of multiple species or studies in the presence of uncontrolled background absorption. Multiple laser sources can alleviate this problem to some extent, however, remain constraint to specific use cases. Therefore, in order to achieve broadband wavelength coverage, photo-acoustic detection has been combined with a Fourier-transform infrared spectrometer (FTIR-PAS) 14. The achievable resolution is determined by the scan range of the interferometer, which can reach several meters for high resolution instruments. In addition to incoherent light sources, such as super-continua 15, coherent broadband spectra (unresolved optical frequency combs) have also been used to improve the overall performance 16; 17, and might allow adopting techniques for sub-nominal resolution 18 in the future. As such FTIR-PAS represents a powerful tool for broadband photo-acoustic spectroscopy, however, its resolution and acquisition speed remain limited due to the mechanical scan of the interferometer.
In this work, we show that the unmatched precision, speed and wavelength coverage of dual-frequency comb spectroscopy (DCS)19; 20; 21; 22; 23 can be combined with the advantages of photo-acoustic detection. This novel approach of photo-acoustic dual-frequency comb spectroscopy (PA-DCS) enables the rapid and scan-free acquisition of absorption features with high resolution and precision via photo-acoustic dual-comb multi-heterodyne detection.
Figure 1b illustrates the concept of PA-DCS. Similar to conventional DCS, two frequency combs are used in our demonstration whose optical frequency components are described by
| (1) |
and denote the repetition rate (i.e. the comb line spacing) and the combs’ optical offset frequencies, respectively. The index distinguishes the two combs, and are the comb line indices. The combs’ repetition rates and offsets differ only by small amounts , and , so that pairs of optical comb lines and are only separated by acoustic frequencies. When both combs are optically combined, this can be interpreted as a single frequency comb
| (2) |
whose optical lines are modulated in optical power according to with frequencies
| (3) |
Exposing the sample to the dual combs, it experiences periodic heating with frequency if light at the optical frequency is absorbed. The periodic heating will lead to the generation of heterodyne acoustic waves in function of the absorbed power. The superposition of all acoustic waves constitutes a -periodic interferogram that is detectable by a microphone or an equivalent transducer. In order to be detectable, all acoustic frequencies need to respect the bandwidth limitation of the transducer.
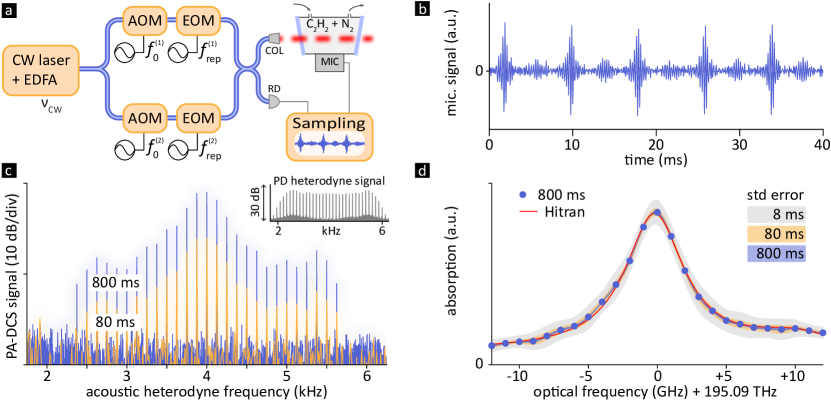
Key to our demonstration are dual-frequency combs with high mutual coherence that enable dense packing of the acoustic multi-heterodyne beatnotes within the microphone’s bandwidth. Dual combs with high mutual coherence have been implemented in various ways based on mode-locked lasers or electro-optic modulation 24; 25; 26; 27; 28; 29; 30; 31; 32; 33; 34, and have also been extended to the infrared molecular fingerprint regime 35; 36; 37; 38. In this proof-of-concept demonstration, we use two near-infrared electro-optic combs (Figure 2a). However, the concept can be readily applied to the mid-infrared domain. In order to ensure high mutual coherence between both electro-optic combs, they are derived from a single continuous-wave (CW) laser with an optical frequency of 195.09 THz (1536.71 nm). The amplified CW laser is split into two beams, each traversing first an acousto-optic modulator (AOM) where the laser frequencies are shifted by MHz and MHz + 4 kHz, respectively (i.e. ), to create a relative comb offset of kHz. Next, each beam passes through an electro-optic modulation (EOM) stage that includes one intensity and two phase modulators to generate a series of approximately 40 comb lines, spaced by GHz and Hz, respectively. In total, both combs deliver 20 mW of average power for photo-acoustic detection. A simple aluminum tube (diameter 4 mm, length 10 mm) whose ends are sealed by two angled glass windows serves as the photo-acoustic sample chamber. Attached to the sidewall of the tube and connected through a small hole is an off-the-shelf micro-electro-mechanical system (MEMS) microphone with 20 kHz bandwidth. A battery-powered amplifier and digitizer is used to record the acoustic signals for a memory limited duration of up to 1 hour. The repetition rate difference of Hz was chosen so that all acoustic multi-heterodyne beatnotes would be within 4 to 6 kHz and well within the microphone’s bandwidth. Given the combs’ high mutual coherence, we note that more beatnotes (i.e. more optical sampling points) could readily be accommodated, particularly, when lowering or selecting a transducer with a larger bandwidth. The combs are sent through the sample tube in a multi-pass configuration. A small fraction of the comb light is sent to a photo-detector that provides a reference for normalization of the photo-acoustic signal and also enables an increase of the combs’ mutual coherence in post-processing. In a wavelength regime where suitable photo-detectors may not be available, it could be replaced by photo-acoustic detection of black-body absorption. Both the microphone as well as the photo-detector signals are sampled. All modulation sources are synchronized to a 10 MHz frequency standard to ensure precise sampling and coherence in the acquisition process.
As a spectroscopic target we choose acetylene gas (C2H2) at atmospheric pressure and lab temperature as it provides precisely defined and interference-free absorption features. In a first experiment, the absorption cell is filled with acetylene gas, giving rise to the heterodyne acoustic interferogram signal shown in Figure 2b. Figure 2c shows two examples of the heterodyne acoustic spectra after Fourier-transformation 39 (PA-DCS signal) for acquisitions with a duration of 80 ms (10 interferograms) and 800 ms (100 interferograms), respectively. As expected, a longer acquisition time yields a higher SNR in the PA-DCS signal. In contrast to conventional DCS, photo-acoustic multi-heterodyne beatnotes are only generated in spectral regions that correspond to the presence of an absorber. Therefore, the number of photo-acoustic multi-heterodyne beatnotes is generally smaller than the number of comb lines. Although this does not allow for measurement of absolute absorption values without prior calibration, it avoids large (shot noise) background signals that can mask spectrally sparse or weak absorption features in conventional DCS 40.
In order to retrieve the true absorption profile, the acoustic multi-heterodyne beatnotes are normalized to account for the uneven spectral power envelope of the combs. Here, we accomplish this by dividing the PA-DCS signal (Figure 2c) by the photo-detected heterodyne reference beatnotes (inset in Figure 2c). The mapping of the acoustic to the optical frequency axis is described by Eqs. 2 and 3 (Note: this implies a scaling factor of between acoustic and optical frequency axes). The resulting C2H2-absorption signature is shown and compared to the HITRAN-based prediction 41; 42 in Figure 2d: Blue dots show the absorption retrieved from an 800 ms acquisition and shaded areas (grey, yellow, blue) represent the standard-error intervals for different durations of acquisition (8 ms, 80 ms and 800 ms). Excellent agreement between the HITRAN-prediction (red line) and the measured absorption profile is achieved, with the smallest residuals (below 3% relative to peak absorption) observed with an 800 ms acquisition. The grey shaded area demonstrates that a fast, 8 ms acquisition (i.e. a single interferogram) is sufficient to retrieve the coarse features of the absorption profile. The spectral resolution for each sampling point is given by the combs’ absolute optical linewidth (here: 100 kHz), so that instrumental lineshape effects are negligible (resolution 5 orders of magnitude below the width of the absorption feature). Moreover, the frequency spacing of the sampling points (1.0000000675 GHz) is precisely defined by the mean repetition rate of the two combs (Eq. 2).
Next, we investigate the extent to which even longer recordings of time can increase the SNR. To explore this, the cell is filled with N2-diluted C2H2 with a concentration of 1% and probed by combs centered at 1532.83 nm. Acquisitions of different duration are processed (similar to what is shown in Figure 2) and the SNR of the highest acoustic beatnote (at 4 kHz) is determined as a function of . Indeed, as Figure 3 shows, the SNR increases with (yellow trace), however, it markedly deviates from the -scaling one would expect in the scenario with perfect noise-averaging. This deviation is due to small and slow length fluctuations in the non-common optical path of the combs that limits their mutual coherence on the time scale of few seconds or longer. These slow fluctuations manifest themselves as phase drifts in the multi-heterodyne beatnotes, which fortunately, can easily be tracked and corrected for numerically 25; 43; 44; 45; 46; 47; 48. Here, we extract the phase drift (one phase value for all heterodyne beats) from the reference heterodyne signal and, after low-pass filtering ( Hz), subtract it from the phase of the heterodyne acoustic beatnotes. This a-posteriori phase-correction extends the effective mutual-coherence time of the combs by compensating for the slow path length fluctuations. As shown by the blue trace in Figure 3, phase correction results in an increase of the SNR close to the ideal scaling (black line) up to the maximal recording duration of 1 hour. This result suggests that even longer recordings could be leveraged to further increase the signal to noise ratio. A small deviation from the ideal scaling is observed for acquisitions longer than 300 s and attributed to residual differential phase drifts between the heterodyne beatnotes, which could be addressed by tracking the phase of each beatnote separately.
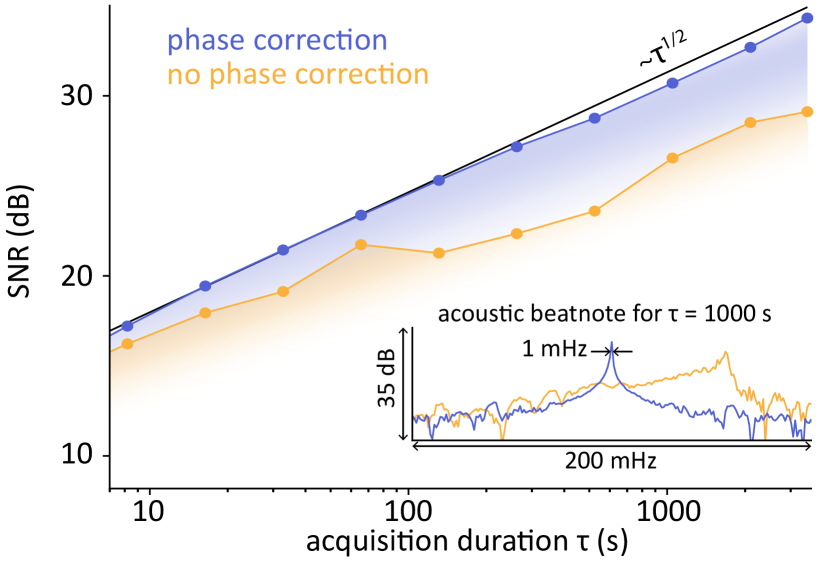
To further illustrate the effect of phase correction, the inset in Figure 3 shows the spectrum of an individual heterodyne acoustic beatnote for a recording time of 1000 s. With phase correction applied (blue trace), a narrow 1 mHz linewidth heterodyne beatnote is detected. Without phase correction (yellow trace) the drifting beatnote has a reduced SNR.
Generally, in photo-acoustic gas spectroscopy, the SNR depends on the used optical power, the absorption coefficient, the probing wavelength, the photo-acoustic cell design 49, the microphone, the surrounding matter, environmental conditions (pressure, temperature) as well as the recording duration. In the current proof-of-concept configuration, based on the SNR in Figure 3, we estimate a minimal detectable noise equivalent C2H2 concentration of 10 ppm for a recording time of 1000 s.
In conclusion, we have demonstrated photo-acoustic dual-frequency comb spectroscopy (PA-DCS) as a novel spectroscopic technique that can achieve high resolution, rapid acquisition and sensitive detection. Owing to its principle, PA-DCS can operate at any wavelength and across the large spectral bandwidth accessible to frequency combs 50; 20. In the mid-infrared and other wavelength regimes where photo-detection is challenging, it can complement alternative DCS approaches, such as those based on optical field sampling or up-conversion 51; 52. In future work, PA-DCS could be combined with high power quantum-cascade dual-laser combs 53; 54, cavity enhancement 55, multi-MHz bandwidth optical microphones 56, as well as opto-mechanical transducers 57; 58; 59 to further increase sensitivity, spectral coverage and acquisition speed. As such, our demonstration generates new opportunities for rapid, sensitive broadband multi-species molecular analysis across all wavelengths of light.
This work was supported by the Swiss National Science Foundation (00020_182598), the Helmholtz Young Investigators Group VH-NG-1404 and the Canton of Neuchâtel.
References
- [1] L. B. Kreuzer and C. K. N. Patel. Nitric Oxide Air Pollution: Detection by Optoacoustic Spectroscopy. Science, 173(3991):45–47, July 1971.
- [2] A. Rosencwaig. Photoacoustic Spectroscopy of Biological Materials. Science, 181(4100):657–658, August 1973.
- [3] C. K. N. Patel and A. C. Tam. Optoacoustic spectroscopy of liquids. Applied Physics Letters, 34(7):467–470, April 1979. Publisher: American Institute of Physics.
- [4] Jingsong Li, Weidong Chen, and Benli Yu. Recent Progress on Infrared Photoacoustic Spectroscopy Techniques. Applied Spectroscopy Reviews, 46(6):440–471, August 2011.
- [5] Johannes W. Cremer, Klemens M. Thaler, Christoph Haisch, and Ruth Signorell. Photoacoustics of single laser-trapped nanodroplets for the direct observation of nanofocusing in aerosol photokinetics. Nature Communications, 7(1):1–7, March 2016. Number: 1 Publisher: Nature Publishing Group.
- [6] M. M. J. W. van Herpen, A. K. Y. Ngai, S. E. Bisson, J. H. P. Hackstein, E. J. Woltering, and F. J. M. Harren. Optical parametric oscillator-based photoacoustic detection of CO 2 at 4.23 um allows real-time monitoring of the respiration of small insects. Applied Physics B, 82(4):665–669, March 2006. Company: Springer Distributor: Springer Institution: Springer Label: Springer Number: 4 Publisher: Springer-Verlag.
- [7] Xueding Wang, Yongjiang Pang, Geng Ku, Xueyi Xie, George Stoica, and Lihong V. Wang. Noninvasive laser-induced photoacoustic tomography for structural and functional in vivo imaging of the brain. Nature Biotechnology, 21(7):803–806, July 2003. Number: 7 Publisher: Nature Publishing Group.
- [8] A. A. Kosterev, Yu A. Bakhirkin, R. F. Curl, and F. K. Tittel. Quartz-enhanced photoacoustic spectroscopy. Optics Letters, 27(21):1902–1904, November 2002. Publisher: Optical Society of America.
- [9] Hongpeng Wu, Lei Dong, Huadan Zheng, Yajun Yu, Weiguang Ma, Lei Zhang, Wangbao Yin, Liantuan Xiao, Suotang Jia, and Frank K. Tittel. Beat frequency quartz-enhanced photoacoustic spectroscopy for fast and calibration-free continuous trace-gas monitoring. Nature Communications, 8(1):1–8, May 2017. Number: 1 Publisher: Nature Publishing Group.
- [10] V. Koskinen, J. Fonsen, K. Roth, and J. Kauppinen. Cantilever enhanced photoacoustic detection of carbon dioxide using a tunable diode laser source. Applied Physics B, 86(3):451–454, February 2007. Company: Springer Distributor: Springer Institution: Springer Label: Springer Number: 3 Publisher: Springer-Verlag.
- [11] Jari Peltola, Markku Vainio, Tuomas Hieta, Juho Uotila, Sauli Sinisalo, Markus Metsälä, Mikael Siltanen, and Lauri Halonen. High sensitivity trace gas detection by cantilever-enhanced photoacoustic spectroscopy using a mid-infrared continuous-wave optical parametric oscillator. Optics Express, 21(8):10240–10250, April 2013. Publisher: Optical Society of America.
- [12] Vincenzo Spagnolo, Pietro Patimisco, Simone Borri, Gaetano Scamarcio, Bruce E. Bernacki, and Jason Kriesel. Part-per-trillion level SF detection using a quartz enhanced photoacoustic spectroscopy-based sensor with single-mode fiber-coupled quantum cascade laser excitation. Optics Letters, 37(21):4461–4463, November 2012. Publisher: Optical Society of America.
- [13] Teemu Tomberg, Markku Vainio, Tuomas Hieta, and Lauri Halonen. Sub-parts-per-trillion level sensitivity in trace gas detection by cantilever-enhanced photo-acoustic spectroscopy. Scientific Reports, 8(1):1848, December 2018.
- [14] G Busse and B Bullemer. Use of the opto-acoustic effect for rapid scan Fourier spectroscopy. Infrared Physics, 18:631–634, 1978.
- [15] Tommi Mikkonen, Caroline Amiot, Antti Aalto, Kim Patokoski, Goëry Genty, and Juha Toivonen. Broadband cantilever-enhanced photoacoustic spectroscopy in the mid-IR using a supercontinuum. Optics Letters, 43(20):5094–5097, October 2018. Publisher: Optical Society of America.
- [16] Ibrahim Sadiek, Tommi Mikkonen, Markku Vainio, Juha Toivonen, and Aleksandra Foltynowicz. Optical frequency comb photoacoustic spectroscopy. Physical Chemistry Chemical Physics, 20(44):27849–27855, 2018.
- [17] Juho Karhu, Teemu Tomberg, Francisco Senna Vieira, Guillaume Genoud, Vesa Hänninen, Markku Vainio, Markus Metsälä, Tuomas Hieta, Steven Bell, and Lauri Halonen. Broadband photoacoustic spectroscopy of 14CH4 with a high-power mid-infrared optical frequency comb. Optics Letters, 44(5):1142–1145, March 2019. Publisher: Optical Society of America.
- [18] Piotr Maslowski. Surpassing the path-limited resolution of Fourier-transform spectrometry with frequency combs. Physical Review A, 93(2), 2016.
- [19] Ian Coddington, Nathan Newbury, and William Swann. Dual-comb spectroscopy. Optica, 3(4):414–426, April 2016. Publisher: Optical Society of America.
- [20] Nathalie Picqué and Theodor W. Hänsch. Frequency comb spectroscopy. Nature Photonics, 13(3):146–157, March 2019. Number: 3 Publisher: Nature Publishing Group.
- [21] S. Schiller. Spectrometry with frequency combs. Optics Letters, 27(9):766–768, May 2002. Publisher: Optical Society of America.
- [22] Fritz Keilmann, Christoph Gohle, and Ronald Holzwarth. Time-domain mid-infrared frequency-comb spectrometer. Optics Letters, 29(13):1542–1544, July 2004. Publisher: Optical Society of America.
- [23] Albert Schliesser, Markus Brehm, Fritz Keilmann, and Daniel W. van der Weide. Frequency-comb infrared spectrometer for rapid, remote chemical sensing. Optics Express, 13(22):9029–9038, October 2005. Publisher: Optical Society of America.
- [24] Ian Coddington. Coherent Multiheterodyne Spectroscopy Using Stabilized Optical Frequency Combs. Physical Review Letters, 100(1), 2008.
- [25] A. M. Zolot, F. R. Giorgetta, E. Baumann, J. W. Nicholson, W. C. Swann, I. Coddington, and N. R. Newbury. Direct-comb molecular spectroscopy with accurate, resolved comb teeth over 43 THz. Optics Letters, 37(4):638, February 2012. publisher: Optical Society of America.
- [26] Guy Millot, Stéphane Pitois, Ming Yan, Tatevik Hovhannisyan, Abdelkrim Bendahmane, Theodor W. Hänsch, and Nathalie Picqué. Frequency-agile dual-comb spectroscopy. Nature Photonics, 10(1):27–30, January 2016. Number: 1 Publisher: Nature Publishing Group.
- [27] Takuro Ideguchi, Tasuku Nakamura, Yohei Kobayashi, and Keisuke Goda. Kerr-lens mode-locked bidirectional dual-comb ring laser for broadband dual-comb spectroscopy. Optica, 3(7):748–753, July 2016. Publisher: Optical Society of America.
- [28] S. Mehravar, R. A. Norwood, N. Peyghambarian, and K. Kieu. Real-time dual-comb spectroscopy with a free-running bidirectionally mode-locked fiber laser. Applied Physics Letters, 108(23):231104, June 2016. Publisher: American Institute of Physics.
- [29] Xin Zhao, Guoqing Hu, Bofeng Zhao, Cui Li, Yingling Pan, Ya Liu, Takeshi Yasui, and Zheng Zheng. Picometer-resolution dual-comb spectroscopy with a free-running fiber laser. Optics Express, 24(19):21833–21845, September 2016. Publisher: Optical Society of America.
- [30] S. M. Link, D. J. H. C. Maas, D. Waldburger, and U. Keller. Dual-comb spectroscopy of water vapor with a free-running semiconductor disk laser. Science, 356(6343):1164–1168, June 2017. Publisher: American Association for the Advancement of Science Section: Reports.
- [31] Nicolas Bourbeau Hébert, David G. Lancaster, Vincent Michaud-Belleau, George Y. Chen, and Jérôme Genest. Highly coherent free-running dual-comb chip platform. Optics Letters, 43(8):1814–1817, April 2018. Publisher: Optical Society of America.
- [32] Zaijun Chen, Ming Yan, Theodor W. Hänsch, and Nathalie Picqué. A phase-stable dual-comb interferometer. Nature Communications, 9(1):1–7, August 2018. Number: 1 Publisher: Nature Publishing Group.
- [33] Pedro Martín-Mateos, Borja Jerez, Pedro Largo-Izquierdo, and Pablo Acedo. Frequency accurate coherent electro-optic dual-comb spectroscopy in real-time. Optics Express, 26(8):9700–9713, April 2018. Publisher: Optical Society of America.
- [34] Chenglin Gu, Zhong Zuo, Daping Luo, Zejiang Deng, Yang Liu, Minglie Hu, and Wenxue Li. Passive coherent dual-comb spectroscopy based on optical-optical modulation with free running lasers. PhotoniX, 1(1):7, March 2020.
- [35] Gabriel Ycas, Fabrizio R. Giorgetta, Esther Baumann, Ian Coddington, Daniel Herman, Scott A. Diddams, and Nathan R. Newbury. High-coherence mid-infrared dual-comb spectroscopy spanning 2.6 to 5.2 um. Nature Photonics, 12(4):202–208, April 2018. Number: 4 Publisher: Nature Publishing Group.
- [36] A. V. Muraviev, V. O. Smolski, Z. E. Loparo, and K. L. Vodopyanov. Massively parallel sensing of trace molecules and their isotopologues with broadband subharmonic mid-infrared frequency combs. Nature Photonics, 12(4):209–214, April 2018. Number: 4 Publisher: Nature Publishing Group.
- [37] M. Imrul Kayes, Nurmemet Abdukerim, Alexandre Rekik, and Martin Rochette. Free-running mode-locked laser based dual-comb spectroscopy. Optics Letters, 43(23):5809–5812, December 2018. Publisher: Optical Society of America.
- [38] Ruoyu Liao, Youjian Song, Wu Liu, Haosen Shi, Lu Chai, and Minglie Hu. Dual-comb spectroscopy with a single free-running thulium-doped fiber laser. Optics Express, 26(8):11046–11054, April 2018. Publisher: Optical Society of America.
- [39] Pauli Virtanen, Ralf Gommers, Travis E. Oliphant, Matt Haberland, Tyler Reddy, David Cournapeau, Evgeni Burovski, Pearu Peterson, Warren Weckesser, Jonathan Bright, Stéfan J. van der Walt, Matthew Brett, Joshua Wilson, K. Jarrod Millman, Nikolay Mayorov, Andrew R. J. Nelson, Eric Jones, Robert Kern, Eric Larson, C. J. Carey, İlhan Polat, Yu Feng, Eric W. Moore, Jake VanderPlas, Denis Laxalde, Josef Perktold, Robert Cimrman, Ian Henriksen, E. A. Quintero, Charles R. Harris, Anne M. Archibald, Antônio H. Ribeiro, Fabian Pedregosa, and Paul van Mulbregt. SciPy 1.0: fundamental algorithms for scientific computing in Python. Nature Methods, 17(3):261–272, March 2020. Number: 3 Publisher: Nature Publishing Group.
- [40] Nathan R. Newbury, Ian Coddington, and William Swann. Sensitivity of coherent dual-comb spectroscopy. Optics Express, 18(8):7929–7945, April 2010. Publisher: Optical Society of America.
- [41] R.V. Kochanov, I.E. Gordon, L.S. Rothman, P. Wcisło, C. Hill, and J.S. Wilzewski. HITRAN Application Programming Interface (HAPI): A comprehensive approach to working with spectroscopic data. Journal of Quantitative Spectroscopy and Radiative Transfer, 177:15–30, July 2016.
- [42] I.E. Gordon, L.S. Rothman, C. Hill, R.V. Kochanov, Y. Tan, P.F. Bernath, M. Birk, V. Boudon, A. Campargue, K.V. Chance, B.J. Drouin, J.-M. Flaud, R.R. Gamache, J.T. Hodges, D. Jacquemart, V.I. Perevalov, A. Perrin, K.P. Shine, M.-A.H. Smith, J. Tennyson, G.C. Toon, H. Tran, V.G. Tyuterev, A. Barbe, A.G. Császár, V.M. Devi, T. Furtenbacher, J.J. Harrison, J.-M. Hartmann, A. Jolly, T.J. Johnson, T. Karman, I. Kleiner, A.A. Kyuberis, J. Loos, O.M. Lyulin, S.T. Massie, S.N. Mikhailenko, N. Moazzen-Ahmadi, H.S.P. Müller, O.V. Naumenko, A.V. Nikitin, O.L. Polyansky, M. Rey, M. Rotger, S.W. Sharpe, K. Sung, E. Starikova, S.A. Tashkun, J. Vander Auwera, G. Wagner, J. Wilzewski, P. Wcisło, S. Yu, and E.J. Zak. The HITRAN2016 molecular spectroscopic database. Journal of Quantitative Spectroscopy and Radiative Transfer, 203:3–69, December 2017.
- [43] Julien Roy, Jean-Daniel Deschênes, Simon Potvin, and Jérôme Genest. Continuous real-time correction and averaging for frequency comb interferometry. Optics Express, 20(20):21932–21939, September 2012. Publisher: Optical Society of America.
- [44] Takuro Ideguchi, Antonin Poisson, Guy Guelachvili, Nathalie Picqué, and Theodor W. Hänsch. Adaptive real-time dual-comb spectroscopy. Nature Communications, 5(1):1–8, February 2014. Number: 1 Publisher: Nature Publishing Group.
- [45] David Burghoff, Yang Yang, and Qing Hu. Computational multiheterodyne spectroscopy. Science Advances, 2(11):e1601227, November 2016. Publisher: American Association for the Advancement of Science Section: Research Article.
- [46] Nicolas Bourbeau Hébert, Jérôme Genest, Jean-Daniel Deschênes, Hugo Bergeron, George Y. Chen, Champak Khurmi, and David G. Lancaster. Self-corrected chip-based dual-comb spectrometer. Optics Express, 25(7):8168–8179, April 2017. Publisher: Optical Society of America.
- [47] Zebin Zhu, Kai Ni, Qian Zhou, and Guanhao Wu. Digital correction method for realizing a phase-stable dual-comb interferometer. Optics Express, 26(13):16813–16823, June 2018. Publisher: Optical Society of America.
- [48] Lukasz A. Sterczewski, Lukasz A. Sterczewski, Lukasz A. Sterczewski, Jonas Westberg, and Gerard Wysocki. Computational coherent averaging for free-running dual-comb spectroscopy. Optics Express, 27(17):23875–23893, August 2019. Publisher: Optical Society of America.
- [49] F. G. C. Bijnen, J. Reuss, and F. J. M. Harren. Geometrical optimization of a longitudinal resonant photoacoustic cell for sensitive and fast trace gas detection. Review of Scientific Instruments, 67(8):2914–2923, August 1996. Publisher: American Institute of Physics.
- [50] Albert Schliesser, Nathalie Picqué, and Theodor W. Hänsch. Mid-infrared frequency combs. Nature Photonics, 6(7):440–449, July 2012. Number: 7 Publisher: Nature Publishing Group.
- [51] Abijith S. Kowligy, Henry Timmers, Alexander J. Lind, Ugaitz Elu, Flavio C. Cruz, Peter G. Schunemann, Jens Biegert, and Scott A. Diddams. Infrared electric field sampled frequency comb spectroscopy. Science Advances, 5(6):8794, June 2019. Publisher: American Association for the Advancement of Science Section: Research Article.
- [52] Zaijun Chen, Theodor W. Hänsch, and Nathalie Picqué. Upconversion mid-infrared dual-comb spectroscopy. arXiv:2003.06930 [physics], March 2020. arXiv: 2003.06930.
- [53] Gustavo Villares, Andreas Hugi, Stéphane Blaser, and Jérôme Faist. Dual-comb spectroscopy based on quantum-cascade-laser frequency combs. Nature Communications, 5(1):1–9, October 2014. Number: 1 Publisher: Nature Publishing Group.
- [54] Michele Gianella, Akshay Nataraj, Béla Tuzson, Pierre Jouy, Filippos Kapsalidis, Mattias Beck, Markus Mangold, Andreas Hugi, Jérôme Faist, and Lukas Emmenegger. High-resolution and gapless dual comb spectroscopy with current-tuned quantum cascade lasers. Optics Express, 28(5):6197–6208, March 2020. Publisher: Optical Society of America.
- [55] Birgitta Bernhardt, Akira Ozawa, Patrick Jacquet, Marion Jacquey, Yohei Kobayashi, Thomas Udem, Ronald Holzwarth, Guy Guelachvili, Theodor W. Hänsch, and Nathalie Picqué. Cavity-enhanced dual-comb spectroscopy. Nature Photonics, 4(1):55–57, January 2010. Number: 1 Publisher: Nature Publishing Group.
- [56] Amir Rosenthal, Daniel Razansky, and Vasilis Ntziachristos. High-sensitivity compact ultrasonic detector based on a pi-phase-shifted fiber Bragg grating. Optics Letters, 36(10):1833–1835, May 2011. Publisher: Optical Society of America.
- [57] E. Gavartin, P. Verlot, and T. J. Kippenberg. A hybrid on-chip optomechanical transducer for ultrasensitive force measurements. Nature Nanotechnology, 7(8):509–514, August 2012. Number: 8 Publisher: Nature Publishing Group.
- [58] Birgit Stiller, Paulo Dainese, and Ewold Verhagen. Optoacoustics—Advances in high-frequency optomechanics and Brillouin scattering. APL Photonics, 4:110401, May 2019. Publisher: American Institute of Physics.
- [59] David Mason, Junxin Chen, Massimiliano Rossi, Yeghishe Tsaturyan, and Albert Schliesser. Continuous force and displacement measurement below the standard quantum limit. Nature Physics, 15(8):745–749, August 2019. Number: 8 Publisher: Nature Publishing Group.