Complex network analysis of Indian railway zones
Abstract
Indian Railway Network has been analyzed on the basis of number of trains directly linking two railway zones. The network has been displayed as a weighted graph where the weights denote the number of trains between the zones. It may be pointed out that each zone is a complex network in itself and may depict different characteristic features. The zonal network therefore can be considered as a network of complex networks. In this paper, self links, in-degree and out-degree of each zone have been computed which provides information about the inter and intra zonal connectivity. Degree-passenger correlation which gives an idea about number of trains and passengers originating from a particular zone which might play a role in policy making decisions has also been studied. Some other complex network parameters like betweenness, clustering coefficient and cliques have been obtained to get more insight about the complex Indian zonal network.
Keywords Complex Network Indian Railways Indian Railway Zones Centrality measures
1 Introduction
Indian railways is one of the largest transport networks in the world. It has about 67,368 kms of tracks and about 8116 million passengers originating with an average distance travelled of 141.6 kms per person in 2016-17(indianrail.gov.in). The railway network is structured into multi-tier system. The zones are at top of the hierarchy which are divided into divisions[1]. The division controls the railway stations which is the last entity in the hierarchy. At present there are 18 zones with 73 divisions and 7349 stations(indianrail.gov.in).
Transportation system in a complex network framework has been studied in airlines[2], railways[3, 4], subways[5] and streetways[6]. Scale free properties have also been observed in railway networks[3, 4]. Complex network based fault spreading model was investigated in [7] to analyse the impact of failures in railway networks. A multilayer complex weighted network model for understanding spatio-temporal traffic flow patterns in Chinese subway network was given in [8]. Characterization of train flow and passenger flow network was also carried out in their work. A study was done on the rail and bus transportation services as a complex weighted network in Singapore to get insights about its typological and dynamic pattern [9].
This work aims at presenting an overview of the zonal network that builds the Indian Railways. The data has been collected from (indianrail.gov.in) which comprises the number of trains originating from one railway zone and arriving at the other zones or the same zone. A complex weighted graph has been generated using the data. The network graph has been analyzed and some significant deductions have been made which are discussed in the subsequent sections. The number of passengers traveling from one zone to another has also been obtained from (data.gov.in) which has been used to find the correlation with the number of trains in a particular zone.
2 Complex Indian Railway Zonal Network
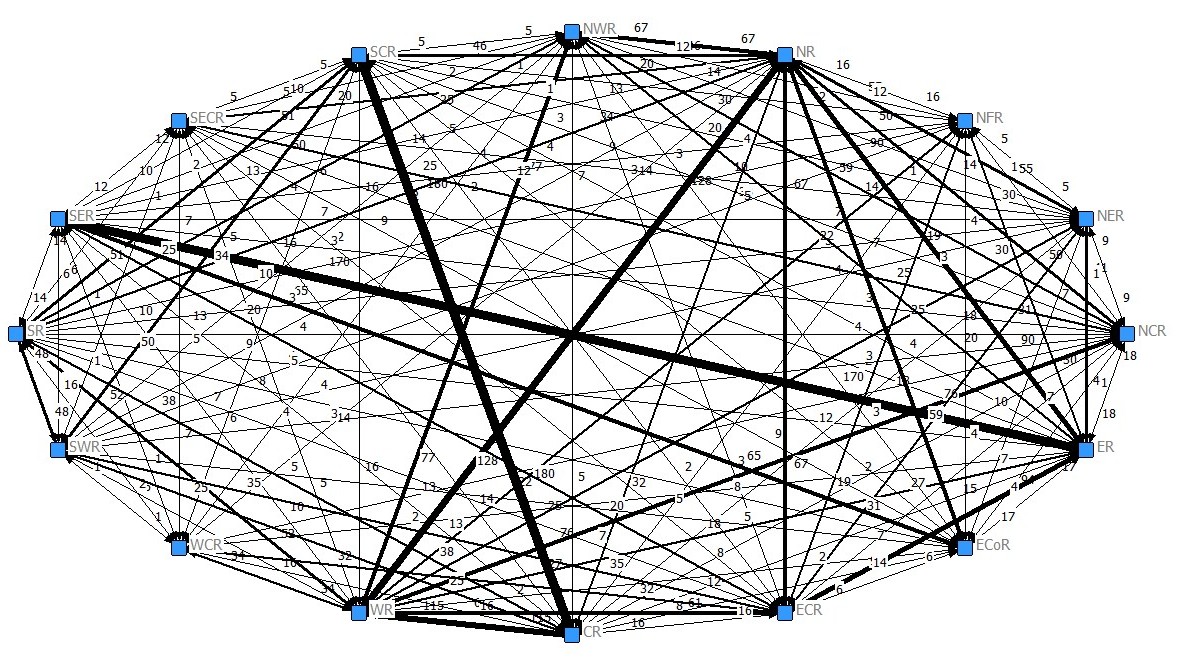
A number of trains ply from one railway zone to another as well as connect stations within a particular zone. The inter-zone connectivity has been depicted in the figure 1 as a weighted graph. The weights denote the number of trains between the zones. The width of the lines also corresponds to their weights.
| Zones | Out | In | Clustering | Betwe- | Self | Total | Passeng- |
|---|---|---|---|---|---|---|---|
| degree | degree | Coefficient | enness | Links | Links | ers 2014 | |
| -15(in | |||||||
| millions) | |||||||
| CR | 509 | 528 | 21.076 | 0.812 | 3694 | 4203 | 1716 |
| ER | 535 | 531 | 21.863 | 0.669 | 3450 | 3985 | 1156 |
| WR | 652 | 652 | 19.805 | 0.812 | 2840 | 3492 | 1625 |
| SR | 310 | 313 | 23.048 | 0.812 | 2886 | 3196 | 806 |
| NR | 706 | 704 | 19.3 | 0.812 | 1308 | 2014 | 637 |
| SCR | 392 | 393 | 22.276 | 0.812 | 1160 | 1552 | 357 |
| SER | 360 | 360 | 22.586 | 0.812 | 614 | 974 | 256 |
| NER | 236 | 234 | 25.94 | 0.297 | 584 | 820 | 165 |
| ECR | 402 | 402 | 22.186 | 0.812 | 360 | 762 | 254 |
| NWR | 279 | 279 | 23.367 | 0.812 | 386 | 665 | 153 |
| NFR | 137 | 134 | 29.987 | 0.143 | 478 | 615 | 87 |
| SWR | 209 | 209 | 21.863 | 0.669 | 362 | 571 | 191 |
| NCR | 256 | 254 | 23.586 | 0.812 | 234 | 490 | 171 |
| SECR | 129 | 127 | 27.121 | 0.476 | 350 | 479 | 125 |
| ECoR | 215 | 209 | 26.192 | 0.297 | 216 | 431 | 90 |
| WCR | 136 | 136 | 30.742 | 0.143 | 96 | 232 | 139 |
2.1 Self Links, In and Out Degrees
The number of links varies considerably in inter-zone as well as intra-zonal networks. There are three types of links viz. outgoing links, incoming links and self links. Here, the self links denote the trains between stations of a particular zone.
The total number of links comprise of the sum of outgoing links, incoming links and twice the number of self links. The highest out and in links have been observed for Northern Railways zone with values 706 and 704 respectively whereas the maximum value of self links is for CR zone with a value of 3694(See table1).
2.2 Betweenness, Clustering Coefficient and Cliques
Betweeness centrality(BC) and clustering coefficient are important quantities which characterize a complex network. BC denotes how influential a node is in a network [10]. On the other hand, clustering coefficient[11] provides the clustering tendency of a node in a network. Both these quantities have been given in table1) for each zone. The highest BC has been noted to be 0.812 which is for CR,WR,SR,NR,SCR,SER,ECR,NWR and NCR and lowest being 0.143 for NFR and WCR. The clustering coefficient is found to be maximum for WCR with 30.742 and minimum for NR with a value of 19.3.
Cliques denote the direct connectivity between every node of subgraphs of a graph network. There are six cliques observed in Zonal network of Indian railways. It can be observed that NR,NWR,SR,CR,SER,SCR,NCR,ECR, and WR zones appeared in every clique.
2.3 Degree-Passengers and Degree-Degree Correlations
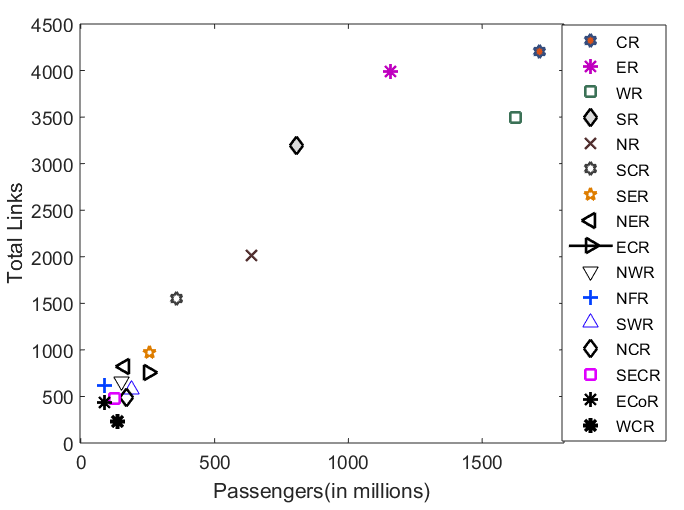
It is imperative to see the correlation between the total number of trains and the passengers originating from that zone. There is an obvious positive correlation with highest pair value for CR as 4203 trains and 1716 million passengers in the year 2014-15. Figure 2 shows the degree-passenger correlation for all the zones.
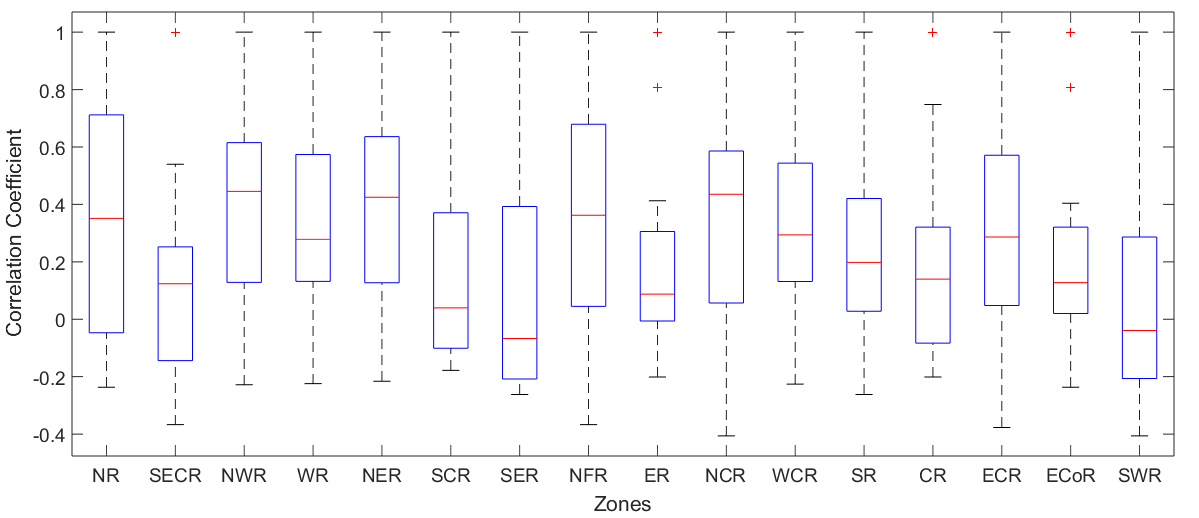
The degree correlation between the zones is shown in the figure . The box plot gives a brief idea about the quartiles, the range and the mean values of degree-degree correlations of different zones. It can be also visualized that the correlation matrix shows positive values with a significant number of negative values which correspond to the zones which are farther from each other (see table 2). The highest range of correlation values is for NR and highest mean value is for NWR.
| NR | SECR | NWR | WR | NER | SCR | SER | NFR | ER | NCR | WCR | SR | CR | ECR | ECoR | SWR | |
|---|---|---|---|---|---|---|---|---|---|---|---|---|---|---|---|---|
| NR | 1 | -0.06 | 0.73 | 0.28 | 0.69 | -0.16 | 0.37 | 0.76 | -0.03 | 0.72 | 0.57 | 0.18 | 0.32 | 0.51 | -0.23 | -0.15 |
| SECR | -0.06 | 1 | 0.29 | 0.54 | 0.19 | 0.19 | -0.24 | -0.36 | 0.20 | 0.21 | 0.05 | -0.15 | -0.13 | -0.10 | 0.38 | -0.19 |
| NWR | 0.73 | 0.29 | 1 | 0.65 | 0.57 | -0.03 | -0.06 | 0.51 | 0.06 | 0.90 | 0.51 | 0.38 | 0.28 | 0.55 | 0.18 | -0.22 |
| WR | 0.28 | 0.54 | 0.65 | 1 | 0.56 | 0.52 | -0.22 | 0.27 | 0.10 | 0.58 | 0.59 | 0.21 | -0.09 | 0.15 | 0.16 | 0.09 |
| NER | 0.69 | 0.19 | 0.57 | 0.56 | 1 | 0.05 | 0.40 | 0.76 | 0.41 | 0.56 | 0.43 | 0.02 | -0.07 | 0.76 | 0.40 | -0.21 |
| SCR | -0.16 | 0.19 | -0.03 | 0.52 | 0.05 | 1 | -0.12 | -0.11 | -0.17 | -0.08 | 0.14 | 0.53 | 0.31 | -0.06 | 0.02 | 0.42 |
| SER | 0.37 | -0.24 | -0.06 | -0.22 | 0.40 | -0.12 | 1 | 0.59 | 0.04 | -0.06 | -0.22 | -0.26 | -0.14 | 0.59 | 0.16 | -0.19 |
| NFR | 0.76 | -0.36 | 0.51 | 0.27 | 0.76 | -0.11 | 0.59 | 1 | 0.30 | 0.49 | 0.42 | 0.07 | 0.01 | 0.81 | 0.08 | -0.09 |
| ER | -0.03 | 0.20 | 0.06 | 0.10 | 0.41 | -0.17 | 0.04 | 0.30 | 1 | 0.02 | 0.12 | -0.18 | -0.20 | 0.30 | 0.80 | 0.01 |
| NCR | 0.72 | 0.21 | 0.90 | 0.58 | 0.56 | -0.08 | -0.06 | 0.49 | 0.02 | 1 | 0.58 | 0.37 | 0.26 | 0.49 | 0.08 | -0.40 |
| WCR | 0.57 | 0.05 | 0.51 | 0.59 | 0.43 | 0.14 | -0.22 | 0.42 | 0.12 | 0.58 | 1 | 0.28 | 0.30 | 0.26 | -0.15 | 0.14 |
| SR | 0.18 | -0.15 | 0.38 | 0.21 | 0.02 | 0.53 | -0.26 | 0.07 | -0.18 | 0.37 | 0.28 | 1 | 0.74 | 0.09 | 0.02 | 0.46 |
| CR | 0.32 | -0.13 | 0.28 | -0.09 | -0.07 | 0.31 | -0.14 | 0.01 | -0.20 | 0.26 | 0.30 | 0.74 | 1 | 0.001 | -0.05 | 0.50 |
| ECR | 0.51 | -0.10 | 0.55 | 0.15 | 0.76 | -0.06 | 0.59 | 0.81 | 0.30 | 0.49 | 0.26 | 0.09 | 0.001 | 1 | 0.26 | -0.37 |
| ECoR | -0.23 | 0.38 | 0.18 | 0.16 | 0.40 | 0.02 | 0.16 | 0.08 | 0.80 | 0.08 | -0.15 | 0.02 | -0.05 | 0.26 | 1 | 0.01 |
| SWR | -0.15 | -0.19 | -0.22 | 0.09 | -0.21 | 0.42 | -0.19 | -0.09 | 0.01 | -0.40 | 0.14 | 0.46 | 0.50 | -0.37 | 0.01 | 1 |
3 Conclusion
A weighted complex network of Indian railway zones was considered for the study. The zonal network comprises of links among the stations in that zone as well as trains from one zone to another. The graphical visualization of the network has been presented with weights denoting the number of trains. Characterizing features for gaining more insight about the network have also been presented. Betweenness centrality, clustering coefficient, in degree, out degree, self links have been calculate that give a brief idea about the network. Degree-Passenger and Degree-Degree correlations provide detail about correspondence between number of trains with passengers and the degree of connectivity between zones respectively.
References
- [1] Sajeev Abraham George and Narayan Rangaraj. A performance benchmarking study of indian railway zones. Benchmarking: An International Journal, 15(5):599–617, 2008.
- [2] Ganesh Bagler. Analysis of the airport network of india as a complex weighted network. Physica A: Statistical Mechanics and its Applications, 387(12):2972–2980, 2008.
- [3] W Li and X Cai. Empirical analysis of a scale-free railway network in china. Physica A: Statistical Mechanics and its Applications, 382(2):693–703, 2007.
-
[4]
Parongama Sen, Subinay Dasgupta, Arnab Chatterjee,
PA Sreeram, G Mukherjee, and SS Manna. Small-world properties of the indian railway network. Physical Review E, 67(3):036106, 2003. - [5] Panagiotis Angeloudis and David Fisk. Large subway systems as complex networks. Physica A: Statistical Mechanics and its Applications, 367:553–558, 2006.
- [6] Sergio Porta, Paolo Crucitti, and Vito Latora. The network analysis of urban streets: a dual approach. Physica A: Statistical Mechanics and its Applications, 369(2):853–866, 2006.
- [7] Jin Zhou, Weixiang Xu, Xin Guo, and Xin Ma. Railway faults spreading model based on dynamics of complex network. International Journal of Modern Physics B, 29(06):1550038, 2015.
- [8] Jia Feng, Xiamiao Li, Baohua Mao, Qi Xu, and Yun Bai. Weighted complex network analysis of the beijing subway system: Train and passenger flows. Physica A: Statistical Mechanics and its Applications, 474:213–223, 2017.
- [9] Harold Soh, Sonja Lim, Tianyou Zhang, Xiuju Fu, Gary Kee Khoon Lee, Terence Gih Guang Hung, Pan Di, Silvester Prakasam, and Limsoon Wong. Weighted complex network analysis of travel routes on the singapore public transportation system. Physica A: Statistical Mechanics and its Applications, 389(24):5852–5863, 2010.
- [10] Marc Barthelemy. Betweenness centrality in large complex networks. The European physical journal B, 38(2):163–168, 2004.
- [11] Sara Nadiv Soffer and Alexei Vazquez. Network clustering coefficient without degree-correlation biases. Physical Review E, 71(5):057101, 2005.