The COVID-19 pandemic: growth patterns, power law scaling, and saturation
Abstract
More and more countries show a significant slowdown in the number of new COVID-19 infections due to effective governmentally instituted lockdown and social distancing measures. We have analyzed the growth behavior of the top 25 most affected countries by means of a local slope analysis and found three distinct patterns that individual countries follow depending on the strictness of the lockdown protocols: exponential rise and fall, power law, or logistic. For countries showing power law growth we have determined the scaling exponents. For countries that showed a strong slowdown in the rate of infections we have extrapolated the expected saturation of the number of infections and the expected final date. Two different extrapolation methods (logistic and parabolic) were used. Both methods agree on the order of magnitude of saturation and end dates. Global infections rates are analyzed with the same methods. The relevance and accuracy of these extrapolations is discussed.
Introduction
In December 2019 a novel corona virus (COVID-19) was discovered in Wuhan, China. The infections quickly spread first within China but soon thereafter moved to neighboring Asian countries and as of February 2020 reached all continents. The first massive outbreak outside mainland China happened in Northern Italy from which it spread rapidly all over Europe. As of April 5th 23:00 CET over 1’270’000 people in 184 countries and regions have been infected WHO . Currently, the most affected country is the USA with over 337310 infections.
Due to its high infectivity and since no medical cure or vaccine is available yet governments around the world have instituted drastic measures such as curfews, lockdowns and social distancing campaigns to slow down the number of new infections and reduce the rate at which the virus spreads.
The mortality rate has been found to be 2.5%Lai et al. (2020) (comparison: SARS 9.6% Smith (2006) and H1N1 influenza 0.6%Vaillant et al. (2009)) but the severity of cases is much higher for the elderly population Jung et al. (2020) and people with preexisting health conditions like cardiovascular and respiratory diseases, diabetes, or cancer Driggin et al. (2020); Jung et al. (2020) as well as heavy smoking Vardavas and Nikitara (2020) where the mortality rates can increase to 5-11% Jung et al. (2020).
Increasingly more countries affected by the COVID-19 virus find a reduction in the rate of new infections due to strict lockdowns. While no country so far has reached the same saturation of the total number of infections as China many seem to be on the way towards this stage showing a similar situation as China at the end of February 2020.
Traditionally biological systems such as the spreading of a disease are modeled as exponential growth leading to the differential equation
where is the cumulative number of infections and is the growth rate. In the case of an unlimited supply of susceptible individuals it follows immediately that . Of course, in any real system, the number of susceptible individuals in finite. Hence, as the number of infections grows the rate will slow down and eventually the total number of infections will saturate. This can be modeled as
| (1) |
with the carrying capacity. The solution to eq. (1) is the Verhulst logistic curve Verhulst (1838)
| (2) |
with
and the initial infected population size and .
The logistic model has been used to model the COVID-19 pandemic by several research groups Jia et al. (2020); Yang et al. (2020); batista (2020); Wu et al. (2020); Vattay (2020); Dattoli et al. (2020a, b); Morais (2020); Kumar and Hembram (2020); Sonnino (2020); Tátrai and Várallyay (2020).
The goodness of fit for the logistic model and other models were studied for the China data in Jia et al. (2020); Yang et al. (2020); Wu et al. (2020). It was found that for China the logistic model underestimates the final number of infections Yang et al. (2020) and also that it does not predict the correct growth rates while still in the strong growth regime Sonnino (2020). A quality criterion to determine the goodness of expected number of infections was determined in Tátrai and Várallyay (2020). Data from Italy under the assumption of logistic growth was studied in Vattay (2020); Sonnino (2020); Morais (2020); Dattoli et al. (2020a, b).
The problem with the logistic model is that it assumes an exponential growth which is successively clamped off by the diminishing reservoir of people to be infected. Data analysis for the China data Ziff and Ziff (2020); Li et al. (2020) and for the top 25 affected countries Singer (2020) as well as additional studies for particular countries Manchein et al. (2020); Blasius (2020) have clearly shown, however, that by the introduction of lockdown measures and social distancing the growth phase is not exponential any more but follows a power law. The scaling exponents are country-specific and depend on the strictness of governmental interventions and the actual adherence of the people. The power law growth is connected with the actual societal structure that has been shown to exhibit small world or scale-free Watts and Strogatz (1998); Watts (2004) behavior. The spread of disease is determined by the number of human interactions and therefore limiting those will control the rate at which an infection can spread. After a short initial exponential growth period the institution of a lockdown reduces the possible spreading avenues: the number of infections as well as the number of recovered and deceased patients follows a power law
until a slow down of the rate of infection in noticeable due to a lack of susceptible hosts.
The reason why a power law growth is observed is as follows: Assuming a densely populated area like a major city or town each individual will during the course of a day have many different interactions with other people. Some of them will be with close relations, i.e. people that are important for the individual such as spouse, children, family, friends, or coworkers. Others, however will be random contacts when sharing the same space for example in public transport, shops, entertainment facilities etc. For the spreading of a disease the importance of the contact, whether or not it is close or random, is not relevant. The important thing, from the point of view of a virus, is close physical proximity. This might be given at the dinner table, in the office, riding a bus or train, or walking in the public park. In fact, on an average day the number of random contacts that satisfy the transmission criterion might well be much larger than the contacts an individual has with his close relations. Random contacts however are the central ingredient for an exponential growth. By instituting lockdown measures, social distancing and telling people to stay at home it is essentially possible – if properly followed – to eliminate all random contacts leaving only the close relations of family and work. It has been observed that the networks spanned by those relationships follow a power law behavior Watts and Strogatz (1998); Watts (2004). Since the virus has now only this network as means of spreading it follows that the number of infections will also show a power law dependence. In reality it is, of course, not possible to eliminate all random contacts (for example interactions in grocery shops), but so far the data shows that the stricter the lockdown measures are and the more people adhere to it the closer to a power low the rate of infections behaves.
Method
All data related to COVID-19 was downloaded from the publicly available JHU-CSSE (2020) data source provided continuously by the Johns Hopkins University Center for Systems Science and Engineering (JHU CSSE) CSSE . Aggregate data calculation for countries with different regions or states were performed after collecting by a simple summation over all associated regions or provinces (for the countries China, Australia, and Canada).
We have selected the data sets with the 25 most infections (and China) as presented in WHO on 2020-04-05 23:00 CET. The countries and their infection counts are given in Table 1.
In our previous publication Singer (2020) we have determined the scaling coefficients for each of the 25 most affected countries and compared the relative growth rates with each other. Since more data is available by now we have analyzed the local slopes of the presumed power law range in further detail. In a log-log representation vs. a power law becomes
Hence, the derivative is
We have calculated the discrete derivative (local slope)
over the available range and plotted it against the time to analyze the power law behavior over time. A power law behavior would exhibit regions of constant values, whereas monotonically increasing values would indicate exponential growth and decreasing values exponential slow down. This plot serves as an amplifier of the internal structures governing the growth rate to unveil changes that cannot be seen in a simple log-log representation of the data.
On data sets where we have found a significant downward trend of this slope (i.e. a slowdown of the growth rate) we have also performed two extrapolation methods in order to determine the presumed end of the infection in that particular country. In Fig. 1 the infection data for the Netherlands is plotted with a logistic equation fit.
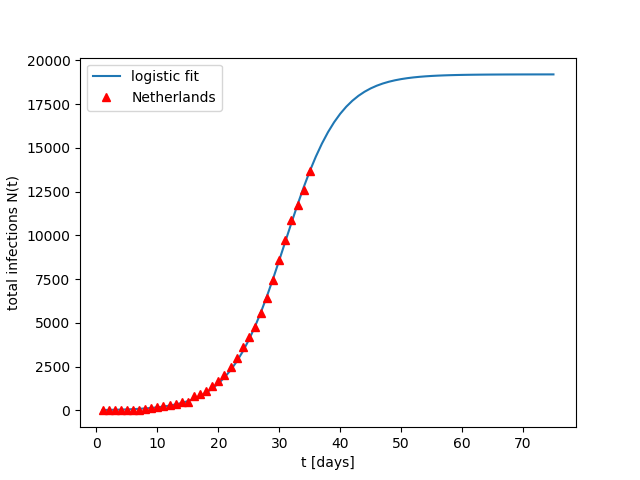
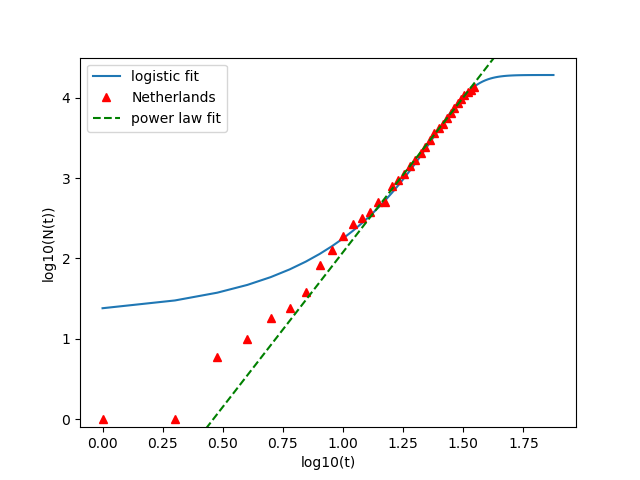
At first the glance the logistic equation fits the data well. However a closer examination in the log-log representation shows that the logistic equation fits the data only well closer to the saturation point when the growth rate is already substantially slowing down. The log-log representation of the total number of infections in the Netherlands together with the superimposed power law fit and the logistic fit are given in Fig. 2. It can be seen clearly that the data follows a power law behavior in most of the available data range and that the logistic fit is particularly bad in the beginning of the growth phase.
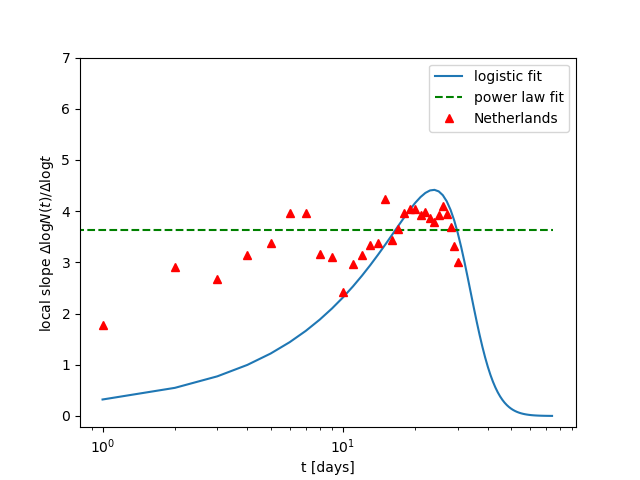
The local slope calculation is shown in Fig. 3 for the infection data in the Netherlands. The best fit for the logistic equation and the power law fit is superimposed. As can be seen clearly the local slope remains constant over nearly the whole data range and only the last three data points show a substantial decrease in the local slope and a close following of the logistic equation towards the saturation. It is also obvious that the local slopes do not correspond to what one would expect from a logistic curve. In the case of China it was observed that the closer to the saturation the data tended the better a fit to the logistic equation was found Jia et al. (2020); Yang et al. (2020); Wu et al. (2020); batista (2020).
The logistic extrapolation performs a non-linear fit to equation (2) and determines the parameters , , and by a non-linear least square calculation (Levenberg- Marquardt Levenberg (1944); Marquardt (1963)). Since by definition the final number of predicted infections is never reached we have chosen the time at which 95% of the final value is reached to be indicative for the end date. Therefore the extrapolated values for and are calculated.
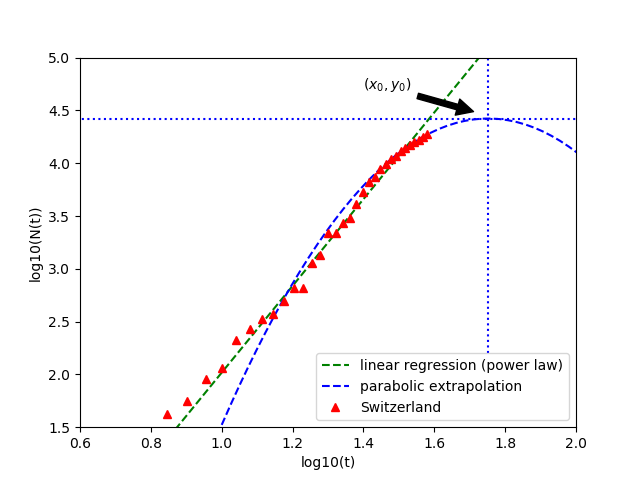
The parabolic fit Li et al. (2020) calculates a least square fit to an inverted parabola in the log-log plot . The extremal point determines the time when the full saturation has been reached and the total number of infections by:
and
An example of this extrapolation is given in Fig. 4 for the total number of infections in Switzerland. The extrapolated extremum is marked with an arrow.
In order to obtain a more accurate estimation we have performed the extrapolation calculations starting with the last 5 data points and extending the number of data points backwards up to the last 30 data points. If the predicted parameters and for the parabola fit and and for the logistic fit were plausible, that is and , then they were aggregated to an average value and and and respectively including their standard deviations.
It should be noted that the right part of the inverted parabola after the extremum does not have any physical significance.
Additionally the parabola fit is very sensitive to the data. If the data points show a temporary increase again the parabola might flip sides and will find the extremum on the left of the data with an that is smaller than the most recent data point or might flip such that it points upwards. In such cases an extrapolation was not possible. With respect to local deviations of the data towards the saturation the non-linear logistic fit is much more stable and will find reasonable fits also in situations where the parabolic fit fails.
Results
We have analyzed the local slope of all the countries given in Table 1. As indicated we have additionally performed extrapolations for the countries which showed a significant slowdown in their local slope plot. As of 2020-04-05 apart from China 20 of the top 25 countries showed signs of a slowdown in the rate of infections, the 5 remaining countries are still in a strong growth phase. We have calculated the scaling exponent for these countries and summarized them in Table 2.
| Country | #Infections (2020-04-05) | Slowdown |
|---|---|---|
| World | 1272115 | |
| US | 337072 | y |
| Spain | 131646 | y |
| Italy | 128948 | y |
| Germany | 100123 | y |
| France | 92839 | y |
| China | 82602 | y |
| Iran | 58226 | y |
| United Kingdom | 47806 | y |
| Turkey | 27069 | n |
| Switzerland | 21100 | y |
| Belgium | 19691 | y |
| Netherlands | 17851 | y |
| Canada | 15746 | n |
| Austria | 12051 | y |
| Portugal | 11278 | n |
| Brazil | 11130 | y |
| South Korea | 10237 | n |
| Israel | 8430 | y |
| Sweden | 6830 | n |
| Norway | 5687 | y |
| Australia | 5687 | y |
| Russia | 5389 | y |
| Ireland | 4994 | y |
| Czech Republic | 4587 | y |
| Chile | 4471 | n |
| Denmark | 4369 | n |
| Country | |
|---|---|
| Turkey | 4.90 |
| South Korea | 0.72 |
| Portugal | 4.61 |
| Sweden | 5.17 |
| Denmark | 1.64 |
While investigating the local slope of different countries we have noticed that not all follow them same growth behavior. We have identified 3 different growth patterns that show very different behaviors:
-
1.
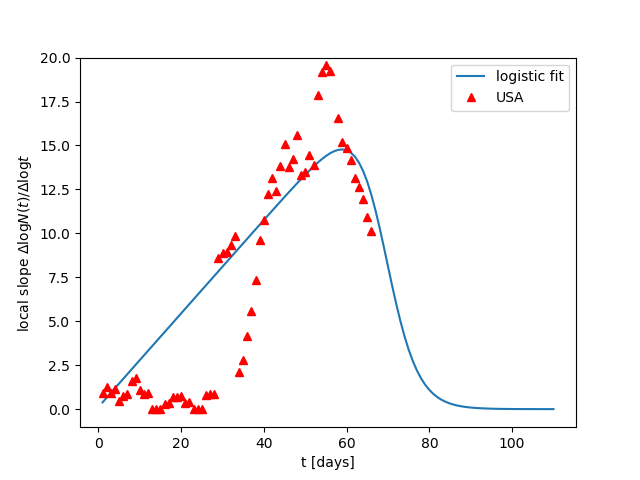
rise and fall pattern (exponential): the total number of infections stays very low for a long time and then suddenly shoots up dramatically and exponentially. After a short period of time it slows down equally rapidly with the rate of the slow down being exponential as well. Example countries are US, France, Canada, and Australia. A plot of such a behavior is shown in Fig. 5 for the USA.
-
2.
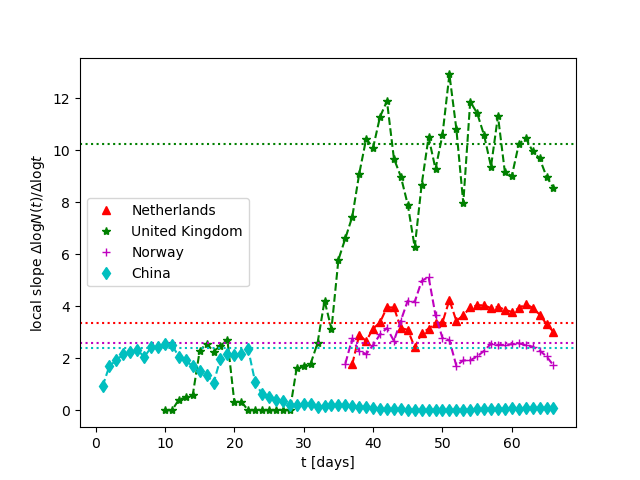
power law pattern: after an initial increase the growth becomes a power law and stays for most of the time there. Only at the end of the epidemic it slows down again and can be fitted by a logistic equation. Examples of countries with this behavior are China, the Netherlands, Norway, Czech Republic, Chile, and Russia. A plot of the power law behavior is given in Fig. 6 for a selection of different countries.
-
3.
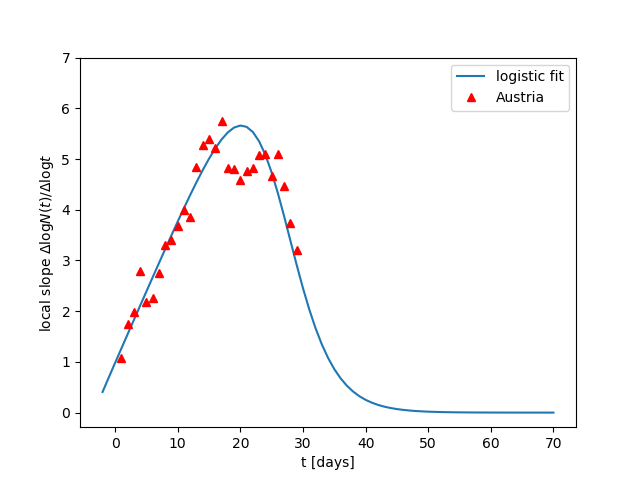
logistic pattern: the growth follows quite closely the shape of a logistic equation. Examples of countries are Austria, Switzerland, Ireland, and Israel. A plot of such a behavior is shown in Fig 7 for Austria.
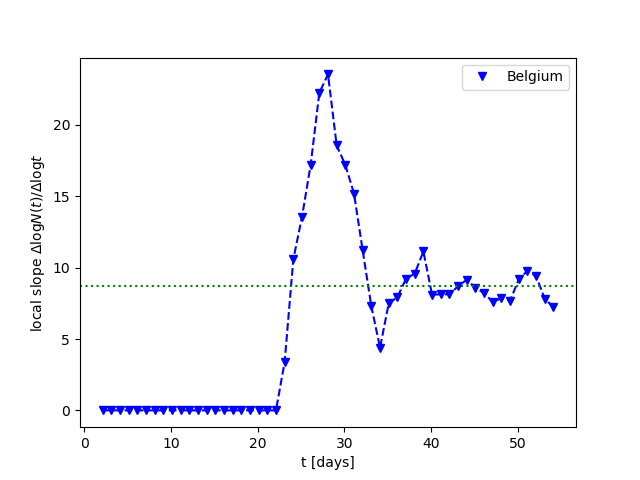
An interesting mixed case is found in the data for Belgium. It starts out as typical rise and fall pattern but then, due to stricter lockdown measures settles into a power law growth. This behavior is shown in Fig. 8. Perhaps the rise and fall pattern which we have discovered for various countries will eventually follow the same behavior as Belgium or perhaps the rise and fall pattern does move straight to the saturation. Currently it is too early to confirm either hypothesis.
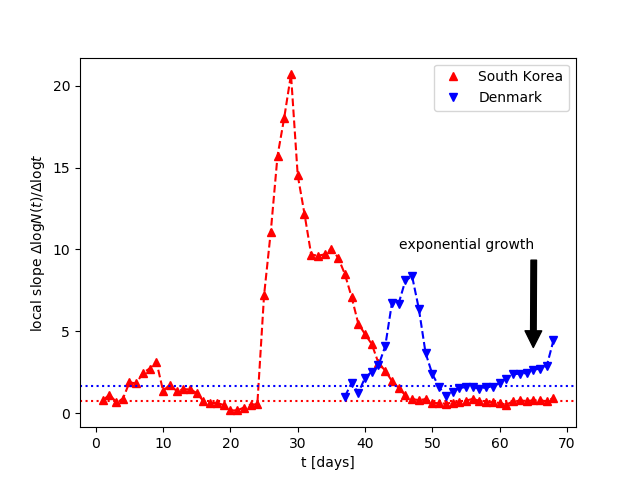
In Fig. 9 two countries showing exceptions to the patterns found in other countries are shown. First, South Korea, where through wide range testing and strict isolation of infected individuals the government has managed to reduce the explosive exponential growth down to a power low growth with an exceptionally low exponent of 0.72. And on the other hand Denmark, where early governmental measures proved effective and the exponential growth was reduced to a power law of 1.64 for a while only to start to grow exponentially again soon thereafter.
The extrapolated final number of infections for both extrapolations methods are shown in Fig. 10 for highly affected countries and Fig. 11 for lesser affected countries.
As can be seen the extrapolations generally predict the same order of magnitude apart from the US, France, Canada, and Russia. The variability of the extrapolated values depending on the considered number of points is larger for the parabolic extrapolation. In the majority of the considered data sets the parabolic extrapolations calculates larger final numbers of infections compared to the logistic fit.
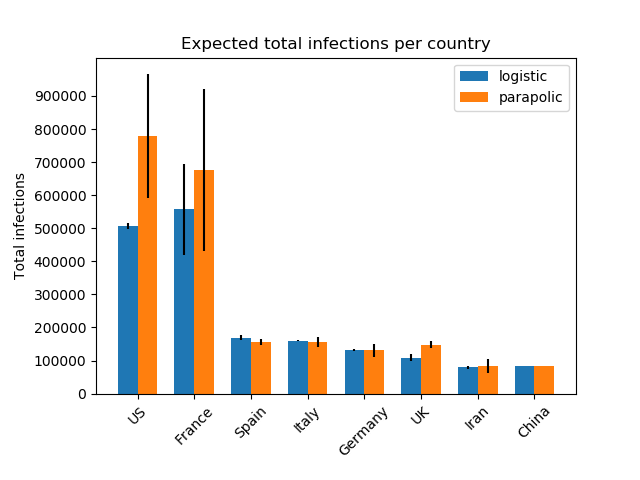
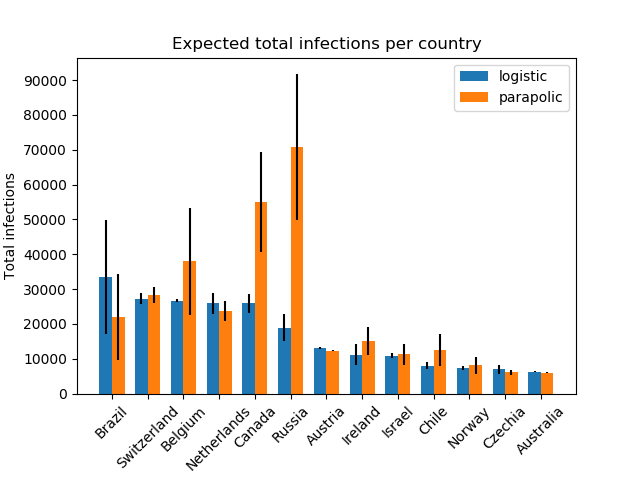
In Fig. 12 the current number of infections is plotted with the extrapolated estimates of different studies Tátrai and Várallyay (2020); Barmparis and Tsironis (2020). As can be seen the predicted final number of infections varies considerably. Generally, though, the extrapolations in this study seem closer to the values of Barmparis and Tsironis (2020) than to Tátrai and Várallyay (2020). Particularly for the UK and the Netherlands the values reported Tátrai and Várallyay (2020) deviate strongly from our calculations as well as those reported in Barmparis and Tsironis (2020). One outlier is our extrapolation for France. While calculations with earlier data have produced numbers in the order of 200’000-300’000 in line with the estimates of Tátrai and Várallyay (2020); Barmparis and Tsironis (2020) the latest data points have drastically changed the extrapolation. Whether this is a fluke or, indeed, a solid trend remains to be seen. In the case of the US the values reported in Tátrai and Várallyay (2020) are much lower than the one extrapolated in our study and the calculated values in Barmparis and Tsironis (2020) and are already overtaken by the current number of infections.

| Country | expect. date (log) | shape | % infected | |||||
|---|---|---|---|---|---|---|---|---|
| US | 2020-04-15 | exp | 0.04 | |||||
| France | 2020-05-10 | exp | 0.85 | |||||
| Spain | 2020-04-15 | power law | 6.18 | 0.36 | ||||
| Italy | 2020-04-18 | exp | 0.26 | |||||
| Germany | 2020-04-16 | power law | 11.45 | 0.16 | ||||
| United Kingdom | 2020-04-24 | power law | 9.69 | 0.16 | ||||
| Iran | 2020-04-19 | power law | 2.95 | 0.1 | ||||
| China | 2020-04-07 | power law | 2.48 | 0.01 | ||||
| Belgium | 2020-04-16 | exp/power law | 0.23 | |||||
| Russia | 2020-04-24 | power law | 11.04 | 0.01 | ||||
| Brazil | 2020-04-24 | exp/power law | 0.02 | |||||
| Switzerland | 2020-04-18 | logistic | 0.32 | |||||
| Netherlands | 2020-04-21 | power law | 3.51 | 0.15 | ||||
| Canada | 2020-04-18 | exp | 0.15 | |||||
| Austria | 2020-04-09 | logistic | 0.15 | |||||
| Israel | 2020-04-13 | logistic | 0.13 | |||||
| Australia | 2020-04-09 | exp | 0.02 | |||||
| Norway | 2020-04-19 | power law | 2.23 | 0.14 | ||||
| Ireland | 2020-04-28 | logistic | 0.23 | |||||
| Chile | 2020-04-22 | power law | 4.25 | 0.04 | ||||
| Czech Republic | 2020-04-20 | power law | 3.54 | 0.06 |
The numerical results of both extrapolation methods including the estimated date of saturation and the estimated percentage of people infected relative to the country’s population is given in Table 3. Additionally we have indicated the growth pattern (shape) of the analyzed data set and the scaling exponent where the local slope analysis showed a power law growth. It should be noted that the final date indicated corresponds to the time when 95% of the saturation value has been reached and not when no new cases will be reported (which in the case of the logistic curve happens only for ).
It is to be assumed, given the behavior of Belgium in Fig. 8 that predictions made for countries showing a rise and fall patterns are not accurate. The slowdown might be just part of the transition to a slower power law growth. Countries, however, that show a good logistic fit such as Switzerland, Austria and others (see Table 3) might prove to have quite an accurate prediction. Expected saturation numbers for countries showing a power law growth and subsequent slowdown would likely be less accurate than countries with logistic patterns but still more accurate and trustworthy than countries with a rise and fall pattern.
The same local slope analysis can be performed for the aggregated world wide total number of infections reported by the WHO in Fig. 13. As can bee seen the history of the disease spread is accurately recovered form the local slope plot. The beginning is marked by a power law growth in mainland China with the subsequent saturation and stop of further growth. At this point the number of infected people world wide picks up and the rate of infections is shown to grow strongly exponentially. The last few data points, however reveal a reversal of the growth trend to an exponential slow down. Currently 3 of the top 5 most affected countries (USA, France and Italy) show such as rise and fall exponential behavior and only Spain and Germany have shown a power law growth. Given that the USA has the strongest growth rate and highest number of infections totaling currently at about 25% of the world wide total number it is not surprising to see that the world data follows essentially the same behavior as the USA.
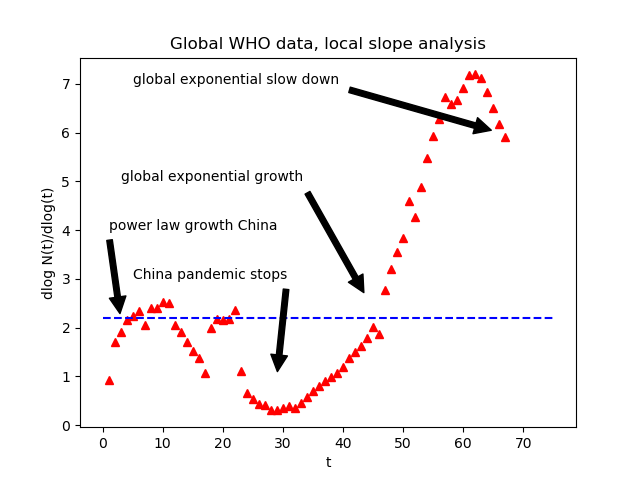
While, indeed, the last few data points indicate that the strong exponential growth is slowing down it cannot be predicted whether the subsequent period will stabilize in an power law growth or a rapid decay towards saturation for the world data as well as for the countries exhibiting the rise and fall growth pattern such as USA, France, and Italy.
Discussion & Conclusions
We have analyzed the top 25 most affected countries with the local slope analysis of the total number of infections and have found that different countries exhibit substantially different growth patterns. We have identified three different patterns: exponential rise and fall, power law, and logistic. For the countries following a power law growth we have determined the country-specific scaling exponent and summarized in Tables 2 and 3.
For countries that exhibit a clear slowdown in the rate at which the infections spreads we have extrapolated a tentative final number of infections by two different extrapolations methods: logistic and parabolic. While it has been shown that only few countries such as Austria and Switzerland actually follow a logistic growth behavior the extrapolation with the logistic curve was still justified for other countries since the fit closer to the saturation seems to become increasingly better Jia et al. (2020); Yang et al. (2020); Wu et al. (2020); batista (2020). We have used these extrapolation methods purely on numerical grounds and do not ascribe them the ability to actually explain the physical and biological reasons why the spread would saturate exactly at those given points. With few exceptions both extrapolations methods have calculated the same order of magnitude of final numbers of infections and also agree on the final date when this point will be reached (95% of ).
It should be noted that while we have selected only countries that showed a significant slowdown in the local slope plot this does not mean that the data really moves to a saturation. It might simply mean that the further growth will settle to a power law growth once the governmental measures and lockdowns have started to take effect. A slow down, thus, can mean that the growth has now been reduced to a power law when most if not all random encounters with other people have been eliminated. Only time will tell if this state of lockdown can be maintained long enough that a real saturation of total infections can be reached or if a second exponential wave will start upon relaxing the lockdown measures too early.
It can also simply mean that the data currently shows a downward trend just to pick up speed again a few days later as can be seen in the data for the USA at around day 50 (Fig. 5) and in data from Belgium at around day 33 (Fig. 8).
So far most extrapolations and predictions on the true extent of the global pandemic (excluding China) for example Barmparis and Tsironis (2020); Tátrai and Várallyay (2020) seem to have severely underestimated the final numbers of infections. So much so that the extrapolations of final numbers of infections of only a few days ago are already overtaken by the current number of infections. Also it has been found that the logistic fit generally seems to underestimate the final number of infections Yang et al. (2020). We do not expect the extrapolations in this study to fare any better. We believe, however, that the predictions for the countries that actually exhibit a logistic pattern such as Austria and Switzerland to be relatively accurate. Much less accurate but likely to be in the right order of magnitude are the countries exhibiting a power law pattern with a recent slowdown. The least accurate predictions and probably even underestimating the order of magnitude are the countries following an exponential rise and fall pattern.
Why then are the extrapolations so wrong? Firstly the calculations of the saturations are based on the fitting of some nonlinear function that determines its parameters based on the previous data points. As we have shown however there is hardly any evidence that for example the logistic model in eq. (1) describes the actual progression of the pandemic (with a few notable exceptions). Secondly, the physical and biological limit of possible infections is not reached by far. Current population infections are in the order of 0.2% of the total population and are expected by the extrapolations to stay below 1% (Table 3). That is far too little to effectively limit the spread by herd immunization or actual lack of susceptible individuals. Thirdly, most models do not take into account lockdown measures and interruption of disease spreading paths as instituted in many countries and therefore predict with the first slow down the beginning of the end of the pandemic. As shown in Fig. 8 for Belgium this is simply not true. Finally, one should not forget that power law growth, while not exponential, is still growth. And it will still take a long time to reach the point where an actual saturation has been achieved. So far, outside mainland China, the only country that has effectively managed to control the spread of the disease is South Korea. But even there the number of infections follows a power law with an extraordinarily low exponent of 0.7 (sub-linear growth) and no further slowdown seems to be in sight. Also it should be noted that even in China the pandemic is not over, it is just managed: every day China registers between 50 and 100 new cases. Reaching the saturation does not mean the end of the pandemic. Leaving those few remaining daily new cases uncontrolled and without strict isolation management, or easing the strict measures too early can lead to a second, perhaps more devastating wave. A cautionary example is Denmark that managed to reduce the initial exponential growth to a power law growth of 1.64 only to grow again exponentially soon thereafter (Fig. 9).
Therefore the predictions made should really only be taken as current extrapolations in the best case scenario that the current slowdown is actually an indication of a coming saturation and not just noise or transitions into a different growth patterns. The most likely outcome, however, is that the countries showing a rise and fall pattern are simply on the way to adjusting to a slower spread with a power law as has been shown in the case of Belgium (Fig. 8) but will not reach the saturation range any time soon.
Finally the analysis of the world wide spread of the infection shows that the trend of a slowdown is a reflection of the the biggest contributor, the USA currently contributing 25% of all cases. As long as the US is the largest contributor the world data is likely to behave in a similar way as the infections reported in the USA. One should, however, not neglect that the numbers of infections given in the world data are much less accurate than those reported by single countries. In particular countries with few medical facilities or the lacking ability to test for infections of the COVID-19 virus are bound to severely under-report the true extent of the pandemic. Therefore it can only be assumed that the actual number of infections is much higher and while the trend for individual countries, particularly in Europe and the USA might point towards a saturation many countries on other continents might not have the means to manage the spread of the disease. Due to the current low percentage of the infections relative to the population this might initiate a second wave of a global pandemic as soon as the strict lockdown measures are relaxed and travels into countries with less accurate reporting are allowed again.
Acknowledgements.
The author reports no funding related to this research and has no conflicting financial interests.References
- [1] WHO. Coronavirus covid-19 global cases by the center for systems science and engineering (csse) at johns hopkins university (jhu). URL https://www.arcgis.com/apps/opsdashboard/index.html#/bda7594740fd40299423467b48e9ecf6. Accessed on 2020-04-05 2:00 CET.
- Lai et al. [2020] Chih-Cheng Lai, Tzu-Ping Shih, Wen-Chien Ko, Hung-Jen Tang, and Po-Ren Hsueh. Severe acute respiratory syndrome coronavirus 2 (sars-cov-2) and coronavirus disease-2019 (covid-19): The epidemic and the challenges. International Journal of Antimicrobial Agents, 55(3):105924, 2020. ISSN 0924-8579. doi: https://doi.org/10.1016/j.ijantimicag.2020.105924. URL http://www.sciencedirect.com/science/article/pii/S0924857920300674.
- Smith [2006] Richard D. Smith. Responding to global infectious disease outbreaks: Lessons from sars on the role of risk perception, communication and management. Social Science & Medicine, 63(12):3113 – 3123, 2006. ISSN 0277-9536. doi: https://doi.org/10.1016/j.socscimed.2006.08.004. URL http://www.sciencedirect.com/science/article/pii/S0277953606004060.
- Vaillant et al. [2009] L Vaillant, G La Ruche, A Tarantola, P Barboza, and for the epidemic intelligence team at InVS. Epidemiology of fatal cases associated with pandemic h1n1 influenza 2009. Eurosurveillance, 14(33):19309, 2009. doi: https://doi.org/10.2807/ese.14.33.19309-en. URL https://www.eurosurveillance.org/content/10.2807/ese.14.33.19309-en.
- Jung et al. [2020] Sung-mok Jung, Andrei R. Akhmetzhanov, Katsuma Hayashi, Natalie M. Linton, Yichi Yang, Baoyin Yuan, Tetsuro Kobayashi, Ryo Kinoshita, and Hiroshi Nishiura. Real-time estimation of the risk of death from novel coronavirus (covid-19) infection: Inference using exported cases. Journal of Clinical Medicine, 9(2), 2020. ISSN 2077-0383. doi: 10.3390/jcm9020523. URL https://www.mdpi.com/2077-0383/9/2/523.
- Driggin et al. [2020] Elissa Driggin, Mahesh V. Madhavan, Behnood Bikdeli, Taylor Chuich, Justin Laracy, Giuseppe Bondi-Zoccai, Tyler S. Brown, Caroline Der Nigoghossian, David A. Zidar, Jennifer Haythe, Daniel Brodie, Joshua A. Beckman, Ajay J. Kirtane, Gregg W. Stone, Harlan M. Krumholz, and Sahil A. Parikh. Cardiovascular considerations for patients, health care workers, and health systems during the coronavirus disease 2019 (covid-19) pandemic. Journal of the American College of Cardiology, 2020. ISSN 0735-1097. doi: https://doi.org/10.1016/j.jacc.2020.03.031. URL http://www.sciencedirect.com/science/article/pii/S0735109720346374.
- Vardavas and Nikitara [2020] Constantine I. Vardavas and Katerina Nikitara. Covid-19 and smoking: A systematic review of the evidence. Tobacco Induced Diseases, 18(March), 2020. doi: 10.18332/tid/119324. URL http://dx.doi.org/10.18332/tid/119324.
- Verhulst [1838] Pierre-François Verhulst. Notice sur la loi que la population poursuit dans son accroissement. Corresp. Math. Phys., 10:113–121, 1838.
- Jia et al. [2020] Lin Jia, Kewen Li, Yu Jiang, Xin Guo, and Ting zhao. Prediction and analysis of coronavirus disease 2019. https://arxiv.org/abs/2003.05447, 2020.
- Yang et al. [2020] Wuyue Yang, Dongyan Zhang, Liangrong Peng, Changjing Zhuge, and Liu Hong. Rational evaluation of various epidemic models based on the covid-19 data of china. https://arxiv.org/abs/2003.05666, 2020.
- batista [2020] milan batista. Estimation of the final size of the covid-19 epidemic. medRxiv, 2020. doi: 10.1101/2020.02.16.20023606. URL https://www.medrxiv.org/content/early/2020/02/28/2020.02.16.20023606.
- Wu et al. [2020] Ke Wu, Didier Darcet, Qian Wang, and Didier Sornette. Generalized logistic growth modeling of the covid-19 outbreak in 29 provinces in china and in the rest of the world. https://arxiv.org/abs/2003.05681, 2020.
- Vattay [2020] Gabor Vattay. Predicting the ultimate outcome of the covid-19 outbreak in italy. https://arxiv.org/abs/2003.07912, 2020.
- Dattoli et al. [2020a] Giuseppe Dattoli, Emanuele Di Palma, Silvia Licciardi, and Elio Sabia. A note on the evolution of covid-19 in italy. https://arxiv.org/abs/2003.08684, 2020a.
- Dattoli et al. [2020b] Giuseppe Dattoli, Emanuele Di Palma, Silvia Licciardi, and Elio Sabia. On the evolution of covid-19 in italy: a follow up note. https://arxiv.org/abs/2003.12667, 2020b.
- Morais [2020] Apiano F. Morais. Logistic approximations used to describe new outbreaks in the 2020 covid-19 pandemic. https://arxiv.org/abs/2003.11149, 2020.
- Kumar and Hembram [2020] Jagadish Kumar and K. P. S. S. Hembram. Epidemiological study of novel coronavirus (covid-19). https://arxiv.org/abs/2003.11376, 2020.
- Sonnino [2020] Giorgio Sonnino. Dynamics of the covid-19 – comparison between the theoretical predictions and real data. https://arxiv.org/abs/2003.13540, 2020.
- Tátrai and Várallyay [2020] Dávid Tátrai and Zoltán Várallyay. Covid-19 epidemic outcome predictions based on logistic fitting and estimation of its reliability. https://arxiv.org/abs/2003.14160, 2020.
- Ziff and Ziff [2020] Anna L. Ziff and Robert M. Ziff. Fractal kinetics of covid-19 pandemic, 2020. URL https://www.medrxiv.org/content/early/2020/03/03/2020.02.16.20023820.
- Li et al. [2020] Ming Li, Jie Chen, and Youjin Deng. Scaling features in the spreading of covid-19. https://arxiv.org/abs/2002.09199, 2020.
- Singer [2020] H. M. Singer. Short-term predictions of country-specific covid-19 infection rates based on power law scaling exponents. https://arxiv.org/abs/2003.11997, 2020.
- Manchein et al. [2020] Cesar Manchein, Eduardo L. Brugnago, Rafael M. da Silva, Carlos F. O. Mendes, and Marcus W. Beims. Strong correlations between power-law growth of covid-19 in four continents and the inefficiency of soft quarantine strategies. https://arxiv.org/abs/2004.00044, 2020.
- Blasius [2020] Bernd Blasius. Power-law distribution in the number of confirmed covid-19 cases. https://arxiv.org/abs/2004.00940, 2020.
- Watts and Strogatz [1998] Duncan J. Watts and Steven H. Strogatz. Collective dynamics of ’small-world’ networks. Nature, 393(6684):440–442, 1998. ISSN 1476-4687. doi: 10.1038/30918. URL https://doi.org/10.1038/30918.
- Watts [2004] D.J. Watts. Small worlds: the dynamics of networks between order and randomness, Vol. 9. Princeton University Press, 2004.
- [27] JHU CSSE. Novel coronavirus (covid-19) cases. URL https://github.com/CSSEGISandData/COVID-19. Accessed on 2020-04-05 2:00 CET.
- Levenberg [1944] Kenneth Levenberg. A method for the solution of certain non-linear problems in least squares. Quarterly of Applied Mathematics, 2:164–168, 1944. doi: 10.1090/qam/10666. URL https://doi.org/10.1090/qam/10666.
- Marquardt [1963] Donald Marquardt. An algorithm for least-squares estimation of nonlinear parameters. SIAM Journal on Applied Mathematics, 11:431–441, 1963. doi: 10.1137/0111030.hdl:10338.dmlcz/104299. URL https://doi.org/10.1137/0111030.hdl:10338.dmlcz/104299.
- Barmparis and Tsironis [2020] G. D. Barmparis and G. P. Tsironis. Estimating the infection horizon of covid-19 in eight countries with a data-driven approach. https://arxiv.org/abs/2003.14334, 2020.